Embed Size (px)
Citation preview

GID5, 117–159, 2015
A wing pod-basedmillimeter
wavelength airbornecloud radar
J. Vivekanandan et al.
Title Page
Abstract Introduction
Conclusions References
Tables Figures
J I
J I
Back Close
Full Screen / Esc
Printer-friendly Version
Interactive Discussion
Discussion
Paper
|D
iscussionP
aper|
Discussion
Paper
|D
iscussionP
aper|
Geosci. Instrum. Method. Data Syst. Discuss., 5, 117–159, 2015www.geosci-instrum-method-data-syst-discuss.net/5/117/2015/doi:10.5194/gid-5-117-2015© Author(s) 2015. CC Attribution 3.0 License.
This discussion paper is/has been under review for the journal Geoscientific Instrumentation,Methods and Data Systems (GI). Please refer to the corresponding final paper in GI if available.
A wing pod-based millimeter wavelengthairborne cloud radarJ. Vivekanandan, S. Ellis, P. Tsai, E. Loew, W. C. Lee, J. Emmett, M. Dixon,C. Burghart, and S. Rauenbuehler
Earth Observing Laboratory National Canter for Atmospheric Research (NCAR),Boulder, CO, USA
Received: 23 January 2015 – Accepted: 10 March 2015 – Published: 14 April 2015
Correspondence to: J. Vivekanandan ([email protected])
Published by Copernicus Publications on behalf of the European Geosciences Union.
117

GID5, 117–159, 2015
A wing pod-basedmillimeter
wavelength airbornecloud radar
J. Vivekanandan et al.
Title Page
Abstract Introduction
Conclusions References
Tables Figures
J I
J I
Back Close
Full Screen / Esc
Printer-friendly Version
Interactive Discussion
Discussion
Paper
|D
iscussionP
aper|
Discussion
Paper
|D
iscussionP
aper|
Abstract
This paper describes a novel, airborne pod-based millimeter wavelength radar. Its fre-quency of operation is 94 GHz (3 mm wavelength). The radar has been designed tofly on the NCAR Gulfstream V HIAPER aircraft; however, it could be deployed onother similarly equipped aircraft. The pod-based configuration occupies minimum cabin5
space and maximizes scan coverage. The radar system is capable of collecting ob-servations in a staring mode between zenith and nadir or in a scanning mode. Stan-dard pulse-pair estimates of moments and raw time series of backscattered signals arerecorded. The radar system design and characteristics, as well as techniques for cal-ibrating reflectivity and correcting Doppler velocity for aircraft attitude and motion are10
described. The radar can alternatively be deployed in a ground-based configuration,housed in the 20 ft shipping container it shares with the High Spectral Resolution Lidar(HSRL). The radar was tested both on the ground and in flight. Preliminary measure-ments of Doppler and polarization measurements were collected and examples arepresented.15
1 Introduction
One attractive feature of millimeter (mm) wavelength radar systems is their ability todetect micron-sized particles that constitute liquid and ice clouds. Even though theupper limit of transmit power at millimeter wavelength band is more than 25 dB lowerthan at centimeter bands (S, C and X-bands), the larger backscatter cross section of20
particle sizes smaller than the wavelength (Rayleigh scattering) significantly improvesthe detection limit (Lhermitte, 1987, Clothiaux et al.,1995). The radar cross sectionat W-band is 40 dB larger than at X-band in the Rayleigh scattering regime. Anotheradvantage of mm wavelength radars for airborne deployments is that the radar antennais much smaller in size than the cm wavelength antenna for a specified angular beam25
resolution and the overall radar size is more compact. Therefore it is easier to achieve
118

GID5, 117–159, 2015
A wing pod-basedmillimeter
wavelength airbornecloud radar
J. Vivekanandan et al.
Title Page
Abstract Introduction
Conclusions References
Tables Figures
J I
J I
Back Close
Full Screen / Esc
Printer-friendly Version
Interactive Discussion
Discussion
Paper
|D
iscussionP
aper|
Discussion
Paper
|D
iscussionP
aper|
finer beam resolution < 1◦ and range resolution on the order of tens of meters. Lowersidelobes and larger signal-to-clutter ratio at mm wavelength band radars significantlyenhance their detection capability, in particular close to the radar (Kropfli and Kelly,1996). However, mm wavelength radar signals are more susceptible to attenuation. Theamount of attenuation is proportional to the intensity of the precipitation and gaseous5
absorption (Ellis and Vivekanandan, 2010, 2011). As a result, they are not suitable forobserving even moderate precipitation.
Due to the above described advantages of compact size, higher spatial resolu-tion, and enhanced sensitivity, scanning or vertically-pointing ground-based mm wave-length radars are used to study stratocumulus (Vali et al., 1998; Kollias and Albrecht10
2000), fair-weather cumulus (Kollias et al., 2000, 2001, 2002, 2007) and fog proper-ties (Hamazu et al., 2003). Airborne mm wavelength radars have been used for atmo-spheric remote sensing since the early 1990s (Pazmany et al., 1994; Horie et al., 2000;Hanesiak et al., 2010; Wolde and Vali, 2001a, b). Airborne cloud radar systems suchas the University of Wyoming King Air Cloud Radar (WCR) and the NASA ER-2 Cloud15
Resolving System (CRS) can observe clouds in remote regions and over the oceans(Li et al., 2004, WCR, 2012).
The scientific requirements of mm wavelength radar are mainly driven by climateand cloud process studies. Millimeter wavelength radar with dual-Doppler and dual-Polarization capability is highly desirable for the concurrent estimation of dynamical20
and microphysical properties of clouds and precipitation. A polarization Doppler radarwith dual-wavelength and dual-beams is capable of retrieving microphysical propertiesand two-dimensional winds.
In 2005, a survey of the cloud radar user community was conducted in order to as-sess needs and help guide the design of a mm wavelength radar on the National Sci-25
ence Foundation (NSF) Gulfstream V (GV), High-Performance Instrumented AirbornePlatform for Environmental Research (HIAPER) aircraft (Laursen et al., 2006), namedHIAPER Cloud Radar (HCR). Results of the survey indicated a common preferencefor narrow beam W-band radar with polarimetric and single Doppler capabilities with
119

GID5, 117–159, 2015
A wing pod-basedmillimeter
wavelength airbornecloud radar
J. Vivekanandan et al.
Title Page
Abstract Introduction
Conclusions References
Tables Figures
J I
J I
Back Close
Full Screen / Esc
Printer-friendly Version
Interactive Discussion
Discussion
Paper
|D
iscussionP
aper|
Discussion
Paper
|D
iscussionP
aper|
−40 dBZ sensitivity at 1 km range for airborne remote sensing of clouds. Additionaldesired capabilities included a second wavelength and/or dual-Doppler winds. Mod-ern radar technology offers various options: dual-beams, dual-polarization and dual-wavelength. Even though a basic Doppler radar system with a sensitivity of −30 dBZ iscapable of satisfying many common scientific needs, the above-mentioned additional5
options significantly extend the measurement capabilities and further reduce any un-certainty in radar-based retrievals of cloud properties (Brown et al., 1995). Since theprimary hardware requirements of the proposed HCR were that it be deployable onan airborne platform, uses minimal cabin space and maximize scan coverage, a pod-based configuration was adopted. However, the size of the wing-pod limited the fore10
and aft scanning capability making airborne dual-Doppler retrievals impossible.In order to complement the existing capabilities in the NSF Lower Atmospheric Ob-
serving Facility, the final configuration of the HCR will have Doppler, polarimetric anddual-wavelength capabilities with a beam scanning option. When the radar is not de-ployed on the airborne platform, it can be operated in a ground-based configuration.15
The HCR shares a single 20 foot shipping container with the NCAR High Spectral Res-olution Lidar (HSRL) for operations on the ground, providing collocated measurements.This provides the impetus for combined radar/lidar studies and retrievals of more ac-curate micro physical parameters, namely, mean particle size and precipitation amount(Donovan and Lammeren, 2001).20
A phased approach is used to build the HCR. Phase A consists of a pod mountedW-band Doppler radar with co- and cross-polarization measurements i.e. reflectivity(Z) and linear depolarization ratio (LDR). Pulse compression and differential reflectiv-ity (ZDR) capability are planned for phase B, and a second wavelength, solid state,matched beam Ka-band radar system is planned for phase C. In order to include these25
extensions the phase A system is designed to accommodate the phase B and C re-quirements to the extent possible. Phase A of the radar was ground-tested and flight-tested in spring 2013, fall 2013 and fall 2014.
120

GID5, 117–159, 2015
A wing pod-basedmillimeter
wavelength airbornecloud radar
J. Vivekanandan et al.
Title Page
Abstract Introduction
Conclusions References
Tables Figures
J I
J I
Back Close
Full Screen / Esc
Printer-friendly Version
Interactive Discussion
Discussion
Paper
|D
iscussionP
aper|
Discussion
Paper
|D
iscussionP
aper|
The goal of this paper is a system description of phase A of HCR including speci-fications, hardware and performance characteristics with example measurements. Tothis end, Sect. 2 describes the design concept of a pod-based radar system. Detailedradar block diagram and subsystem descriptions are presented in Sect. 3. Technicalspecifications of the HCR, expected sensitivity of the radar, spatial resolution of mea-5
surements, and measurement errors in velocity and reflectivity are described in Sect. 4.The calibration procedure for reflectivity, and the correction of Doppler velocity for air-craft platform motion are shown in Sect. 5. Examples of HCR measurements are shownin Sect. 6. Section 7 presents a summary.
2 Design Concept10
The HIAPER underwing pod is attached to the mid-hardpoint of the right wing as de-picted in Fig. 1. It is 20′′ inches (0.5 m) in diameter and 160′′ inches (4.1 m) in length.The total weight of the pod including instrumentation cannot exceed 800 lbs (360 kg).The HIAPER wing store instrumentation philosophy limits the available power, numberand type of connections that are available to equipment located on the wings. This15
necessitates that nearly the entire radar system be located within the pod; the radarcontrol and data display/archive computer, however, are mounted in a 19 inch aircraftrack in the main cabin for communication and controls to the radar system. The overallweight of the pod, including the radar, is 514 lbs (234 kg).
A pod-based system on a high altitude platform imposes engineering design chal-20
lenges in terms of the radar’s size, weight, and ability to handle pressure and tempera-ture extremes. The National Center for Atmospheric Research/Earth Observing Facility(NCAR/EOL) performed the mechanical design and fabrication. They also generatedthe necessary drawings and documentation for FAA certification of the structure; FAAcertification of all instrumentation is required for operation on the GV.25
Figure 2 shows the computer-aided design of HCR system layout interior to the pod.The layout shows the placements of inertial navigation system (C-MIGITS-III), a ro-
121

GID5, 117–159, 2015
A wing pod-basedmillimeter
wavelength airbornecloud radar
J. Vivekanandan et al.
Title Page
Abstract Introduction
Conclusions References
Tables Figures
J I
J I
Back Close
Full Screen / Esc
Printer-friendly Version
Interactive Discussion
Discussion
Paper
|D
iscussionP
aper|
Discussion
Paper
|D
iscussionP
aper|
tating reflector, a 12 inch lens antenna and a pressure vessel. The pod is not envi-ronmentally controlled. In order to ensure a stable radar operation under conditionsof temperature and pressure from sea level to 45 000 ft m.s.l., all radar electronics in-cluding the high voltage transmitter are housed in the pressure vessel. This pressurevessel is 60′′ in length and 15′′ in diameter and pressurized with dry nitrogen. To fur-5
ther mitigate potential arcing in the externally located waveguide and antenna feed, theantenna and associated waveguide are also pressurized through the pressure vessel.The 12 inch lens antenna illuminates a rotatable reflector plate that allows the cover-age of a 220◦ sector including zenith and nadir directions in the plane normal to thefuselage.10
3 Radar system description
This section provides brief descriptions of the various radar sub-systems of the HCRincluding the transmitter and transceiver, antenna and radome, and the data system.
3.1 Transmitter and transceiver
A block diagram of the radar transceiver is shown in Fig. 3. The HCR uses a conduction-15
cooled extended interaction klystron amplifier (EIKA) to amplify the signal for transmis-sion. The EIKA is similar to the one used in the CloudSat radar (Stephens et al., 2002).The EIKA, its modulator and the entire receiver electronics are housed in the pressurevessel. Since the modulator is rated for a maximum operating altitude 7000 ft m.s.l.,the pressure vessel must be maintained between 15 and 16 PSIA by a supplemental20
pressurization system. Both the EIKA and modulator are designed to operate at a 5 %duty cycle.
The HCR system transmits a single frequency pulse with a programmable pulsewidth that can range from 256 to 1024 ns (38.4 to 153.6 m range resolution) at a 10 kHzPRF. A dual-channel receiver is used for measuring co- and cross-polarization signals.25
122

GID5, 117–159, 2015
A wing pod-basedmillimeter
wavelength airbornecloud radar
J. Vivekanandan et al.
Title Page
Abstract Introduction
Conclusions References
Tables Figures
J I
J I
Back Close
Full Screen / Esc
Printer-friendly Version
Interactive Discussion
Discussion
Paper
|D
iscussionP
aper|
Discussion
Paper
|D
iscussionP
aper|
Each channel utilizes a two-stage super-heterodyne technique. The first stage interme-diate frequency is 156.25 MHz and the second stage is 1406.25 MHz. A 10 MHz GPSSTALO (stable local oscillator) is used as the system coherent source as well as theGPS location and time reference. All oscillators in the transceiver are phase locked to125 MHz, which is ultimately referenced to the 10 MHz GPS STALO.5
At the front-end, a network of ferrite switches are used to alternate the transmit po-larization and also achieve isolation between transmit and receive paths. Three ferriteswitches at the output of EIKA direct the transmit power between horizontal (H) andvertical (V ) polarizations to provide alternating polarization capability. Three cascadedferrite switches in front of the LNAs provide minimum of 75 dB isolation to the receivers10
during the transmission.A portion of the transmit signal is coupled through a 40 dB waveguide coupler, atten-
uated, and monitored by a crystal detector, as shown in blue in Fig. 3. A noise sourceis switched into the receiver’s path periodically to monitor fluctuations in the receivergain during operations (red path in Fig. 3). Due to the space limitation inside the pres-15
sure vessel, the noise source cannot be switched into both channels to monitor bothreceiver gains.
The phase B system will use pulse compression to increase the sensitivity of thesystem. To achieve low range-time sidelobes with a pulse compression system, thespectrum of the transmitted pulse is shaped. All of the receiver components for the20
phase A system are designed for greater than 20 MHz passband to accommodatepulse compression scheme. The sensitivity of the system is optimized to the pulselength used by digitally filtering the received signal to the desired signal bandwidthafter digitization.
3.2 Antenna and radome25
The dimensions of the pod limited the performance and capabilities of the HCR in twoways. First, the antenna aperture of the HCR is restricted to 12 inches. This apertureconstraint is necessary to avoid beam blockage by the pod’s internal support struc-
123

GID5, 117–159, 2015
A wing pod-basedmillimeter
wavelength airbornecloud radar
J. Vivekanandan et al.
Title Page
Abstract Introduction
Conclusions References
Tables Figures
J I
J I
Back Close
Full Screen / Esc
Printer-friendly Version
Interactive Discussion
Discussion
Paper
|D
iscussionP
aper|
Discussion
Paper
|D
iscussionP
aper|
ture as well as to enable zenith viewing through the use of a rotating reflector. Thislimits both the sensitivity and spatial resolution, as the gain of an antenna is directlyproportional to its aperture, while its beamwidth is inversely proportional to its aperture.
Part of the pod’s nose cone is constructed with millimeter wavelength radome mate-rial. The design of this nose cone radome satisfy the following key requirements: struc-5
tural robustness for aviation requirements, low loss at W- and Ka-bands, and electricalconductivity for preventing damages due to lightning strikes. One-way loss through theradome is expected to be ∼ 0.3 dB for W-band and ∼ 0.2 dB for Ka-band. The radomewill also distort the relative phases of the incident wavefront due to its curvature.
The relative merits of two types of suitable antenna were considered in designing10
the HCR: (a) parabolic reflector, including prime focus, Cassegrain and offset Gre-gorian, and (b) lens antennas. Planar arrays and their variants were not considereddue to their lack of fast switching polarization capability. Lens antennas at millimeterwavelength frequencies give superior performance in terms of peak sidelobe level andcross-pol isolation over all parabolic types with the possible exception of offset Gre-15
gorian. However, the complexity and required alignment precision of offset Gregorianantennas makes them less attractive in a pod based application where vibration andwide temperature variations exist. Although lens antennas are generally heavier andhave larger focal length to diameter ratios than parabolic antennas, there is sufficientspace and weight handling capability in the pod to accommodate the lens antenna. The20
co- and cross-pol antenna patterns are shown in Fig. 4. The first sidelobe is ∼ −20 dBand cross polarization lower than 40 dB at the bore sight.
A 45◦ slanted rotating reflector plate in front of the antenna is used to steer the beamto meet angular coverage requirements. The reflector plate is constructed of aircraftgrade aluminum, machined to a flatness of 0.005′′ root mean square (rms). The small25
rms value helps to maintain polarization purity of transmit and receive signals. Precisepositioning of the plate relative to the antenna is required to avoid beam distortion,and spillover. A brushless DC motor coupled with an optical shaft encoder is used torotate the plate. A similar, but smaller motor is used to adjust the tilt of the reflector.
124

GID5, 117–159, 2015
A wing pod-basedmillimeter
wavelength airbornecloud radar
J. Vivekanandan et al.
Title Page
Abstract Introduction
Conclusions References
Tables Figures
J I
J I
Back Close
Full Screen / Esc
Printer-friendly Version
Interactive Discussion
Discussion
Paper
|D
iscussionP
aper|
Discussion
Paper
|D
iscussionP
aper|
The motors are programed to rotate from −10◦ from Zenith (toward the fuselage) to210◦ (30◦ from nadir) perpendicular to along track direction and from −6 to +6◦ in thetilt axis. The tilt axis adjustment compensates for the aircraft pitch. Both rotation andtilt are controlled in real-time to compensate for platform motion to minimize the biasof aircraft motion into the velocities. A CMIGITS-III inertial reference unit mounted in5
the nose cone, just 12 inches forward of the reflector, provides the necessary spatialreference and minimizes the moment arm. A consequence of using a reflector plate isthat the polarization of the transmitted waveform changes as the reflector plate rotates.A rotational transformation will be used to recover intrinsic polarization state of thereceived signal (Vivekanandan et al., 1990).10
3.3 Data system
HCR places some unique requirements on data system characteristics such as size,weight and environmental factors. Radar control, preliminary signal processing anddata display and archiving are handled by a computer located on a 19 inch rackmounted in the aircraft cabin, while radar timing, real-time data acquisition and house-15
keeping are handled by a data system located in the pod. Housekeeping structureconsists of system status, GPS time, antenna angle, and aircraft attitude. The cabinand pod data systems are linked by a fiber optic, gigabit network connection. Theseconnections relay radar control commands from the cabin as well as digital time seriesdata, housekeeping and status from the pod.20
The received signal is digitized at the rate of 125 MHz. Both in-phase and quadraturedata are archived in HCR. Standard moment products such as reflectivity, Doppler ve-locity and spectrum width are provided in CfRadial format (www.eol.ucar.edu/content/standard-data-formats). The moment products are processed and displayed in real-time on the archiving computer in the cabin. Data rates for the phase A system are25
∼ 70 Mbytess−1. This is handled by a single gigabit Ethernet connection coupled toa 24 Terabyte redundant array of disks (RAID). Data are simultaneously written to the
125

GID5, 117–159, 2015
A wing pod-basedmillimeter
wavelength airbornecloud radar
J. Vivekanandan et al.
Title Page
Abstract Introduction
Conclusions References
Tables Figures
J I
J I
Back Close
Full Screen / Esc
Printer-friendly Version
Interactive Discussion
Discussion
Paper
|D
iscussionP
aper|
Discussion
Paper
|D
iscussionP
aper|
RAID and two removable external USB3 drives. The USB3 drives offer quick access todata after completion of the research flight.
All HCR data are archived on the NCAR High Performance Storage System (HPSS),a state-of-the-art Data Center storage facility. Data are available in a CfRadial formatand EOL provides basic tools to access those data. EOL supports basic software for5
display of radar data, editing of radar fields, and derivation of several value-addedproducts.
4 Performance characteristics of the HCR
An overview of the performance characteristics achieved by the design of HCR de-scribed in Sect. 3 is presented here. For ease of reference some of the important10
system parameters and performance characteristics under typical operations for HCRare listed in Table 1.
4.1 Measurement accuracy of mean velocity and reflectivity
The measurement accuracy of Doppler radial velocity and reflectivity are a functionof time-to-independence (TD), PRF, and signal-to-noise ratio (SNR) (Doviak and Zr-15
nic, 1993). Time-to-independence determines the interval between two radar mea-surements that are statistically independent. It is a function of transmit frequency andspectrum width (Bringi and Chandrasekar, 2001). In the case of W-band, TD is smallerthan the corresponding value of cm wavelength radars. As a result, more independentsamples are collected at W-band for a specified dwell time and Doppler spectrum width20
as compared to larger wavelengths such as S, C, and X-bands.Figure 5 shows the number of independent samples required as a function of signal-
to-noise ratio (SNR) for various accuracy values of measured mean radial velocity atW-band. For 10 independent samples, an SNR of 3.5 dB is required for estimating radialvelocity within 0.2 ms−1 accuracy. Since TD at W-band is smaller than at cm-band, more25
126

GID5, 117–159, 2015
A wing pod-basedmillimeter
wavelength airbornecloud radar
J. Vivekanandan et al.
Title Page
Abstract Introduction
Conclusions References
Tables Figures
J I
J I
Back Close
Full Screen / Esc
Printer-friendly Version
Interactive Discussion
Discussion
Paper
|D
iscussionP
aper|
Discussion
Paper
|D
iscussionP
aper|
accurate estimates of mean velocity can be achieved in a shorter dwell time interval.Therefore, the HCR offers finer spatial resolution and more accurate radial velocity thana cm-wavelength band airborne radar.
The standard error in HCR reflectivity as a function of Doppler spectrum width andnumber of samples is shown in Fig. 6 (Bringi and Chandrasekar, 2001). Since the5
number of independent samples increase as spectrum width increases, standard errorreduces for a specified number of samples at higher spectral widths. As PRF of HCRis 10 kHz, averaging 1000 samples or 0.1 s time-average reduces the standard error ofreflectivity to less than 0.5 dB.
4.2 Sensitivity and spatial resolution10
For the technical specifications listed in Table 1, Fig. 7 shows the sensitivity of theHCR as a function of range for a single pulse-pair measurement. The curves shown inthe figure take into account radome attenuation, and receiver filter loss. The sensitivityof the HCR can be enhanced by increasing the transmit pulse width and by perform-ing noise subtraction and temporal averaging of the received sample power. Since the15
transmit pulse width can be varied between 0.256 and 1.024 µs, the sensitivity of theradar can be enhanced by a transmitting longer pulse at the expense of range reso-lution. For example, a factor of two coarser in range resolution improves sensitivity by6 dB as shown in Fig. 7. Averaging over 0.1 s and noise subtraction improves the mini-mum reflectivity by 8 dB. In summary, HCR sensitivity is −41.4 dBZ at 1 km for a 0.5 µs20
transmit pulse width when the received signal is corrected for noise and are averagedover 0.1 s.
Pulse-pair estimates are averaged over a time interval to reduce fluctuations in theDoppler moment estimates, namely, reflectivity, mean velocity and spectrum width. Fig-ure 8 shows the total number of samples verses along track resolution for a specified25
aircraft speed and PRF. For 0.1 s or 1000 sample averaging, along track resolution is20 m.
127

GID5, 117–159, 2015
A wing pod-basedmillimeter
wavelength airbornecloud radar
J. Vivekanandan et al.
Title Page
Abstract Introduction
Conclusions References
Tables Figures
J I
J I
Back Close
Full Screen / Esc
Printer-friendly Version
Interactive Discussion
Discussion
Paper
|D
iscussionP
aper|
Discussion
Paper
|D
iscussionP
aper|
Since the PRF is 10 kHz, around 100 statistically independent samples can be ob-tained from clouds with Doppler spectrum width > 0.4 ms−1. It should be noted, thenumber of independent samples is determined by the dwell time of the beam, which isprimarily determined by aircraft speed and Doppler spectrum width of the cloud.
5 Data quality assurance5
5.1 Radar system calibration
Obtaining an accurate system calibration is essential for HCR’s scientific missions.Calibration schemes are broadly divided into two categories: internal calibration andexternal calibration. Internal calibration methods include measurements using a noisesource, calibrated test signal source. External calibration methods include measure-10
ments of a corner reflector cross section, backscatter measurements from light precip-itation and reflection from the ocean surface.
5.1.1 Internal calibration
Figure 3 shows two internal calibration paths of HCR. The transmit signal is coupledfrom its path and monitored on a pulse by pulse basis by a W-band detector (path col-15
ored blue). A known noise source is injected into the receiver path to monitor receivergain (path colored red). The noise source is switched on to track differential changes inthe receiver gain during operation as the receiver gain fluctuates with ambient temper-ature. The advantage of noise source is its stable performance of better than 0.004 dBas the ambient temperature varies over 30◦. The stable noise source reference allows20
robust monitoring of the receiver calibration. Due to the limited space in the pressurevessel, the noise source calibration method is configured only for the vertical polari-metric channel. The gain of the horizontal polarimetric channel can be estimated fromthe physical temperature of the low noise amplifier in conjunction with the known gainof the calibrated vertical polarimetric channel.25
128

GID5, 117–159, 2015
A wing pod-basedmillimeter
wavelength airbornecloud radar
J. Vivekanandan et al.
Title Page
Abstract Introduction
Conclusions References
Tables Figures
J I
J I
Back Close
Full Screen / Esc
Printer-friendly Version
Interactive Discussion
Discussion
Paper
|D
iscussionP
aper|
Discussion
Paper
|D
iscussionP
aper|
5.1.2 External calibration using measurements from light rain
Since the reflectivity remains similar for a wide range of rain rates, observations fromlight rain can be used for verifying the W-band reflectivity (Hogan et al., 2003). At W-band, attenuation and Mie scattering dominate scattering from particle sizes > 0.3 mm.The combination of Mie scattering and attenuation effects causes W-band reflectivity5
measurements at near ranges to saturate (Hogan et al., 2003). Electromagnetic scat-tering and wave propagation models can be used for quantifying reflectivities of lightrain (Vivekanandan et al., 1991). The computation of reflectivity requires the specifica-tion of raindrop size distribution parameters. Raindrop size distribution parameters arevaried over their natural variations (Ulbrich, 1983). Figure 9a–c shows histograms of10
computed rain rate, median volume diameters and number concentration parametersfor rain rates between 5 and 20 mmh−1. For these parameters of raindrop size distri-butions, reflectivity values were calculated using scattering amplitudes (Vivekanandanet al., 1991). Particle shapes were assumed spherical since differential reflectivity forrain at W-band is less than 0.5 dB. The modeled reflectivity values at 200 m distance15
from the radar are shown in Fig. 9d. The mean value of the modeled reflectivity is19.0 dBZ and SD is 0.5 dB.
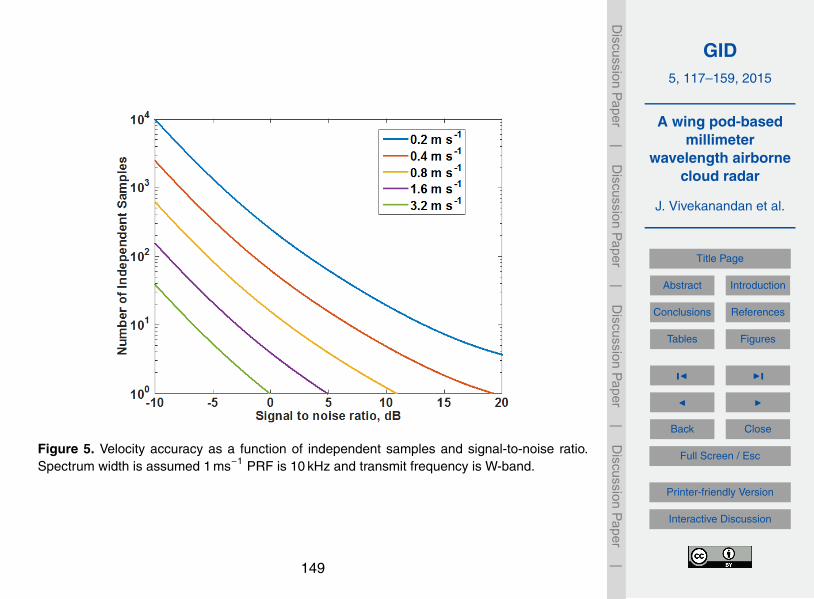
Figure 10a–c shows ground-based HCR reflectivity, radial velocity and linear depo-larization measurements in rain rates between 5 and 10 mmh−1 for fixed beam pointingas a function of time. The measurements were taken on 8 September 2014 around20
21:40 UTC. The radar beam was fixed at 30 elevation from horizontal. The reflectiv-ity structure shows frozen precipitation at the top layer, aggregation in the mid-layerand light rain below 400 ma.g.l. Increased radial velocity and a strong gradient in LDRstructure shows the melting level is around 0.5 kma.g.l. A canopy was used for keepingthe radome dry during the rain event. A wet radome attenuates radar signals and will25
introduce a large uncertainty in reflectivity measurements (Hogan et al., 2003).A histogram of reflectivity at 250 m range is shown in Fig. 10d. The mean value of
measured reflectivity is 17.5 dB. This value is 1.5 dB lower than the expected value
129

GID5, 117–159, 2015
A wing pod-basedmillimeter
wavelength airbornecloud radar
J. Vivekanandan et al.
Title Page
Abstract Introduction
Conclusions References
Tables Figures
J I
J I
Back Close
Full Screen / Esc
Printer-friendly Version
Interactive Discussion
Discussion
Paper
|D
iscussionP
aper|
Discussion
Paper
|D
iscussionP
aper|
shown in Fig. 9d. Comparison between measured and modeled reflectivity values indi-cate the measured HCR reflectivity should be increased by 1.5 dB. This result will beverified independently using measurements from a corner reflector and water surfacein the future.
5.2 Correction for platform motion5
In order to obtain sufficient precision and accuracy of Doppler velocity measurementsfor the types of studies for which the HCR is designed, it is necessary to correct forthe platform motion (Lee et al., 1994; Testud et al., 1995; Durden et al., 1999; Bosartet al., 2002; Haimov and Rodi 2013). Global Position Satellite/Inertial Navigation Sys-tem (GPS/INS) measurements in the HCR pod are made in order to facilitate correc-10
tion for the platform motion. The strategy for the HCR is two-fold. First, during flightthe pointing angle of the reflector (i.e. radar beam) is actively corrected for changes inthe pod attitude using the real-time navigation data. There is a small time lag in thereal-time pointing angle correction, which may result in small errors in reflector point-ing angle. Second, the final data set is generated with the aircraft motion corrected in15
post-analysis removing any time lag between the navigation data and the radar data.This section describes the navigation data, the real-time pointing angle correction ofthe reflector and the final aircraft attitude correction procedure.
5.2.1 Navigation measurements
The C-MIGITS III GPS/INS system, manufactured by Systron Donner Inertial, is used20
for platform attitude and motion measurements. The dimensions are approximately81mm×90mm×145.5 mm, the weight is 1.1 kg and the data rate is 100 Hz. Its com-pact size makes the C-MIGITS III a good choice because it fits easily in the HCR pod.One advantage of having the GPS/INS system in the pod over using the aircraft sys-tem is that the moment arm of between the GPS/INS measurement and the reflector is25
small, significantly simplifying the navigation correction computations. Another advan-
130

GID5, 117–159, 2015
A wing pod-basedmillimeter
wavelength airbornecloud radar
J. Vivekanandan et al.
Title Page
Abstract Introduction
Conclusions References
Tables Figures
J I
J I
Back Close
Full Screen / Esc
Printer-friendly Version
Interactive Discussion
Discussion
Paper
|D
iscussionP
aper|
Discussion
Paper
|D
iscussionP
aper|
tage is that the C-MIGITS III directly measures the motion of the pod including wingand pod flexing that are not measured by the aircraft navigation system. Using navi-gation measurements from the fuselage would result in the independent motions fromwing and pod flexing being unknown and uncorrectable errors in Doppler velocity.
5.2.2 Real-time pointing stabilization5
When the HCR beam is in staring mode, the reflector can be adaptively corrected forplatform motion in real-time using the C-MIGITS III output. This physical stabilizationof the beam is important when staring at nadir or zenith to minimize the errors fromunknown horizontal winds at heights different than the flight level. As an example ofthese errors, imagine the HCR beam was in nadir pointing mode in order to make10
measurements in the vertical, but due to platform motion was off by 2◦ from vertical. Ifat some range the beam encounters a horizontal wind of 30 ms−1, the projection of thiswind velocity into the beam will be up to about 1 ms−1, a large error in vertical radialvelocity measurements. Since this wind is typically unknown, these errors cannot becorrected reliably.15
The reflector can be corrected fore and aft up to 6◦ in each direction. Since the re-flector can scan in the cross-track direction, the pointing correction is adequate exceptin steep banking turns. The reflector pointing position is updated at a rate of 20 Hz.This means that there is a 0.05 s latency in the reflector position correction in real-time.Further, there may be a small offset between the requested pointing angle and what20
is actually achieved. This offset is typically less than 0.1◦. Therefore, final correction ofthe platform motion must be performed using the navigation data and the measuredposition of the HCR reflector.
5.2.3 Final navigation correction
Many investigators have developed methods to correct airborne Doppler radar velocity25
measurements for platform motion. This requires both accurate platform motion mea-
131

GID5, 117–159, 2015
A wing pod-basedmillimeter
wavelength airbornecloud radar
J. Vivekanandan et al.
Title Page
Abstract Introduction
Conclusions References
Tables Figures
J I
J I
Back Close
Full Screen / Esc
Printer-friendly Version
Interactive Discussion
Discussion
Paper
|D
iscussionP
aper|
Discussion
Paper
|D
iscussionP
aper|
surements and accurate beam pointing. Lee et al. (1994) derived a comprehensiveradar coordinate transformation and expression for measured Doppler velocity includ-ing components from platform motion and particle motion (wind plus fall speed). Theformulation of Lee et al. (1994) was general enough to be used on different radar plat-forms and it assumed accurate pointing angles. Haimov and Rodi (2013) propose a set5
of flight maneuvers to use for calibrating the pointing angle measurements. They showthat the pointing angle calibration is consistent for a deployment such that the proce-dure does not need to be repeated for each flight, only after each radar installation onthe aircraft. Once the pointing angle is calibrated the measured Doppler velocity caneasily be corrected with geometric calculations.10
For the HCR, the approach of Haimov and Rodi (2013) is first utilized for calibratingthe HCR pointing angle and then the platform motion correction is accomplished asdefined in Lee et al. (1994) using the Earth relative coordinates (their Eq. 15).
After correcting for the platform motion, the ground echoes should have a radialvelocity of 0 ms−1, so the residual Vr represents the errors due to pointing angle offsets15
combined with errors in vertical motion of the platform measured by the C-MIGITS IIIand the measurement variance of Vr.
The pointing angle calibration and platform motion correction procedure were testedduring in the fall of 2013. The calibration flight legs to determine the pointing calibrationwere flown on 17 September 2013 and the correction to the pointing angle applied for20
the entire project. The measured Vr of ground echoes on subsequent days was ana-lyzed. For example, at nadir pointing the mean and SD of the corrected Vr in groundecho over a 10 min period on 3 October were found to be 0.001 and 0.086 ms−1 re-spectively. An example of 1 min of corrected Vr within the ground echo is shown inFig. 11.25
Even though the nominal data rate for the HCR data is 10 Hz, the 100 Hz navigationdata is used to correct for platform motion. This is to resolve and correct as much highfrequency platform motion due to turbulence as possible. Thus, the HCR moments arecomputed at 100 Hz using the full resolution navigation data, and then the data are av-
132

GID5, 117–159, 2015
A wing pod-basedmillimeter
wavelength airbornecloud radar
J. Vivekanandan et al.
Title Page
Abstract Introduction
Conclusions References
Tables Figures
J I
J I
Back Close
Full Screen / Esc
Printer-friendly Version
Interactive Discussion
Discussion
Paper
|D
iscussionP
aper|
Discussion
Paper
|D
iscussionP
aper|
eraged to the more practical 10 Hz nominal time resolution, or any other user-specifiedtemporal resolution. Since HCR nominally runs with a pulse repetition frequency of10 000 Hz there are 100 samples to compute the moments at 100 Hz, which is suffi-cient for platform motion correction. This strategy reduces the radial errors in SW andVr that occur if the platform accelerates at a time scale shorter than the resolution of5
the navigation data.
6 Measurement examples
The radar is capable of estimating winds and microphysics to a range of 15 km rangewith 19.2 m gate spacing. The HCR can be operated in scanning and staring modes fordetecting cloud boundaries, cloud liquid and ice and also for estimating radial winds.10
Along track resolution is nominally about 60 m. There is a real-time, on-board display ofthe HCR measurements. Its capability to serve as a surveillance radar is very limited,as attenuation, and Mie scattering at the W-band frequency would limit maximum de-tectable reflectivity to about 30 dBZ. The dynamic range of HCR reflectivity is between−40 and 30 dBZ. Reflectivity can be estimated within ±0.5 dB accuracy. In weakly and15
non-precipitating conditions, ice and liquid water content amounts can be estimatedfrom reflectivity measurements.
The HCR will participate in its first field deployment in the summer of 2015. Theproject is named CSET (Cloud System Evolution in the Trades) and aims to study thecharacteristics and evolution of stratocumulus clouds over the eastern Pacific Ocean.20
In preparation for the inaugural HCR project, data have been collected during two testflight campaigns as well as in the ground-based configuration. The motivation for thedata collection was primarily engineering tests of calibration, reliability, and platformmotion correction. Also, being developed are real-time displays onboard the aircraftand analysis tools for post-processing display of the HCR moment and Doppler spec-25
tral data. During research flights the HCR operator will be able to monitor system per-formance and real-time data display. Summary images will be automatically generated
133

GID5, 117–159, 2015
A wing pod-basedmillimeter
wavelength airbornecloud radar
J. Vivekanandan et al.
Title Page
Abstract Introduction
Conclusions References
Tables Figures
J I
J I
Back Close
Full Screen / Esc
Printer-friendly Version
Interactive Discussion
Discussion
Paper
|D
iscussionP
aper|
Discussion
Paper
|D
iscussionP
aper|
at user-specified time intervals and can be sent to a land-based operations center viathe GV communications system. Therefore scientists on the ground and in the aircraftcan coordinate (via internet chat) during the mission.
Even though there was no particular phenomenon being studied during HCR testing,several interesting data sets have been collected in different weather conditions. These5
data illustrate the capability and measurement potential of the HCR. Examples of thesedata sets are shown in this section.
6.1 Airborne data
6.1.1 Winter precipitation with convective features
Figure 12 shows B-scan plots of Ze, and Vr (corrected for platform motion) collected by10
HCR on the GV looking nadir on 23 February 2013 at 02:11 UTC during an upslopesnow event along the Front Range of Colorado. Shown is one minute of data and thevertical axis indicates altitude above mean sea level (m.s.l.) and the horizontal axisshows the horizontal distance the GV flew during the minute. The ground echo can beseen as the high reflectivity (black) with 0 ms−1 Vr at about the 1.7 km m.s.l. As per the15
standard convention receding wind from radar has positive sign and approaching windtoward radar has negative sign. The 00:00 UTC Denver sounding from the NationalWeather Service (not shown) indicated the surface temperature was only slightly above0 ◦C and decreased rapidly with height to about −35 ◦C at 7 km m.s.l. Two distinct cloudlayers were detected by HCR at this time. Small scale (< 1 km) convective features are20
seen at the top of the echo layer between roughly 6 and 7 km m.s.l. The wind at thislevel was Northwesterly at about 25 kts according to the sounding and the plane wasflying towards the Southwest. The base of the cloud undulates up and down along thehorizontal at a scale that is larger than the convective features on top. This layer showsdistinct regions of receding, or downward, (positive Vr) and approaching, or upward,25
(negative Vr) velocity measurements. The largest positive Vr is over 1 ms−1 and thelargest negative Vr is about 0.8 ms−1. The measured Vr is a combination of the fallspeed
134

GID5, 117–159, 2015
A wing pod-basedmillimeter
wavelength airbornecloud radar
J. Vivekanandan et al.
Title Page
Abstract Introduction
Conclusions References
Tables Figures
J I
J I
Back Close
Full Screen / Esc
Printer-friendly Version
Interactive Discussion
Discussion
Paper
|D
iscussionP
aper|
Discussion
Paper
|D
iscussionP
aper|
of the particles and the air motion, so the upward Vr measurements indicate vertical airmotion and the pattern of alternating up and downward motion is indicative of waves.The lower layer shown in Fig. 13 is observed to be about 2 km thick and is a result ofEasterly upslope flow evident on the Denver sounding. Many fine-scale features areseen in the Ze and Vr fields in the lower level.5
6.1.2 Stratiform rain and drizzle
Figure 13 shows B-scan displays of Ze, Vr (platform motion corrected), and also cor-rected SW. The data were collected by HCR pointing nadir from the GV on 11 Octo-ber 2013 at 19:26 UTC. Again one minute of data is shown and the horizontal axisdesignates the distance the aircraft travelled in that time. The weather is a stratiform10
rain and drizzle case. The echo in the low levels is about 3 km thick. The melting layeris apparent at just below 2 km m.s.l. and is indicted by an increase in the Ze, Vr andSW. The increase in Ze is due to the increase in the refractive index of liquid oversnow and ice crystals. As the ice melts the density increases and thus so does thefallspeed, resulting in the increase of Vr. The increase of SW below the melting layer is15
due, at least partially, to the fact that liquid drops exhibit a larger range of fall speedsand larger differences in terminal fallspeed for different sizes. Additional turbulence inthe boundary layer will also contribute to the increase in measured SW. There is alsoa small cirrus cloud at about 9 km m.s.l. detected with measured Ze values betweenabout −30 and −39 dBZ. Interestingly the measured Vr varies in the cirrus from roughly20
0 to almost 1 ms−1.
6.2 Ground-based data
The HCR was also deployed in its ground-based configuration with coincident highspectral resolution lidar (HSRL) (Eloranta, 2005) data looking vertically in Novemberof 2013 in Boulder Colorado. Figure 15 shows B-scan displays of HCR Ze and Vr on25
22 November 2013 from 04:00 to 05:00 UTC during a snow event. Light snow was
135

GID5, 117–159, 2015
A wing pod-basedmillimeter
wavelength airbornecloud radar
J. Vivekanandan et al.
Title Page
Abstract Introduction
Conclusions References
Tables Figures
J I
J I
Back Close
Full Screen / Esc
Printer-friendly Version
Interactive Discussion
Discussion
Paper
|D
iscussionP
aper|
Discussion
Paper
|D
iscussionP
aper|
falling at the surface and the Denver sounding (not shown) indicated the temperaturewas below freezing for the entire layer and the surface temperature was about −10 ◦C.The Ze values are low and do not exceed about −10 dBZ consistent with the light snowobserved at the surface. The Vr values are all negative (approaching), consistent withthe downward motion of ice crystals falling.5
The HSRL data in Fig. 14 shows a layer of high backscatter and low circular de-polarization, indicating there is a layer containing super-cooled liquid drops at the topof the observed cloud. Using the HSRL data alone it is difficult to determine if thelayer containing super-cooled liquid is mixed phase or not – i.e. does the layer alsocontain ice crystals. Since the liquid cloud droplets dominate the lidar measurements,10
the backscatter signal from any ice crystals is masked in this layer. The apparent fallstreaks that can be seen coming from the bottom of the liquid layer are consistent withthe presence of ice crystals falling out of the liquid layer (Shupe et al., 2008). Examin-ing the HCR Vr data in Fig. 14b, it can be seen that the Vr values in the HSRL-indicatedliquid layer are negative, ranging from −0.5 to −1. ms−1. This is also consistent with the15
presence of ice crystals falling out of the layer, assuming the vertical air velocity is closeto 0 ms−1. The definitive evidence is the HCR spectral data presented in Fig. 15, whichshows the received power as a function of Vr within a given range gate. The spectra areobtained by taking the fast Fourier transform of the time-series in-phase and quadrature(I and Q) data to determine the return power (after accounting for the radar constant) as20
a function of Doppler velocity. The spectrum in Fig. 16 was selected from a radar rangegate within the liquid layer that had a measured Vr of about −0.5 ms−1. The spectrumis bimodal with a peak close to 0 ms−1 and a peak close to −0.9 ms−1. The two peaksindicate two distinct populations of particles with different fall speeds. The peak near0 ms−1 is most likely due to liquid cloud droplets that do not have an appreciable fall25
speed, while the peak near −0.9 ms−1 is most likely caused by ice crystals that areforming in the liquid layer growing quickly and falling out (Danne et al., 1999). In orderto obtain a smooth spectrum from a single gate, the finite impulse response (FIR) filterof Hubbert and Bringi (1995) was used on the original spectrum data. It was found that
136

GID5, 117–159, 2015
A wing pod-basedmillimeter
wavelength airbornecloud radar
J. Vivekanandan et al.
Title Page
Abstract Introduction
Conclusions References
Tables Figures
J I
J I
Back Close
Full Screen / Esc
Printer-friendly Version
Interactive Discussion
Discussion
Paper
|D
iscussionP
aper|
Discussion
Paper
|D
iscussionP
aper|
using the FIR filter was preferable to using time or range averaging because the cloudwas moving and evolving quickly.
The HCR and HSRL measurements are often complementary and the combinationof the two can provide additional insights into the cloud being studied. In the ground-based configuration, the two instruments can share a single standard 20 ft shipping5
container for coincident operations. The GV can also deploy the instruments simulta-neously.
Ground-based vertically pointing W-band spectral data have been shown to be use-ful for separating the air velocity from the particle fall velocity (Luke et al., 2010; Lukeand Kollias, 2013; Danne et al., 1999). In cloud, bimodal spectra result from the pres-10
ence of two different size modes, namely small cloud drops on the order of several mi-crons and larger precipitating particles of either ice or liquid drizzle. As seen in Fig. 15,the two populations can result in two distinguishable peaks at different Vr values. Thecloud droplets are assumed to be moving with the wind and therefore the cloud peakrepresents the air motion. The distinct spectra can be analyzed independently, thus15
providing detailed microphysical information that would not be obtainable without thespectral data.
7 Summary
The HCR is an airborne, mm wavelength, dual-polarization polarimetric, Doppler radarthat serves the atmospheric science community by providing cloud remote sensing ca-20
pabilities. Engineering and scientific aspects of the pod-based HCR are described inthe paper. The pod-based configuration alleviates competition for cabin space on boardthe GV (or other) aircraft and offers flexible scan coverage. The challenges associatedwith a pod-based system on a high altitude platform are managed by housing the radarsystem in a pressurized vessel within the pod. The compact pod-based configuration25
minimized waveguide losses and offered expected sensitivity for detecting clouds. Re-sults presented in this paper regarding spatial and temporal resolutions and sampling
137

GID5, 117–159, 2015
A wing pod-basedmillimeter
wavelength airbornecloud radar
J. Vivekanandan et al.
Title Page
Abstract Introduction
Conclusions References
Tables Figures
J I
J I
Back Close
Full Screen / Esc
Printer-friendly Version
Interactive Discussion
Discussion
Paper
|D
iscussionP
aper|
Discussion
Paper
|D
iscussionP
aper|
requirements for desired accuracy in radar measurements can be used for designingan optimal data collection strategy for a specified scientific mission.
The current system is a single frequency, polarimetric Doppler radar. The transmitand receive systems are designed to accommodate implementation of pulse compres-sion to achieve finer range resolution. The layout of the pod will accommodate a second5
radar at Ka-band for dual-wavelength measurements. Inclusion of dual-wavelength ca-pability will significantly enhance the accuracies of retrieved cloud microphysical quan-tities.
Internal and external calibration schemes are used for monitoring data quality. Forradar systems, internal calibration is important to track changes in the receiver gains.10
The methodology presented in this paper for calibrating reflectivity makes use of lightrain as a calibration target and it assures standard error reflectivity measurements< 0.5 dB. The amount of aircraft motion contribution to airborne Doppler measurementsis determined by aircraft velocity along the radar beam pointing direction. This requiresprecise estimates of the antenna pointing angle and aircraft attitude and velocity. The15
two-step procedure for correcting the influence of platform motion on measured radialvelocity assures better than 0.1 ms−1.
Preliminary measurements show the radar is capable of estimating accurate reflec-tivity and velocity observations for climate science and cloud process studies that aredominated by cloud liquid and cloud ice particles. The HCR will serve the atmospheric20
science research community by adding mm wavelength remote sensing capabilities tothe HIAPER aircraft. The HCR measurements in conjunction with other HIAPER in-strumentation have the potential to significantly increase our understanding of cloudphysics.
Acknowledgements. NCAR is primarily funded by the National Science Foundation. This mate-25
rial is based upon work supported by the National Science Foundation under cooperative GrantNumber NSF0015 and MO904 552. Any opinions, findings, and conclusions or recommenda-tions expressed in this material are those of the author(s) and do not necessarily reflect theviews of the National Science Foundation.
138

GID5, 117–159, 2015
A wing pod-basedmillimeter
wavelength airbornecloud radar
J. Vivekanandan et al.
Title Page
Abstract Introduction
Conclusions References
Tables Figures
J I
J I
Back Close
Full Screen / Esc
Printer-friendly Version
Interactive Discussion
Discussion
Paper
|D
iscussionP
aper|
Discussion
Paper
|D
iscussionP
aper|
The guidance and support of Al Cooper of NCAR was invaluable throughout the develop-ment. The authors would like to thank Mike Strong for his technical expertise and leadership inthe project. We also thank James Ranson, David Allen and Karl Schwenz of the NCAR Designand Fabrication Services for fabrication and design of mechanical infrastructure. The authorsalso thank Sam Haimov of the University of Wyoming for many helpful technical discussions.5
The authors appreciate Charlie Martin’s extensive software development for the initial proto-type. The authors appreciate the thoughtful and helpful manuscript review by John Hubbert ofNCAR.
References
Bringi, V. N. and Chandrasekar, V.: Polarimetric Doppler Weather Radar, Cambridge University10
Press, New York, 2001.Bosart, B. L., Lee, W. C., and Wakimoto, R. M.: Procedures to improve the accuracy of airborne
Doppler radar data, J. Atmos. Ocean. Tech., 19, 322–339, 2002.Brown, P. R., Illingworth, A. J., Heymsfield, A. J., McFarquhar, G. M., Browning, K. A., and
Gosset, M.: The role of spaceborne millimeter-wave radar in the global monitoring of ice15
clouds, J. Appl. Meteorol., 34, 2346–2366, 1995.Clothiaux, E. E., Miller, M. A., Albrecht, B. A., Ackerman, T. P., Verlinde, J., Babb, D. M., Pe-
ters, R. M., and Syrett, W. J.: An evaluation of a 94-GHz radar for remote sensing of cloudproperties, J. Atmos. Ocean. Tech., 12, 201–229, 1995.
Danne, O., Quante, M., Milferstädt, D., Lemke, H., and Raschke, E.: Relationships between20
Doppler spectral moments within large-scale cirro- and altostratus cloud fields observed bya ground-based 95-GHz cloud radar, J. Appl. Meteorol., 38, 175–189, doi:10.1175/1520-0450(1999)038<0175:RBDSMW>2.0.CO;2, 1999.
Donovan, D. P. and van Lammeren, A. C. A. P.: Cloud effective particle size and water contentprofile retrievals using combined lidar and radar observations 1, theory and examples, J.25
Geophys. Res., 106, 27425–27448, 2001.Doviak, R. J. and Zrnic, D.: Doppler Radar and Weather Observations, Academic Press, San
Diego, CA, 562 pp., 1993.
139

GID5, 117–159, 2015
A wing pod-basedmillimeter
wavelength airbornecloud radar
J. Vivekanandan et al.
Title Page
Abstract Introduction
Conclusions References
Tables Figures
J I
J I
Back Close
Full Screen / Esc
Printer-friendly Version
Interactive Discussion
Discussion
Paper
|D
iscussionP
aper|
Discussion
Paper
|D
iscussionP
aper|
Durden, S. L., Haddad, Z. S., and Bui, T. P.: Correction of Doppler radar data for aircraft motionusing surface mea- surements and recursive least squares estimation, J. Atmos. Ocean.Tech., 16, 2026–2029, 1999.
Ellis, S. M. and Vivekanandan, J.: Water vapor estimates using simultaneous dual-wavelengthradar observations, Radio Sci., 45, RS5002, doi:10.1029/2009RS004280, 2010.5
Ellis, S. M. and Vivekanandan, J.: Liquid water content estimates using simultaneous S andKa-band radar measurements, Radio Sci., 46, RS2021, doi:10.1029/2010RS004361, 2011.
Eloranta, E. W.: High spectral resolution lidar in lidar: range-resolved optical remote sensing ofthe atmosphere, in: Springer Series in Optical Sciences, edited by: Weitkamp, K., Springer-Verlag, New York, 2005.10
Haimov, S. and Rodi, A.: Fixed-antenna pointing-angle calibration of airborne Doppler cloudradar, J. Atmos. Ocean. Tech., 30, 2320–2335, doi:10.1175/JTECH-D-12-00262.1, 2013.
Hamazu, K., Hashiguchi, H., Wakayama, T., Matsuda, T., Doviak, R. J., and Fukao, S.: A 35-GHz scanning Doppler radar for fog observations, J. Atmos. Ocean. Tech., 20, 972–986,2003.15
Hanesiak, J., Stewart, R., Barber, D., Liu, G., Gilligan, J., Desjardins, D., Dyck, R., Fargey, S.,Hochheim, K., Martin, R., Taylor, P., Biswas, S., Gordon, M., Melzer, M. A., Moore, K.,Field, R., Hay, C., Zhang, S., McBean, G., Strapp, W., Hudak, D., Scott, J., Wolde, M., Good-son, R., Hudson, E., Gascon, G., Greene, H., Henson, W., and Laplante, A.: Storm studiesin the Arctic, B. Am. Meteorol. Soc., 91, 47–68, 2010.20
Hogan, R. H., Bouniol, D., Ladd, D. N., O’Connor, E. J., and Illingworth, A. J.: Absolute calibra-tion of 94/95-GHz radars using rain, J. Atmos. Ocean. Techn., 20, 572–580, 2003.
Horie, H., Iguchi, T., Hanado, H., Kuroiwa, H., Okamoto, H., and Kumagai, H.: Development ofa 95-GHz airborne cloud profiling radar (SPIDER) – technical aspects, IEICE Trans. Com-mun., E83B, 2010–2020, 2000.25
Hubbert, J. and Bringi, V. N.: An iterative filtering technique for the analysis of copular differentialphase and dual-frequency radar measurements, J. Atmos. Ocean. Techn., 12, 643–648,1995.
Kollias, P. and Albrecht, B. A.: The turbulence structure in a continental stratocumulus cloudfrom millimeter wavelength radar observation, J. Atmos. Sci., 57, 2417–2434, 2000.30
Kollias, P., Albrecht, B. A., Lhermitte, R., and Savtchenko, A.: Radar observations of updrafts,downdrafts, and turbulence in fair-weather cumuli, J. Atmos. Sci., 58, 1750–1766, 2001.
140

GID5, 117–159, 2015
A wing pod-basedmillimeter
wavelength airbornecloud radar
J. Vivekanandan et al.
Title Page
Abstract Introduction
Conclusions References
Tables Figures
J I
J I
Back Close
Full Screen / Esc
Printer-friendly Version
Interactive Discussion
Discussion
Paper
|D
iscussionP
aper|
Discussion
Paper
|D
iscussionP
aper|
Kollias, P., Albrecht, B. A., and Marks Jr., F.: Why mie? Accurate observations of vertical airvelocities and raindrops using cloud radar, B. Am. Meteorol. Soc., 82, 1471–1483, 2002.
Kollias, P., Clothiaux, E. E., Miller, M. A., Albrecht, B. A., Stephens, G. L., and Ackerman, T. P.:Millimeter-wavelength radars: new frontier in atmospheric cloud and precipitation research,B. Am. Meteorol. Soc., 88, 1608–1624, doi:10.1175/BAMS-88-10-1608, 2007.5
Kropfli, R. A. and Kelly, R. D.: Meteorological research applications of MM-wave radar, Meteorol.Atmos. Phys., 59, 105–121, 1996.
Lee, W. C., Dodge, P., Marks, F. D., and Hildebrand, P. H.: Map- ping of airborne Doppler radardata, J. Atmos. Ocean. Tech., 11, 572–578, 1994.
Lhermitte, R.: A 94-GHz Doppler radar for cloud observations, J. Atmos. Ocean. Tech., 4, 36–10
48, 1987.Laursen, K. K., Jorgensen, D. P., Brasseur, G. P., Ustin, S. L., and Hunning, J.: HIAPER: the
next generation NSF/NCAR research aircraft, B. Am. Meteorol. Soc., 87, 896–909, 2006.Li, L., Heymsfield, G. M., Racette, P. E., Tian, L., and Zenker, E.: A 94-GHz cloud radar system
on a NASA high-altitude ER-2 aircraft, J. Atmos. Ocean. Tech., 21, 1378–1388, 2004.15
Luke, E. P. and Kollias, P.: Separating cloud and drizzle radar moments during precipitationonset using Doppler spectra, J. Atmos. Ocean. Tech., 30, 1656–1671, doi:10.1175/JTECH-D-11-00195.1, 2013.
Luke, E. P., Kollias, P., and Shupe, M. D.: Detection of supercooled liquid in mixed-phase cloudsusing radar Doppler spectra, J. Geophys. Res., 115, D19201, doi:10.1029/2009JD012884,20
2010.Pazmany, A. L., McIntosh, R. E., Kelly, R., and Vali, G.: An airborne 95-GHz dual-polarized
radar for cloud studies, IEEE T. Geosci. Remote, 32, 731–739, 1994.Shupe, M. D., Daniel, J. S., de Boer, G., Eloranta, E. W., Kollias, P., Luke, E., Long, C. N.,
Turner, D., and Verlinde, J.: A focus on mixed-phase clouds, B. Am. Meteorol. Soc., 89,25
1549–1562, 2008.Stephens, G. L., Vane, D. G., Boain, R. J., Mace, G. G., Sassen, K., Wang, Z., Illingworth, A.
J., O’Connor, E. J., Rossow, W. B., Durden, S. L., Miller, S. D., Austin, R. T., Benedetti, A.,Mitrescu, C., and the Cloudsat Science Team: The CloudSat mission and the a-train, B. Am.Meteorol. Soc., 83, 1771–1789, 2002.30
Testud, J., Hildebrand, P. H., and Lee, W. C.: A procedure to correct airborne Doppler radardata for navigation errors using the echo returned from the earth’s surface, J. Atmos. Ocean.Tech., 12, 800–820, 1995.
141

GID5, 117–159, 2015
A wing pod-basedmillimeter
wavelength airbornecloud radar
J. Vivekanandan et al.
Title Page
Abstract Introduction
Conclusions References
Tables Figures
J I
J I
Back Close
Full Screen / Esc
Printer-friendly Version
Interactive Discussion
Discussion
Paper
|D
iscussionP
aper|
Discussion
Paper
|D
iscussionP
aper|
Ulaby, R. T., Moore, R. K., and Fung, A. K.: Microwave Remote Sensing Active and Passive,Vol. II: Radar Remote Sensing and Surface Scattering and Emission Theory, Artech House,Inc., Norwood, Massachussetts, 1982.
Ulbrich, C. W.: Natural variations in the analytical form of the raindrop size distribution, J. Clim.Appl. Meteorol., 22, 1764–1775, 1983.5
Vali, G., Kelly, R. D., French, J.,Haimov, S., Leon, D., McIntosh, R. E., and Pazmany, A.:Finescale structure and microphysics of coastal stratus, J. Atmos. Sci., 55, 3540–3564,1998.
Vivekanandan, J., Turk, J., Stephens, G. L., and Bringi, V. N.: Microwave radiative transfer stud-ies using combined multiparameter radar and radiometer measurements during COHMEX, J.10
Appl. Meteorol., 29, 561–585, 1990.Vivekanandan, J., Adams, W. M., and Bringi, V. N.: Rigorous approach to polarimetric radar
modeling of hydrometeor orientation distributions, J. Appl. Meteorol., 30, 1053–1063, 1991.Wang, Z., French, J., Vali, G., Wechsler, P., Haimo, S., Rodi, A., Deng, M., Leon, D., Snider, J.,
Peng, L., and Pazmany, A.: Single aircraft integration of remote sensing and in situ sampling15
for the study of cloud microphysics and dynamics, B. Am. Meteorol. Soc., 93, 653–668,2012.
Wolde, M. and Vali, G.: Polarimetric signatures from ice crystals observed at 95 GHz in winterclouds, part I: dependence on crystal form, J. Atmos. Sci., 58, 828–841, 2001a.
Wolde, M. and Vali, G.: Polarimetric signatures from ice crystals observed at 95 GHz in winter20
clouds. Part II: Frequency of occurance, J. Atmos. Sci., 58, 842–849, 2001b.WCR: Wyoming cloud radar, University of Wyoming, Laramie, available at: http://www-das.
uwyo.edu/wcr/ (last access: 5 April 2015), 2012.
142

GID5, 117–159, 2015
A wing pod-basedmillimeter
wavelength airbornecloud radar
J. Vivekanandan et al.
Title Page
Abstract Introduction
Conclusions References
Tables Figures
J I
J I
Back Close
Full Screen / Esc
Printer-friendly Version
Interactive Discussion
Discussion
Paper
|D
iscussionP
aper|
Discussion
Paper
|D
iscussionP
aper|
Table 1. HCR Specifications.
Parameter Specification
Transmit frequency 94.4 GHz, W-bandAntenna diameter 0.30 m, Lens antennaAntenna gain 46.21 dBBeamwidth 0.68◦
Peak power 1.6 kWPulse width 0.256–1.024 µsPRF 10 kHzSystem noise power −104 dBmNoise figure 9.4 dBFirst and Second IF 156.25 and 1406.25 MHzSensitivity (0 dB SNR, single pulse pair) −33.6 dBZ at 1 kmSensitivity (−6.5 dB SNR, 0.1 s averaging) −41.4 dBZ at 1 kmMinimum linear depolarization ratio −29 dBUnambiguous Velocity ±7.75 ms−1
Along track resolution and dwell time 20 m, and 100 ms
143

GID5, 117–159, 2015
A wing pod-basedmillimeter
wavelength airbornecloud radar
J. Vivekanandan et al.
Title Page
Abstract Introduction
Conclusions References
Tables Figures
J I
J I
Back Close
Full Screen / Esc
Printer-friendly Version
Interactive Discussion
Discussion
Paper
|D
iscussionP
aper|
Discussion
Paper
|D
iscussionP
aper|
Table A1. List of Acronyms.
CRS Cloud Radar SystemCfRadial Climate and forecasting radialdBZ Radar reflectivity factorEIKA Extended interaction klystron amplifierEOL Earth Observing LaboratoryFAA Federal aviation AdministrationGV Gulfstream VHCR HIAPER Cloud RadarHALO High-altitude long-range research aircraftHPSS High Performance Storage SystemHIAPER High-Performance Instrumented Airborne Platform for Environmental ResearchHSRL High Spectral Resolution LidarICPR Integrated cross-polar ratioIF Intermediate frequencyLNA Low noise amplifierLDR Linear depolarization ratiom.s.l. Mean sea levelNCAR National Center for Atmospheric ResearchNOAA National Oceanic and Atmospheric AdministrationNSF National Science FoundationPRF Pulse repetition frequencyQC Quality controlRAID Redundant array of inexpensive disksRF Radio frequencyRHI Range height indicatorRx ReceiverSNR Signal-to-noise ratioSolo Software for radar translation, visualization, editing and interpolationSTSR Simultaneously transmit and simultaneously receiveTD Time-to-independenceTx TransmitterV VerticalVr Radial velocityZe Reflectivityλo The transmit wavelength
144

GID5, 117–159, 2015
A wing pod-basedmillimeter
wavelength airbornecloud radar
J. Vivekanandan et al.
Title Page
Abstract Introduction
Conclusions References
Tables Figures
J I
J I
Back Close
Full Screen / Esc
Printer-friendly Version
Interactive Discussion
Discussion
Paper
|D
iscussionP
aper|
Discussion
Paper
|D
iscussionP
aper|
Figure 1. View of NCAR pod mounted below surface of right wing.
145

GID5, 117–159, 2015
A wing pod-basedmillimeter
wavelength airbornecloud radar
J. Vivekanandan et al.
Title Page
Abstract Introduction
Conclusions References
Tables Figures
J I
J I
Back Close
Full Screen / Esc
Printer-friendly Version
Interactive Discussion
Discussion
Paper
|D
iscussionP
aper|
Discussion
Paper
|D
iscussionP
aper|
Figure 2. Side view of the 20′′ HIAPER wing pod showing the layout of the radar electronics.The front of the pod is on the left hand side of the figure. The reflector plate is positioned suchthat the beam clears the leading edge of the wing when pointing toward zenith.
146

GID5, 117–159, 2015
A wing pod-basedmillimeter
wavelength airbornecloud radar
J. Vivekanandan et al.
Title Page
Abstract Introduction
Conclusions References
Tables Figures
J I
J I
Back Close
Full Screen / Esc
Printer-friendly Version
Interactive Discussion
Discussion
Paper
|D
iscussionP
aper|
Discussion
Paper
|D
iscussionP
aper|
Figure 3. Block diagram of polarimetric HCR transceiver. The blue arrow couples the transmitsignal for monitoring the transmitted power. The red arrow shows the signal path for monitoringreceiver gain using a known noise source.
147

GID5, 117–159, 2015
A wing pod-basedmillimeter
wavelength airbornecloud radar
J. Vivekanandan et al.
Title Page
Abstract Introduction
Conclusions References
Tables Figures
J I
J I
Back Close
Full Screen / Esc
Printer-friendly Version
Interactive Discussion
Discussion
Paper
|D
iscussionP
aper|
Discussion
Paper
|D
iscussionP
aper|
Figure 4. E-Plane co and cross-pol radiation patterns of HCR’s lens antenna.
148
GID5, 117–159, 2015
A wing pod-basedmillimeter
wavelength airbornecloud radar
J. Vivekanandan et al.
Title Page
Abstract Introduction
Conclusions References
Tables Figures
J I
J I
Back Close
Full Screen / Esc
Printer-friendly Version
Interactive Discussion
Discussion
Paper
|D
iscussionP
aper|
Discussion
Paper
|D
iscussionP
aper|
Figure 5. Velocity accuracy as a function of independent samples and signal-to-noise ratio.Spectrum width is assumed 1 ms−1 PRF is 10 kHz and transmit frequency is W-band.
149

GID5, 117–159, 2015
A wing pod-basedmillimeter
wavelength airbornecloud radar
J. Vivekanandan et al.
Title Page
Abstract Introduction
Conclusions References
Tables Figures
J I
J I
Back Close
Full Screen / Esc
Printer-friendly Version
Interactive Discussion
Discussion
Paper
|D
iscussionP
aper|
Discussion
Paper
|D
iscussionP
aper|
Figure 6. Standard error in reflectivity measurements. For a specified number of samples,standard error in reflectivity becomes lower as the Doppler spectrum becomes broader. Forgreater than 1000 samples, standard error in reflectivity is < 0.5 dB.
150

GID5, 117–159, 2015
A wing pod-basedmillimeter
wavelength airbornecloud radar
J. Vivekanandan et al.
Title Page
Abstract Introduction
Conclusions References
Tables Figures
J I
J I
Back Close
Full Screen / Esc
Printer-friendly Version
Interactive Discussion
Discussion
Paper
|D
iscussionP
aper|
Discussion
Paper
|D
iscussionP
aper|
Figure 7. Sensitivity of the HCR as a function of range is shown for two different transmit pulsewidths and also for no averaging and averaging over 1000 samples.
151

GID5, 117–159, 2015
A wing pod-basedmillimeter
wavelength airbornecloud radar
J. Vivekanandan et al.
Title Page
Abstract Introduction
Conclusions References
Tables Figures
J I
J I
Back Close
Full Screen / Esc
Printer-friendly Version
Interactive Discussion
Discussion
Paper
|D
iscussionP
aper|
Discussion
Paper
|D
iscussionP
aper|
Figure 8. Number of samples verses along track resolution is shown. The PRF is assumed10 000 Hz. Aircraft speed is assumed to be 200 ms−1.
152

GID5, 117–159, 2015
A wing pod-basedmillimeter
wavelength airbornecloud radar
J. Vivekanandan et al.
Title Page
Abstract Introduction
Conclusions References
Tables Figures
J I
J I
Back Close
Full Screen / Esc
Printer-friendly Version
Interactive Discussion
Discussion
Paper
|D
iscussionP
aper|
Discussion
Paper
|D
iscussionP
aper|
Figure 9. Histograms of rain rates, raindrop size distributions and computed W-band reflec-tivities: (a) rain rate, (b) concentration, (c) median volume diameter, and (d) reflectivity. Meanvalue of reflectivity is 19 dBZ and SD is less than dB for rain rates between 5 and 15 mmh−1.
153
GID5, 117–159, 2015
A wing pod-basedmillimeter
wavelength airbornecloud radar
J. Vivekanandan et al.
Title Page
Abstract Introduction
Conclusions References
Tables Figures
J I
J I
Back Close
Full Screen / Esc
Printer-friendly Version
Interactive Discussion
Discussion
Paper
|D
iscussionP
aper|
Discussion
Paper
|D
iscussionP
aper|
Figure 10. Radar measurements in stratiform rain. The HCR was on the ground and the beamwas pointing at 30 elevation. The B-scan display shows time verses range for the following:(a) reflectivity, (b) velocity and (c) LDR. A histogram of reflectivity at 200 m is shown in the lastpanel.
154

GID5, 117–159, 2015
A wing pod-basedmillimeter
wavelength airbornecloud radar
J. Vivekanandan et al.
Title Page
Abstract Introduction
Conclusions References
Tables Figures
J I
J I
Back Close
Full Screen / Esc
Printer-friendly Version
Interactive Discussion
Discussion
Paper
|D
iscussionP
aper|
Discussion
Paper
|D
iscussionP
aper|
Figure 11. One minute of corrected Vr data within ground echo measured during the test flightof 3 October 2014.
155

GID5, 117–159, 2015
A wing pod-basedmillimeter
wavelength airbornecloud radar
J. Vivekanandan et al.
Title Page
Abstract Introduction
Conclusions References
Tables Figures
J I
J I
Back Close
Full Screen / Esc
Printer-friendly Version
Interactive Discussion
Discussion
Paper
|D
iscussionP
aper|
Discussion
Paper
|D
iscussionP
aper|
Figure 12. B-scan plots of Ze and Vr collected 23 February 2013 from the HCR looking nadir.
156

GID5, 117–159, 2015
A wing pod-basedmillimeter
wavelength airbornecloud radar
J. Vivekanandan et al.
Title Page
Abstract Introduction
Conclusions References
Tables Figures
J I
J I
Back Close
Full Screen / Esc
Printer-friendly Version
Interactive Discussion
Discussion
Paper
|D
iscussionP
aper|
Discussion
Paper
|D
iscussionP
aper|
Figure 13. B-scan plots of Ze, Vr and spectrum width collected on 11 October 2013 from theHCR looking nadir.
157

GID5, 117–159, 2015
A wing pod-basedmillimeter
wavelength airbornecloud radar
J. Vivekanandan et al.
Title Page
Abstract Introduction
Conclusions References
Tables Figures
J I
J I
Back Close
Full Screen / Esc
Printer-friendly Version
Interactive Discussion
Discussion
Paper
|D
iscussionP
aper|
Discussion
Paper
|D
iscussionP
aper|
Figure 14. Coincident ground-based HCR and HSRL measurements of liquid and ice clouds.(a) W-band reflectivity, (b) W-band radial velocity, (c) lidar backscatter and (d) lidar circulardepolarization ratio. Data were collected on 22 November 2013.
158

GID5, 117–159, 2015
A wing pod-basedmillimeter
wavelength airbornecloud radar
J. Vivekanandan et al.
Title Page
Abstract Introduction
Conclusions References
Tables Figures
J I
J I
Back Close
Full Screen / Esc
Printer-friendly Version
Interactive Discussion
Discussion
Paper
|D
iscussionP
aper|
Discussion
Paper
|D
iscussionP
aper|
Figure 15. HCR spectrum collected in a mixed phase cloud. The radar was ground-based andpointed vertically.
159