Embed Size (px)
Citation preview

A wind tunnel investigation to examine the role of air humidity in controlling the
threshold shear velocity of a surface and in controlling the mass flux of material
from a surface
by
Joseph Ciaran Massey, BSc
A Thesis
In
Arid Land Studies
Submitted to the Graduate Faculty
of Texas Tech University in
Partial Fulfillment of
the Requirements for
the Degree of
Master of Sciences
Approved
Dr Gad Perry
Chair of Committee
Dr Jeff Lee
Dr Ted Zobeck
Dr Mark Bateman
Dominick Casadonte
Interim Dean of the Graduate School
May, 2013

Copyright 2013, Joseph Massey

ii
ACKNOWLEDGEMENTS
I would like to thank Dr. Ted Zobeck and Dr. Jeff Lee for allowing me to work with them
and for their constant support and advice whilst I conducted this project. It would have
been impossible without this.
I am also grateful to Dr. Gad Perry, Dr. Tony Parsons and Dr. Mark Bateman for serving
on my committee and helping me gain this Masters degree through their support and
guidance.
I also thank everyone at the USDA Plant Stress and Water Conservation Laboratory in
Lubbock for allowing me to use the facilities there. In particular, I would like to thank
Mr. Dean Holder for the huge amount of time and effort he put into helping me and
fixing any problems that occurred during my time there. I thank Dr. John Stout for his
advice and willingness to help whenever I asked.
I am deeply grateful to my girlfriend Victoria Lee for helping me adjust to life in a new
country and her constant support and understanding, especially when giving me a lift in
the early hours of the morning to the USDA.
Finally, I would like to thank my parents, Mandy Orton and Noel Massey, for the
unwavering support and assistance throughout my life, without which nothing I have
done would have been possible. Also thank you to all my friends and family, in Lubbock
and back home, who have supported me throughout this time.
Texas Tech University, Joseph Massey, May 2013

iii
TABLE OF CONTENTS
Acknowledgements ii
Abstract v
List of Tables vii
List of Figures viii
1. Introduction 1
1.1 Controls of dust emissions 2
1.2 The role of humidity in controlling soil erodibility 4
1.3 Justification for research 10
1.4 Aim of research 11
2. Methods 12
2.1 Wind tunnel 12
2.2 Soil preparation 15
2.3 Threshold measurement 17
2.4 PM10 Measurement 19
2.5 Conducting the test 21
3. Results and Discussion 23
3.1 The control of humidity on the threshold shear velocity 23
3.11 Sand and Clay material 23
3.12 Organic Material 30
3.2 The sensitivity of two particles sensors in determining the threshold shear velocity 33
Texas Tech University, Joseph Massey, May 2013

iv
3.3 The control of humidity on the mass flux of material 39
3.31 Control of the threshold shear velocity over the total mass of material removed 39
3.32 Control of relative humidity over the total mass of material removed 43
3.4 Control of humidity over the time to peak mass flux 49
4. Conclusion 54
5. References 56
Texas Tech University, Joseph Massey, May 2013

v
ABSTRACT
Aeolian erosion, the wind-forced movement of soil particles, is a dominant process in
arid regions. The impacts of wind-driven dust emissions are numerous and can have both
localized effects and far reaching impacts. The susceptibility of a soil surface to wind
erosion is gauged using the threshold friction velocity (u*t), which is related to the wind
speed needed for the erosion of surface material to commence. This threshold varies for
every surface and depends on numerous variables, including surface soil moisture. In arid
regions, which contain air-dry soils, soil moisture is the driving factor controlling
changes in the threshold shear velocity of a surface at short, diurnal timescales (Ravi and
D’Odorico, 2005). Therefore, an understanding of these varying moisture conditions, and
the associated changes in soil erodibility, is vital in understanding and modeling aeolian
soil erosion (Ravi et al., 2006). In such regions, where rainless periods are common and
there is a lack of moisture provided by precipitation or capillary rise, the humidity of the
overlying air is particularly influential in controlling soil moisture content at the surface
(Ravi and D’Odorico, 2005). Through wind tunnel tests, this study analysed the control
relative humidity had on the threshold shear velocity for three soils: a loamy fine sand, a
clay loam and a sandy muck. The loamy fine sand and the clay loam material were
previously studied and the results found here agreed with those from other studies (e.g.,
Ravi et al., 2006). The relationship found is made up of a high and low section of
humidity, where the threshold shear velocity increases with humidity, and a mid-range
section of humidity, where the threshold shear velocity decreases with increased
humidity. The previously unstudied sandy muck also showed this relationship. The
results were explained using the theory of equilibrium between the surface soil moisture
and the humidity of the overlying atmosphere. In such studies, an accurate measurement
of the threshold shear velocity is vital and this study compared the sensitivity of two
particles sensors (Wenglor YH03PCT8 and Sensit model H10) in determining the
threshold shear velocity of a soil surface. It was found that the newer Wenglor sensor
recorded the threshold at considerably lower wind speeds throughout the test and for each
soil. This, however, did not significantly change the relationship seen between the
threshold shear velocity and relative humidity. For the first time, this study aimed to
investigate the effect humidity has on the erodibility of a surface over a sustained period
Texas Tech University, Joseph Massey, May 2013

vi
of time. This was done by analysing the mass flux of PM10 from each soil at a range of
humidities. It was found that the initial threshold shear velocity of the surface had no
control over the average mass flux of material from the surface. For the clay loam and
sandy muck, the humidity also had no control over the average mass flux of material
from the surface. The loamy fine sand, however, exhibited a strong, linear relationship
between the humidity and the total mass removed. This was explained using a theory
suggesting that the higher percentage of larger grains in this soil preferentially absorbed
water from the atmosphere when compared to smaller grains, meaning smaller grains are
less affected by the threshold. Finally, this study analysed the control of humidity on the
time it takes for mass flux to reach its peak value. It was found that the threshold shear
velocity had a substantial control over the time to mass flux. This showed that the
overlying humidity of the air only affected the grains at the surface (≈top 2mm) and,
under prolonged wind erosion, the initial threshold of the surface was no longer apparent
at the surface and a new threshold was developed.
Texas Tech University, Joseph Massey, May 2013

vii
LIST OF TABLES
1. Classification and physical properties of the 3 soils used in this study.......................15
2. Equation for each line in Figure 9 and statistics describing the summary of fit for the
Pullman clay loam............................................................................................................25
3. Equation for each line in Figure 10 and statistics describing the summary of fit for the
Brownfield sand...............................................................................................................26
4. Equation for each line in Figure 13 and statistics describing the summary of fit for the
Adrian muck.....................................................................................................................31
5. Data regarding the humidity classes and the mean total mass flux, mean peak mass, mean time to peak mass and threshold shear velocity for these humidity classes.........42
Texas Tech University, Joseph Massey, May 2013
viii
LIST OF FIGURES
1. Conceptual diagram showing factors affecting wind erosion and the effects of wind erosion. Taken from Ravi et al. (2011)................................................................................2
2. Surface soil moisture (s) versus relative humidity (r) for 3 soils. Taken from Ravi et al. (2004)...................................................................................................................................5
3. Threshold shear velocity (u*t) as a function of relative humidity (RH) for Pullman Clay Loam, determined from wind tunnel tests. Taken from Ravi et al. (2006)..........................6
4. Typical sorption curve for a medium sand (d = 200 μm). The matric potential decreases very slowly below 0.1 MPa, and increases very rapidly above 0.2 MPa in this example. Taken from McKenna-Neuman (2003)................................................................................8
5. Cartoon illustrating the degree of nanoscale contact at the intersection of two adjacent, hypothetical particles (grey tone shading) at two different humidities. Taken from McKenna-Neuman and Sanderson (2008)...........................................................................9
6. Photo showing the test Section of the wind tunnel, including (1) test tray with soil, (2) humidity and temperature probe, (3) Wenglor laser particle counter, (4) Sensit impact sensor and (5) slot sampler for the GRIMM......................................................................13
7. Photo showing Pullman clay loam and Brownfield sand left out on trays to equilibrate with the relative humidity..................................................................................................16
8. (1) The Wenglor YH03PCT8 fork sensor taken from Hugenholtz and Barchyn (2011). (2) A Sensit particle impact sensor (not the same model as the one used in the test) taken from Van Pelt et al. (2009). All dimensions in millimeters............................................. 18
9. Threshold shear velocity (u*t) as a function of relative humidity for the Pullman clay loam. Threshold shear velocity values were averaged into classes of humidity..............24
10. Threshold shear velocity (u*t) as a function of relative humidity for the Brownfield sand. Threshold shear velocity values were averaged into classes of humidity..............25
11. Threshold shear velocity (u*) as a function of relative humidity (RH) as determined by wind-tunnel tests for two soils (A) Pullman clay loam and (C) Brownfield sand. Values of u* were averaged within classes of RH. Taken from Ravi et al. (2006)........27
12. Threshold shear velocity (u*t) as a function of temperature (ºC) for the Brownfield sand and Pullman clay loam. Threshold shear velocity values were averaged into classes of temperature.................................................................................................................29
13. Threshold shear velocity (u*t) as a function of relative humidity for the Adrian muck. Threshold shear velocity values were averaged into classes of humidity......................30
Texas Tech University, Joseph Massey, May 2013

ix
14. A. Threshold shear velocity (u*) as a function of temperature (ºC) for the organic soil. B. Threshold shear velocity (u*) as a function of temperature (ºC) for all values minus two possibly anomalous values for the organic soil............................................................32
15. Threshold shear velocity (u*t) as a function of relative humidity for the Pullman clay loam and the Adrian muck, results shown from both the Wenglor laser particle counter and the Sensit impact sensor. Threshold shear velocity values were averaged into classes of humidity..........................................................................................................................34
16. Linear regression comparing the u* (m s-1) found from the Wenglor with that found from the Sensit for the Pullman clay loam and the Adrian muck.......................................36
17. Threshold shear velocity (u*) as a function of relative humidity for the Brownfield sand, results shown from both the Wenglor laser particle counter and the Sensit impact sensor. U* values were averaged into classes of humidity.................................................36
18. Linear regression comparing the u* (m s-1) found from the Wenglor with that found from the Sensit, for the Brownfield sand............................................................................38
19. Linear regression of the threshold shear velocity (m s-1) and the average total mass of material removed from the surface (mg m-2 s-1) grouped into classes of humidity for the 3 soils studied........................................................................................................................41
20. Linear regression of the relative humidity (%) and the average total mass of material removed from the surface (mg m-2 s-1) grouped into classes of humidity for the Pullman and Adrian soils.................................................................................................................44
21. Linear regression of the relative humidity (%) and the average total mass of material removed from the surface (mg m-2 s-1) grouped into classes of humidity for the Brownfield loamy fine sand..............................................................................................45
22. Linear regression (Left) of the total mass flux of larger particles (5.0µm-10.0µm) (mg m-2 s-1) and humidity and (Right) of the total mass flux of smaller particles (0.30µm-5.0µm) (mg m-2 s-1) and humidity for the Brownfield loamy fine sand............................46
23. An overlay line graph showing how the total mass flux of larger particles (5.0-10µm) (mg m-2 s-1) and the threshold wind velocity change with humidity for the Brownfield sand...................................................................................................................................47
24. An overlay line graph showing how the total mass flux of larger particles (5.0-10µm) (mg m-2 s-1) and the threshold wind velocity change with humidity for the Adrian muck.48
25. An overlay line graph showing how the total mass flux of larger particles (5.0-10µm ) (mg m-2 s-1) and the threshold wind velocity change with humidity for the Pullman clay loam....................................................................................................................................48
26. Time to peak mass flux (s) as a function of relative humidity for all the soils studied. Time to peak values were averaged into classes of humidity.............................................50
Texas Tech University, Joseph Massey, May 2013

x
27. An overlay line graph showing how the time to peak mass flux and the threshold shear velocity change with humidity...............................................................................51
28. Linear regression of the time to peak mass flux (s) and the threshold shear velocity (m s-1) for the soils studied..................................................................................................53
Texas Tech University, Joseph Massey, May 2013
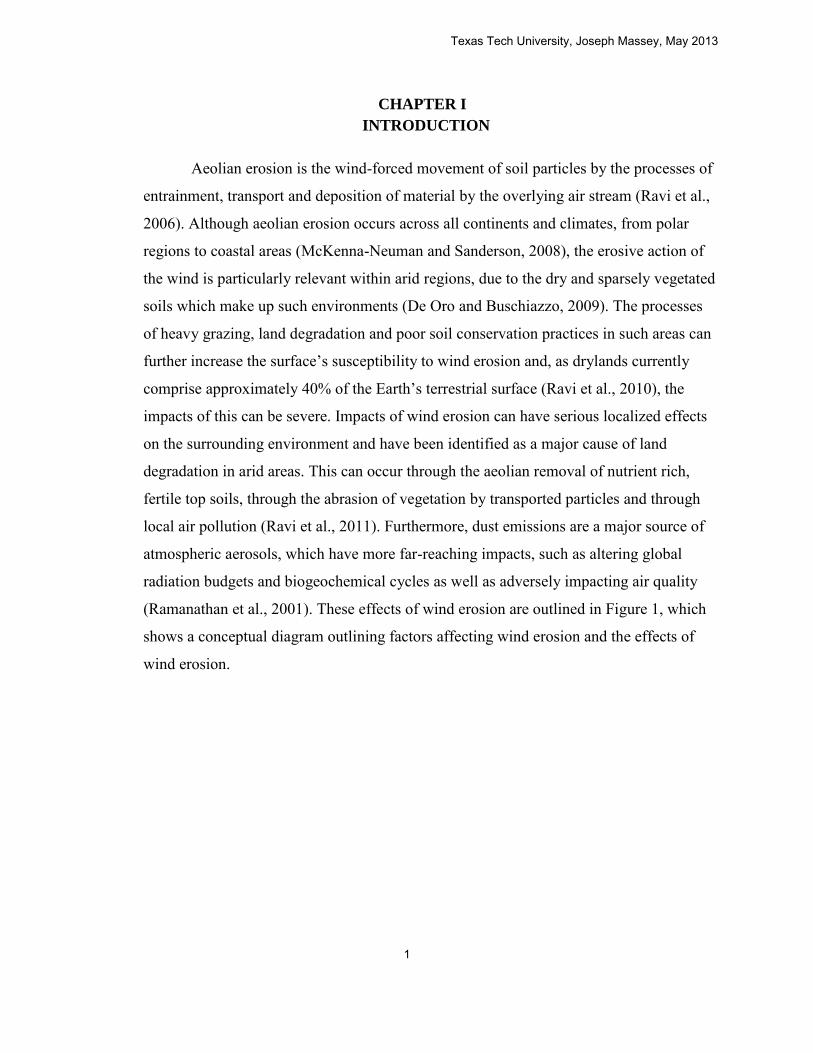
CHAPTER I INTRODUCTION
Aeolian erosion is the wind-forced movement of soil particles by the processes of
entrainment, transport and deposition of material by the overlying air stream (Ravi et al.,
2006). Although aeolian erosion occurs across all continents and climates, from polar
regions to coastal areas (McKenna-Neuman and Sanderson, 2008), the erosive action of
the wind is particularly relevant within arid regions, due to the dry and sparsely vegetated
soils which make up such environments (De Oro and Buschiazzo, 2009). The processes
of heavy grazing, land degradation and poor soil conservation practices in such areas can
further increase the surface’s susceptibility to wind erosion and, as drylands currently
comprise approximately 40% of the Earth’s terrestrial surface (Ravi et al., 2010), the
impacts of this can be severe. Impacts of wind erosion can have serious localized effects
on the surrounding environment and have been identified as a major cause of land
degradation in arid areas. This can occur through the aeolian removal of nutrient rich,
fertile top soils, through the abrasion of vegetation by transported particles and through
local air pollution (Ravi et al., 2011). Furthermore, dust emissions are a major source of
atmospheric aerosols, which have more far-reaching impacts, such as altering global
radiation budgets and biogeochemical cycles as well as adversely impacting air quality
(Ramanathan et al., 2001). These effects of wind erosion are outlined in Figure 1, which
shows a conceptual diagram outlining factors affecting wind erosion and the effects of
wind erosion.
Texas Tech University, Joseph Massey, May 2013
1

Figure 1. Conceptual diagram showing factors affecting wind erosion and the effects of wind erosion.
Taken from Ravi et al. (2011).
1.1 Controls of dust emissions
The physics behind the erosion of soil particles by the wind is complex, involving
interconnected atmospheric, soil and land surface processes which combine to affect the
ability of the wind to erode the surface and the susceptibility of the surface to be eroded.
These interconnected processes are summarized in Figure 1. The susceptibility of the
surface to erosion is gauged using the threshold wind velocity (u*t). Erosion of surface
material can only occur when the wind speed surpasses this threshold wind velocity (u*t),
which varies for every surface depending on numerous variables. The threshold wind
velocity is the velocity at which the wind shear at the surface exceeds the shear strength
of the soil’s aggregates and their resistance to removal (Ravi et al., 2011). Studies on the
threshold conditions for wind erosion commonly use threshold shear velocities instead of
threshold wind velocities (Ravi et al., 2006). This is because threshold conditions are
directly related to the shear stress exerted on the surface and can be easily calculated from
the threshold wind velocity of a surface, if information on the wind profile over the
surface is available. Because of this, the threshold shear velocity will be used throughout
the study. For a particle at rest, the forces controlling its motion are the particle’s weight,
Texas Tech University, Joseph Massey, May 2013
2

the interparticle cohesion forces between particles and the shear stress of the wind
(Marticorena and Bergametti, 1995). These forces directly affect the threshold shear
velocity of a surface and are controlled by surface soil conditions, such as soil moisture,
size and stability of soil aggregates, clay content, extent of vegetation and surface
roughness, as well as climatic conditions, including precipitation, temperature,
evapotranspiration and relative humidity (Stout, 2004). This study will keep some of
these factors constant throughout the test, such as surface roughness, and other factors
will not be relevant in a wind tunnel test, such as precipitation, evapotranspiration and
extent of vegetation. However, as three different soils will be used in this test, soil
properties are likely to affect the threshold shear velocity between soils. Bagnold (1941)
showed that the threshold shear velocity was controlled by the diameter and density of
particles at the surface. Equation 1 shows the expression he derived for the threshold
shear velocity (u*t) for dry soils affected only by aerodynamic drag and gravity:
(1)
where d is the particle diameter, ρa is the air density, ρs is the grain density, g is the
gravitational acceleration, and A is a dimensionless threshold parameter. This equation
shows that the value for the threshold shear velocity varies according to the square root of
the grain diameter and, therefore, the threshold increases with grain diameter. However,
this equation doesn’t account for interparticle forces between soil particles, which
become increasingly important as particles become smaller, and wind tunnel tests showed
that this relationship wasn’t applicable when the grain size fell below a critical value of
60 µm (e.g., Chepil, 1945). Below this grain size, it was shown that the threshold shear
velocity increased with decreasing grain size. The behavior of smaller particles at this
point was due to increasing interparticle cohesion forces associated with decreasing grain
size, due to a higher particle surface area. These higher cohesion forces outweigh the
decrease in the threshold brought about by lower particle diameter at this point (Iversen
and White, 1982). Particle size is therefore a considerable factor in controlling the
Texas Tech University, Joseph Massey, May 2013
3

threshold shear velocity of a surface and differences in this regard between the soils used
in this study will be considered when analyzing the threshold values found.
The formation of physical and biological crusts at the soil surface is another
surface condition which has a substantial impact over dust emissions. Soils which have
these crusted surfaces, without the presence of mobile aggregates, are generally much
more resistant to wind erosion than soils with available mobile soil at the surface
(Marticorena et al., 1997). The formation and stability of these crusts is related to the clay
content of the soil (Skidmore and Layton, 1992), among other factors. Higher clay
content within the soil is associated with the formation of larger and more stable
aggregates (Chepil, 1953) which, in turn, reduces the soil’s susceptibility to erosion. This
displays how soil texture can alter the threshold shear velocity through a variety of
processes and, therefore, must be considered by any study attempting to analyze changes
in the threshold of a surface. To remove the control of aggregates on the threshold wind
velocity of a surface, this study will ensure the soil surface for each soil is as uniform as
possible, discussed in more detail in Section 3.2.
In arid regions, which contain air-dry soils, soil moisture is the driving factor
controlling changes in the threshold shear velocity of a surface at short, diurnal
timescales (Ravi and D’Odorico, 2005) due to the influence soil moisture has on the
interparticle forces between soil grains, which act to bind the surface together (Cornelis et
al., 2004). An understanding of these varying moisture conditions and the associated
changes in soil erodibility, is vital in understanding and modeling aeolian soil erosion
(Ravi et al., 2006).
1.2 The role of humidity in controlling soil erodibility
Despite the considerable variation in atmospheric conditions, including relative
humidity, for regions affected by wind erosion, there has been relatively little attention to
the role humidity plays in affecting the erodibility of soil surfaces (McKenna Neuman
and Sanderson, 2008). This is particularly important for arid regions, where rainless
Texas Tech University, Joseph Massey, May 2013
4

periods are common and there is a lack of moisture provided by precipitation or capillary
rise, as the humidity of the overlying air is particularly influential in controlling soil
moisture content at the surface (Ravi and D’Odorico, 2005). This occurs through the
process of the near surface soil moisture reaching equilibrium with the relative humidity
of the overlying atmosphere (Ravi et al., 2006). Ravi et al. (2004) showed the dependence
of near surface soil moisture (top 2mm) on the relative humidity of the atmosphere,
shown in Figure 2. There is a consistent dependence of soil moisture on the overlying
humidity of the air and this, in turn, has been suggested to have a significant effect over
the erodibility of soil surfaces under these conditions.
Figure 2. Surface soil moisture (s) versus relative humidity (r) for 3 soils. Taken from Ravi et al. (2004).
This relationship has led to some studies suggesting atmospheric humidity could
be a better predictor of soil erodibility than soil moisture in such areas (Ravi et al., 2004).
This is because it is easier to acquire large spatial and temporal data on relative humidity
compared with taking soil moisture measurements. However, although the dependence on
humidity was found to be high for the surface soil moisture, this only constitutes the top
2mm of the soil profile, which consists of a few layers of grains.
Studies suggesting humidity as a possible predictor of surface erodibility have
looked at the threshold shear velocity alone and its dependence on relative humidity (e.g.,
Ravi and D’Odorico, 2005; Ravi et al., 2006). Such studies have found a clear
relationship between the threshold shear velocity and the relative humidity of the
Texas Tech University, Joseph Massey, May 2013
5
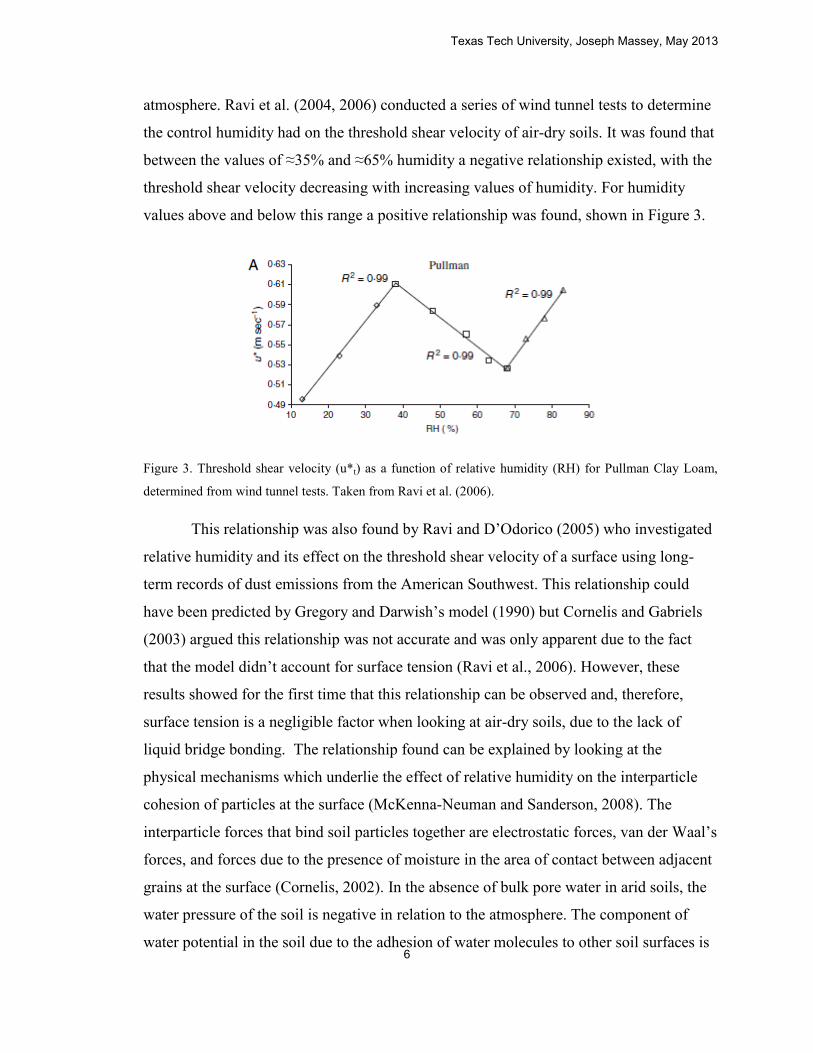
atmosphere. Ravi et al. (2004, 2006) conducted a series of wind tunnel tests to determine
the control humidity had on the threshold shear velocity of air-dry soils. It was found that
between the values of ≈35% and ≈65% humidity a negative relationship existed, with the
threshold shear velocity decreasing with increasing values of humidity. For humidity
values above and below this range a positive relationship was found, shown in Figure 3.
Figure 3. Threshold shear velocity (u*t) as a function of relative humidity (RH) for Pullman Clay Loam,
determined from wind tunnel tests. Taken from Ravi et al. (2006).
This relationship was also found by Ravi and D’Odorico (2005) who investigated
relative humidity and its effect on the threshold shear velocity of a surface using long-
term records of dust emissions from the American Southwest. This relationship could
have been predicted by Gregory and Darwish’s model (1990) but Cornelis and Gabriels
(2003) argued this relationship was not accurate and was only apparent due to the fact
that the model didn’t account for surface tension (Ravi et al., 2006). However, these
results showed for the first time that this relationship can be observed and, therefore,
surface tension is a negligible factor when looking at air-dry soils, due to the lack of
liquid bridge bonding. The relationship found can be explained by looking at the
physical mechanisms which underlie the effect of relative humidity on the interparticle
cohesion of particles at the surface (McKenna-Neuman and Sanderson, 2008). The
interparticle forces that bind soil particles together are electrostatic forces, van der Waal’s
forces, and forces due to the presence of moisture in the area of contact between adjacent
grains at the surface (Cornelis, 2002). In the absence of bulk pore water in arid soils, the
water pressure of the soil is negative in relation to the atmosphere. The component of
water potential in the soil due to the adhesion of water molecules to other soil surfaces is
Texas Tech University, Joseph Massey, May 2013
6

called the matric potential (Ψ). It is always negative and becomes zero at saturated
conditions. The relationship between the matric potential and the humidity within the
spaces between grains is described by the Kelvin equation in Equation 2,
(2)
where R is the ideal gas constant (8.314 J mol-1K-1), T is temperature (K), Vw is
the molar volume of water (1.8x10⁻⁵m3mol-1) and RH is the relative humidity (%)
(McKenna Neuman, 2003). Equation 2 shows that the matric potential is controlled by
relative humidity and temperature, with an increase in humidity or a decrease in
temperature causing a reduction in the matric potential of a surface. This is important as
the matric potential contributes significantly to the interparticle forces which exist
between grains, meaning humidity is likely to have an effect over soil erodibility. The
wet contact area between grains is a related factor affecting interparticle forces between
grains. Where two particles rest against each other at the surface, a thin film of absorbed
water develops at the contact area where they meet (McKenna Neuman, 2003). Equation
3 shows that matric potential (Ψ) multiplied by the extent of the area of contact between
adjacent particles (Ac) provides an estimate for the interparticle force between grains,
(3)
where is the interparticle force, accounts for the van der Waals and
electrostatic forces and d is particle diameter (McKenna Neuman, 2003). This can be
used to explain the relationship seen in Figure 3. When a soil is exposed to an atmosphere
at ≈35% humidity (the point where threshold begins to decrease with humidity) a single
layer of water is absorbed onto the surface of the grains and held by hydrogen bonding
(Mckenna Neuman and Sanderson, 2008). At this stage, the water is tightly bound to the
particles by strong forces and little to no water remains in the soil pores (McKenna
Neuman, 2003). The low humidity within the soil pores means that the matric potential
Texas Tech University, Joseph Massey, May 2013
7

(Ψ) is high, leading to strong interparticle forces between grains. The interparticle forces
between grains at this point are further increased, as the added water bound to the
particles will increase wet contact area between adjacent grains (Ac). These factors lead
to the threshold shear velocity at the surface being high.
Figure 4. Typical sorption curve for a medium sand (d = 200 μm). The matric potential decreases very
slowly below 0.1 MPa, and increases very rapidly above 0.2 MPa in this example. Taken from McKenna-
Neuman (2003).
As the relative humidity is increased to a higher value, for example 45%,
additional water is absorbed onto the soil surface in an ice-like structure. This additional
water results in lower interparticle forces between grains. This is because the increased
water presence at the surface means a higher humidity within the soil pores. This causes a
significant reduction in the pressure difference between the surface and the atmosphere
and, therefore, a fall in the matric potential. Figure 4 shows that the matric potential falls
rapidly with increased absorbed water, displaying how sensitive the matric potential is to
the addition of water at low water content levels. The associated fall in the interparticle
forces between grains is however countered by increased wet contact areas between
grains. The increased moisture at the surface causes these wet contact areas (Ac) between
grains to grow in thickness, meaning the wet contact area adjoining a given particle to
another increases. However, the fall in matric potential, and the associated fall in
Texas Tech University, Joseph Massey, May 2013
8

interparticle forces between grains, is not compensated by this increased wet contact area.
This can be seen more clearly in Figure 5, which is a cartoon showing an example of how
the spaces and wet contact areas between grains at two different humidities might look.
Figure 5 shows that with the increased water at the surface for a high humidity (e.g.,
45%) the extent of the contact areas between grains is actually fairly similar when
compared to a soil under lower humidity conditions (e.g., 35%) despite the much thicker
layer of water.
Figure 5. Cartoon illustrating the degree of nanoscale contact at the intersection of two adjacent,
hypothetical particles (grey tone shading) at two different humidities. Taken from McKenna-Neuman and
Sanderson (2008).
This leads to a negative relationship between relative humidity and the threshold
shear velocity for soils under these humidity conditions (≈35% to ≈65%). This process
continues as humidity rises and the second layer of water is completely absorbed at
≈65%, the point where threshold begins to again increase with humidity. At this stage
water vapor from the atmosphere is sufficiently abundant to start condensing in the
interparticle spaces between soil grains and this process results in the wet contact areas
growing to form liquid bridges between soil grains (McKenna-Neuman and Sanderson,
2008). These liquid bridges bind the grains together sufficiently to overcome any loss to
the interparticle forces from decreases in the matric potential, which are minimal at this
Texas Tech University, Joseph Massey, May 2013
9

stage, shown by Figure 4, and, therefore, the threshold shear velocity of the surface
increases from this point on.
1.3 Justification for research
Despite the fact that there has been relatively little attention to the role humidity
plays in the erodibility of soil surfaces, the previous section outlined that the relationship
between the threshold shear velocity and the overlying humidity of the air, and the
processes behind this relationship, are relatively well understood. However, to date, all
studies investigating the control of humidity on the erodibility of air-dry soils have
focused on its influence over the threshold shear velocity of a surface, with no research
conducted into how humidity may affect the mass flux of dust from a surface over time.
This relationship between humidity and mass flux could be important when studying soil
erodibility under varying climatic conditions, as the threshold shear velocity might not
sufficiently explain the extent of a surface’s erodibility. This is due to the fact that the
equilibrium which develops between the surface soil moisture and the overlying
atmosphere has only been shown to occur within 2mm of the soil surface, an area only a
few grains thick (Ravi et al., 2004). Below this, the grains may be totally unaffected by
the overlying air, as no equilibrium between the soil pores and the humidity of the air has
been developed. During periods of high or prolonged wind erosion the top 2mm of soil
are likely to be completely removed from the surface, exposing this underlying material
which is presumably completely unaffected by the overlying humidity of the atmosphere.
In this case, humidity would affect the erosion of the top 2mm of soil but, below this, a
number of outcomes are possible:
1. The effect of humidity may become negligible in such circumstances and a
surface’s erodibility is determined by other factors.
2. Even though the particles are not equilibrated with the humidity and are
therefore unaffected, the humidity of the air affects its ability to erode the surface and
humidity still has some effect over surface erodibility.
3. As soil is removed, the equilibrium starts to develop between humidity and soil
grains which were previously too far down to be affected and the relationship found
Texas Tech University, Joseph Massey, May 2013
10

previously, in Figure 2, applies to some extent here. However, given the time taken to
reach equilibrium, it is unlikely that humidity could greatly affect the soil moisture in the
pores between these grains before they were themselves removed.
It is, therefore, important to investigate the role humidity plays in affecting mass
flux of dust from a surface, especially if overlying relative humidity is to be used to
characterize the erodibility of a surface and its susceptibility to dust emission, which a
number of studies have suggested. This is because current theories, which use threshold
shear velocity alone, may substantially overestimate or underestimate the amount of dust
likely to be removed from a surface at a given humidity.
1.4 Aim of research
The primary aim of this research is:
To investigate the role of air humidity in controlling the threshold shear velocity of a
surface and in controlling the mass flux of material from a surface.
To achieve this, 3 soils (1 previously unstudied) were used in this study and the
threshold shear velocity of each, under a variety of humidity conditions, was determined
using a wind tunnel and electronic saltation sensors. The relationship found in this study,
for the two previously studied soils, will then be compared to that found from previous
research (e.g., Ravi et al., 2004). The relationship found for the unstudied soil will be
compared to previous work and results from this study to see if the same theory on the
role of humidity applies to this soil.
The control humidity has on the mass flux of particles from a surface, after initial
particle entrainment, will be investigated in the wind tunnel using a portable aerosol
spectrometer. Information regarding the total mass lost, the peak mass and the time to
peak mass will all be studied to see if either of these variables is affected significantly by
the overlying humidity of the air. The results found can then be analyzed to investigate
how they relate to the theories underlying the control of humidity on surfaces and to
decipher the effect humidity really has on the erodibility of a surface.
Texas Tech University, Joseph Massey, May 2013
11

CHAPTER II METHODS
2.1 Wind Tunnel
The wind tunnel at the USDA’s Wind Erosion and Water Conservation Research
Unit in Lubbock, Texas, was used to conduct this research. The wind tunnel is a non-
recirculating suction-type and is 10 m long, 0.5 m wide and 1 m high. The air stream
through the wind tunnel was created by an electric fan at the end of the tunnel. The fan
sucks air from the wind tunnel building, through the tunnel and over the test section. A
controller regulates the frequency of the fan’s rotation which directly affects the velocity
of the air stream in the tunnel. The first 2.5m of the wind tunnel is a convergence section,
made up of a honeycomb screen, a finer insect screen, a coarser screen with 1.3cm
diameter holes and a sloped floor and roof, which combine to aid the convergence and
straightening of the air stream entering the tunnel (Orozco, 2000). The next section of the
wind tunnel contains spires to create turbulence and a sand paper lining on the bottom,
which has approximately the same roughness as the material placed in the test section
(Ravi et al., 2006). These measures aim to recreate natural conditions within the tunnel,
as well as creating uniform conditions for every test, by promoting the creation of a
straightened, uniform wind profile. After the wind profile was modified for the test it was
passed over the test section, shown in Figure 6, which contains a hole in the tunnel floor
with a jack positioned underneath. The test tray, with the soil sample on, was placed on
the jack and the height and position was placed level with the tunnel floor.
Texas Tech University, Joseph Massey, May 2013
12

Figure 6. Photo showing the test Section of the wind tunnel, including (1) test tray with soil, (2) humidity
and temperature probe, (3) Wenglor laser particle counter, (4) Sensit impact sensor and (5) slot sampler for
the GRIMM.
Figure 6 shows the test section which contains all the measurement devices used
in the tests. Humidity was recorded every second using a probe mounted in the test
section 2mm above the surface of the soil. The humidity probe was calibrated against two
handheld humidity probes at the start of the study and was checked against the handheld
probes before each test. The temperature was also recorded at one second intervals using
the same probe to allow a comparison between temperature and variations in the
threshold shear velocity to test if temperature had a controlling effect over this process.
The wind speed was measured at a height of 50cm using a hot wire anemometer placed
directly before the material in the test section. The hot wire anemometer works by
maintaining a constant temperature for the wire in the measurement section of the probe.
When the anemometer is placed into an air stream, the air will work to cool the wire in
the device so, to maintain the constant temperature, the voltage is increased to the wire.
The voltage needed to maintain the wire’s temperature is directly related to the velocity
Texas Tech University, Joseph Massey, May 2013
13
of the flow over the device. The voltage correlated to the velocity of flow can therefore
be used to obtain an accurate measurement of air velocity at that height.
The threshold shear velocity (u*) and aerodynamic roughness lengths (z0) of the
wind profile in the wind tunnel were determined using the linear equation shown in
Equation 4. This was achieved by maintaining a constant wind speed in the tunnel and
measuring the wind speed for 30 seconds with the hot wire anemometer at 6 different
heights (1cm, 10cm, 20cm, 30cm, 50cm and 60cm). This was done for a number of wind
speeds and allowed for the calculation of the parameters of the wind profile. A linear
regression was conducted on z0 values at different wind speeds and the relationship found
between z0 and wind speed within the tunnel meant a unique z0 value could be used for
each velocity found. This was important as these z0 values were used to convert the
measured wind velocity at the threshold into a value for the threshold shear velocity (u*).
This was done by rearranging the semi-logarithmic equation from Zobeck et al. (2003) in
Equation 4 to find u*. The parameters for the equation were calculated using the
equations for the slope and the intercept in Equation 4:
(4)
where u(z) is the average wind speed (m/s-1) at height z(m), u*(m s−1) is the threshold
shear velocity; k is von Karman’s constant (0·4), a dimensionless number, and z0 (m) is
the aerodynamic roughness height.
Texas Tech University, Joseph Massey, May 2013
14

2.2 Soil Preparation
Table 1. Classification and physical properties of the 3 soils used in this study.
Soil series Soil texture % sand % silt % clay LOI Organic
matter content (%)
Brownfield Loamy fine
sand
87.4 4.2 8.4 1.15
Pullman Clay loam 34 28 38 0.24
Adrian muck Muck n/a n/a n/a 57.5
Table 1 shows information on the three soils used in this study: Brownfield sand,
Pullman clay loam and an Adrian muck. The Brownfield loamy fine sand and Pullman
clay loam were collected from sites located near Lubbock, TX, a region known for
considerable wind erosion. The Pullman clay loam was collected at the Texas Tech
University field laboratory located northeast of Lubbock (101º47’W longitude; 33º45’N
latitude) and the Brownfield loamy fine sand from a local farm field, located south of
Lubbock (102º04’W longitude; 33º16’N latitude).The Adrian muck was collected from
Newaygo County, Michigan (85º44’W longitude; 33º21’N latitude). The Brownfield
loamy fine sand was mapped as loamy sand, but a breakdown of the sand fractions
showed that it contained over 50% fine sand and it is therefore classified as a loamy fine
sand. The loamy fine sand and clay loam were used to conduct a comparison with results
found from other studies concerning the control relative humidity has on the threshold
friction velocity of soils (Ravi et al., 2004; Ravi et al., 2006). The Adrian muck was
previously unstudied in this regard and was used to analyze how the control of humidity
changes for a soil of very different composition. The effect relative humidity has on the
sediment flux from these soils after initial entrainment was also not previously
investigated. All soils collected from these locations were from the surface, top 5cm, to
ensure only soils likely to be naturally available for wind erosion were studied. Once
Texas Tech University, Joseph Massey, May 2013
15

collected, soils were air-dried and passed through a 2mm sieve before the test. This
ensured that soils were relatively uniform for each test, as the presence of large clasts
would affect the threshold recorded and disguise the influence of humidity on the soil.
Prior to each test, the soils were evenly laid out on trays and left to equilibrate with the
atmosphere in the room for a minimum of 9 hours, as shown in Figure 7. The time
allowed to equilibrate was based on information from Ravi et al. (2006) who stated that
520 minutes (8.6 hours) was the longest a soil took to reach equilibrium. The climate
parameters required for this study were all naturally obtained, using natural variations in
relative humidity to test the soils. To achieve this, the doors of the wind tunnel building
were left open for the entirety of the time the trays were left to equilibrate, to ensure the
climate within the room was as close as possible to that outside. This was important as
the air being brought from outside and passed over the sample during the test must have
the same humidity as the air in which the soils equilibrated. To obtain a wide variation of
humidity, tests were conducted at different times of the day and night on dry, cloudy,
rainy and stormy days throughout the months of May to October, to take advantage of the
strong diurnal and seasonal variability in climate in North-West Texas.
Figure 7. Photo showing Pullman clay loam and Brownfield sand left out on trays to equilibrate with the
relative humidity.
Texas Tech University, Joseph Massey, May 2013
16
2.3 Threshold Measurement
A variety of electronic saltation sensors have been developed for the high
resolution measurement of particle transport in the laboratory and in the field
(Hugenholtz and Barchyn, 2011). These sensors detect the number of particles occurring
at a given height and location within a timed measurement interval and the development
of these instruments has allowed an increasingly accurate determination of the threshold
shear velocity of a surface (Van Pelt et al., 2009). As the accurate determination of the
threshold shear velocity for the 3 soils used in this study is vital in determining the role
humidity plays in affecting particle transport from a surface, the sensor used to record
these measurements must be optimal to detect the smallest particles at the lowest
frequencies. Three types of sensors are commonly used for this task: impact detectors,
optical sensors and load cell traps (Hugenholtz and Barchyn, 2011). All previous
laboratory research studies into the role of humidity in controlling the threshold shear
velocity of soil surfaces have used impact detectors, such as the SENSIT device, to
measure the initiation of particle saltation (eg. Ravi et al., 2004; Ravi et al., 2006).
However, a major limitation of such equipment is a lack of sensitivity in detecting
particle momentum and, therefore, some particles may pass unrecorded. For this reason,
impact sensors have been shown to be most accurate in studies concerning larger, denser
particles and may not be optimal for studies, as an accurate threshold value for soils with
smaller particles, such as clay and organic soil, is required (Hugenholtz and Barchyn,
2011). In such cases, optical photoelectronic sensors, which can be camera or laser based,
have been shown to be advantageous and might be more adapted for studies such as this
one (Mikami et al., 2005).
This study compared the sensitivity of two particle sensors in determining the
threshold shear velocity of a soil surface. The two sensors studied were: (1) the SENSIT
impact sensor (Sensit model H10) and (2) Wenglor laser particle counter (Wenglor®
model YH03PCT8), both shown in Figure 8.
Texas Tech University, Joseph Massey, May 2013
17

Figure 8. (1) The Wenglor YH03PCT8 fork sensor taken from Hugenholtz and Barchyn (2011). (2) A
Sensit particle impact sensor (not the same model as the one used in the test) taken from Van Pelt et al.
(2009). All dimensions in millimeters.
The Wenglor model is a relatively new laser particle counter for detecting particle
transport and has a number of advantages when compared to previous laser counters. In
the past, photoelectronic sensors were custom built, relatively untested and expensive.
The Wenglor, however, has a consistent and durable design, is comparatively cheap, can
detect fine particles and doesn’t suffer from problems related to particle momentum
(Hugenholtz and Barchyn, 2011). For these reasons it has been tipped as a possibility for
widespread use. The Wenglor is a sealed, integrated fork-laser instrument that consists of
a U-shaped housing unit containing a laser, a photo sensor and a switching circuit
(Sherman et al., 2011). The output from the device is a digital signal which is transferred,
by wire, to an external measurement unit; in this case a data logger was used. The laser
produces a continuous light beam (30mm length and 1mm diameter) which is aimed at
the photo sensor and when this beam is interrupted by moving particles there is a drop in
laser intensity. The switching circuit acquires information from the photo sensor
regarding laser intensity and outputs a corresponding signal voltage, which corresponds
to the degree to which the beam has been interrupted by particles (Sherman et al., 2011).
This procedure is capable of counting 700-800 grains per second (Davidson-Arnott et al.,
2009).
The SENSIT device is an older piece of equipment and is the most widely used
piezo-electric saltation impact sensor in aeolian research (Stockton and Gillette, 1990).
Texas Tech University, Joseph Massey, May 2013
18

Instead of a laser, the Sensit uses piezo-electric technology to convert the impact energy
of grains into electrical impulses, which correspond to the number of grain impacts on the
device. The Sensit can be buried, mounted or suspended so that the piezo-electric sensor
ring is at the required height from the surface. The sensor ring has a 23mm outside
diameter and is 15mm in height; giving it a 345mm2 frontal impact area, regardless of
sand transport direction (Van Pelt et al., 2009). The Sensit uses amplifier circuits to
convert the electrical impulses into a loggable signal, which is then transferred from the
sensor ring to the data logger. Although an effective and widely used impact sensor, the
Sensit has been shown to be insensitive to impacts with energies less than 5x10⁻⁸ N/s,
which limits its ability to detect smaller particles (Van Pelt et al., 2009).
Both sensors were placed in the test section 216mm downwind of the material on
the test tray and were placed 100mm from the middle of the tunnel. Observing from the
tray, shown in Figure 6, the Wenglor was to the right and the Sensit was to the left. The
Sensit’s sensor ring protruded 20mm from the wind tunnel floor, measuring particle
impacts from 20mm to 35mm from the floor, and the Wenglor’s laser recorded moving
particles from 20mm to 50mm from the floor of the wind tunnel. Both were connected to
a data logger, which recorded data every second on the number of particle hits per second
and a running total of number of seconds with particles hits every minute.
For both the Wenglor and Sensit, the threshold value was taken as the wind speed
where 3 seconds of continuous particle impacts had occurred. This was decided after
discussion with Dr. T. Zobeck and Dr. J. Stout about the nature of the threshold shear
velocity. Although it is defined as the wind speed where any particle movement occurs,
in practice this is not feasible, as it would be inaccurate to assign the threshold to a wind
speed where only one particle has moved at that wind speed.
2.4 PM10 Measurement
Unlike previous studies, this study aims to investigate the control humidity has on
the mass flux of particles from a surface after initial particle entrainment. To sample the
flux of dust continuously removed from the sample, a portable aerosol spectrometer from
GRIMM technologies (Model 1.108, GRIMM GmbH) was used. The GRIMM
Texas Tech University, Joseph Massey, May 2013
19
20
instrument is commonly used in wind erosion studies (e.g., Hoffman et al., 2008) and is
an optical particle counter which utilizes laser scattering to give an accurate count of the
number of particles passing through the instrument. In the optical particle counter, each
particle is sized by the amount of incident light scattered and the particle number
concentration by optical size can be rapidly calculated from this value (Peters et al.,
2006). After the numbers of particles per liter have been counted, they are then
distributed into 15 size bins, ranging from 0.3µm to 25µm, every 6 seconds. The particles
were supplied to the instrument from the wind tunnel through a slot sampler 1m high (the
entire height of the tunnel) which had a 3.1mm wide opening, shown in Figure 1. The
cross sectional area of the slot sampler allowed the sampling of moving particles
originating from the test section at every height at the tunnel exit, as particles in
suspension, saltation and creep would all be captured by the sampler. A suction fan
aspirated the sampler, which aided the accurate sampling of particles entering the slot by
maintaining a suction rate which would correspond to the wind velocity in the tunnel, so
that particles would enter the sampler as easily as they would move down the tunnel
normally. Without this suction of air through the sampler, back pressure or air vortices
may develop in the sampler and impede particles entering the slot, giving an unrealistic
impression of dust flux. This provided a constant intake of dust laden air into the sampler,
which was connected by a sample tube to the GRIMM instrument.
When looking at dust flux, it is common to focus on particulate matter with a
mass median aerodynamic diameter of less than 10µm (PM10), as this is the material
which poses the highest health risks and is, therefore, considered the most by air quality
standard regulatory agencies and research papers (e.g., Baddock et al., 2011). To
calculate the mass flux of PM10 originating from the sample every 6 seconds from the
GRIMM data, the total volume of particles in each aerodynamic diameter size range
below 10µm first needed to be calculated for the test period. This was calculated by
multiplying the number of particles in the size range by the mean volume of one particle
in that aerodynamic size bin. The values for volume of particles in each bin were then
summed to give a total volume of PM10 for that 6 second period. From this value the total
mass of particles under 10µm can be calculated by multiplying the total volume by an
assumed value for the particle density, a value of 2.65 g cm-3 for the mineral soil and 1.75
Texas Tech University, Joseph Massey, May 2013
20

g cm-3 for the organic soil was used in this study. The properties of the organic soil used
in this study were previously described by Zobeck et al. (2012). To determine an
emission rate (mg m-2 s-1) from the value of total mass of PM10 (mg), the volume of air
passing over the sample every second (m3 s-1), and the surface area of the test section
(m2) were used. The volume of air was calculated by taking the velocity of air being
passed over the sample, which was 10.5 m/s for the clay and the sand samples and 7.5
m/s for the organic material, and multiplying this by the cross sectional area of the wind
tunnel (0.5m2). A lower wind velocity was chosen for the organic material as it was
clearly more prone to wind erosion than the other two soils and could only be measured
for roughly 10 seconds at 10.5 m/s before too much material had been removed. This
value was then divided by the surface area of the test section (0.465m2), which was the
total surface area of material available for wind erosion. The resulting value (with unit’s
m-2 s-1) was then multiplied by the total mass of PM10 (mg) to give an average emission
rate of PM10 in mg m-2 s-1 for the 6 second interval. This procedure was carried out for
every 6 second interval in the test period, giving a timescale showing how emission rate
of PM10 changed over the duration of the test period.
To allow investigate how the threshold shear velocity controlled the amount of
material removed from a surface over a given time period the mass flux was grouped into
humidity classes. This was done by averaging the flux every 6 seconds for each run at
that humidity into one average flux at that time. This was done for every 6 second time
period, until an average mass flux was derived for a whole run at that humidity. In
addition, the average peak mass and the average timing to the peak mass flux were also
determined for each particular humidity class.
2.5 Conducting the test
All tests were conducted after the soils had been left out on trays for at least 9
hours in the wind tunnel room, to allow them to equilibrate with the relative humidity.
The aforementioned equipment was turned on and allowed to warm up before the test and
the date and time was programmed into the data logger and the GRIMM, to allow a
Texas Tech University, Joseph Massey, May 2013
21

comparison of results between the two. The test tray was then placed in the wind tunnel
and adjusted to the correct height and the door to the test section was closed. The wind
speed was at first quickly increased to close to the expected threshold value and, when
single, disparate particle impacts began to occur, was increased slowly until the threshold
was found on the Wenglor (3 continuous seconds of particle impacts). After the threshold
had been found on the Wenglor, the wind speed continued to be increased until 3
continuous seconds with particle impacts was found on the Sensit. After this, the wind
speed was rapidly increased to 10.5 m/s for the sand and clay and 7.5 m/s for the organic
soil to study how the mass and rate of dust emission from the surface changes for the
same wind speed at differing humidity. Wind at these velocities was passed over the
samples for 3 minutes or until the bottom of the test tray was revealed as the material was
removed. The test had to be stopped at this point as the presence of bare areas of the tray
may affect results, by altering the wind over the sample or causing particles to behave
differently as they hit the bottom of the tray instead of other particles. The wind tunnel
was then shut off, the sample removed and the data from the data logger and the GRIMM
was downloaded and saved.
Texas Tech University, Joseph Massey, May 2013
22
CHAPTER III RESULTS AND DISCUSSION
This study investigated the effect of relative humidity of the overlying atmosphere
on the threshold shear velocity for 3 soils, which are assumed to have developed
equilibrium between surface soil moisture and the atmosphere. The sensitivity of two
particle sensors in recording the threshold shear velocity for each run was also tested, to
allow a comparison between the relatively new Wenglor device and the more established
Sensit device and derive the difference their use has on the results found. Finally, this
study examined the effect of relative humidity on the mass flux of material from each soil
after initial entrainment; to investigate the actual effect humidity has on the erodibility of
a surface. 3.1 The control of humidity on the threshold shear velocity
3.1.1 Sand and Clay Material
Following the procedure outlined in Section 2, wind tunnel tests were carried out
to assess how the threshold shear velocity of a surface varied with the overlying relative
humidity of the atmosphere. First, two soils that were previously studied (a clay loam and
a loamy fine sand) were tested and the results will then be compared to previous research.
All threshold values discussed initially were taken from the Wenglor particle sensor;
results from the Sensit will be compared later in the chapter.
Figure 9 shows a graph plotting threshold shear velocities averaged within classes
of relative humidity, ranging from 20% to 80%, for the Pullman clay loam and Figure 10
shows the same graph for the Brownfield loamy fine sand. The data was grouped into
classes of humidity at 10% intervals. This was done to allow an easier observation of
trends in the data and allowed a comparison with the grouped data in Ravi et al. (2006).
The relationship found for these two soils shows good agreement with the relationship
found from previous studies, as seen in Figure 11 which shows the relationship found by
Ravi et al. (2006) for these two soils. This relationship is made up of a high and low
section of humidity, where the threshold shear velocity increases with humidity, and a
mid-range section of humidity, where the threshold shear velocity decreases with
increased humidity. For ease, this study will refer to these sections numerically, with the
Texas Tech University, Joseph Massey, May 2013
23

first increase referred to as Section 1, the mid-range decrease as Section 2 and the final
increase as Section 3. The transitions between sections will also be referred to this way,
with the transition between Sections 1 and 2 referred to as Transition 1 and the transition
between Sections 2 and 3 referred to as Transition 2. The R2 values in Figures 9 and 10
represent how well the data points fit the relationship seen by the regression line at that
particular section, for example the R2value of 0.96 in Figure 9 represents how closely the
first four points fit the line showing the initial rise in the threshold shear velocity. Under
each graph is a table showing the equation for each line and statistics regarding the
summary of fit.
Figure 9. Threshold shear velocity (u*t) as a function of relative humidity for the Pullman clay loam.
Threshold shear velocity values were averaged into classes of humidity.
Texas Tech University, Joseph Massey, May 2013
24

Table 2. Equation for each line in Figure 9 and statistics describing the summary of fit for the Pullman clay
loam.
Section number Equation Summary of fit
Section 1 R2 0.96
Root mean square
error
0.0033
Section 2
R2 0.85
Root mean square
error
0.010
Section 3 R2 0.49
Root mean square
error
0.011
Figure 10. Threshold shear velocity (u*t) as a function of relative humidity for the Brownfield sand.
Threshold shear velocity values were averaged into classes of humidity.
Texas Tech University, Joseph Massey, May 2013
25
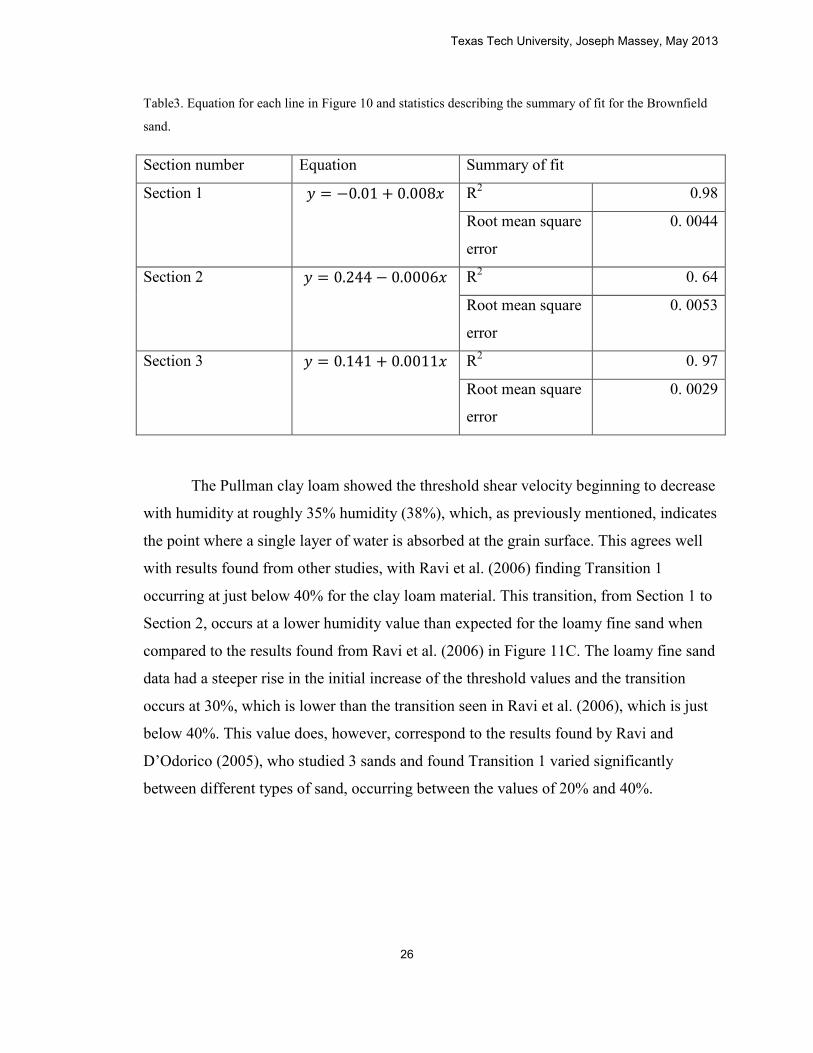
Table3. Equation for each line in Figure 10 and statistics describing the summary of fit for the Brownfield
sand.
Section number Equation Summary of fit
Section 1 R2 0.98
Root mean square
error
0. 0044
Section 2
R2 0. 64
Root mean square
error
0. 0053
Section 3 R2 0. 97
Root mean square
error
0. 0029
The Pullman clay loam showed the threshold shear velocity beginning to decrease
with humidity at roughly 35% humidity (38%), which, as previously mentioned, indicates
the point where a single layer of water is absorbed at the grain surface. This agrees well
with results found from other studies, with Ravi et al. (2006) finding Transition 1
occurring at just below 40% for the clay loam material. This transition, from Section 1 to
Section 2, occurs at a lower humidity value than expected for the loamy fine sand when
compared to the results found from Ravi et al. (2006) in Figure 11C. The loamy fine sand
data had a steeper rise in the initial increase of the threshold values and the transition
occurs at 30%, which is lower than the transition seen in Ravi et al. (2006), which is just
below 40%. This value does, however, correspond to the results found by Ravi and
D’Odorico (2005), who studied 3 sands and found Transition 1 varied significantly
between different types of sand, occurring between the values of 20% and 40%.
Texas Tech University, Joseph Massey, May 2013
26

Fig11. Threshold shear velocity (u*) as a function of relative humidity (RH) as determined by wind-tunnel
tests for two soils (A) Pullman clay loam and (C) Brownfield sand. Values of u* were averaged within
classes of RH. Taken from Ravi et al. (2006).
The second transition marks the stage at which the second layer of water is
completely absorbed onto the particles and liquid bridges begin to form. This transition,
and the two corresponding sections (2 and 3), show interesting differences between soils
and to previous studies. The Brownfield loamy fine sand data shows good agreement
with the results in Figure 11C, with both studies showing Transition 2 occurring at
roughly 65% humidity (62.3% in this study). The Section 2 data for the sand does,
however, exhibit a less steep slope in the threshold shear velocity data points throughout
the section. This resulted in higher threshold values for Sections 2 and 3 in relation to
Section 1 in this study when compared with previous results. For example, Section 2 in
this study showed a decrease of 53% compared to the initial rise in Section 1 but data
from Ravi et al. (2006) show a 72% drop compared to the initial rise. These differences
are, however, relatively minimal and overall the results from both studies show good
agreement concerning the Brownfield loamy fine sand.
The Section 2 and 3 data for the Pullman clay loam show a number of differences
when compared to the equivalent sections for the Ravi et al. (2006) study shown in
Figure 11A. The transition between Sections 2 and 3 occurred at 46% according to the
data used in this study, but a much higher humidity, roughly 65%, is seen in the data from
Ravi et al. (2006). Although the transition between Sections 2 and 3 has shifted to the
lower humidity values in this data, the overall relationship found for the clay loam in this
Texas Tech University, Joseph Massey, May 2013
27

study shows a close agreement with that found previously. Unlike the loamy fine sand,
the second section shows a similar slope to Ravi et al. (2006). The peaks and the troughs
in the data are of similar value and this gives the relationship found in this study a similar
appearance to that found by Ravi et al. (2006), the only difference being that Transition 2
occurs at a lower humidity in this study. As these are the only two studies with complete
data on this relationship, containing these high humidity values, it is difficult to decipher
the reasons behind Transition 2 occurring at a lower humidity here. It is likely due to the
different composition of the two clay soils used in the two studies. The Pullman clay
loam in this study has less sand (34% compared to 43% in Ravi et al. (2006)) and more
clay (38% compared to 31% in Ravi et al. (2006)) and these differences in soil texture are
the likely cause in the variation seen between the two studies. The higher percentage of
smaller grains in the Pullman clay loam used in this study may mean that the second layer
of water is more rapidly absorbed onto the grains, causing the change to transition 3 at a
lower humidity.
Both soils show similar sensitivity in the threshold shear velocity to the overlying
humidity of the air. This is seen in the extent of the range of u* values for the two soils,
with the clay showing a 0.032 difference in values and the sand showing a 0.042
difference. The values of u* for the Pullman and Brownfield soils in this study compared
to Ravi et al. (2006) show considerable difference. The u* values are much lower in this
study and this is most likely due to the equipment used. This will be explored later on in
the study when a comparison between the Wenglor particle sensor, used here, and the
Sensit impact sensor, used by Ravi et al. (2006), will be made.
Despite some differences between the data found here and that found previously,
both soils confirm the relationship between humidity and the threshold shear velocity of a
surface which has been previously presented. This reinforces the theory that air dry soils
do indeed exhibit this behavior, again supporting Gregory and Darwish’s (1990) model
which predicted this response from the soils and proposed that the effect of surface
tension in air dry soils is negligible.
Texas Tech University, Joseph Massey, May 2013
28

Figure 12. Threshold shear velocity (u*t) as a function of temperature (ºC) for the Brownfield sand and
Pullman clay loam. Threshold shear velocity values were averaged into classes of temperature.
As natural fluctuations in weather were used, temperature varied considerably
during the test. To ensure the relationship found for humidity and the threshold shear
velocity is applicable it is important to test if temperature had any significant effect over
the value of the threshold shear velocity found. To do this, the threshold values were
averaged into classes of temperature (at 5°C intervals), ranging from 15°C to 35°C, and
Figure 12 shows these average threshold values plotted against the equivalent
temperature class for the loamy fine sand and clay loam soils. The values for the
threshold shear velocity at higher temperatures show more variance than at lower
temperatures due to the fact that fewer data points were recorded on higher temperature
days. The graph for Pullman clay loam clearly shows that temperature had no effect over
the threshold shear velocity, as the extremely low R squared value of 0.08 shows no
relationship is apparent. The graph for Brownfield sand shows that temperature does have
a small influence over the threshold shear velocity found. A weak negative linear
relationship is seen, with threshold shear velocity decreasing with temperature. However,
the low R squared value of 0.36 suggests the relationship is not a significant one. In this
case, it can be assumed that humidity is the driving factor in controlling the threshold
shear velocity and any influence from temperature will be of secondary importance, most
likely causing the variance seen in the threshold data around the overall relationship with
humidity in Figure 10.
Texas Tech University, Joseph Massey, May 2013
29
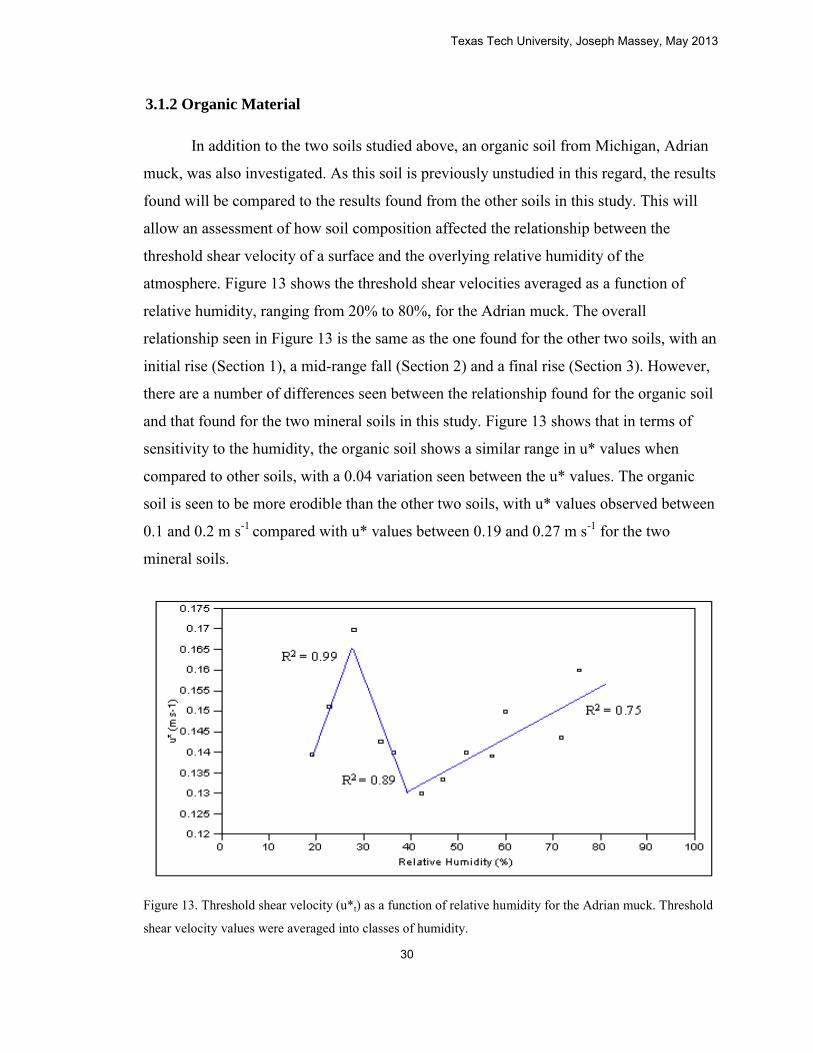
3.1.2 Organic Material
In addition to the two soils studied above, an organic soil from Michigan, Adrian
muck, was also investigated. As this soil is previously unstudied in this regard, the results
found will be compared to the results found from the other soils in this study. This will
allow an assessment of how soil composition affected the relationship between the
threshold shear velocity of a surface and the overlying relative humidity of the
atmosphere. Figure 13 shows the threshold shear velocities averaged as a function of
relative humidity, ranging from 20% to 80%, for the Adrian muck. The overall
relationship seen in Figure 13 is the same as the one found for the other two soils, with an
initial rise (Section 1), a mid-range fall (Section 2) and a final rise (Section 3). However,
there are a number of differences seen between the relationship found for the organic soil
and that found for the two mineral soils in this study. Figure 13 shows that in terms of
sensitivity to the humidity, the organic soil shows a similar range in u* values when
compared to other soils, with a 0.04 variation seen between the u* values. The organic
soil is seen to be more erodible than the other two soils, with u* values observed between
0.1 and 0.2 m s-1 compared with u* values between 0.19 and 0.27 m s-1 for the two
mineral soils.
Figure 13. Threshold shear velocity (u*t) as a function of relative humidity for the Adrian muck. Threshold
shear velocity values were averaged into classes of humidity.
Texas Tech University, Joseph Massey, May 2013
30
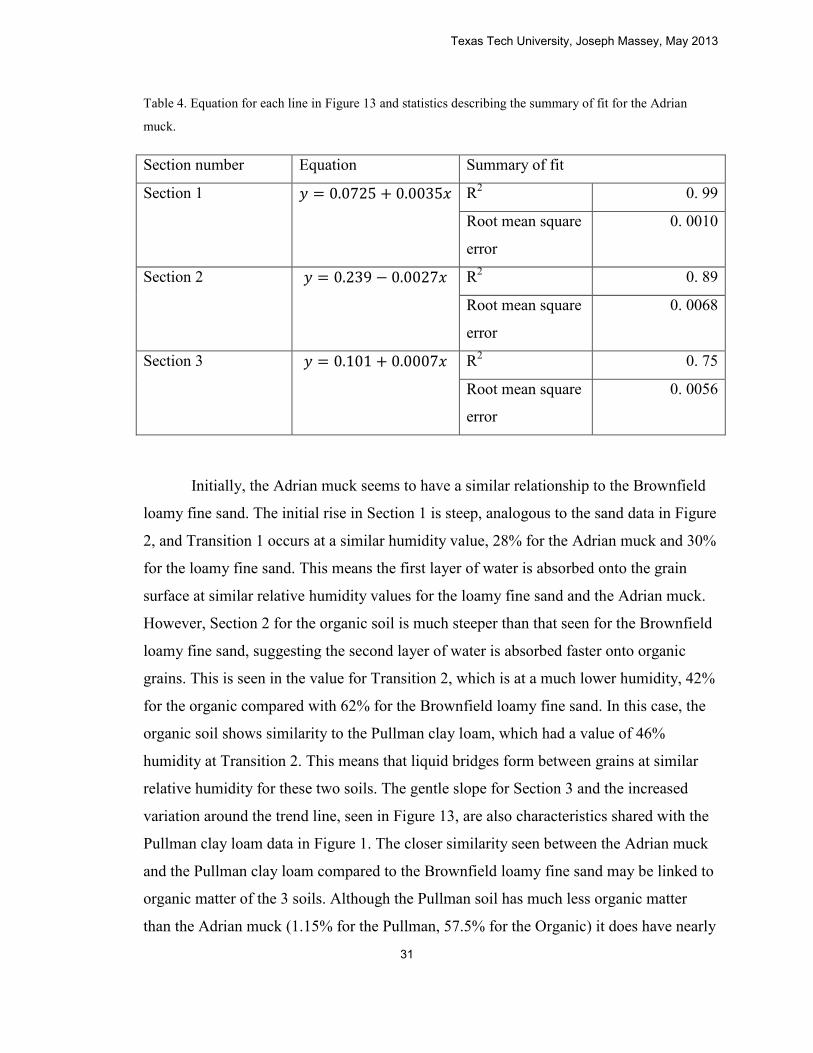
Table 4. Equation for each line in Figure 13 and statistics describing the summary of fit for the Adrian
muck.
Section number Equation Summary of fit
Section 1 R2 0. 99
Root mean square
error
0. 0010
Section 2
R2 0. 89
Root mean square
error
0. 0068
Section 3 R2 0. 75
Root mean square
error
0. 0056
Initially, the Adrian muck seems to have a similar relationship to the Brownfield
loamy fine sand. The initial rise in Section 1 is steep, analogous to the sand data in Figure
2, and Transition 1 occurs at a similar humidity value, 28% for the Adrian muck and 30%
for the loamy fine sand. This means the first layer of water is absorbed onto the grain
surface at similar relative humidity values for the loamy fine sand and the Adrian muck.
However, Section 2 for the organic soil is much steeper than that seen for the Brownfield
loamy fine sand, suggesting the second layer of water is absorbed faster onto organic
grains. This is seen in the value for Transition 2, which is at a much lower humidity, 42%
for the organic compared with 62% for the Brownfield loamy fine sand. In this case, the
organic soil shows similarity to the Pullman clay loam, which had a value of 46%
humidity at Transition 2. This means that liquid bridges form between grains at similar
relative humidity for these two soils. The gentle slope for Section 3 and the increased
variation around the trend line, seen in Figure 13, are also characteristics shared with the
Pullman clay loam data in Figure 1. The closer similarity seen between the Adrian muck
and the Pullman clay loam compared to the Brownfield loamy fine sand may be linked to
organic matter of the 3 soils. Although the Pullman soil has much less organic matter
than the Adrian muck (1.15% for the Pullman, 57.5% for the Organic) it does have nearly
Texas Tech University, Joseph Massey, May 2013
31

5 times the amount of organic material when compared to the Brownfield (which had
0.24% organic matter). The higher organic matter content of the Pullman clay loam
suggests the similarities seen in the two soils response to humidity may be due to the
presence of this organic material. Although more research would be needed to prove such
a relationship, this study shows that it is possible that increased organic matter content
could be causing a faster absorption of the second layer of water onto the grains and, in
turn, causing transition 2 to be at a lower humidity.
The effect of temperature over the threshold shear velocity was also studied for
the Adrian muck. Figure 14A shows threshold values plotted against the equivalent
temperature class for the Adrian muck.
Figure 14. A. Threshold shear velocity (u*) as a function of temperature (ºC) for the organic soil. B.
Threshold shear velocity (u*) as a function of temperature (ºC) for all values minus two possibly
anomalous values for the organic soil.
Figure 14A shows that an Order 2 polynomial relationship (R2 = 0.23) exists
between the organic soil and the associated atmospheric temperature. An Order 2
polynomial trend-line was used as it best described the fluctuation seen in the data, with a
‘valley’ in the middle part of the data. This relationship suggests that at high and low
temperature the threshold of the organic soil will be high, with mid-range temperatures
associated with a lower threshold value. However, when studying Figure 14A, it can be
seen that the strong polynomial relationship found may be due to the presence of two
values which are much higher in value than the others at the same temperature, circled in
Figure 14A. As these values may be anomalous, they were removed and Figure 14A was
Texas Tech University, Joseph Massey, May 2013
32

re-plotted, seen in Figure 14B. Although the relationship seen in Figure 14A is clearly
still apparent in 14B, it is significantly weakened by the removal of the anomalies, seen
by the reduction in R2 values from 0.23 to 0.16. This suggests that humidity is the leading
factor controlling the threshold shear velocity and temperature has a weaker secondary
effect.
In conclusion, all soils have shown that the influence of temperature over the
threshold is not as significant as the control of humidity over the threshold and it can be
concluded that any effect from temperature is superimposed onto the stronger relationship
found between humidity and the threshold shear velocity.
3.2 The sensitivity of two particles sensors in determining the threshold shear
velocity
As previously mentioned, two particle sensors were used in this test. This allowed
a comparison between the relatively new Wenglor device (Hugenholtz and Barchyn,
2011) and the more established Sensit device, which has been used in previous studies
investigating the influence of humidity on the threshold shear velocity of a surface (e.g.,
Ravi et al., 2004). The results from each sensor will be compared and the impact of any
difference will be investigated. The threshold for each device was taken as the wind
speed at which 3 seconds of continuous particle impacts were recorded. Figure 15 shows
graphs for the Pullman clay loam and the Adrian muck plotting the threshold shear
velocity (u*), calculated from both the Wenglor and Sensit devices, against the associated
relative humidity.
Texas Tech University, Joseph Massey, May 2013
33

Figure 15. Threshold shear velocity (u*t) as a function of relative humidity for the Pullman clay loam and
the Adrian muck, results shown from both the Wenglor laser particle counter and the Sensit impact sensor.
Threshold shear velocity values were averaged into classes of humidity.
It is clear from Figure 15 that the Wenglor particle sensor detected particles at a
lower wind speed for the two soils, seen by the substantially lower threshold shear
velocities in the Wenglor data (red line). The difference seen between the two sensors is
similar for the Pullman clay loam and Adrian muck, with an average difference in u*
between the two sensors of 0.061 m s-1 and 0.077 m s-1 respectively. This corresponds to
an average difference in the wind speed recorded at the threshold of 1.79 m s-1 for the
Pullman clay loam and 1.80m s-1 for the Adrian muck. As the wind speeds recorded for
Texas Tech University, Joseph Massey, May 2013
34

these two soils were in the range of 4.0-7.5 m s-1 this difference between sensors could
have a substantial impact on results. This is seen when calculating the percentage of the
difference in relation to the recorded wind speed. Using the sensit, the threshold recorded
for the Pullman clay loam was on average 25% higher than the value recorded on the
Wenglor. Due to the lower wind speeds at the threshold for the Adrian muck, as this soil
was much more susceptible to erosion, the threshold recorded using the Sensit is on
average 38% higher than the value found by the Wenglor. The higher difference between
devices for the Adrian muck was due to the error found between the devices having a
larger percentage effect over the lower wind speed. These disparities between the
Wenglor and Sensit data are considerable and could have led to inaccurate data in past
studies, where the Sensit device was used alone.
Despite these differences in the value for u* found between the Sensit and the
Wenglor sensors for the Pullman clay loam and Adrian muck, the overall relationship
between the threshold shear velocity and the relative humidity was similar from both
sensors. This is seen when looking at Figure 15, with both graphs showing clear
similarities between the lines in terms of shape. The degree of this similarity is seen in
Figure 16, which shows a linear regression comparing the threshold shear velocity found
from the Sensit with that found from the Wenglor for the Pullman clay loam and the
Adrian muck. As expected, both show a positive linear relationship, a higher u* from the
Sensit is accompanied with a higher u* on the Wenglor. However the R2 values of 0.41
and 0.31, for the Adrian and the Pullman respectively, show that this relationship is not a
particularly strong one, meaning relatively large differences are seen in the relationship
found from the two sensors. This is important, as this shows that the choice of sensor will
not only affect the values found for the threshold shear velocity but will also, to some
extent, alter the overall relationship seen.
Texas Tech University, Joseph Massey, May 2013
35

Figure 16. Linear regression comparing the u* (m s-1) found from the Wenglor with that found from the
Sensit for the Pullman clay loam and the Adrian muck.
Figure 17. Threshold shear velocity (u*) as a function of relative humidity for the Brownfield sand, results
shown from both the Wenglor laser particle counter and the Sensit impact sensor. U* values were averaged
into classes of humidity.
Figure 17 shows the relationship of threshold shear velocity (u*), calculated from
both the Wenglor and Sensit devices, and relative humidity for the Brownfield loamy fine
sand. This soil has been discussed separately as different results were found when
comparing the Wenglor to the Sensit. Similarly to Figure 15, Figure 17 shows that the
Wenglor particle sensor detected particles at lower wind speeds. However, the difference
between the threshold found from the Wenglor and that from the Sensit was substantially
larger for the Brownfield sand, with an average difference of 0.12 m s-1, when compared
Texas Tech University, Joseph Massey, May 2013
36

to the other two soils, which had differences of 0.061 m s-1 and 0.077 m s-1. This
corresponds to an average difference in the wind speed recorded at the threshold of 2.86
m s-1. The magnitude of this is seen when calculating the percentage of the difference in
relation to the recorded wind speed. When using the Sensit, the threshold recorded for the
Brownfield loamy fine sand was, on average, 44.6% higher than if using the Wenglor.
This is substantially higher than the percentage increase found for the Pullman clay loam
(25%) and still higher than that found for the Adrian muck (38%) which, due to the
thresholds being at a lower wind speed, has shown a high percentage difference between
the Sensit and the Wenglor. This shows that the Sensit was particularly insensitive when
recording the threshold for loamy fine sand. Unlike the previous soils, the Brownfield
loamy fine sand shows a larger difference between sensors concerning the overall
relationship between the threshold shear velocity and the relative humidity. This is seen
in Figure 18, which shows a linear regression comparing the u* (m s-1) found from the
Wenglor with that found from the Sensit for the Brownfield sand. The extremely low R2
of 0.04 shows no relationship was observed between the threshold recorded from the two
sensors, meaning the choice of sensor will likely dramatically change results when
working with the Brownfield loamy fine sand. However, the difference between the
relationships found from the sensors may be less than first thought. If the 4th point in the
Sensit data is removed from Figure 17, the same overall relationship as that seen for
previous soils and in previous research between the threshold shear velocity and the
relative humidity is apparent.
Texas Tech University, Joseph Massey, May 2013
37

Figure 18. Linear regression comparing the u* (m s-1) found from the Wenglor with that found from the
Sensit, for the Brownfield sand.
When comparing the data found in this study to that found by Ravi et al. (2006) it
is seen that the threshold values found in Ravi et al. (2006) were in fact even higher than
those recorded by the Sensit in this study. On average the u* values for the Pullman clay
loam from Ravi et al. (2006) were 82% higher than the results from the Sensit in this
study and 130% higher than the threshold values found from the Wenglor in this study.
The Brownfield loamy fine sand shows similar values, with results from Ravi et al.
(2006) on average 63% higher than the results found from the Sensit in this study and
147% higher than the values for the threshold found from the Wenglor. These differences
are considerable and are due to the equipment used, as seen in the disparity between the
Sensit and the Wenglor in this study, and also due to how the threshold shear velocity
was defined. The 82% and 64% average increases in results from the Sensit seen when
comparing this study to Ravi et al. (2006) is most likely due to the fact that Ravi et al.
(2006) defined the threshold as the wind speed at which 100 grain impacts per second
were recorded on the Sensit. In this study we decided that 3 seconds with continuous
grain impacts would give a more accurate representation of the threshold from the 2
sensors used. Although this difference in definition was shown to have significant effects
over the values for the threshold shear velocity it didn’t affect the overall relationship
found. Therefore, the choice of sensor and the choice of how to define the threshold are
important decisions, as they have been shown to affect the values of the threshold.
However, despite these changes, this study has shown that, with a different choice of
Texas Tech University, Joseph Massey, May 2013
38

sensor, the same overall relationship is found between the threshold shear velocity and
the relative humidity.
3.3 The control of humidity on the mass flux of material
For the first time, this study aims to investigate the effect humidity has on the
erodibility of a surface over a sustained period of time. To achieve this, I studied the
effect relative humidity has on the mass flux of material from each soil, after initial
entrainment. All soils had wind passed over them at a certain speed (10.5m/s for the
Pullman clay loam and Brownfield loamy fine sand and 7.5m/s for the Adrian muck) for
a given amount of time and the flux of material was recorded using the GRIMM device.
This allowed an examination of how relative humidity affects the amount and timing of
the removal of material from a surface. To achieve this, data from the GRIMM
concerning total mass, peak mass and time to peak mass were analyzed for each soil.
3.3.1 Control of the threshold shear velocity over the total mass of material removed
To investigate the effect, if any, the recorded threshold shear velocity had over the
amount of material removed from a surface over a given time period, a linear regression
was conducted between average total mass, grouped into classes of humidity, and the
average threshold shear velocity at that humidity. The mass flux was grouped into
humidity classes by averaging the flux every 6 seconds for each run at that humidity into
one average flux at that time. This is done for every 6 second time period, until an
average mass flux was derived for a whole run at that humidity. In addition, the average
peak mass and the average timing to the peak mass flux were also determined for each
particular humidity class. The humidity classes, the threshold shear velocity for each
class and the associated data on mass flux can be seen in Table 5. Figure 19 shows the
linear regression for the 3 soils studied. Figure 19 shows that for the Pullman clay loam
and the Brownfield loamy fine sand a weak, negative linear relationship exists between
the threshold and the total mass. The relationship found is what would be expected, with
the lower threshold shear velocity of the surface causing more material to be removed at
the same wind speed within the same time period. However, the low R2 values for both
the soils (0.26 for the Pullman and 0.23 for the Brownfield) show that this relationship is
Texas Tech University, Joseph Massey, May 2013
39

not a strong one and, when looking at the individual data points around the trend line, a
high degree of variation is seen between points only 5-10% humidity apart. This suggests
that for these two soils the threshold has, at most, a very minor impact over the amount of
material actually removed from the surface and it is likely no relationship exists at all.
Figure 19 also shows the linear regression for the Adrian soil concerning the relationship
between total mass and threshold shear velocity. For this soil, no relationship is seen
regarding the threshold shear velocity and the total mass removed over the course of the
test period, displayed by the extremely low r2 value of 0.006. In this case, the threshold
has no impact over the mass flux of material over time and, therefore, the threshold may
be unimportant in attempting to classify how susceptible a surface may be to erosion over
an extended time period.
Texas Tech University, Joseph Massey, May 2013
40
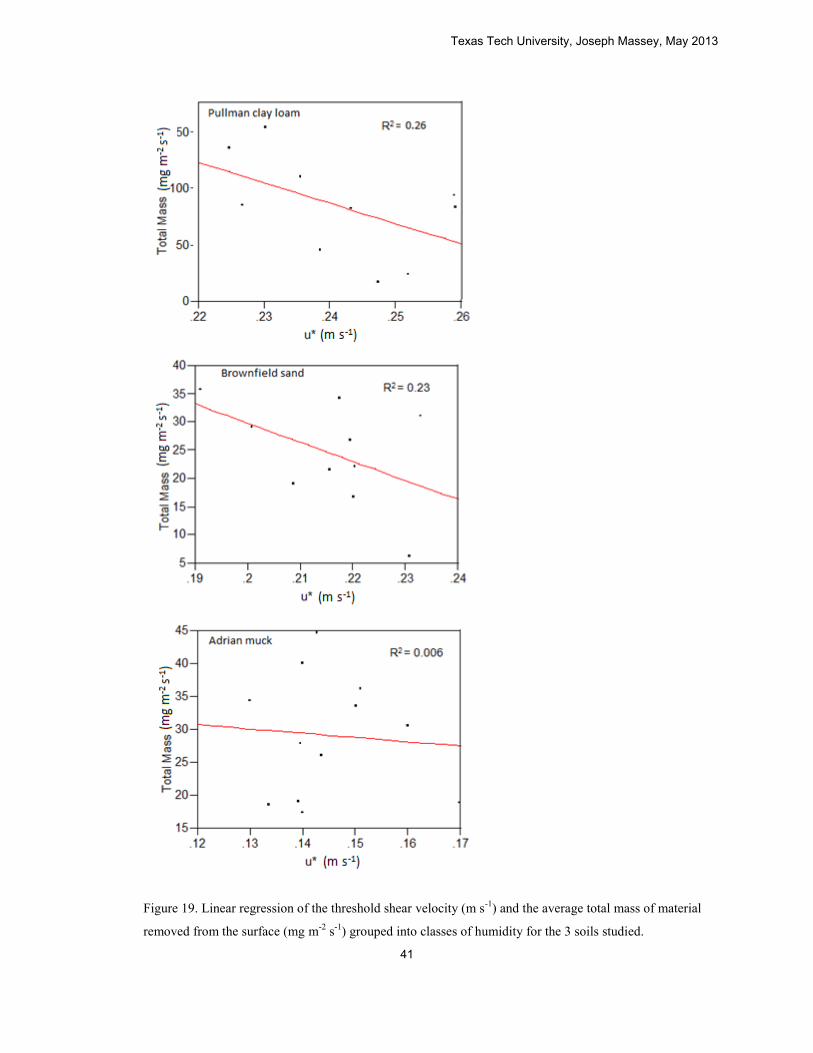
Figure 19. Linear regression of the threshold shear velocity (m s-1) and the average total mass of material
removed from the surface (mg m-2 s-1) grouped into classes of humidity for the 3 soils studied.
Texas Tech University, Joseph Massey, May 2013
41
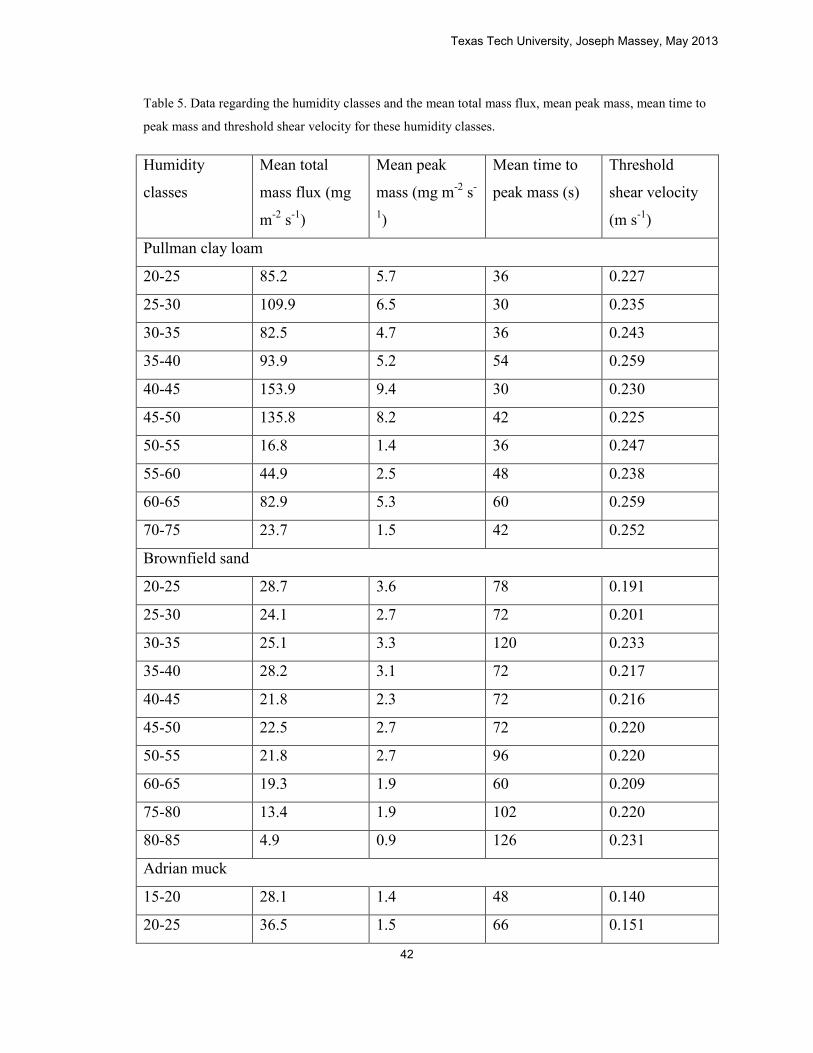
Table 5. Data regarding the humidity classes and the mean total mass flux, mean peak mass, mean time to
peak mass and threshold shear velocity for these humidity classes.
Humidity
classes
Mean total
mass flux (mg
m-2 s-1)
Mean peak
mass (mg m-2 s-
1)
Mean time to
peak mass (s)
Threshold
shear velocity
(m s-1)
Pullman clay loam
20-25 85.2 5.7 36 0.227
25-30 109.9 6.5 30 0.235
30-35 82.5 4.7 36 0.243
35-40 93.9 5.2 54 0.259
40-45 153.9 9.4 30 0.230
45-50 135.8 8.2 42 0.225
50-55 16.8 1.4 36 0.247
55-60 44.9 2.5 48 0.238
60-65 82.9 5.3 60 0.259
70-75 23.7 1.5 42 0.252
Brownfield sand
20-25 28.7 3.6 78 0.191
25-30 24.1 2.7 72 0.201
30-35 25.1 3.3 120 0.233
35-40 28.2 3.1 72 0.217
40-45 21.8 2.3 72 0.216
45-50 22.5 2.7 72 0.220
50-55 21.8 2.7 96 0.220
60-65 19.3 1.9 60 0.209
75-80 13.4 1.9 102 0.220
80-85 4.9 0.9 126 0.231
Adrian muck
15-20 28.1 1.4 48 0.140
20-25 36.5 1.5 66 0.151
Texas Tech University, Joseph Massey, May 2013
42
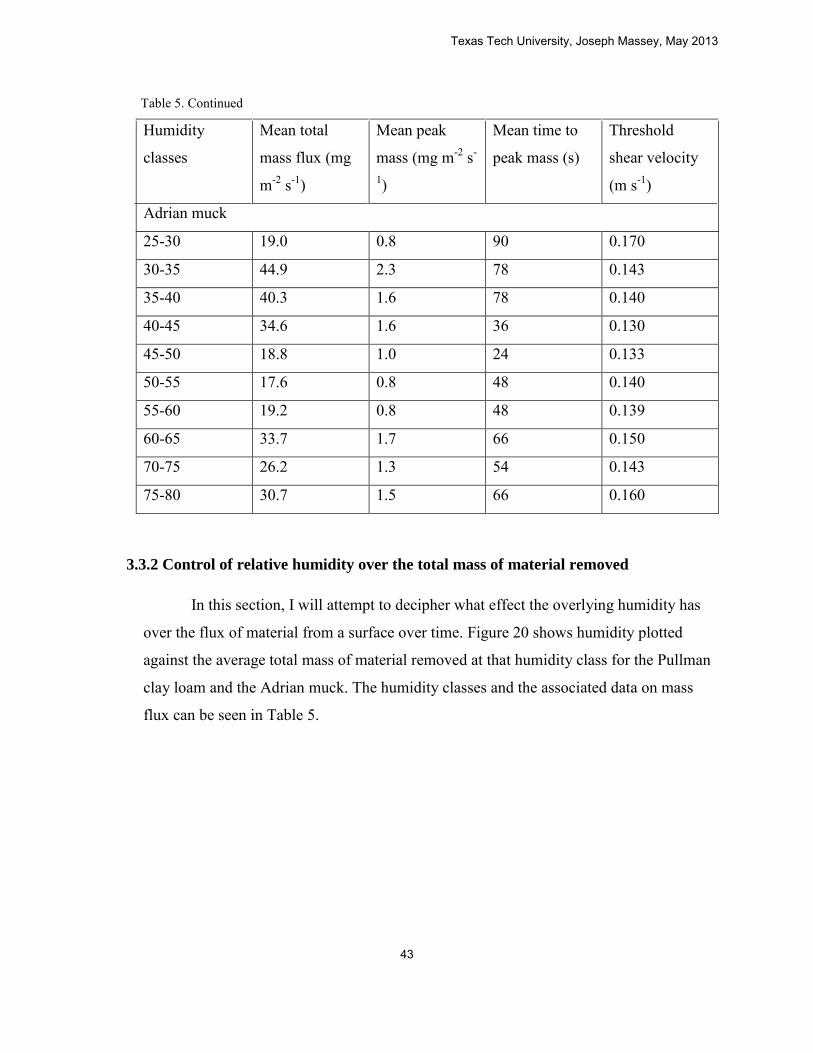
25-30 19.0 0.8 90 0.170
30-35 44.9 2.3 78 0.143
35-40 40.3 1.6 78 0.140
40-45 34.6 1.6 36 0.130
45-50 18.8 1.0 24 0.133
50-55 17.6 0.8 48 0.140
55-60 19.2 0.8 48 0.139
60-65 33.7 1.7 66 0.150
70-75 26.2 1.3 54 0.143
75-80 30.7 1.5 66 0.160
3.3.2 Control of relative humidity over the total mass of material removed
In this section, I will attempt to decipher what effect the overlying humidity has
over the flux of material from a surface over time. Figure 20 shows humidity plotted
against the average total mass of material removed at that humidity class for the Pullman
clay loam and the Adrian muck. The humidity classes and the associated data on mass
flux can be seen in Table 5.
Table 5. Continued
Humidity
classes
Mean total
mass flux (mg
m-2 s-1)
Mean peak
mass (mg m-2 s-
1)
Mean time to
peak mass (s)
Threshold
shear velocity
(m s-1)
Adrian muck
Texas Tech University, Joseph Massey, May 2013
43
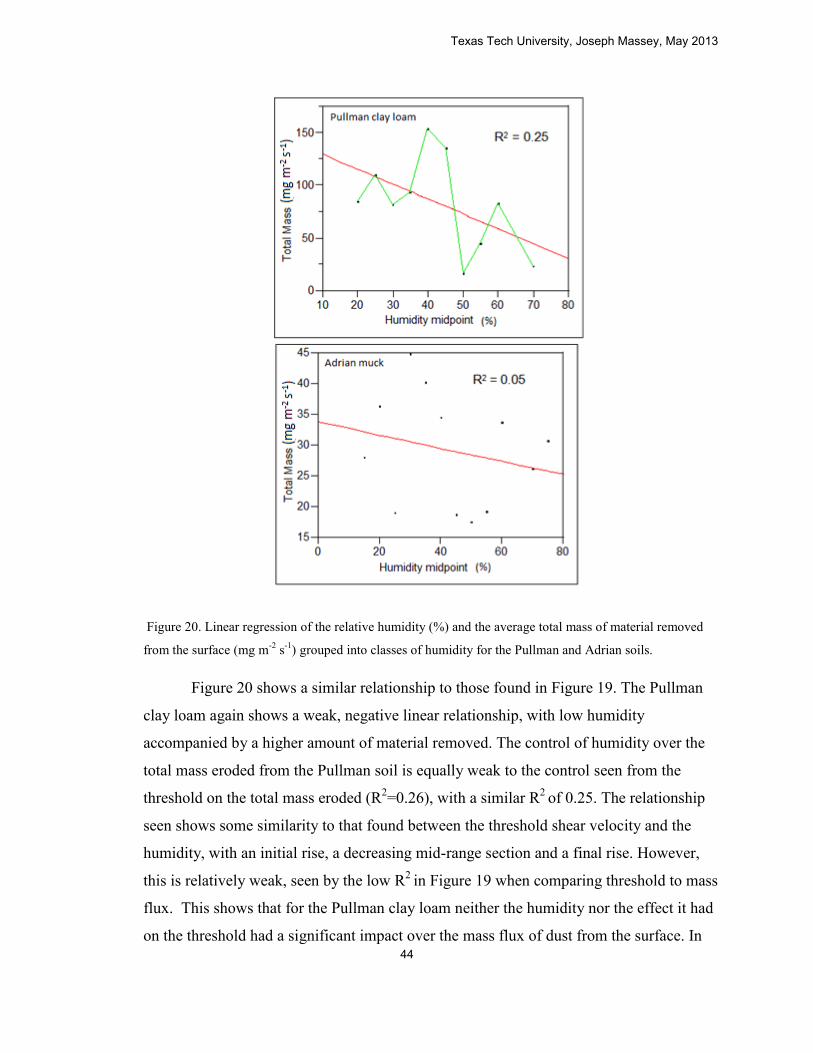
Figure 20. Linear regression of the relative humidity (%) and the average total mass of material removed
from the surface (mg m-2 s-1) grouped into classes of humidity for the Pullman and Adrian soils.
Figure 20 shows a similar relationship to those found in Figure 19. The Pullman
clay loam again shows a weak, negative linear relationship, with low humidity
accompanied by a higher amount of material removed. The control of humidity over the
total mass eroded from the Pullman soil is equally weak to the control seen from the
threshold on the total mass eroded (R2=0.26), with a similar R2 of 0.25. The relationship
seen shows some similarity to that found between the threshold shear velocity and the
humidity, with an initial rise, a decreasing mid-range section and a final rise. However,
this is relatively weak, seen by the low R2 in Figure 19 when comparing threshold to mass
flux. This shows that for the Pullman clay loam neither the humidity nor the effect it had
on the threshold had a significant impact over the mass flux of dust from the surface. In
Texas Tech University, Joseph Massey, May 2013
44
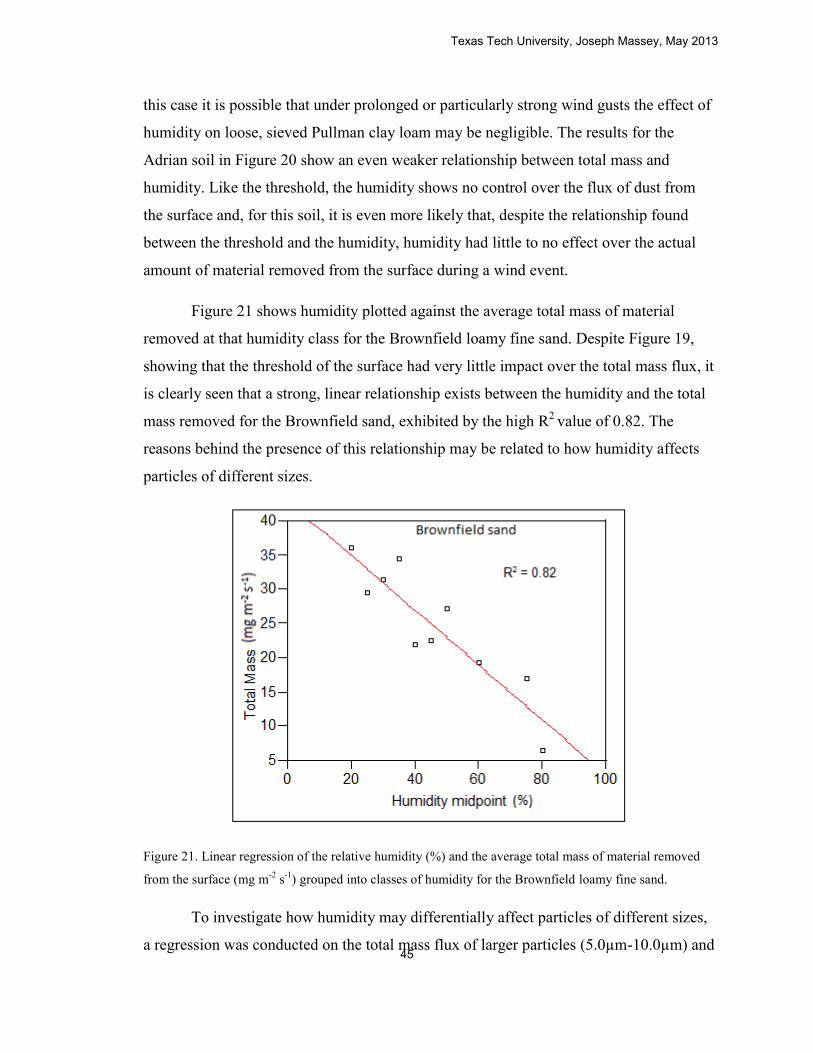
this case it is possible that under prolonged or particularly strong wind gusts the effect of
humidity on loose, sieved Pullman clay loam may be negligible. The results for the
Adrian soil in Figure 20 show an even weaker relationship between total mass and
humidity. Like the threshold, the humidity shows no control over the flux of dust from
the surface and, for this soil, it is even more likely that, despite the relationship found
between the threshold and the humidity, humidity had little to no effect over the actual
amount of material removed from the surface during a wind event.
Figure 21 shows humidity plotted against the average total mass of material
removed at that humidity class for the Brownfield loamy fine sand. Despite Figure 19,
showing that the threshold of the surface had very little impact over the total mass flux, it
is clearly seen that a strong, linear relationship exists between the humidity and the total
mass removed for the Brownfield sand, exhibited by the high R2 value of 0.82. The
reasons behind the presence of this relationship may be related to how humidity affects
particles of different sizes.
Figure 21. Linear regression of the relative humidity (%) and the average total mass of material removed
from the surface (mg m-2 s-1) grouped into classes of humidity for the Brownfield loamy fine sand.
To investigate how humidity may differentially affect particles of different sizes,
a regression was conducted on the total mass flux of larger particles (5.0µm-10.0µm) and
Texas Tech University, Joseph Massey, May 2013
45

humidity and the total mass flux of smaller particles (0.30µm-5.0µm) and humidity,
shown in Figure 22.
Figure 22. Linear regression (Left) of the total mass flux of larger particles (5.0µm-10.0µm) (mg m-2 s-1)
and humidity and (Right) of the total mass flux of smaller particles (0.30µm-5.0µm) (mg m-2 s-1) and
humidity for the Brownfield loamy fine sand.
From Figure 22 it can be seen that the smaller particle flux shows a similar
relationship to the total particle mass flux, seen in Figure 21, with a negative linear
relationship with humidity. However, the larger particles show a very different
relationship. Figure 23 shows an overlay line graph of larger particle total mass and the
threshold wind velocity and how they are affected by humidity. It can be seen in Figure
23 that large particles mass flux is inversely related to the threshold, higher thresholds
mean less larger particles are removed and lower thresholds are accompanied by a higher
flux of larger particles. From these data, it can be theorized that at lower humidity, where
less water is absorbed at the surface, larger grains preferentially absorb water over
smaller grains. At lower humidity, where it is likely that larger particles absorb a higher
percentage of the available moisture from humidity, smaller particles show a high mass
flux, as they are relatively unaffected by the overlying humidity. At this point the
threshold of the surface would be controlled by the larger particles binding the surface
together. After this threshold is passed, and movement begins to occur, the smaller
particles are presumably loosened up and readily available for transport, causing a high
flux at low humidity. As the humidity increases, more moisture is available and the
smaller grains absorb more water, increasing their resistance to wind erosion. This causes
a lower mass flux of smaller grains from the surface as humidity increases, seen in Figure
Texas Tech University, Joseph Massey, May 2013
46

22. As smaller particles make up the majority of material removed from the surface, an
overall reduction in the total mass flux of particles from the surface accompanies this
reduction in smaller particles. This explains how the total mass flux for the Brownfield
sand can be relatively unaffected by the threshold yet strongly controlled by humidity.
Figure 23. An overlay line graph showing how the total mass flux of larger particles (5.0-10µm )(mg m-2 s-
1) and the threshold wind velocity change with humidity for the Brownfield sand.
Due to no clear relationship seen between the total mass flux of material and the
relative humidity for the Pullman clay loam and the Adrian muck, seen in Figure 20, if
this process is occurring in these soils it is not having a noticeable effect on the total mass
flux from the surface. This is likely due to the much lower percentage of larger grains in
these soils. However, to see if there was any evidence that larger particles were more
influenced by humidity than smaller particles in these soils, the total mass flux of
particles 5.0-10µm was plotted against humidity for these two soils, shown in Figures 24
and 25.
Texas Tech University, Joseph Massey, May 2013
47

Figure 24. An overlay line graph showing how the total mass flux of larger particles (5.0-10µm )(mg m-2 s-
1) and the threshold wind velocity change with humidity for the Adrian muck.
Figure 25. An overlay line graph showing how the total mass flux of larger particles (5.0-10µm ) (mg m-2 s-
1) and the threshold wind velocity change with humidity for the Pullman clay loam.
Figure 24 shows that the Adrian muck exhibited a similar relationship between
the total mass flux of larger particles and the threshold shear velocity to the Brownfield
Texas Tech University, Joseph Massey, May 2013
48

soil, with the mass flux shown to be inversely related to the threshold shear velocity. This
relationship is however only apparent at lower humidity values (15-60%) as Figure 24
shows that at the higher humidity values (60-80%) a rise in the threshold is accompanied
by a rise in the mass flux of larger particles. This shows that the theory that the mass flux
of large particles is more affected by the threshold of the surface, and therefore humidity,
due to increased moisture around these particles, may be applicable to the Adrian soil as
well. This is backed up by the fact that the flux of small particles shows no relationship to
the threshold of the surface, exhibiting the same behaviour as seen in Figure 20 showing
the overall mass flux from the surface, due to small particles making up the majority of
flux (87.9%) from the soil. This higher flux of small particles means that this relationship
is hidden when looking at the total mass flux from the surface, shown in Figure 20.
Figure 25 shows that the Pullman clay loam does not exhibit the behaviour seen
by the Brownfield sand and the Adrian muck concerning larger particle flux and
threshold shear velocity. In fact, the smaller particles (0.30µm-5.0µm) and the large
particles (5.0µm-10.0µm) show an extremely similar relationship and this leads to the
total mass flux also showing this same relationship, seen when comparing Figure 20 to
the blue line in Figure 25. It can be theorized that this is due to the even size distribution
in this soil (34% sand, 28% silt, 38% clay) meaning that the moisture gained from the
atmosphere is more likely to be evenly distributed across the particles, due to less large
particles preferentially gaining water.
3.4 Control of humidity over the time to peak mass flux
The previous sections have shown that the threshold shear velocity of a surface
has very little effect over the mass flux of material from a surface. Furthermore, for the
Pullman and Adrian soils, humidity has also been shown to have minimal control over
the mass flux from a surface. This final section will investigate if the threshold shear
velocity has any effect on how quickly material is removed from the surface. The time to
peak mass flux was taken as the number of seconds taken, once the wind speed had
become constant, for the mass flux to reach its maximum value.
Texas Tech University, Joseph Massey, May 2013
49
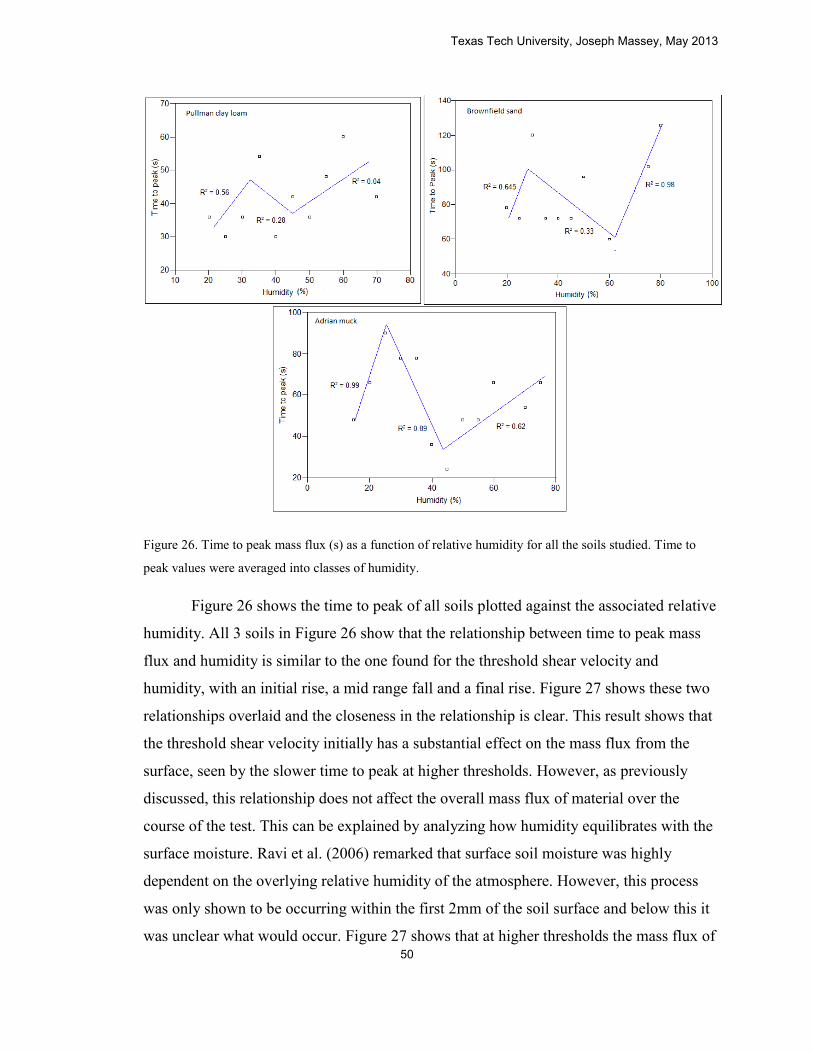
Figure 26. Time to peak mass flux (s) as a function of relative humidity for all the soils studied. Time to
peak values were averaged into classes of humidity.
Figure 26 shows the time to peak of all soils plotted against the associated relative
humidity. All 3 soils in Figure 26 show that the relationship between time to peak mass
flux and humidity is similar to the one found for the threshold shear velocity and
humidity, with an initial rise, a mid range fall and a final rise. Figure 27 shows these two
relationships overlaid and the closeness in the relationship is clear. This result shows that
the threshold shear velocity initially has a substantial effect on the mass flux from the
surface, seen by the slower time to peak at higher thresholds. However, as previously
discussed, this relationship does not affect the overall mass flux of material over the
course of the test. This can be explained by analyzing how humidity equilibrates with the
surface moisture. Ravi et al. (2006) remarked that surface soil moisture was highly
dependent on the overlying relative humidity of the atmosphere. However, this process
was only shown to be occurring within the first 2mm of the soil surface and below this it
was unclear what would occur. Figure 27 shows that at higher thresholds the mass flux of
Texas Tech University, Joseph Massey, May 2013
50

material was initially constrained by the high moisture content of the top 2mm of the
surface soil and the time to peak mass flux is higher. In contrast, low thresholds have a
lower time to peak flux, due to lower moisture content at the surface allowing a faster
removal of material. However, as Figure 19 shows, this does not affect the total mass flux
of material from the surface. This occurs due to the exposure of deeper, underlying soil
being exposed, which is unaffected by the overlying humidity, once the top 2mm of the
soil is removed by the wind. At this stage the initial threshold of the surface is no longer
applicable and a new threshold for the surface is developed, affected not by humidity but
by other factors.
Figure 27. An overlay line graph showing how the time to peak mass flux and the threshold shear velocity
change with humidity.
Finally, Figure 28 shows a non-linear regression of the time to peak mass flux and
the threshold shear velocity. The relationship between these two factors can now be
clearly seen. The threshold shear velocity had a relatively strong control over the time it
Texas Tech University, Joseph Massey, May 2013
51

took for the mass flux to peak, with loamy fine sand showing the closest relationship, r2
of 0.81, the clay loam the next, r2 of 0.69 and the organic last, with still a relatively high
r2 of 0.59. For the Pullman and Brownfield soils, a positive, polynomial concave
relationship is seen. This means that the threshold shear velocity affects the time to peak
mass flux increasingly at higher values for the threshold. The increased shear velocity,
due to increased moisture, exponentially impedes the removal of the initial 2mm of soil at
the surface, which in turn, increases the time to peak mass flux. The results for the
organic soil in Figure 28 show that the initial threshold shear velocity has less of an effect
over the time to peak mass flux. In this case, a positive, polynomial convex relationship is
seen. This means that, at increasing threshold shear velocity values, the threshold has less
of an effect over the susceptibility of the top 2mm of the soil surface to be eroded and,
therefore, the time to peak mass flux. This may be due to the increased organic matter of
the soil or the soil texture but more research into why this relationship is different for this
soil would be needed. Linear regression was conducted on the peak mass flux and the
threshold shear velocity but was found to be a weaker description of the relationship, with
r2 values of 0.45, 0.47 and 0.55 for the Pullman, Brownfield and Adrian soils
respectively.
Texas Tech University, Joseph Massey, May 2013
52

Figure 28. Linear regression of the time to peak mass flux (s) and the threshold shear velocity (m s-1) for
the soils studied.
These results explain why no relationship between the threshold shear velocity
and the total mass flux of material is apparent; but a strong relationship is apparent for the
time to peak and the humidity. This result is vital for any research attempting to classify a
surface’s erodibility by using humidity. In this case, the relationship seen in Figures 9, 10
and 13 between the threshold shear velocity and the relative humidity is applicable, but
only when looking at the initial threshold of the surface or over a short amount of time.
Anything beyond this, where surfaces are likely to experience wind erosion, the threshold
of the surface, and therefore mass flux of material, will be more or less independent from
the overlying humidity of the atmosphere, until enough time of no erosion has occurred to
allow the surface to again equilibrate with the atmosphere.
Texas Tech University, Joseph Massey, May 2013
53

CHAPTER IV CONCLUSION
In conclusion, this study supports the relationship first predicted by Gregory and
Darwish (1990) and first presented by Ravi et al. (2006) concerning the threshold shear
velocity and the relative humidity of the air. This relationship, presented here in Figures
9, 10 and 13, has been theorised to be related to the absorption of water at the grain
surface and associated changes in the matric potential, both of which substantially affect
the threshold shear velocity of a surface. Building on this, a comparison between two
particle sensors, the Wenglor and the Sensit, was then presented, to investigate what
effect their use had on the recorded threshold. This was important, as all previous studies
had used the Sensit alone. It was found that whilst the previously used Sensit was much
less sensitive to particle impact, with a consistently higher threshold value compared to
the Wenglor, its use did not significantly affect the relationship found between the
threshold shear velocity and the humidity.
After this, for the first time, this study aimed to investigate the effect humidity has
on the erodibility of a surface over a sustained period of time, by studying mass flux data
from these soils. It was found that the threshold shear velocity had, at most, minimal
impact over the total mass of material removed over a given time period. For the Pullman
and Adrian soils this was also seen when analysing the affect humidity had on the total
mass flux, with humidity having a minimal control over particle emission. However, it
was found for the Brownfield sand that total mass flux was inversely related to humidity,
an unexpected result. This was explained by theorising that the higher percentage of
larger grains in this soil preferentially absorbed water from the atmosphere when
compared to smaller grains. This lead to smaller particles, which were still the majority of
emitted particles, having high flux at lower humidity, which then decreased as humidity
rose, due to more water available in the soil. The process of larger particles absorbing
more water was seen in the Adrian soil but was hidden by the much larger percentage of
smaller particles in this soil. Finally, this study analysed the control of humidity on the
time it takes for mass flux to reach its peak value. It was found that the threshold shear
velocity had a substantial control over the time to mass flux. However, as Figure 19
shows, this did not affect the total mass flux of material from the surface. This showed
Texas Tech University, Joseph Massey, May 2013
54

that the overlying humidity of the air only affected the grains at the surface (≈top 2mm).
Under prolonged wind erosion, when the deeper, unaffected soil was exposed, the initial
threshold of the surface was no longer apparent at the surface and a new threshold was
developed, affected not by humidity but by other factors.
These results show that humidity has a considerable effect on a soil surface, with
a number of processes which alter its susceptibility to wind erosion occurring. However,
perhaps more importantly, this study showed that this control from humidity is likely to
change over the course of wind erosion, a fact that must be considered by anyone using
humidity to classify a surface’s erodibility.
Texas Tech University, Joseph Massey, May 2013
55

REFERENCES
Baddock, M.C., Zobeck, T.M., Van Pelt, R.S., and Fredrickson, E.L., 2011, Dust
emissions from undisturbed and disturbed, crusted playa surfaces: Cattle trampling
effects, Aeolian Research, 3, 31-41.
Bagnold, R. A., 1941, The Physics of Blown Sand and Desert Dunes, 265 pp., Methuen,
London.
Chepil, W. S., 1945, Dynamics of wind erosion: I. Nature of movement of soil by wind,
Soil Science, 60, 305–320.
Chepil, W. S., 1953, Field structure of cultivated soils with special reference to
erodibility by wind, Soil Science Society of America Proceedings, 17, 185–190.
Cornelis, W.M., 2002, Erosion process of dry and wet sediment induced by wind and
wind driven rain: a wind-tunnel study, PhD Dissertation, Ghent University, Ghent,
Belgium.
Cornelis, W.M., and Gabriels, D., 2003, The effect of surface moisture on the
entrainment of dune sand by wind: an evaluation of selected models, Sedimentology,
50, 771–790.
Cornelis, W. M., Gabriels, D. and Hartmann, R., 2004, A conceptual model to predict the
deflation threshold shear velocity as affected by near‐surface soil water: I. Theory,
Soil Science Society of America Journal, 68, 1154–1161.
Davidson-Arnott, R.G.D., Bauer, B.O., Walker, I.J., Hesp, P.A., Ollerhead, J., and
Delgado-Fernandez, I., 2009, Instantaneous and mean Aeolian sediment transport
rate on beaches: an intercomparison of measurements from two sensor types,
Journal of Coastal Research, SI56, 297-301.
Texas Tech University, Joseph Massey, May 2013
56
De Oro, L.A. and Buschiazzo, D.E., 2009, Threshold wind velocity as an index of soil
susceptibility to wind erosion under variable climatic conditions, Land degradation
and development, 20, 14-21.
Gregory, J.M., and Darwish, M.M., 1990, Threshold friction velocity prediction
considering water content, American Society of Agricultural Engineering, New
Orleans, LA, Paper 90-2562, 18 pp.
Hoffman, C., Funk, R., Sommer, M., and Li, Y., 2008, Temporal variations in PM10 and
particle size distribution during Asian dust storms in Inner Mongolia, Atmospheric
Environment, 42, 8422-8431.
Hugenholtz, C.H. and Barchyn, T.E., 2011, Laboratory and field performance of a laser
particle counter for measuring aeolian sand transport, Journal of Geophysical
Research, 116, F01010.
Iversen, J.D., and White, B.R., 1982, Saltation threshold on Earth, Mars and Venus,
Sedimentology, 29, 111–119.
Marticorena, B., and Bergametti, G., 1995, Modeling the atmospheric dust cycle: 1.
Design of a soil derived dust scheme, Journal of Geophysical Research , 100,
16,415–16,430.
Marticorena, D., Bergametti, G., Gillette, D., and Belnap, J., 1997, Factors controlling
threshold friction velocity in semiarid and arid areas of the United States, Journal of
Geophysical Research, 102, 23,277–23,287.
McKenna Neuman, C., 2003, Effects of temperature and humidity upon the entrainment
of sedimentary particles by wind, Boundary Layer Meteorology, 108, 61–89.
McKenna-Neuman, C. and Sanderson, S., 2008, Humidity control of particle emissions in
aeolian systems, Journal of Geophysical Research, 113, F02S14.
Texas Tech University, Joseph Massey, May 2013
57

Mikami, M., Yamada, Y., Ishizuka, M., Ishimaru, T., Gao, W., and Zeng, F., 2005,
Measurement of saltation process over Gobi and sand dunes in the Taklimakan
Desert, China, with newly developed sand particle counter, Journal of Geophysical
Research, 110, D18S02.
Orozco, A.A., 2000, Fine particulate matter generation under controlled laboratory and
wind tunnel conditions, PhD Dissertation, Texas Tech University, Lubbock, TX.
Peters, T.M., Ott, D., and O’Shaughnessy, P.T., 2006, Comparison of the Grimm 1.108
and 1.109 Portable Aerosol Spectrometer to the TSI 3321 Aerodynamic Particle
Sizer for Dry Particles, The Annals of Occupational Hygiene, 50, 843-850.
Ramanathan, V., Crutzen, P.J., Kiehl, J.T. and Rosenfeld, D., 2001, Aerosols, climate,
and the hydrological cycle, Science, 294, 2119–2124.
Ravi, S. and D’Odorico, P., 2005, A field‐analysis of the dependence of wind erosion
threshold velocity on air humidity, Geophysical Research Letters, 32, L21404.
Ravi, S., Breshears, D.D., Huxman, T.E. and D’Odorico, P., 2010, Land degradation in
drylands: Interactions among hydrologic-aeolian processes and vegetation dynamics,
Geomorphology, 116, 236-245.
Ravi, S., D’Odorico, P., Over, T.M. and T. M. Zobeck, 2004, On the effect of air
humidity on soil susceptibility to wind erosion: The case of air‐dry soils,
Geophysical Research Letters, 31.
Ravi, S., D’Odorico, P., Breshears, D.D., Field, J.P., Goudie, A.S., Huxman, T.E., Li, J.,
Okin, G.S., Swap, R.J., Thomas, A.D., Van Pelt, S., Whicker, J.J. and Zobeck, T.M.,
2011, Aeolian Processes and the Biosphere, Review of Geophysics, 49, RG3001.
Ravi, S., Zobeck, T.M., Over, T.M., Okin, G.S. and D’Odorico, P., 2006, On the effect of
wet bonding forces in air‐dry soils on threshold friction velocity of wind erosion,
Sedimentology, 53(3), 597–609.
Texas Tech University, Joseph Massey, May 2013
58

Sherman, D.J., Li, B., Farrell, E.J., Ellis, J.T., Cox, W.D., Maia, L.P., and Sousa,
P.H.G.O., 2011, Measuring Aeolian Saltation: A Comparison of Sensors, Journal of
Coastal Research, Number 10059, 280-290.
Skidmore, E. L., and Layton, J.B., 1992, Dry‐soil aggregate stability as influenced by
selected soil properties, Soil Science Society of America Journal, 56, 557–561.
Stockton, P.H., and Gillette, D.A., 1990, Field measurement of the sheltering effect of
vegetation on erodible land surfaces, Land Degradation and Rehabilitation, 2, 77–
85.
Stout, J.E., 2004, A method for establishing the critical threshold for aeolian transport in
the field, Earth Surface Processes and Landforms, 29, 1195-1207.
Van Pelt, R.S., Peters, P., and Visser, S., 2009, Laboratory wind tunnel testing of three
commonly used saltation impact sensors, Aeolian Research, 1, 55-62.
Zobeck, T.M., Sterk, G., Funk, R., Rajot, J.L., Stout, J.E., Van Pelt, R.S., 2003,
Measurement and Data Analysis methods for field-scale wind erosion studies and
model validation, Earth Surface Processes and Landforms, 28, 1163-1188.
Texas Tech University, Joseph Massey, May 2013
59