Embed Size (px)
Citation preview

next generation mobile networks
A White Paper by the NGMN Alliance
Guidelines for LTE Backhaul Traffi c Estimation

2
Page 2 (18) <Document title>, Version X.X, <DD –Month-200Y>
Guidelines for LTE Backhaul Traffic Estimation
by NGMN Alliance Version: 0.4.2 FINAL
Date: 3rd July 2011
Document Type: Final Deliverable (approved)
Confidentiality Class: P
Authorised Recipients: N/A Project: P-OSB: Optimized Backhaul Editor / Submitter: Julius Robson, Cambridge Broadband Networks Ltd Contributors: NGMN Optimised Backhaul Project Group Approved by / Date: BOARD July 3, 2011
For all Confidential documents (CN, CL, CR): This document contains information that is confidential and proprietary to NGMN Ltd. The information may not be used, disclosed or reproduced without the prior written authorisation of NGMN Ltd., and those so authorised may only use this information for the purpose consistent with the authorisation. For Public documents (P): © 2008 Next Generation Mobile Networks Ltd. All rights reserved. No part of this document may be reproduced or transmitted in any form or by any means without prior written permission from NGMN Ltd.
The information contained in this document represents the current view held by NGMN Ltd. on the issues discussed as of the date of publication. This document is provided “as is” with no warranties whatsoever including any warranty of merchantability, non-infringement, or fitness for any particular purpose. All liability (including liability for infringement of any property rights) relating to the use of information in this document is disclaimed. No license, express or implied, to any intellectual property rights are granted herein. This document is distributed for informational purposes only and is subject to change without notice. Readers should not design products based on this document.

3
Next Generation Mobile Networks LTE Transport Provisioning
NGMN Confidential 3 of 18
Executive Summary A model is developed to predict traffic levels in transport networks used to backhaul LTE eNodeBs. Backhaul traffic is made up of a number of different components of which user plane data is the largest, comprising around 80-90% of overall traffic, slightly less when IPsec encryption is added. The remainder consists of the transport protocol overhead and traffic forwarding to another base-station during handover. Network signalling, management and synchronisation were assumed to be negligible. User plane traffic was depends on the characteristics of cell throughput that can be delivered by the LTE air interface. Simulations of LTE cell throughput showed very high peaks were possible, corresponding to the maximum UE (user equipment) capabilities of up to 150Mbps. However, such peaks were only found to occur under very light network loads of less than one user per cell. During ‘busy times’ with high user traffic demands, cell throughputs were significantly lower than the quiet time peaks: A heavily loaded 20MHz 2x2 LTE downlink cell limits at around 20Mbps cell throughput. In this scenario, the overall spectral efficiency of the cell is brought down by the presence of ‘cell edge users’, with poor signal quality and correspondingly low data rates. These results reveal that the cell throughput characteristics for data carrying networks are quite different to those of voice carrying networks. In a data dominated LTE network, the peak cell throughputs in the hundreds of Mbps will occur during quiet times. Conversely in voice dominated networks, cell throughput is related to the number of active calls, hence peaks occur during the ‘busy hours’. Since cell throughput peaks occur rarely and during quiet times, it is assumed that they do not occur simultaneously on neighbouring cells. On the other hand, the ‘busy time’ mean traffic will occur on all cells at the same time. The total user plane traffic for a tri-cell eNodeB (an LTE base station) is modelled as the larger of the peak from one cell, or the combined busy time mean of the three cells. The same rule is applied to the calculation of traffic from multiple aggregated eNodeBs. For the LTE downlink, peak cell throughput is around 4-6x the busy time mean, so for backhaul traffic aggregates of less than 4-6 cells typical of the ‘last mile’ of the transport network, it is the quiet time peak that dominates capacity provisioning. For aggregates of 6 or more cells (e.g. two or more tricell eNodeBs), it is the busy time mean that dominates provisioning of the ‘core’ and ‘aggregation’ regions of the transport network. From a technical perspective, it may not seem practical to provision the last mile backhaul for a peak rate that rarely occurs in practice. However, the ability to deliver such rates may be driven by marketing requirements, as consumers are more likely to select networks or devices which can advertise higher maximum rates. The results presented in this paper represent mature LTE networks with sufficient device penetration to fully load all cells during the busy times. It is recognised that it may take several years to reach such a state, and even then, not all cells may reach full load. The lighter levels of loading likely in the early years of the network will reduce the ‘busy time mean’ figures applicable to the aggregation and core regions of the transport network. However, the quiet time peaks if anything will be more prevalent, and so provisioning in the last mile will have to accommodate them from day one. The transport provisioning figures given this paper are provided as guidelines to help the industry understand the sorts of traffic levels and characteristics that LTE will demand. They should not be interpreted as requirements, and it should be recognised that provisioning may need to be adjusted according to the particular deployment conditions of individual RAN sites. Results are given for a range of uplink and downlink scenarios applicable to Release 8 of the LTE specifications. These include 10MHz and 20MHz system bandwidths, various MIMO configurations, and different UE categories.

4
Next Generation Mobile Networks LTE Transport Provisioning
NGMN Confidential 4 of 18
Contents 1. Introduction 5
1.1. Structure of the Report 5 2. Evaluation of User and Cell Throughput 6
2.1. Fundamentals of Cell and User Throughput 6 2.2. Cell throughput during Busy and Quiet times 7 2.3. Backhaul Provisioning for User Traffic 8 2.4. Data points for Mean and Peak Cell Throughput 9 Simulation Results for P 10 2.5. eak and Mean Cell Throughput 10
3. Single eNodeB Transport Provisioning 11 3.1.1. X2 Traffic 11 3.1.2. Control Plane, OAM and Synchronisation Signalling 11 3.1.3. Transport Protocol Overhead 11 3.1.4. IPsec 11
3.2. Summary of Single eNodeB Traffic 12 4. Multi-eNodeB Transport Provisioning 13
4.1. Principles of Multi-ENodeB Provisioning 13 4.2. Provsioning for Multiple eNodeBs (No IPsec) 14 4.3. Provisioning with IPsec Encryption 15
5. Interpretation and Adaptation of Results to Real World Networks 16 5.1. Network maturity and device penetration 16 5.2. Load variation between sites 16 5.3. High mobility sites 16 5.4. Small or isolated cells 16
6. Conclusions 17 7. References 18

5
Next Generation Mobile Networks LTE Transport Provisioning
NGMN Confidential 5 of 18
1. Introduction The new LTE mobile broadband standard promises significantly higher data rates for consumers than current HSPA technology, and at a significantly lower cost per bit for the Operator. Field tests show that end user download rates in excess of 150Mbps are achievable where conditions allow [3]. While this seems like great news for the end users, there are concerns in the operator community on how to backhaul what initially appears to be vast volumes of data: If just one user can download at 150Mbps, what is the total backhaul traffic from a multi-cell base station supporting tens of users? This paper answers this question by considering the total user traffic that LTE base stations can handle both during the busy hours and in the quiet times. To this, we add other components of backhaul traffic including signalling, transport overheads and the new X2 interface. This provides us with figures for the total backhaul traffic per eNodeB (an LTE base station), representing the provisioning needed in the ‘last mile’ of the transport network, illustrated in Figure 1. Provisioning for the ‘aggregation’ and ‘core’ parts of the transport network is then derived by combining traffic from multiple eNodeBs, using simple assumptions for the statistical multiplexing gains.
UE trafficserved by eNodeBs
Last mile serves eNodeBs
aggregation core
eNodeBs
Transport network
ExternalNetworks
Figure 1 Places in the LTE/EPC network where traffic can be characterized
This study predicts traffic levels in the transport network using a theoretical modelling approach. This is needed in the early years of LTE roll out when network sizes and device penetration are too low to be able to perform useful measurements of backhaul traffic. Once loading levels in LTE networks increase, empirical methods can be used to validate, adjust and ultimately replace the theoretical models described in this paper. The study was performed as part of the NGMN’s Optimised Backhaul Project. The method and assumptions have been agreed between the leading LTE Equipment Vendors and Operators. The backhaul traffic figures produced by this study represent mature LTE networks with a sufficient number of subscribers to fully load eNodeBs during busy times. In practice, it may take several years after roll out to reach this state, and even then, only some of the eNodeBs in the network will be fully loaded. Backhaul traffic may also be impacted by the type of deployment: For example, sites near motorways may see higher levels of handover signalling, and isolated sites may generate higher traffic levels due to a lack of other cell interference. In many cases, LTE will be deployed on sites supporting other RAN technologies such as GSM or HSPA, which will generate their own backhaul traffic. In summary, the provisioning figures given in this report for mature LTE eNodeBs may need to be adjusted to suit the particular conditions of an operator’s network. It should be understood that these are recommendations rather than requirements and different operators may have different provisioning strategies.
1.1. Structure of the Report Since backhaul is predominantly user plane traffic, the study starts with an analysis of this component in section 2. Section 3 goes on to describe the other components of backhaul which must be considered when provisioning for each eNodeB. These include X2 traffic overheads and security. Section 4 considers how to aggregate traffic generated a number of eNodeBs. Section 5 discusses how the results should be interpreted and adapted for application to real world networks. Conclusions are drawn in section 6.

6
Next Generation Mobile Networks LTE Transport Provisioning
NGMN Confidential 6 of 18
2. Evaluation of User and Cell Throughput
2.1. Fundamentals of Cell and User Throughput Backhaul traffic is predominantly user data, so the analysis considers this first and adds other components such as overheads and signalling later. Figure 2 illustrates the key concepts in evaluating the total user traffic carried by an eNodeB. The terms ‘cell’, ‘cell site’ and ‘base station’ are often used interchangeably, however in this paper, they follow the 3GPP convention: User Equipments (UEs) are served by one of many ‘cells’ in the coverage area. A “macro” LTE base station (eNodeB) typically controls three cells, ‘micro’ and ‘pico’ eNodeBs typically only control one cell and some city centre eNodeBs are starting to use six cells. Backhaul traffic per eNodeB is the total of all cells controlled by that eNodeB. Cell throughput is the sum of traffic for each of the UEs served by that cell. Each UE’s throughput varies depending on the quality of their radio link to the eNodeB, and the amount of spectrum resource assigned to them.
Other cellinterference
Multiple UEs sharing cell
Other cells around sameeNodeB
Uu links have differentSpectral efficiencies
Transport Provisioning
For N eNodeBs
Figure 2 Factors which impact user traffic to be backhauled LTE transceivers use ‘adaptive modulation and coding’ to adjust their data rate to the radio conditions. In good conditions where the UE is close to the eNodeB and there is little interference, more bits of information can be carried without error for each unit of spectrum. This is called spectrum efficiency, and is measured in bits per second, per Hz (bits/s/Hz). Radio conditions are characterized by the Signal to Interference plus Noise Ratio, or SINR. 64QAM modulation can send 6 bits/s/Hz, but requires high SINR, whereas QPSK only sends 2 bits/s/Hz, but can still be received without error in the poor signal conditions found near the ‘cell edge’ during busy hour when interference is high. Variable rate coding is also used to provide finer tuning to match the data rate to the SINR. The LTE RAN (Radio Access Network) operates at N=1 reuse, which means that each cell in the network can (re)use the entire bandwidth of the spectrum block owned by the operator. Apart from some overheads, most of this bandwidth is shared amongst the served UEs to carry their data. Clearly when there are more users, each UE is assigned a smaller share. UE throughput (bits/s) is the product of its spectral efficiency (bits/s/Hz) and the assigned share of the cell’s spectrum (Hz). Cell throughput is the sum of all UE throughputs served by that cell. Since the total spectrum cannot change (i.e. the system bandwidth), cell throughput is the total spectrum multiplied by the cell average spectral efficiency of UEs served by that cell.
7
Next Generation Mobile Networks LTE Transport Provisioning
NGMN Confidential 7 of 18
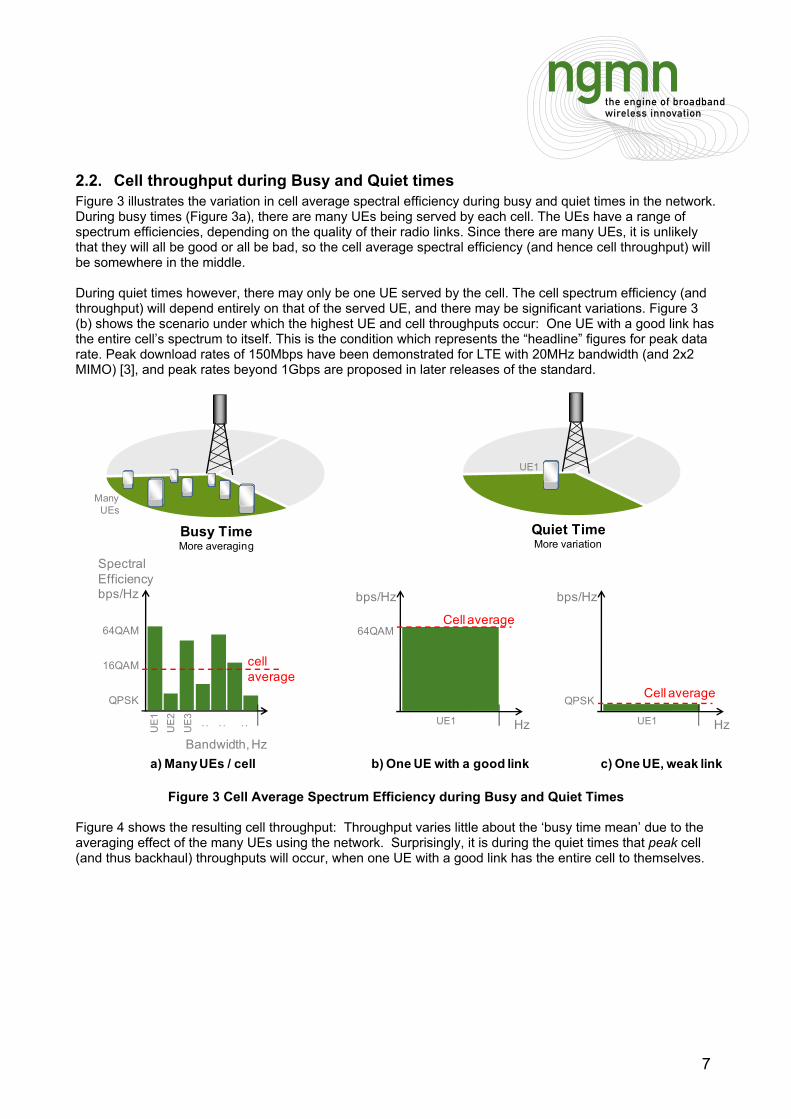
2.2. Cell throughput during Busy and Quiet times Figure 3 illustrates the variation in cell average spectral efficiency during busy and quiet times in the network. During busy times (Figure 3a), there are many UEs being served by each cell. The UEs have a range of spectrum efficiencies, depending on the quality of their radio links. Since there are many UEs, it is unlikely that they will all be good or all be bad, so the cell average spectral efficiency (and hence cell throughput) will be somewhere in the middle. During quiet times however, there may only be one UE served by the cell. The cell spectrum efficiency (and throughput) will depend entirely on that of the served UE, and there may be significant variations. Figure 3 (b) shows the scenario under which the highest UE and cell throughputs occur: One UE with a good link has the entire cell’s spectrum to itself. This is the condition which represents the “headline” figures for peak data rate. Peak download rates of 150Mbps have been demonstrated for LTE with 20MHz bandwidth (and 2x2 MIMO) [3], and peak rates beyond 1Gbps are proposed in later releases of the standard.
Spectral Efficiencybps/Hz
Bandwidth, Hz
64QAM
16QAM
QPSK
cell average
Busy TimeMore averaging
UE
1U
E2
UE
3: : :
Many UEs
Quiet TimeMore variation
UE1
64QAMCell average
UE1
bps/Hz
QPSKCell average
UE1
bps/Hz
Hz Hz
a) Many UEs / cell b) One UE with a good link c) One UE, weak link
Figure 3 Cell Average Spectrum Efficiency during Busy and Quiet Times Figure 4 shows the resulting cell throughput: Throughput varies little about the ‘busy time mean’ due to the averaging effect of the many UEs using the network. Surprisingly, it is during the quiet times that peak cell (and thus backhaul) throughputs will occur, when one UE with a good link has the entire cell to themselves.

8
Next Generation Mobile Networks LTE Transport Provisioning
NGMN Confidential 8 of 18
time
Cell Tput
Busy timeSeveral active UEs sharing the cell
Quiet timeOne UE at a timeCell Tput = UE Tput
peak
Busy timemean
For illustration purposes only
peak
Figure 4 Illustration of Cell Throughput during Busy and Quiet Times
2.3. Backhaul Provisioning for User Traffic Radio spectrum for mobile broadband is an expensive and limited resource, so backhaul should be generously provisioned to exceed cell throughput in most cases. At the same time, LTE needs to operate at a significantly lower cost per bit, so operators cannot afford to over-provision either. In this analysis, we assume backhaul should be provisioned to cope with all but the top 5% of cell throughputs (i.e. the 95%-ile of the cell throughput distribution). In practice, last mile provisioning for the peak rate may be influenced by marketing as well as technical reasons. Comparison of technologies or service offerings across a wide range of conditions is difficult, and so peak rates are often assumed to be a metric which represents the general performance. Regardless of whether this assumption is correct or not, the advertised peak rate is still likely to influence the end user’s choice of network. Last mile provisioning should ensure that the advertised peak rates are at least feasible, if only rarely achieved in mature networks. Provisioning for a single cell should be based on the quiet time peak rate of that cell. However, when provisioning for a Tri-cell eNodeB, or multiple eNodeBs, it is unlikely that the quiet time peaks will occur at the same time. However, the busy time mean will occur in all cells simultaneously – it’s busy time after all. A common approach to multi-cell transport provisioning, and that used in this study, is:
Backhaul Provisioning for N cells = max (N x busy time mean, Peak) Peak cell throughputs are most applicable to the ‘last mile’ of the transport network, for backhauling of a small number of eNodeBs. Towards the core the traffic of many cells are aggregated together, and the busy hour mean is the dominant factor. The backhaul traffic characteristics presented here for mobile broadband networks are different to what has been experienced in the past with voice networks. A voice call requires a fixed data rate, so backhaul traffic levels are linked to the number of calls at that time. During busy hour there are more calls, hence more backhaul traffic. When providing data services, the network aims to serve users as quickly as possible by maximizing their data rate. As we have seen, even with only one user, the cell can be fully utilized and peak backhaul rates required.

9
Next Generation Mobile Networks LTE Transport Provisioning
NGMN Confidential 9 of 18
2.4. Data points for Mean and Peak Cell Throughput Ideally and in the future, LTE backhaul provisioning will be based on measurements of real traffic levels in live commercial networks. However, it will be some time before networks are deployed and operating at full load. Whilst early trial results have confirmed the single user peak rates are achievable in the field [3], it is not so easy to create trial conditions representing busy hour. We therefore look to simulation results as the source of this information for now. Many LTE simulation studies to date [2,6,7] assume that UEs will continuously download at whatever data rate they can achieve. This is called the ‘Full buffer’ traffic model. The backhaul provisioning study assumed, a more sophisticated ‘FTP’ traffic model where each UE downloads a fixed sized file. In the full buffer model, ‘near-in’ UEs with good links consume more data than ‘cell edge’ UEs with lower data rates. Favouring UEs with good links gives higher UE and Cell throughputs. In the file transfer model, all UEs consume the same volume of data, regardless of their location or data rate. The transport provisioning study uses simulation results based on the fixed file transfer traffic model as it is considered to be more representative of real user traffic. Other aspects of the simulations such as cell layouts and propagation models are generally consistent with 3GPP case 1 used for LTE development [4]. Full details can be found in NGMN’s Performance Evaluation Methodology [8]. A summary of key assumptions is as follows:
Urban Environment (Interference limited) Inter site distance (ISD) 500m UE Speed: 3km/h 2GHz Path loss model: L=I +37.6*log(R), R in kilometres, I= 128.1 dB for 2 GHz Multipath model: SCME (urban macro, high spread) eNodeB antenna type: Cross polar (closely spaced in case of 4x2)
‘Interference limiting’ is when the interference from adjacent cells is significantly higher than thermal noise, which occurs when cell spacing is small. As cell spacing increases, thermal noise becomes significant for some users, and the deployment becomes ‘coverage limited’. Interference limited deployments produce higher cell throughputs than coverage limited deployments. A deployment using an 800MHz carrier can be interference limited with a larger cell spacing than one at 2GHz. Provided the deployment is interference limited, the carrier frequency has little impact on cell throughputs – and thus transport provisioning. The simulation results were for a 2GHz deployment with 500m cell spacing and were found to be interference limited in both DL and UL. They are therefore considered to be representative of an interference limited scenario at other carrier frequencies.
10
Next Generation Mobile Networks LTE Transport Provisioning
NGMN Confidential 10 of 18
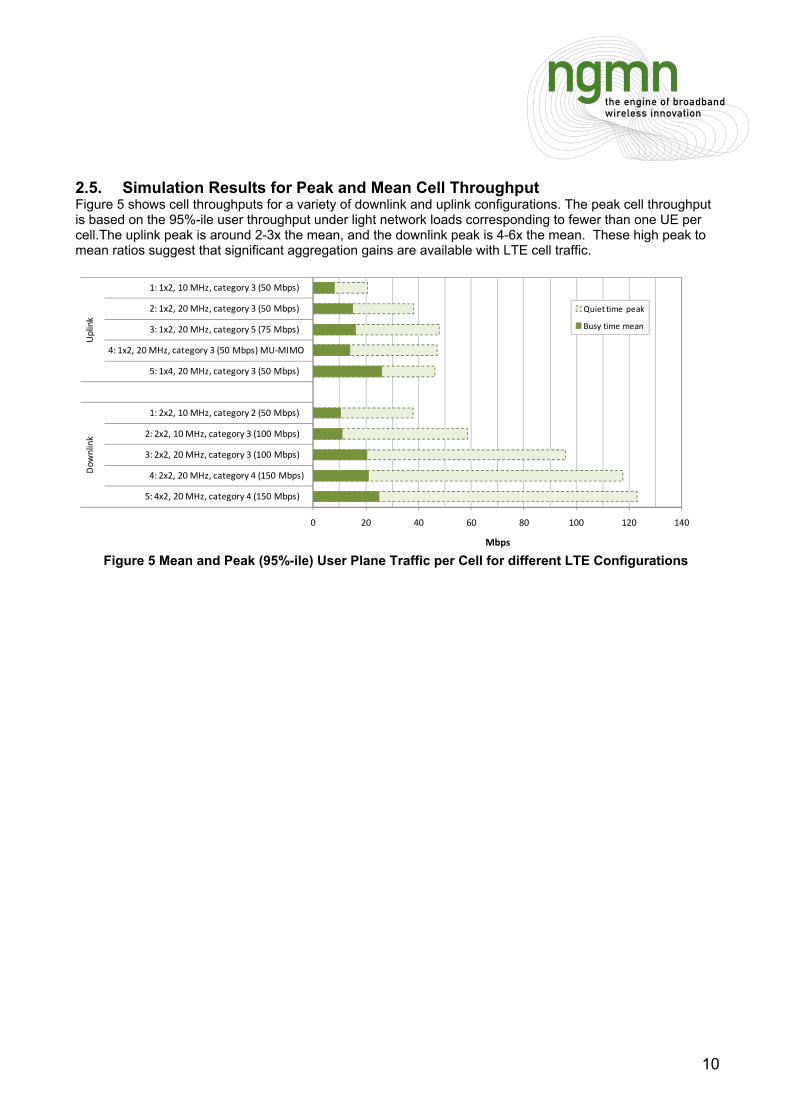
2.5. Simulation Results for Peak and Mean Cell Throughput Figure 5 shows cell throughputs for a variety of downlink and uplink configurations. The peak cell throughput is based on the 95%-ile user throughput under light network loads corresponding to fewer than one UE per cell.The uplink peak is around 2-3x the mean, and the downlink peak is 4-6x the mean. These high peak to mean ratios suggest that significant aggregation gains are available with LTE cell traffic.
0 20 40 60 80 100 120 140
1: 1x2, 10 MHz, category 3 (50 Mbps)
2: 1x2, 20 MHz, category 3 (50 Mbps)
3: 1x2, 20 MHz, category 5 (75 Mbps)
4: 1x2, 20 MHz, category 3 (50 Mbps) MU‐MIMO
5: 1x4, 20 MHz, category 3 (50 Mbps)
1: 2x2, 10 MHz, category 2 (50 Mbps)
2: 2x2, 10 MHz, category 3 (100 Mbps)
3: 2x2, 20 MHz, category 3 (100 Mbps)
4: 2x2, 20 MHz, category 4 (150 Mbps)
5: 4x2, 20 MHz, category 4 (150 Mbps)
Uplink
Dow
nlink
Mbps
Quiet time peak
Busy time mean
Figure 5 Mean and Peak (95%-ile) User Plane Traffic per Cell for different LTE Configurations

11
Next Generation Mobile Networks LTE Transport Provisioning
NGMN Confidential 11 of 18
3. Single eNodeB Transport Provisioning
S1 User plane traffic(for 3 cells)
+Control Plane
+X2 U and C-plane
+OA&M, Sync, etc
+Transport protocol overhead
+IPsec overhead (optional)
Core network
RAN
Figure 6 Components of Backhaul Traffic Backhaul traffic comprises a number of components in addition to the user plane traffic as illustrated in Figure 6. The optimised backhaul group agreed on the following assumptions:
3.1.1. X2 Traffic The new X2 interface between eNodeBs is predominantly user traffic forwarded during UE handover between eNodeBs. Further analysis of X2 functionality and traffic requirements can be found in [12]. The volume of X2 traffic is often expressed as a volume of S1 traffic, with equipment vendors stating figures of 1.6% [9], 3% [10] and 5% [11]. It was agreed to use 4% as a cautious average of these figures. X2 traffic only applies to the mean busy time, as the ‘peak’ cell throughput figure can only occur when there is one UE in good signal conditions – away from where a handover may occur. It should be noted that the actual volume of traffic depends on the amount of handover, so cells on motorways for example would see a higher proportion of X2 traffic than an eNodeB covering an office. It was suggested that an X2 overhead around 10% is appropriate for sites serving highly mobile users. Reference [11] also describes the ‘batch handover’ scenario, where multiple UEs on a bus or train handover simultaneously, temporarily causing high levels of X2.
3.1.2. Control Plane, OAM and Synchronisation Signalling Control Plane Signalling on both S1 (eNodeB to Core) and X2 (eNodeB to eNodeB) is considered to be negligible in comparison to associated user plane traffic, and can be ignored. The same is true for OAM (Operations, Administration and Maintenance) and synchronisation signalling.
3.1.3. Transport Protocol Overhead Backhaul traffic is carried through the Evolved Packet Core in ‘tunnels’, which enable the UE to maintain the same IP address as it moves between eNodeBs and gateways. LTE uses either GTP (GPRS tunnelling protocol), which is also used in GSM and UMTS cores, or Mobile IP tunnels. The relative size of the tunnel overhead depends on the end user’s packet size distribution. Smaller packets (like VoIP) incur larger overheads. The NGMN backhaul group has assumed an overhead of 10% represents the general case.
3.1.4. IPsec User plane data on the S1-U interface between the eNodeB and Serving Gateway is not secure, and could be exposed if the transport network is not physically protected. In many cases, the operator owns their transport network, and additional security is not needed. However, if user traffic were to traverse a third party ‘untrusted’ network, then it should be protected. In such situations, 3GPP specify IPSec Encapsulated Security Payload (ESP) in tunnel mode should be used. Unfortunately this adds further overhead to the user data. The NGMN backhaul group assume IPSec ESP adds an additional 14% on top of the transport protocol overhead (making 25% in total)

12
Next Generation Mobile Networks LTE Transport Provisioning
NGMN Confidential 12 of 18
3.2. Summary of Single eNodeB Traffic Table 1 shows the calculation of eNodeB backhaul including S1 and X2 user traffic as well as transport and IPSec overheads. Figure 7 shows a graph of the resulting backhaul traffic per Tricell eNodeB. In most of the uplink cases, the busy time mean of the three cells is greater than the single cell peak.
Mean Peak overhead 4% overhead 10% overhead 25%
(as load-> infinity)
(95%ile @ low load)
busy time mean
peak (95%ile)
busy time mean peak
busy time mean
peak (95%ile)
busy time mean
peak (95%ile)
DL 1: 2x2, 10 MHz, cat2 (50 Mbps) 10.5 37.8 31.5 37.8 1.3 0 36.0 41.6 41.0 47.3DL 2: 2x2, 10 MHz, cat3 (100 Mbps) 11.0 58.5 33.0 58.5 1.3 0 37.8 64.4 42.9 73.2DL 3: 2x2, 20 MHz, cat3 (100 Mbps) 20.5 95.7 61.5 95.7 2.5 0 70.4 105.3 80.0 119.6DL 4: 2x2, 20 MHz, cat4 (150 Mbps) 21.0 117.7 63.0 117.7 2.5 0 72.1 129.5 81.9 147.1DL 5: 4x2, 20 MHz, cat4 (150 Mbps) 25.0 123.1 75.0 123.1 3.0 0 85.8 135.4 97.5 153.9
UL 1: 1x2, 10 MHz, cat3 (50 Mbps) 8.0 20.8 24.0 20.8 1.0 0 27.5 22.8 31.2 26.0UL 2: 1x2, 20 MHz, cat3 (50 Mbps) 15.0 38.2 45.0 38.2 1.8 0 51.5 42.0 58.5 47.7UL 3: 1x2, 20 MHz, cat5 (75 Mbps) 16.0 47.8 48.0 47.8 1.9 0 54.9 52.5 62.4 59.7UL 4: 1x2, 20 MHz, cat3 (50
Mbps)* 14.0 46.9 42.0 46.9 1.7 0 48.0 51.6 54.6 58.6
UL 5: 1x4, 20 MHz, cat3 (50 Mbps) 26.0 46.2 78.0 46.2 3.1 0 89.2 50.8 101.4 57.8
ScenarioTri-cell Tput
Total U-plane + Transport overheadNo IPsec IPsecX2 OverheadSingle Cell Single base station
All values in Mbps
Table 1 Transport Provisioning for Various Configurations of Tri-cell LTE eNodeB
0 20 40 60 80 100 120 140 160
1: 1x2, 10 MHz, category 3 (50 Mbps)
2: 1x2, 20 MHz, category 3 (50 Mbps)
3: 1x2, 20 MHz, category 5 (75 Mbps)
4: 1x2, 20 MHz, category 3 (50 Mbps) MU‐MIMO
5: 1x4, 20 MHz, category 3 (50 Mbps)
1: 2x2, 10 MHz, category 2 (50 Mbps)
2: 2x2, 10 MHz, category 3 (100 Mbps)
3: 2x2, 20 MHz, category 3 (100 Mbps)
4: 2x2, 20 MHz, category 4 (150 Mbps)
5: 4x2, 20 MHz, category 4 (150 Mbps)
Uplink
Dow
nlink
Mbps
Quiet time peak
Busy time mean
Figure 7 Busy Time Mean and Quiet Time Peak (95%ile) Backhaul Traffic for a Tricell eNodeB
(No IPsec)
13
Next Generation Mobile Networks LTE Transport Provisioning
NGMN Confidential 13 of 18
4. Multi-eNodeB Transport Provisioning
4.1. Principles of Multi-ENodeB Provisioning
0
20
40
60
80
100
120
140
160
0 1 2 3 4
Mbp
s
1 cell
Peak
Number of eNodeBs = N
Provision for Peak
single cell eNodeBs: 1 2 3 4 5 6 7 8 9 10 11 12
blend
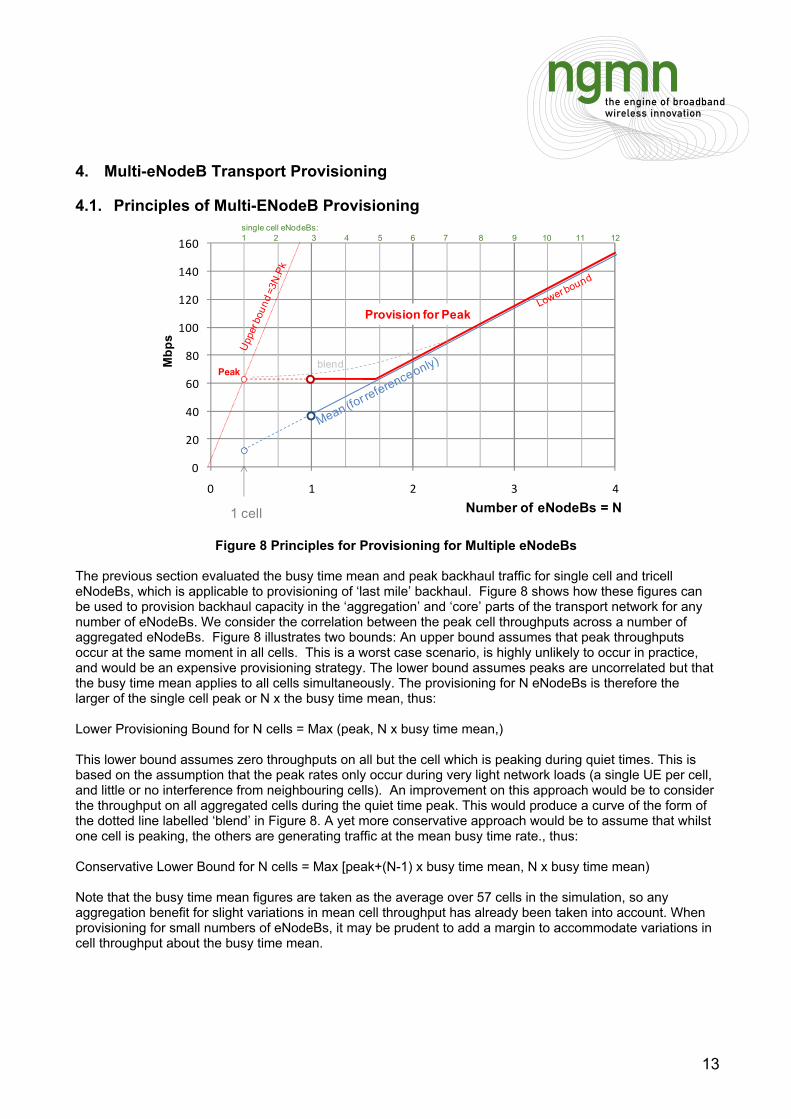
Figure 8 Principles for Provisioning for Multiple eNodeBs The previous section evaluated the busy time mean and peak backhaul traffic for single cell and tricell eNodeBs, which is applicable to provisioning of ‘last mile’ backhaul. Figure 8 shows how these figures can be used to provision backhaul capacity in the ‘aggregation’ and ‘core’ parts of the transport network for any number of eNodeBs. We consider the correlation between the peak cell throughputs across a number of aggregated eNodeBs. Figure 8 illustrates two bounds: An upper bound assumes that peak throughputs occur at the same moment in all cells. This is a worst case scenario, is highly unlikely to occur in practice, and would be an expensive provisioning strategy. The lower bound assumes peaks are uncorrelated but that the busy time mean applies to all cells simultaneously. The provisioning for N eNodeBs is therefore the larger of the single cell peak or N x the busy time mean, thus: Lower Provisioning Bound for N cells = Max (peak, N x busy time mean,) This lower bound assumes zero throughputs on all but the cell which is peaking during quiet times. This is based on the assumption that the peak rates only occur during very light network loads (a single UE per cell, and little or no interference from neighbouring cells). An improvement on this approach would be to consider the throughput on all aggregated cells during the quiet time peak. This would produce a curve of the form of the dotted line labelled ‘blend’ in Figure 8. A yet more conservative approach would be to assume that whilst one cell is peaking, the others are generating traffic at the mean busy time rate., thus: Conservative Lower Bound for N cells = Max [peak+(N-1) x busy time mean, N x busy time mean) Note that the busy time mean figures are taken as the average over 57 cells in the simulation, so any aggregation benefit for slight variations in mean cell throughput has already been taken into account. When provisioning for small numbers of eNodeBs, it may be prudent to add a margin to accommodate variations in cell throughput about the busy time mean.
14
Next Generation Mobile Networks LTE Transport Provisioning
NGMN Confidential 14 of 18
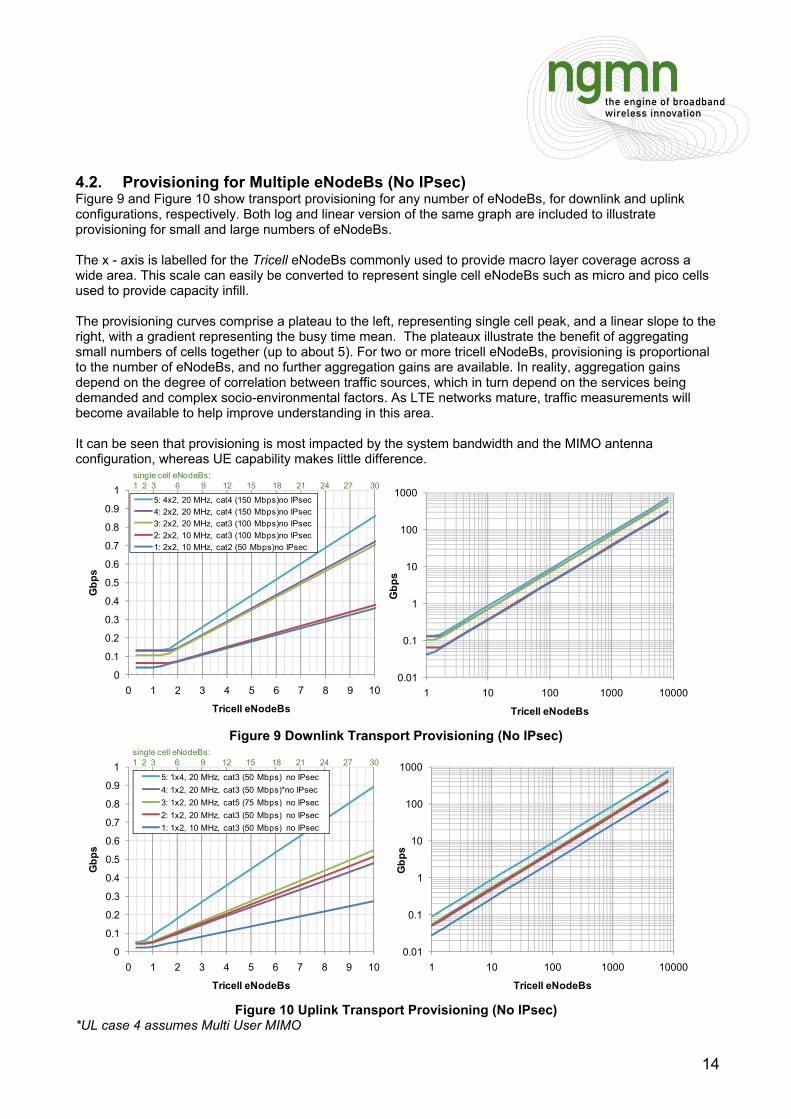
4.2. Provisioning for Multiple eNodeBs (No IPsec) Figure 9 and Figure 10 show transport provisioning for any number of eNodeBs, for downlink and uplink configurations, respectively. Both log and linear version of the same graph are included to illustrate provisioning for small and large numbers of eNodeBs. The x - axis is labelled for the Tricell eNodeBs commonly used to provide macro layer coverage across a wide area. This scale can easily be converted to represent single cell eNodeBs such as micro and pico cells used to provide capacity infill. The provisioning curves comprise a plateau to the left, representing single cell peak, and a linear slope to the right, with a gradient representing the busy time mean. The plateaux illustrate the benefit of aggregating small numbers of cells together (up to about 5). For two or more tricell eNodeBs, provisioning is proportional to the number of eNodeBs, and no further aggregation gains are available. In reality, aggregation gains depend on the degree of correlation between traffic sources, which in turn depend on the services being demanded and complex socio-environmental factors. As LTE networks mature, traffic measurements will become available to help improve understanding in this area. It can be seen that provisioning is most impacted by the system bandwidth and the MIMO antenna configuration, whereas UE capability makes little difference.
0
0.1
0.2
0.3
0.4
0.5
0.6
0.7
0.8
0.9
1
0 1 2 3 4 5 6 7 8 9 10
Gbp
s
Tricell eNodeBs
5: 4x2, 20 MHz, cat4 (150 Mbps)no IPsec4: 2x2, 20 MHz, cat4 (150 Mbps)no IPsec3: 2x2, 20 MHz, cat3 (100 Mbps)no IPsec2: 2x2, 10 MHz, cat3 (100 Mbps)no IPsec1: 2x2, 10 MHz, cat2 (50 Mbps)no IPsec
0.01
0.1
1
10
100
1000
1 10 100 1000 10000
Gbp
s
Tricell eNodeBs
single cell eNodeBs: 1 2 3 6 9 12 15 18 21 24 27 30
Figure 9 Downlink Transport Provisioning (No IPsec)
0
0.1
0.2
0.3
0.4
0.5
0.6
0.7
0.8
0.9
1
0 1 2 3 4 5 6 7 8 9 10
Gbp
s
Tricell eNodeBs
5: 1x4, 20 MHz, cat3 (50 Mbps) no IPsec4: 1x2, 20 MHz, cat3 (50 Mbps)*no IPsec3: 1x2, 20 MHz, cat5 (75 Mbps) no IPsec2: 1x2, 20 MHz, cat3 (50 Mbps) no IPsec1: 1x2, 10 MHz, cat3 (50 Mbps) no IPsec
0.01
0.1
1
10
100
1000
1 10 100 1000 10000
Gbp
s
Tricell eNodeBs
single cell eNodeBs: 1 2 3 6 9 12 15 18 21 24 27 30
Figure 10 Uplink Transport Provisioning (No IPsec)
*UL case 4 assumes Multi User MIMO

15
Next Generation Mobile Networks LTE Transport Provisioning
NGMN Confidential 15 of 18
4.3. Provisioning with IPsec Encryption
0.1
1
10
100
1000
1 10 100 1000 10000
Gbp
s
Tricell eNodeBs
single cell eNodeBs: 1 2 3 6 9 12 15 18 21 24 27 30
0
0.1
0.2
0.3
0.4
0.5
0.6
0.7
0.8
0.9
1
0 1 2 3 4 5 6 7 8 9 10
Gbp
s
Tricell eNodeBs
4: 2x2, 20 MHz, cat4 (150 Mbps)IPsec4: 2x2, 20 MHz, cat4 (150 Mbps)no IPsec2: 2x2, 10 MHz, cat3 (100 Mbps)IPsec2: 2x2, 10 MHz, cat3 (100 Mbps)no IPsec
Figure 11 Transport Provisioning with IPSec
Figure 11 illustrates the increase in transport provisioning needed for IPsec Encrypted Security Payload, for two example downlink configurations. According to the overhead assumptions of 25% with and 10% without, it can be seen that IPsec increases the provisioning requirement by 14%.

16
Next Generation Mobile Networks LTE Transport Provisioning
NGMN Confidential 16 of 18
5. Interpretation and Adaptation of Results to Real World Networks There is no ‘one size fits all’ rule for backhaul provisioning and the results presented in this paper should not be taken out of context. The analysis used in this paper is based on mature macro-cellular LTE networks, where user traffic demands are sufficient to reach an ‘interference limited’ state on all cells during busy times. Interference (as opposed to coverage) limited networks are those that have reached full capacity. In real world networks however, there several factors which impact the actual traffic levels generated by eNodeBs. The following sections highlight some of these factors and describe their impact on busy time mean and quiet time peak characteristics. It is recommended that operators take these factors into account and adapt the mature network provisioning figures to fit their unique deployment conditions.
Last mile Provisioning dominated by peak
Aggregation & coredominated by mean
eNodeBs
Transport Network
ExternalNetworks
Figure 12 Impact of busy time mean and quiet time peak on different parts of the transport network Figure 12 shows how different parts of the transport network are impacted by the different characteristics of the proposed traffic model. The peak tends to be dominant in last mile provisioning, whereas the busy time mean, because it is assumed to occur simultaneously across the network, impacts provisioning towards the core.
5.1. Network maturity and device penetration The eNodeB traffic characteristics represent mature networks, where cells will be simultaneously serving multiple UEs during busy times. ‘Busy time’ can be viewed as when the offered load from UEs approaches the cell’s capacity. In the early days after rollout, there may not be sufficient device penetration for this to occur anywhere in the network. During this period, although ‘busy time’ load may not be reached, the generally light network loading conditions will still be conducive to achieving high peak rates for the few ‘early adopter’ UEs. Interpreting this to the backhaul, the last mile will still need to be provisioned for the chosen peak rate from day one (likely driven by marketing or device capability). On the other hand, provisioning in the aggregation and core of the transport network can initially be reduced, and then gradually ramped up as the loading increases towards the levels described in this report.
5.2. Load variation between sites It has been observed that large proportion of backhaul traffic is generated by small proportion of sites, suggesting wide variation in traffic levels across the sites. Since the figures in this report assume all cells are equally busy, they may overestimate traffic levels in the aggregation and core of the transport network. A network covering a wide area may operate at average cell loads of around 50% of the full loads given in this report. As previously mentioned, last mile provisioning will be dictated by the quiet time peak rate and which should be the same for all cells.
5.3. High mobility sites Sites serving motorways or railway tracks will have higher handover rates than most other sites. As described in section 3.1.1, this will result in a higher level of mobility signalling over the X2 interface. This additional overhead applies only to the busy time mean, as peak rates don’t occur during handovers.
5.4. Small or isolated cells Where cells benefit from some isolation from their neighbours, the reduced levels of interference can lead to higher levels of backhaul traffic. It is anticipated this may occur in small cells ‘down in the clutter’ near street level or indoors. An isolated site with no near neighbours will also benefit for the same reasons. As well as increases to the busy time mean, there will be an increased likelihood of the quiet time peaks occurring at such sites.

17
Next Generation Mobile Networks LTE Transport Provisioning
NGMN Confidential 17 of 18
6. Conclusions This report proposes a model for predicting traffic levels in transport networks used to backhaul mature, fully loaded LTE eNodeBs. Guidance is also given on how results can be adapted to suit other conditions, such as light loading in the early days after roll out. This theoretical approach based on simulations provides a useful stop gap until real world networks are sufficiently loaded to be able to perform measurements to characterise backhaul traffic. Backhaul traffic comprises several components, of which user plane data is by far the largest. This is evaluated on a per cell basis and there are often multiple cells per eNodeB. LTE network simulations revealed the characteristics of cell throughput: During busy times, the many users sharing the cell have an averaging effect, and cell throughput is characterised by the cell average spectral efficiency. Surprisingly, it is during quiet times that the highest cell throughputs occur, when one UE with a good radio link has the entire cell’s spectrum resource to itself. A typical 2x2 10MHz cell provides up to 11Mbps of downlink user traffic during busy times, but during quiet times can supply an individual user with up to 59Mbps. This peak rate represents that achieved by the top 5% of users in a simulation with a low offered load. In practice, peak provisioning might also be influenced by the need to advertise a particular rate to attract consumers. The backhaul traffic for eNodeB contains user data for one or more cells, plus traffic forwarded over the “X2” interface during handovers, plus overheads for transport protocols and security. Signalling for control plane, system management and synchronisation were assumed to be negligible. When calculating traffic provisioning for multiple eNodeBs, it is assumed that the quiet time peaks do not occur at the same moment across all eNodeBs, but that the busy time mean traffic does. Figure 13 shows transport provisioning curves for the ‘vanilla’ LTE with 2x2 downlink and 1x2 uplink configurations for both 10MHz and 20MHz system bandwidths. X-axis scales are given for both tricell and single cell eNodeBs. Provisioning curves for other eNodeB configurations are given in the report. IPsec encryption would increase these provisioning figures by 14%. Curves in Figure 13 represent a general case for fully loaded eNodeBs. Actual traffic levels for individual eNodeBs may vary about these levels depending on the deployment scenario and loading level.
Single cell eNBs: 1 2 3 6 9 12 15 18 21 24 27 30
00.10.20.30.40.50.60.7
0 1 2 3 4 5 6 7 8 9 10
Prov
isio
ning
Gbp
s
Tricell eNodeBs
DL 2x2, 20MHzUL 1x2 20MHzDL 2x2, 10MHzUL 1x2 10MHz
Figure 13 LTE Transport Provisioning for Downlink and Uplink (no IPsec)
The degree of traffic aggregation is smallest in the ‘last mile’ of the transport network, and greatest in the ‘core’. Since the ‘last mile’ typically backhauls only a small number of eNodeBs, provisioning tends to be dominated by the peak rate required individual cells. Towards the ‘core’ it is the busy time mean rate occurring simultaneously across all cells which determines provisioning. Overall, this study shows that although LTE is capable of generating some very high peak rates, when the traffic of multiple cells and/or eNodeBs are aggregated together, the transport provisioning requirements are quite reasonable.

18
Next Generation Mobile Networks LTE Transport Provisioning
NGMN Confidential 18 of 18
7. References [1] “Requirements for Evolved Universal Terrestrials Radio Access Network”, 3GPP Specification 25.913,
http://www.3gpp.org/ftp/Specs/html-info/25913.htm [2] “LS on LTE performance verification work”, 3GPP document R1-072580, May 2007,
http://www.3gpp.org/ftp/tsg_ran/WG1_RL1/TSGR1_49/Docs/R1-072580.zip [3] “Latest results from the LTE/SAE Trial Initiative”, February 2009
http://www.lstiforum.org/file/news/Latest_LSTI_Results_Feb09_v1.pdf [4] 3GPP TR 25.815 v7.1.1, Physical layer aspects for evolved Universal Terrestrial Radio Access
(UTRA), Sept. 2006. [5] “The LTE/SAE Trial Initiative”: www.lstiforum.com [6] “Summary of Downlink Performance Evaluation”, 3GPP document R1-072578, May 2007. [7] “NGMN TE WP1 Radio Performance Evaluation Phase 2 Report” v1.3 5/3/08 [8] “NGMN Radio Access Performance Evaluation Methodology”, v1, Jan 2008,
http://www.ngmn.org/nc/downloads/techdownloads.html [9] “Right Sizing RAN Transport Requirements”, Ericsson Presentation, Transport Networks for Mobile
Operators, 2010 [10] “LTE requirements for bearer networks”, Huawei Publications, June 2009,
http://www.huawei.com/publications/view.do?id=5904&cid=10864&pid=61 [11] “Sizing X2 Bandwidth For Inter-Connected eNodeBs”, I. Widjaja and H. La Roche, Bell Labs, Alcatel-
Lucent [12] “Backhauling X2”, Cambridge Broadband Networks , Dec 2010,
http://www.cbnl.com/product/whitepapers/