Embed Size (px)
Citation preview

SPE 156330
A Wellbore Stability Approach For Self-Killing Blowout Assessment Stephen M. Willson, Apache Corporation, Houston, TX
Copyright 2012, Society of Petroleum Engineers This paper was prepared for presentation at the SPE Deepwater Drilling and Completions Conference held in Galveston, Texas, USA, 20–21 June 2012. This paper was selected for presentation by an SPE program committee following review of information contained in an abstract submitted by the author(s). Contents of the paper have not been reviewed by the Society of Petroleum Engineers and are subject to correction by the author(s). The material does not necessarily reflect any position of the Society of Petroleum Engineers, its officers, or members. Electronic reproduction, distribution, or storage of any part of this paper without the written consent of the Society of Petroleum Engineers is prohibited. Permission to reproduce in print is restricted to an abstract of not more than 300 words; illustrations may not be copied. The abstract must contain conspicuous acknowledgment of SPE copyright.
Abstract An analysis approach to assess borehole stability following a hypothetical blowout from representative deepwater scenarios is
presented. It addresses whether imposed underbalanced conditions cause sufficient instability that the borehole bridges-over and the
well kills itself. The approach uses a series of interrelated analyses: (i) analyses of the kick and blowout development are performed
predicting how bottom pressure and in-flow velocity changes over time; (ii) underbalanced wellbore failure in exposed shales and
sands is then determined; (iii) cavings and produced sand volumes are calculated from the estimated failure zone, and the transport of
these materials in the borehole is determined from the predicted hydrocarbon flow rates; and (iv) bridging tendency is assessed by
considering the concentration of cavings in either the enlarged borehole or in flow-paths within the well casing or annuli.
To the best knowledge of the author, the proposed analysis presents the first in-depth study of transient wellbore instability, sand /
cavings transport and bridging tendency during a blowout. Analyses applied to a typical deepwater blowout scenario suggest that
bridging leading to self-killing can occur only in a small number of situations. This differs from the more widely published data from
shallow water Gulf of Mexico Shelf wells which show that self-killing is likely in shallow-hazard scenarios.
Important conclusions from the study are: (1) bridging and self-killing can occur in kicks resulting from a catastrophic loss of riser
integrity, due to the loss of the riser margin causing underbalanced conditions in openhole sections of the borehole; and (2) bridging
and self-killing is more likely to occur in a well control event that develops while drilling-ahead, due to plugging of the borehole/drill-
pipe annulus. Bridging is less likely to occur if a kick develops with the drill-pipe not in the open-hole interval. For self-killing to
happen this study concludes that it has to occur during the time that the kick is developing – i.e. before hydrocarbons reach the
wellhead. Once the kick has fully developed into a blowout it is predicted that typical high productivity deepwater reservoirs will
have attained sufficient borehole flow velocity (in the absence of major constrictions to flow) that spalled or produced formations will
be transported from the wellbore without bridging. Once a blowout has occurred, therefore, it is largely too late to consider future
bridging as a means of terminating the flow, at least in the short-term.
Introduction Uncontrolled influxes of formation fluids into a borehole (a “kick”) develop into a blowout when the drilling fluid is fully displaced
from the well and the formation fluid exits the well. In the case of subsea deepwater wells, the wellhead is at the sea-floor and is
connected to the drill rig by a marine riser. Depending upon the integrity of the well and the riser following a blowout, hydrocarbon
discharge may be at the sea-floor, at the rig floor, or at some point in-between. An influx of hydrocarbons, especially gas, is more
severe than an influx of overpressured water. Occurrences of over-pressured water (“shallow water flows”) or shallow gas influx are
well understood from a shallow hazards perspective[1]
. Another possible route for hydrocarbons to reach mudline is via an
“underground blowout”. This occurs when the hydrostatic pressure in the borehole exceeds the fracture gradient of exposed
formations. In these circumstances the increased borehole pressure from activating the BOP and killing the flow up the wellbore can
cause fracturing of the formation and, depending upon the overburden geology, can result in fractures propagating around the wellbore
to seabed.
As a kick develops, the drilling fluid is displaced from the well by the influx of less dense fluids that have a formation pressure
greater than the hydrostatic pressure exerted by the drilling fluid. The bottom-hole pressure in the wellbore thus reduces during the
developing kick, thereby accelerating the influx. When all the drilling fluid is displaced from the wellbore a condition of unrestricted
open flow occurs (i.e. with a hydrocarbon fluid column to the wellhead), and the blowout continues until terminated by natural causes
or external intervention. The natural causes of terminating a blowout include depletion (depressurization) of the formation, water
breakthrough (particularly in “shallow-hazard” gas blowouts), wellbore collapse or from bridging at choke-points by produced
formation solids entrained in the hydrocarbon flow. The size, productivity and over-pressured nature of many deepwater reservoirs
preclude depletion and water breakthrough as being viable self-killing methods within acceptable timescales.

2 STEPHEN M. WILLSON SPE 156330
This study focuses on whether the reduction in bottom-hole pressure during a blowout would be sufficient to cause the wellbore to
collapse and for the produced solids to bridge inside the wellbore. Flak[2]
commented that “Ultra-deepwater blowout risk is mitigated
by low formation strength. Natural well bridging would shut off most blowouts.” However, experiences from deepwater blowouts do
call into question whether bridging can be relied upon as a mechanism to limit the duration of blowouts. In deeply-buried Paleocene
and Eocene formations in the Gulf of Mexico, or in sub-salt Cretaceous-aged sediments offshore Brazil, stronger, more competent
formations, may be less conducive to bridging and self-killing. Therefore, as part of blowout contingency planning, assessing the
potential to self-kill should be addressed along with other kill options. In order to address these issues it is considered important that
suitable methodologies be devised to assess whether bridging and self-killing may be a viable mechanism for particular well blowout
scenarios.
Possible Causes for a Blowout The main focus for this study is the analysis of blowouts occurring during drilling. Kicks and blowouts occurring during completion,
work-over or abandonment operations are outside the scope of this work, as they would be unlikely to involve the possibility of
formation failure as a self-killing mechanism. (The prevalence of sand-control completions in deep-water makes it unlikely that
significant volumes of formation could be produced into the wellbore, even during a kick when running the completion).
Inevitably, for a blowout to occur during drilling operations a number of cascading failures have to happen. These likely will
involve both failures of human decision-making and safety equipment – see for example the 2011 US National Academy of
Engineering and National Research Council’s Report[3]
or the BP Report[4]
into the Macondo blowout. However, this study will not
dwell further on the chain of events leading to a blowout. Rather, two scenarios of interest are: (i) flow to the rig-floor via the marine
riser, or (ii) flow to the seafloor, occurring via the main-bore of the well or via a casing annulus. In each case a failure of the blowout
preventer (BOP) would be required in order for flow to enter the riser or be discharged to the sea.
A number of different possibilities and configurations exist within these two general scenarios. For example, flow to the rig-floor
results from rig operations that lead to a reduction in hydrostatic pressure to below reservoir pressure and would require that the
hydrocarbon influx to the wellbore went undetected. Other scenarios might include drilling into an overpressured formation, with
formation fluid pressure higher than the mud hydrostatic pressure that sets off a series of events leading to a blowout. Another
possible significant precursor event to a blowout is the catastrophic failure of the marine riser connecting the seabed wellhead to the
rig[5].
Here, the consequent loss of the “riser margin” leads to an underbalanced condition in the wellbore, so promoting an influx of
hydrocarbons.
In deepwater drilling parlance, the pressure difference between the hydrostatic pressure developed by the mud column within the
riser and the surrounding seawater is called the “riser margin”. The vertical length of this mud column in the riser extends from the
mud flow line located below the rig floor of the floating rig (some distance above sea level) down to the Lower Marine Riser Package
(LMRP) that connects the riser to the BOP and subsea wellhead. After the riser is disconnected, only seawater hydrostatic is applied
at the wellhead. This sudden loss of mud pressure presents a major well control problem. The deeper the water the greater the change
in fluid pressure, as given by equation 1.
Riser margin pressure loss = constant × [ (RTE + Depth)*MW – Depth*SWD ] ........................................................... Eq. 1
where RTE = rotary table elevation above sea level; Depth = water depth; MW = mud weight in the riser; and SWD is the sea-water
density. The value of the constant equals 0.05195 for pressure loss in psi with depths in ft and densities in pounds per gallon (ppg).
The constant equals 0.0098 for pressure loss in MPa, depths in metres and densities in specific gravity (SG) units.
As an example, consider drilling in 5,000 ft water depth, with a drill floor elevation of 100 ft. If the mud density is 14.3 ppg (1.71
SG) and the seawater density is 8.60 ppg (1.03 SG), then losing the riser would cause a 1,555 psi pressure drop as the mud column is
replaced by seawater hydrostatic pressure. In deep-water, the often high pore pressure and narrow drilling margin between pore
pressure and fracture gradient in any hole section means that it is often impractical to drill with a mud weight that provides an
adequate riser margin at all times (i.e. a mud weight that would at least balance pore pressure were the riser to be lost). In these
circumstances, mud weights that provide only a nominal overbalance relative to pore pressure with a full mud column to surface are
used, and any loss of riser integrity would lead to a loss in bottomhole pressure and result in underbalanced conditions down-hole.
This can lead to a fluid influx and possible borehole collapse, depending upon the actual situation.
Literature Review & Occurrence of Bridging One of the earliest compilations of blowouts on the Outer Continental Shelf of the United States (OCS) was presented by
Danenberger[6]
. Reviewing occurrences over a twenty-one year period (1971-1991), 87 blowouts occurred during the drilling of
21,436 wells. Most of the blowouts were attributable to shallow gas influxes and were of short duration: 18 (20.7%) stopped flowing
in less than an hour; a cumulative total of 50 (57.5%) in less than a day; and a total of 73 (83.9%) in less than a week. Most (62 or
71.3%) of the wells stopped flowing when unconsolidated formations in the open borehole portion of the well either bridged or
collapsed and sealed the well. Of the 62 flowing wells that bridged, 55 did so in less than a week. Of the wells that did not bridge, all
but two were controlled by pumping mud or cement or by actuating the BOP. The two exceptions involved trapped gas that dissipated
quickly after release. Although relief wells were initiated during several of the blowouts in Danenberger’s compilation, all of the
flowing wells were controlled by other means prior to completion of the relief wells.

SPE 156330 A WELLBORE STABILITY APPROACH FOR SELF-KILLING BLOWOUT ASSESSMENT 3
The most quoted published reviews of blowout occurrence are those of Skalle et al[7],[8]
and Holand[9]
. They also reviewed blowout
records from the 1960s through the mid-90s. As such, their data provides only a review of past experiences from a subset of wells that
does not include the large number of deepwater wells drilled since the mid-90s. Therefore, bridging risk and blowout duration
represented in their data is not fully representative of all classes of wells being drilled today, or which will be drilled in the future. For
this reason a short summary of pertinent data only will be presented here.
Skalle et al[7],[8]
present a statistical analysis of killing
methods and consequences of 1013 blowouts experienced in
wells drilled from 1960 to 1996 in Texas (826 wells) and on the
Outer Continental Shelf (OCS, 387 wells). They found that
bridging accounted for 39.6% of the killed blowouts on the OCS.
This was the most common cause of killing, as shown in Figure
1. Weighted mud was the most common well control method
applied in the Texas wells, accounting for 43% of the wells
surveyed, as shown in Figure 2. Only 16% of blowouts in Texas
were killed by self-bridging, this being a reflection of the varied
lithology possible across the State. Overall, considering both
OCS and Texas data, two-thirds of the blowouts in the study
either bridged or were killed by pumping weighted mud.
Figure 3 shows the depth of blowouts in 800 wells drilled
from 1960 to 1996 in Texas and OCS[7]
. It should be noted that
over this time period the total number of wells drilled deeper
than 18,000 ft would have been relatively small, and so the
preponderance of relatively shallow events is, in part, a
reflection of the technology available at the time (both in terms
of drilling and seismic). Superimposed on this figure are typical
depth ranges for normally- and over-pressured formations typical
of the US Gulf Coast region[10]
. In both datasets (TX and OCS),
three-quarters of all blowouts occurred at depths shallower than
10,000 ft, where formations are typically expected to be
normally-pressured. Formations capable of flow over these
depths would be unconsolidated, and any small overpressure
likely due to gas-filled sands (potentially biogenic in nature) –
either of limited extent, or sitting atop normally-pressured
aquifers. The fairly rapid and successful self-killing of blowouts
occurring at these depths is, therefore, a consequence of these
pertinent geologic conditions (unconsolidated sands, modest
overpressure and, oftentimes, an aquifer present).
Holand[9]
presents a synthesis of 124 offshore blowouts that
occurred on the outer continental shelf of the U.S. Gulf of
Mexico and in Norwegian and United Kingdom waters in the
period from January 1980 to January 1994. The data are from the
SINTEF Offshore Blowout Database. Holand shows that most
blowouts occur during drilling (82 events, 66%). Work-over
blowouts (19 events, 15%) occurred more often than completion
and production blowouts. Of the blowout events that occurred
when drilling, 29% occurred while actually drilling; 24%
occurred while tripping; and 20% while running casing.
Figure 4 summarizes the fluid produced during the reported
blowouts. Data from both Skalle et al and Holand are presented
here. Both indicate that gas is the most common blowout fluid.
This is perhaps not surprising given that overpressured shallow
gas hazards are common in the Gulf of Mexico Shelf and in
deep-water, and that gas blowouts develop most quickly. Figure 5 shows the duration of blowout occurrence from Skalle et al’s data.
Holand’s data, though presented over different time intervals, shows a similar cumulative distribution of blowout duration. The figure
shows that 70% of the recorded blowouts were killed within 2 days. This statistic is consistent with data presented in Figures 1 and 2
which show that two-thirds of blowouts either bridged or were killed by pumping weighted mud, events that could happen quite soon
after the blowout first occurred.
1

4 STEPHEN M. WILLSON SPE 156330
The historical Gulf Shelf databases promote the suggestion that a large proportion of shallow blowouts will be self-killing. (These
are believed to have been largely due to drilling into limited-size “shallow hazard” gas pockets, often overlying normally-pressured
water aquifers.) This perception has sometimes been applied to deeper-water well control events, where the question of self-killing
has also arisen. However, more recent evidence from deeper-water shallow water flows does call into question the ability of
significant flows from overpressured shallow saline aquifers to
bridge-over within a reasonable time period, and without causing
significant damage to well integrity and subsea infrastructure.
Two relevant deepwater examples occurred at Ursa (Mississippi
Canyon Blocks 809, 810, 853 and 854)[11]
and at the Ozona
prospect in Garden Banks Block 515[12]
. In both these examples,
overpressured sands were encountered between 1,000 ft and
2,500 ft below mud line. The high pressure of these sands
relative to their fracture gradient resulted in difficult drilling
conditions in the upper hole sections at these locations, where
the formations were drilled riserless using seawater or sacrificial
weighted mud. In many cases the overpressured sands were
drilled with insufficient mud density and the subsequent brine
flows to the seafloor transported significant volumes of entrained
sands and sediment from depth which resulted in buckling and
collapse of well casings due to the loss of lateral support. In the
case of the Ozona prospect, sustained brine flows around the
surface casing of well Garden Banks 515-2 persisted for about
nine months before flow ceased[11]
. Recent Gulf of Mexico data
(available from the former MMS) shows that between January
2005 and January 2009, thirty-five deepwater wells experienced
shallow water flows; these were of low or minor severity. The
duration of these flows is not known, but the available published
literature from deep-water does not support the shallow-water
view presented in Figure 5 that three-quarters of blowouts are
over within 2 to 3 days. The larger volumes of overpressured
shallow reservoir sands can flow for prolonged periods, and
despite entraining large volumes of uncemented sediments do
not appear to be self-killing through bridging mechanisms.
In the published literature there has been very limited
attention given to analysis of self-killing blowouts. In one 2006
paper on the subject, Nesheli and Schubert[13]
attempted to
evaluate the bridging tendencies in deepwater wells using
wellbore breakout analysis. They believed that the wider the
breakout, the easier it would be for the well to be self-bridging during a blowout. However, they did not consider cavings volumes or
transport (i.e. bridging), and the wellbore stability analysis approach employed is considered simplistic for this particular problem.
Their analyses suggested that bridging would inevitably occur at depths greater than 2000 ft below mudline in wells drilled in 1000 ft
water-depth, and at depths greater than 4000 ft below mudline in wells drilled in 10,000 ft water-depth. There is no field evidence to
support this view, and indeed in this present work the key issues are seen to be the rate of borehole failure and the transport and
bridging tendency of the failed borehole material, aspects of the problem that are not considered in the Nesheli and Schubert paper.
Other work relevant to the question of borehole collapse when subjected to “blowout-like” borehole pressure changes was
conducted by Jourine et al[14],[15]
. In their work, fluid-saturated hollow-cylinder specimens of Berea Sandstone (with approximately
7000 psi / 48.3 MPa unconfined compressive strength and 710 psi / 4.9 MPa tensile strength) were subjected to rapid reductions in
internal borehole pressure – over 5,800 psi / 40 MPa reduction in as little as 1 second. The externally applied stresses on the samples
were of sufficient magnitude that borehole failure would be expected had simple “undrained” conditions of failure occurred. During
truly undrained loading conditions, any reduction in borehole pressure that creates a differential pressure between the borehole fluid
and pore fluid in the rock that is greater than the rock’s tensile strength should cause borehole failure as a result of the creation of
tensile radial stresses at the borehole wall. (A process that causes splintery cavings when drilling underbalanced, particularly in gas-
bearing tight rocks). The results and analysis of Jourine et al showed that poroelastic pressure changes within the rock were not as
‘instantaneous’ as the pressure changes within the central borehole and that the peak tensile stresses depend upon the timescale over
which the boundary pressure is changed. A feature of Jourine et al’s work is that the Berea Sandstone tested remained stable during
the process of rapid pore pressure reduction. This observation calls into question whether the undrained failure ‘rule-of-thumb’ (pore
pressure change > tensile strength) is realistic when considering borehole collapse; this suggests that moderately competent sandstones
may not fail as perhaps expected during a blowout event.
4

SPE 156330 A WELLBORE STABILITY APPROACH FOR SELF-KILLING BLOWOUT ASSESSMENT 5
Considering real-life examples of blowouts, a search of the Internet will provide various websites describing past events. Almost
by definition, these prolonged blowouts released significant volumes of hydrocarbons and evidently did not bridge-over or suffer
borehole instability sufficient to reduce the blowout rate. A brief description of some notable offshore blowouts is given below:
On January 28, 1969, a blowout occurred from well number 5 on Union Oil’s Platform A at the Dos Cuadros field located in
the Santa Barbara Channel, California. The blowout lasted eleven days and released an estimated 80,000 to 100,000 barrels oil.
Insufficient mud weight while drilling resulted in a kick from the overpressured formation. Though the well was shut-in at the
wellhead, an ensuing underground blowout (i.e. fracturing of the formation in the open uncased borehole) propagated fractures to
seabed through which the oil and associated gas was able to flow. This event and the resulting pollution ultimately led to State
and Federal bans on offshore drilling in California that remain in force today.
Starting on June 3, 1979, the Ixtoc I well blowout in Mexico’s Bay of Campeche subsequently took 9 months to kill and released
an estimated 3.5 million barrels (140 million gallons) of oil. A kick developed after losing returns caused by drilling into a zone of
lowered fracture gradient (or fractured formation) at a depth of about 3,600 metres (11,800 ft) below mudline. Upon tripping out of the
hole, a kick was swabbed into the well. Attempts were made to shut-in the well, but the drill-collars were inside the BOP stack at the
time and these prevented the shear rams from cutting the pipe and the pipe rams from closing around the drill-string. The well was
subsequently killed by drilling a relief well.
On August 21, 2009, a blowout occurred at the Montara Wellhead Platform located off the northwest Australian coast in the Timor
Sea. The cement in the well and the float equipment failed to prevent flow from the reservoir into the casing. When the temporary
suspension well cap was removed to begin completion operations, the BOP was not installed. This left the well open and flow began
from the reservoir, eventually reaching the surface where it could not be controlled. The operator estimated that 400 barrels of crude
oil were spilled per day, though Australian Governmental sources estimated that the leak rate could be as high as 2,000 bpd. The
blowout continued until November 3, 2009 when the operator successfully completed a relief well and killed the Montara well after
pumping approximately 3,400 bbls of heavy mud to kill the flow.
Details regarding the most recent Gulf of Mexico case – the Macondo well, drilled in Mississippi Canyon Block 252 – can be
found in several in-depth investigations into the accident[3],[4]
.
BOEM NTL No. 2010-N06 on Worst Case Discharge As a consequence of post-Macondo regulation, the U.S. Department of Interior Bureau of Ocean Energy Management (BOEM, now
the Bureau of Safety and Environmental Enforcement, BSEE) Notice to Lessees (NTL) No. 2010-N06 requires Worst Case Discharge
Calculations (WCD) be made for all new well permits[16]
. As part of these new regulations, it is necessary to consider each
hydrocarbon-bearing hole section that will be drilled as a possible candidate for the Worst Case Discharge Scenario during an
uncontrolled flow event. The Notice states that the following information is required:
“Provide a scenario for the potential blowout of the proposed well in your plan or document that you expect will have the highest
volume of liquid hydrocarbons. Include the estimated flow rate, total volume, and maximum duration of the potential blowout.
Discuss the potential for the well to bridge over, the likelihood for surface intervention to stop the blowout, the availability of a rig to
drill a relief well, and rig package constraints. Specify as accurately as possible the time it would take to contract for a rig, move it
onsite, and drill a relief well, including the possibility of drilling a relief well from a neighboring platform or an onshore location.”
At present, the requirements for demonstrating the potential for bridging are not well defined. In its “Guidance for Complying
with BOEM NTL No. 2010-N06 on Worst Case Discharge for Offshore Wells”[17]
the Society of Petroleum Engineers (SPE) advises
that when considering “formation sloughing” the “BOEM guidance is to assume no formation sloughing or hole collapse within the
calculation period. Although there is a high likelihood of formation solids production at high rates, the effect of solids production on
hole conditions cannot be reliably estimated for most wells. Hole size will be assumed to be constant at the drilled diameter.”
Immediately following, when discussing “bridging”, the document notes: “If available, mechanical earth models or flux
calculations may be used to estimate when an open hole section would collapse and bridge off; however, guidance from the BOEM is
that this prediction should be illustrated with nearby and appropriate analogs if this argument will be invoked. If available and
appropriate, include a detailed history of the analog event along with core photos and descriptions of the failed intervals, if
available.”
It is possible that analysis and analogs may be able to verify the bridging tendency of shallow-gas influxes in unconsolidated
sediments, particularly if limited in volume or associated with water production. It is believed that deeper-water experiences of this
occurring may be far fewer in number, however. For well locations where few offsets exist, or where well control events have been
limited to small-volume kicks that were subsequently controlled, it is necessary that an appropriate methodology be developed to
assess the potential for bridging, as the NTL allows. This requires an understanding of when “formation sloughing” and “bridging”
might be expected to occur during a blowout.
Self-Killing Blowout Analysis Methodology The apparent lack of attention by the petroleum geomechanics community to the question of borehole stability during a blowout has
prompted this current work. The analysis approach suggested here considers a series of interrelated analytic or semi-analytic analyses
that address individual aspects of the problem. This allows key assumptions and parametric uncertainties and sensitivities to be easily
recognized and investigated. More complicated – and fully-integrated and coupled – numerical simulators could be developed in the
future, but even here the individual problem elements need to be defined ahead of time. This paper sets out a series of applicable
problem elements for each aspect of the problem. Four major analysis modules are envisioned:

6 STEPHEN M. WILLSON SPE 156330
Fig. 6 – Pore Pressure, Fracture Gradient and Overburden profiles
used in representative analyses of self-killing blowouts
1) Kick–development analysis: This determines how long it will take for the kick to develop into a blowout, and how the bottom-hole
pressure and in-flow velocity changes during this time.
2) Assessment of borehole collapse: Knowing the bottom-hole pressure variation, the potential for wellbore failure in exposed shale
and sand formations then needs to be assessed.
3) Cavings volume and transport analysis: The cavings volume then has to be calculated from the time-varying evolution of the
failure zone surrounding the borehole. Cavings transport should be assessed, taking into account the assumed geometries of failed
material from the borehole wall and knowledge of the fluid velocity profile within the borehole.
4) Cavings bridging analysis: Bridging tendency should then be assessed by considering the concentration of cavings and spalled
material within the borehole and cased portions of the wellbore. Any potential alterations or constrictions to flow – such as in regions
of enlarged borehole diameter, partially-sheared wellbore tubulars through the BOP, or other tortuous flow-paths need to be
considered, as these are all possible locations where particle settling or bridging may occur.
Representative Scenario Analyzed in this Study In-Situ Stresses
The open-hole blowout scenario that will be illustrated using the proposed methodology has been based upon typical deepwater-like
overburden, fracture gradient and pore pressure profiles (Figure 6).
In the analyses, mudline is taken at 5100 ft depth below the rotary table, with a rotary table elevation of 100 ft above mean sea
level. The water depth is therefore 5000 ft, with a mudline hydrostatic pressure of 2233 psi (a 1.03 SG sea-water density). A series of
three oil-bearing sands are assumed, with an initial pressure of 13.0 ppg equivalent mud weight (EMW). These are also shown in
Figure 6.
Sand#1: 18,050 – 18,070 ft TVD.BRT; 13.0 ppg / 12,196 psi
Sand#2: 18,100 – 18,175 ft TVD.BRT; 13.0 ppg / 12,249 psi
Sand#3: 18,200 – 18,220 ft TVD.BRT; 13.0 ppg / 12,297 psi
The profiles of Fig. 6 are reproduced in Figure 7, but in pressure
units rather than equivalent mud weights. It is assumed that the
well is drilled with a mud weight that is 0.3 ppg higher than the
in-situ shale pore pressure. With reference to the earlier
discussion of “riser margin”, this mud weight is insufficient to
provide overbalanced conditions should the additional
hydrostatic pressure from the drilling mud in the marine riser be
lost due to a loss of containment at mudline.
One blowout scenario, therefore, would be if the marine
riser detaches from the BOP and the mud hydrostatic in the riser
is lost. The ‘instantaneous’ bottomhole pressure and induced
underbalance caused by losing the riser is also shown in Fig. 7.
Figure 8 presents a detailed view over the depth range 17,200 ft
to 18,300 ft. In the analysis considered here it is further
assumed that a 9⅝" casing is set at 17,200 ft TVD.BRT, so
leaving a 850 ft-long shale section exposed above the top sand
and, cumulatively, a total of 900 ft of exposed shale between the
shoe and the base of Sand #3. For analyses of cuttings transport
it is further assumed that 5½" drill-pipe is present in the
borehole – i.e. the well is drilling ahead – at the time that the
kick initiates.
In the profiles shown in Fig. 8, losing the riser would
impose a significant underbalance relative to shale pore pressure
of about 1270 psi. This is large relative to the anticipated
formation strength, and would be expected to give rise to some
instability in the exposed shale sections. Losing the riser
margin only modestly underbalances the sands – at least
initially, based on this static analysis of pressure differentials.
Using pressures predicted at average depths in the sands, the
loss of the riser would create on average an underbalance of 277
psi in Sand #1; 260 psi in Sand #2 and 243 psi in Sand #3.
Under these conditions the well would be expected to flow and
the kick develop into a blowout should it not be possible to
close the BOP.

SPE 156330 A WELLBORE STABILITY APPROACH FOR SELF-KILLING BLOWOUT ASSESSMENT 7
Fig. 7 – Profiles used in representative analyses of self-killing blowouts showing the imposed underbalance occurring upon losing the riser.
Fig.8 – Detail of instantaneous pressures existing upon losing the riser over the assumed open-hole interval 17,200 – 18,300 ft TVD.BRT
Geomechanical and Petrophysical Properties
Formation property parameters required in the subsequent
analyses are principally related to strength and flow
characteristics. For the shale formations over the depth range
considered (17,200 – 18,300 ft TVD.BRT) “typical GoM
Shale”[18]
data are used: 1600 psi unconfined compressive
strength; 22° angle of friction; and 0.0001 mD permeability.
For the sand intervals, values typical of high porosity,
unconsolidated sands have been used: 50 psi unconfined
compressive strength; 35° angle of friction; 455 psi thick-walled
cylinder collapse strength; and 400 mD permeability. The
sandstone reservoirs are assumed to have a combined
productivity index of 30 bbl/day/psi. The hydrocarbon oil is
assumed to have a specific gravity of 0.75; and a viscosity of
1.09 cP (at reservoir conditions). Using the profiles and input
properties defined here, subsequent sections will address key
aspects of the proposed “Wellbore Stability Approach for Self-
Killing Blowout Assessment”.
1. Kick-Development Analysis To estimate the Worst Case Discharge and blowout rate, some
form of nodal analysis is generally applied that matches inflow
performance and vertical lift performance for the well[19],[20]
. In
surface blowouts from platform wells, or wells onshore, the
blowout rate is typically controlled by a sonic velocity outflow
condition as the pressure in the wellbore often exceeds
atmospheric pressure. In seabed blowouts (e.g. when the riser
has parted) pressure conditions can be more complex as the
wells blowout against a back-pressure provided by the
hydrostatic pressure of the water column at mudline (or where
the riser break occurs). In an oil blowout, gas breakout from
solution is possible at some point in the wellbore. In a subsea
well where the riser has parted this will depend upon the water-
depth (i.e. hydrostatic pressure), temperature and the bubble-
point of the flowing oil; gas volumes will also be a function of
the gas-oil ratio of the fluid. If the water depth is great enough,
seabed hydrostatic pressure may be greater than the bubble-
point of the oil; if this is the case the flow in the wellbore may
be single-phase. Conversely, in wells where the marine riser is
intact and the kick progresses above the wellhead, gas breakout
will very likely occur at some point within the riser (or possibly
in the wellbore below the wellhead, depending on conditions).
The required Worst Case Discharge calculations are for
steady-state flow from the reservoir. In any calculation of
bridging tendency it is recommended that these calculations be
supplemented with transient multiphase well flow simulations
that model the evolving bottomhole pressure variation as the
kick develops. Dynamic flow simulators such as OLGA
may
be used[21]
, as they have the capability to model gas breakout
from solution as well as the large frictional pressure-drops that
can occur during high-rate multiphase flows. Analyses of the
dynamic evolution of a blowout event show that substantial
changes in bottomhole pressure can occur over a period of
typically 15 minutes to 40 minutes duration as the produced
hydrocarbons displace the drilling fluid from the borehole[22],[23]
.
These more detailed analyses of the bottomhole pressure
evolution during the development of a blowout provide useful
input to calculations of transient borehole instability in order to
assess whether early-time hole collapse and bridging is possible.

8 STEPHEN M. WILLSON SPE 156330
Fig. 9 – Results of a Riser Break Kick-Development Analysis Showing the Influx Volume and Reduction in Bottom-Hole
Pressure as a Function of Time
Fig. 10 - Wellbore collapse due to under-balanced pressure during kick-
development.
For this present work two kick scenarios were modeled using
OLGA
. These permitted simulation of the necessary multiphase
physics of the problem, the densities and rheology of drilling fluid
in the well and inflowing fluid, the instantaneous underbalance
applied upon losing the riser, and the frictional pressure resistance
to flow in the borehole. The result shown in Figure 9 is for the
case of the riser-break scenario. The analysis indicates that the
kick would take just over 22 minutes to develop into a blowout.
Initially the bottomhole pressure would reduce from 13,480 psi
(i.e. the hydrostatic pressure existing while drilling using a 14.3
ppg drilling fluid) to 11,925 psi at the time that the riser parted due
to the loss of the riser margin. This would cause the sands (with
initial pressures ranging from 12,196 psi to 12,297 psi) to be
become underbalanced and the well would begin to flow. Over the
duration of the kick the bottomhole pressure would reduce further
to 6990 psi as the lighter hydrocarbons fill the wellbore.
The riser-break scenario represents a severe loading-case on
the formation due to the sudden reduction in bottomhole pressure
that “kick-starts” the blowout. Bottomhole flowing pressures may
be slightly lower in the case of a flow through the riser to surface
(by the differential between a hydrocarbon gradient from mudline
to surface as opposed to seawater – approximately 600 psi for the
case considered here), but the bottomhole pressure change is more
gradual, at least initially, in the case where a swabbed influx goes
unnoticed and the kick slowly develops as the hydrocarbons rise in
the well and riser. For this reason the analyses reported here will
focus on the riser break scenario. It is, however, interesting to
note that the OLGA
simulations for the swabbed kick case took only slightly longer to develop into a full blowout compared with the
riser break scenario. Here the slower start to the kick was compensated for at later time by the higher influx rate. Also, though the
marine riser adds an additional volume that must be displaced by hydrocarbons, the higher influx rate from the formation and rapid
displacement of drilling mud by exsolved gas within the riser resulted in a roughly similar time for the kick to reach the drill rig. This
is considered coincidental for these particular analyses as the kick development time is sensitive to both water depth and riser volume.
2. Assessment of Borehole Collapse During the Development of a Kick Of interest in this part of the analysis is the
possibility for borehole collapse in deeper
formations that might lead to situations where
plugging or bridging may occur. Conditions
leading to wellbore collapse due to a reduction in
bottom hole pressure can be illustrated
schematically through the use of a Mohr-
Coulomb failure diagram, as shown in Figure 10.
As the bottom-hole pressure decreases the Mohr
circle shifts to the left, so approaching the failure
envelope of the formation. This failure envelope
defines the boundary between permissible (i.e.
“safe”) and inadmissible (i.e. “failed”) stress
states. With the further decrease in bottom-hole
pressure, the Mohr circle contacts the failure
envelope and so wellbore instability occurs. In
the context of a developing underbalance causing
wellbore instability, it is important to note the
difference between failure in weak and strong
formations. In a weak formation, the attainment
of near-balance pressure conditions results in a
combined mode of both compressive and tensile
failure. This is evidenced when drilling in the
field by a mixture of splintery and angular
cavings from weak shales – e.g. as might be seen
when drilling into a pressure ramp (shown in the lower cavings picture in Fig. 10). In contrast, wellbore failure in strong formations is
SPE 156330 A WELLBORE STABILITY APPROACH FOR SELF-KILLING BLOWOUT ASSESSMENT 9
dominated by tensile failure, which is evidenced by predominantly
splintery cavings, such as those that might be produced from a
highly-overpressured gas well when drilling close-to or just under
balanced conditions (left-most cavings picture). The size of the
cavings from weak formations is also larger than those from strong
formations, so making it more difficult for them to be carried to
surface.
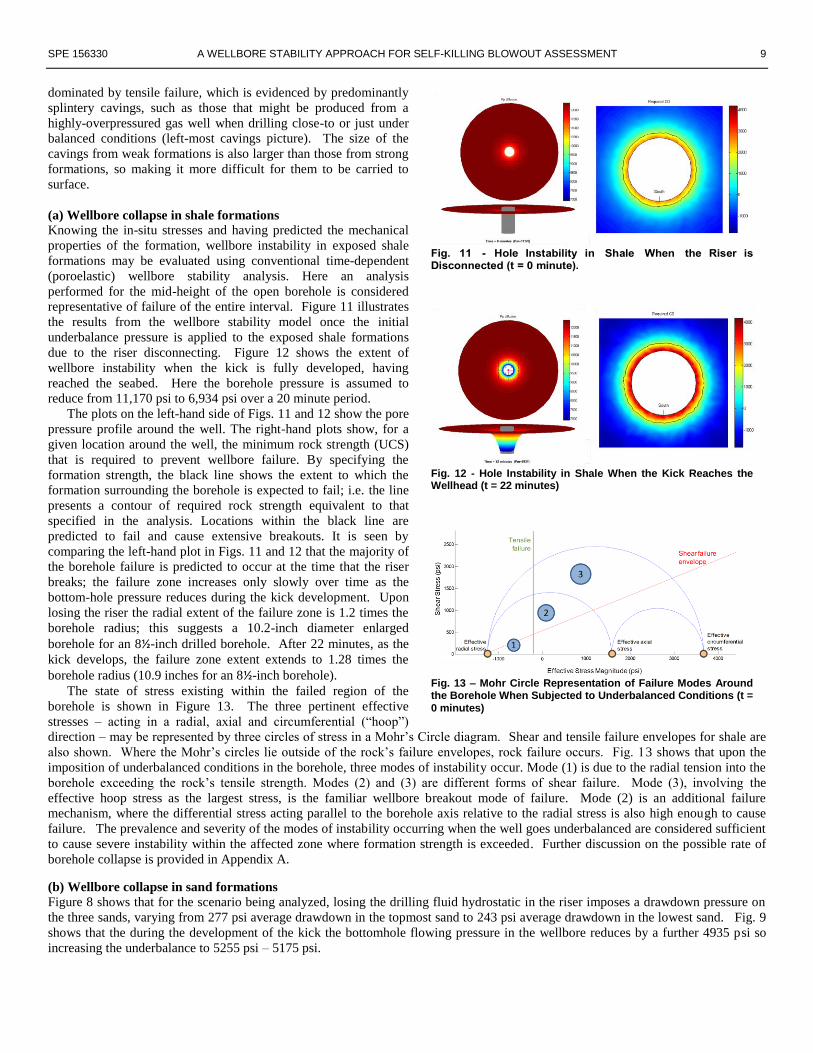
(a) Wellbore collapse in shale formations
Knowing the in-situ stresses and having predicted the mechanical
properties of the formation, wellbore instability in exposed shale
formations may be evaluated using conventional time-dependent
(poroelastic) wellbore stability analysis. Here an analysis
performed for the mid-height of the open borehole is considered
representative of failure of the entire interval. Figure 11 illustrates
the results from the wellbore stability model once the initial
underbalance pressure is applied to the exposed shale formations
due to the riser disconnecting. Figure 12 shows the extent of
wellbore instability when the kick is fully developed, having
reached the seabed. Here the borehole pressure is assumed to
reduce from 11,170 psi to 6,934 psi over a 20 minute period.
The plots on the left-hand side of Figs. 11 and 12 show the pore
pressure profile around the well. The right-hand plots show, for a
given location around the well, the minimum rock strength (UCS)
that is required to prevent wellbore failure. By specifying the
formation strength, the black line shows the extent to which the
formation surrounding the borehole is expected to fail; i.e. the line
presents a contour of required rock strength equivalent to that
specified in the analysis. Locations within the black line are
predicted to fail and cause extensive breakouts. It is seen by
comparing the left-hand plot in Figs. 11 and 12 that the majority of
the borehole failure is predicted to occur at the time that the riser
breaks; the failure zone increases only slowly over time as the
bottom-hole pressure reduces during the kick development. Upon
losing the riser the radial extent of the failure zone is 1.2 times the
borehole radius; this suggests a 10.2-inch diameter enlarged
borehole for an 8½-inch drilled borehole. After 22 minutes, as the
kick develops, the failure zone extent extends to 1.28 times the
borehole radius (10.9 inches for an 8½-inch borehole).
The state of stress existing within the failed region of the
borehole is shown in Figure 13. The three pertinent effective
stresses – acting in a radial, axial and circumferential (“hoop”)
direction – may be represented by three circles of stress in a Mohr’s Circle diagram. Shear and tensile failure envelopes for shale are
also shown. Where the Mohr’s circles lie outside of the rock’s failure envelopes, rock failure occurs. Fig. 13 shows that upon the
imposition of underbalanced conditions in the borehole, three modes of instability occur. Mode (1) is due to the radial tension into the
borehole exceeding the rock’s tensile strength. Modes (2) and (3) are different forms of shear failure. Mode (3), involving the
effective hoop stress as the largest stress, is the familiar wellbore breakout mode of failure. Mode (2) is an additional failure
mechanism, where the differential stress acting parallel to the borehole axis relative to the radial stress is also high enough to cause
failure. The prevalence and severity of the modes of instability occurring when the well goes underbalanced are considered sufficient
to cause severe instability within the affected zone where formation strength is exceeded. Further discussion on the possible rate of
borehole collapse is provided in Appendix A.
(b) Wellbore collapse in sand formations
Figure 8 shows that for the scenario being analyzed, losing the drilling fluid hydrostatic in the riser imposes a drawdown pressure on
the three sands, varying from 277 psi average drawdown in the topmost sand to 243 psi average drawdown in the lowest sand. Fig. 9
shows that the during the development of the kick the bottomhole flowing pressure in the wellbore reduces by a further 4935 psi so
increasing the underbalance to 5255 psi – 5175 psi.
Fig. 12 - Hole Instability in Shale When the Kick Reaches the Wellhead (t = 22 minutes)
Fig. 13 – Mohr Circle Representation of Failure Modes Around the Borehole When Subjected to Underbalanced Conditions (t =
0 minutes)

10 STEPHEN M. WILLSON SPE 156330
Table 1. Results of Sand Influx Analyses During the Kick
Under such severe flow conditions spalling and borehole
collapse may occur in the exposed sandstone. This additional
produced material, together with that from the failing shale
sections, is what may potentially provide a sufficient volume of
material that the borehole flow is impeded and slowed by the
weight of the entrained sand such that the borehole bridges and
the kick kills itself. To assess the sand influx, the analytical
method proposed by Willson et al. (2002)[24]
is used. A
complete description of the model is given in this reference and
a further recapitulation of relevant equations will not be made
here. Broadly speaking, the model is comparable to the
analyses conduced for shale. The rate of sand production is
correlated with extent of rock failure based on the results of
large-scale sand production laboratory tests. The model may be
used for open boreholes, as well as the more conventional cased and perforated completions, provided suitable borehole failure scaling
relationships are applied. These are necessary as it has been shown that large samples fail at lower levels of applied stress relative to
small-scale samples[25,26]
(i.e. unsupported large-diameter boreholes are less stable than perforation tunnels).
Results of sanding analyses during the kick flow are shown in Table 1. For the high flow rates predicted during the kick from 30
bbl/d/psi PI formations, considerable sand production is predicted, at least on a sustained production basis. Knowing the sand
production rate in pounds per thousand barrels (pptb) and borehole geometry, the weight of sand in the wellbore is calculated. While
the eventual sand production rate and total weight of the suspended sand in the wellbore appears large at first sight (almost three tons),
the added hydrostatic pressure in the borehole annulus is actually quite modest (ca. 180 psi at most). Similarly, the sand concentration
in the flowing hydrocarbons is also low. Taking a 2.65 g/cc sand density, the 519 pptb sanding rate is equivalent to only 0.56 bbls of
sand in 1000 bbls of fluid; the higher rate of 5,043 pptb is equivalent to 5.43 bbls of entrained sand. The solids concentration from
sand is, therefore, quite low and – as shown in subsequent sections – insufficient to alter the dynamics of the kick development.
Thus, in this analysis the effects of the produced sand mixed
with the hydrocarbon flow is insignificant to affect the overall
fluid column density within the wellbore. Here, it is concluded
that in situations of Worst Case Discharge from prolific
deepwater reservoirs sand influx cannot be relied upon to stem
the progression of the blowout; i.e. bridging will not occur from
the contribution of produced sand alone.
3. Cavings Transport Analysis While it may be possible for the shale cavings volume to be
large enough to plug the wellbore, self-killing may not happen if
the flow velocity is sufficient to carry the cavings to surface as
they are produced from the failing borehole wall. To address
this, a cavings transport analysis is required. The analytical
model described here is based on the following simplifying
assumptions: (i) all particles have the same size (though more
sophisticated analyses considering a range of particle sizes
could be performed using this model also); (ii) inter-particle
collision and packing is ignored (though this is considered
separately later); and (iii) the fluid flow in the wellbore is a
single phase. The method developed and published by Chien[27]
is used here:
(
)
(
) ................................................................................Eq. (2)
where = sphericity of a particle [dimensionless]; e = effective viscosity [Pa.s]; d = equivalent particle diameter [cm]; f =
wellbore fluid density [g/cm3]; and p = particle density [g/cm
3]. Sphericity is defined as A
s /A
P , where Ap is the surface area of
the caving particle; and As is the surface area of a sphere with the same volume.
Typical cavings from a Gulf of Mexico well suffering instability are shown in Figure 14[28]
. Taking a cavings dimension of 1" 1"
¼", sphericity is calculated to be 0.64. Taking a shale density of 2.2 g/cm3 and flowing oil property values defined previously, the
effects of equivalent diameter on the settling velocity of cavings can be calculated using Eq. 2. Assuming cavings of dimension L"
L" ¼ L", Figure 15 shows the effective settling velocity of cavings of various sizes as a function of blowout flow rate in an 8½" borehole, both with and without drill-pipe present.
Fig. 14 – Cavings typical from a GoM well suffering instability
[28]

SPE 156330 A WELLBORE STABILITY APPROACH FOR SELF-KILLING BLOWOUT ASSESSMENT 11
For the particular analysis case being considered here
(cavings dimension of 1" 1" ¼") the settling velocity is
predicted to be 1.42 ft/sec, equivalent to a flow rate of 8,580
bbl/day in an 8½" borehole without drill-pipe being present, or
4,988 bbl/day for flow in an 8½" 5½" annulus. For a
formation with a PI of 30 bbl/day/psi, this flow rate would be
achieved for a drawdown of 286 psi (with no drill-pipe) or 166
psi for the case of annulus flow. This is equivalent to the
underbalance applied to the sands upon losing the riser margin.
As the formation begins to flow, influx analyses indicate that
this flow rate is surpassed roughly three minutes after the well
begins to flow. The early-time behavior of the kick
development is, therefore, very crucial to the understanding of
whether self-bridging will occur. In particular, the rate of
formation collapse following the imposed drawdown from
losing the riser will dictate whether shale cavings will
accumulate in the open borehole section and potentially bridge
against the drill-pipe in the borehole, or whether the kick influx
rate will increase sufficiently so that shale cavings will be
produced along with the flow in the wellbore. In lower PI
scenarios it is possible that the flow rate may be insufficient,
and here cavings settling would occur. In high PI scenarios
this analysis suggests that cavings transport flow velocities
would be attained quite early-on in the kick development and here bridging may be less unlikely, depending upon the rate of borehole
failure. Further discussion on this is presented in the Appendix.
4. Cavings Bridging Analysis The analyses above have shown that during a blowout, high flow rates may effectively transport spalled material. Depending upon the
geometry of the flow paths necessary for the hydrocarbons to reach the wellhead, bridging may possibly occur where constrictions to
flow exist. Similar to heavy traffic on a freeway, high concentrations of solids slow the flow due to the impact that the suspended
solids have on the effective fluid viscosity. The effect of suspended solids on viscosity was first studied by Albert Einstein in 1906[29]
.
In this study, extensions to Einsteins’ work by Frankel and Acrivos[30]
and Pabst[31]
are used.
The fundamental concept involved with cavings bridging is that as the solids concentration, φ, approaches the critical
concentration, φc, the effective viscosity tends to infinity and flow stops. The critical concentration of monodisperse spheres is
0.64[30]
. The critical concentration of irregularly-shaped cavings is expected to be lower than this. In the minerals processing
literature, critical concentrations of crushed rock slurries (arguably more relevant to cavings transport) indicate critical concentrations
of ca. 0.5 are appropriate[32]
. A viscosity multiplier, , that takes into consideration the concentration of solid particles can be
calculated from established relationships. One such relationship for the viscosity multiplier attributed to Brule and Jongschaap[33]
for
high-concentration slurries is given by:
(
) (
( ⁄ )
⁄
( ⁄ )
⁄) .................................................................................................................................Eq. (3)
The previous analysis for time-dependent instability in shale has shown that the failure zone extends to 1.28 times the original
borehole diameter (10.9" for an 8½" diameter borehole). Considering representative areas, the annular area of the failed solids is 36.6
in2 and the area of the enlarged borehole is 93.3 in
2 if drill-pipe is not present in the borehole, and 69.6 in
2 (equivalent to a 10.9" 5½"
annulus) if the drill-pipe is present.
If all this material falls into the borehole at the same instant, and if the drill-pipe is present, then the maximum solids
concentration possible is 0.53 (i.e. = 36.6/69.6). This is sufficiently close to the estimated critical concentration for angular particles
that bridging of the annulus will occur. This scenario would be similar to becoming packed-off in a poorly-cleaned borehole.
In the case where there is no drill-pipe in the hole, the solids concentration is 0.39 (i.e. = 36.6/93.3); this gives a φ/φc ratio of 0.785
(for a critical concentration of 0.5). Using Eq. 3, the viscosity multiplier, , equals 7.69. Using a more complex relationship
developed by Pabst[31]
, is predicted to be 8.98. Therefore, it is reasonable to assume a viscosity multiplier of about 8 occurring in
the case of the 8½" borehole loading-up with cavings spalled from the borehole wall. Although the flow rate will be slowed by the
increase in effective viscosity of the kick/cavings mixture, the dynamics of the kick evolution will dictate whether significant spalling
could sufficiently impede its progress (via increased viscosity effects) such that the cavings are no-longer suspended in the flow, they
settle, and so plug the borehole. Here, the timing of the instability again becomes important. If failed material remains in-place
initially, but collapses suddenly into the borehole then the possibility for this mechanism of bridging to apply in an open-borehole
Fig.15 – Predicted settling velocity and minimum flow rate required
for cavings transport

12 STEPHEN M. WILLSON SPE 156330
depends upon the prevailing flow rate at the time instability occurs. Referring to Fig. 15 and the cavings settling analyses discussed
previously, if sudden borehole failure occurs late in the development of the kick the ‘choked’ flow rate will still be sufficient to
transport the cavings. Table 1 shows that a flow rate of 68,220 bbls/day will be achieved after only 5 minutes. If shale collapse were
to occur at this time, the flow rate of the kick/cavings mixture could be reduced to 8,528 bbl/day (i.e. by applying a viscosity
multiplier of 8). This is roughly the same as the 8,580 bbl/day settling velocity for flow in an 8½" borehole without drill-pipe present.
Thus, for the particular problem described here, instability occurring during a kick with drill-pipe not present in the 8½" borehole is
unlikely to lead to bridging, as flow rates will exceed the cavings settling velocity - even for slowed flow due to the presence of
cavings. However, bridging between the borehole wall and drill-pipe is possible by achieving critical solids concentrations in
situations where instability occurs with drill-pipe present in the 8½" borehole.
Conclusions A four-step analysis approach for assessing the potential for a blowout to be self-killing has been proposed:
Kick–development analysis: determines how long it will take for the kick to develop into a blowout, and how the bottom pressure and
in-flow velocity changes during this time. Analyses indicate that riser failures that expose the borehole to a sudden underbalance
pressure are necessary to create conditions where bridging may potentially occur. More slowly-developing blowouts (e.g. a swabbed
kick developing into a blowout) are unlikely to result in bridging.
Analysis of borehole collapse: assesses the potential for wellbore failure in exposed shale and sand formations. Results of this study
suggest that kicks from high productivity, overpressured sands will not entrain sufficient produced sand with the hydrocarbon flow to
significantly impede the development of the blowout. The significant changes in borehole pressure caused by a failure of the marine
riser both kick-start the influx of fluids and trigger instability that can lead to conditions where bridging potentially occurs.
Cavings volume and transport analysis: considers the time-varying evolution of the failure zone surrounding the borehole, taking into
account the geometry of failed material from the borehole wall. Analyses show that cavings transport flow velocities will be achieved
early-on in the development of the kick (i.e. before the hydrocarbon influx reaches the wellhead). The timing of borehole failure
relative to kick development therefore becomes a key factor in whether a potential blowout will become self-killing.
Cavings bridging analysis: considers the concentration of cavings and spalled material within the borehole and cased portions of the
wellbore, taking into account any potential constrictions to flow. The analyses show that kick-incurring events while drilling ahead in
an 8½" borehole are most favorable for bridging, as spalled shale cavings plug the borehole annulus. Events occurring in larger hole
sizes, or when drill-pipe is not in the borehole, are unlikely to bridge.
It is hoped that this analysis approach provides new clarity to the factors influencing the interaction between exposed formations in the
open borehole, evolving bottomhole pressures during a kick that develops into a blowout, and possible bridging mechanisms that
might impede the development of a blowout. The principal conclusion of this study has been that in order for a blowout to be self-
killing, bridging has to occur while the kick is developing within the borehole. Bridging between the drill-pipe and borehole wall
is the most likely cause for self-killing; kicks occurring with the drill-pipe not in the open-hole (e.g. while tripping) are unlikely to
bridge, however. The analyses indicate that once the kick is sufficiently developed that hydrocarbons reach the wellhead – i.e. a
blowout is underway – self-killing is no-longer a possibility, at least in the short-term while near-initial reservoir conditions apply.
The overpressured nature of many deepwater reservoirs is such that high flow-rates occurring early-on in the development of a kick
may be sufficient to remove all spalled shale or produced formation sand along with the hydrocarbon flow. The typically large
reservoir energy of these deepwater reservoirs means that once developed a deepwater blowout can flow for extended periods before
natural causes (such as depletion, water production, etc) result in a diminishing flow rate. This is the principal differentiator between
blowouts in deep-water and those historically recorded from Shelf wells which intersect “shallow hazard” gas pockets of limited
extent, the majority of which can be controlled within 24 hours of a blowout occurring.
Acknowledgements The author wishes to thank management of Apache Corporation for permission to publish this paper and to share with the industry
these thoughts and ideas of borehole instability during a blowout. Thanks too go to Fersheed Mody, Graham Brander and other
colleagues for their comments and discussions while writing this paper.
References 1. Alberty, M., Hafle, M.E., Minge, J.C., Byrd, T., "Mechanisms of Shallow Water Flows and Drilling Practices for Intervention", paper OTC 8301,
presented at the 1997 Offshore Technology Conference, Houston, Texas, 1997.
2. Flak, L.H. “Well Control: Ultra-deepwater blowouts – how one could happen”, Offshore Magazine, January 1, 1997.
3. National Academy of Engineering and National Research Council, “Macondo Well-Deepwater Horizon Blowout: Lessons for Offshore Drilling
Safety”, The National Academies Press, ISBN 978-0-309-22138-2, December 2010. http://www.nap.edu/catalog.php?record_id=13273
4. Bly, M. “Deepwater Horizon Accident Investigation Report”, published BP Report, dated September 8, 2010 (accessible via www.bp.com)
5. Flak, L.H. “Well Control Impacts of Deepwater Riser Margin”, Oil and Gas Online, May 25, 1999.

SPE 156330 A WELLBORE STABILITY APPROACH FOR SELF-KILLING BLOWOUT ASSESSMENT 13
6. Dananberger, E.P. “Outer Continental Shelf Drilling Blowouts, 1971-1991”, paper OTC 7248, presented at the 25th Ann. OTC, Houston, TX,
USA, 3-6 May 1993.
7. Skalle, P., Jinjun, H., Podio, A.L.: “Killing Methods and Consequences of 1120 Gulf Coast Blowouts during 1960-1996”, SPE 53974
presented at the 1999 SPE Latin America and Caribbean Petroleum Engineering conference held in Caracas, Venezuela, 23-23 April 1999.
8. Skalle, P. & Podio, A.L.: “Trends extracted from 800 Gulf Coast blowouts during 1960-1996”, SPE 39354 presented at the 1998 IADC/SPE
Drilling Conference held in Dallas, Texas 3-6 March 1998.
9. Holand P., “Offshore Blowouts: Causes and Control”, Gulf Publishing Co. Houston, Texas, 1997. ISBN 0-88415-514-5.
10. Engelder, T.,& Leftwich, J.T., 1997, “ A pore-pressure limit in overpressured South Texas oil and gas fields” in Surdam, R.C., ed., Seals, Traps,
and the Petroleum System: American Association of Petroleum Geologists Memoir 67, pp. 255-267.
11. Eaton, L.R. “Drilling Through Deepwater Shallow Water Flow Zones at Ursa”, paper SPE 52780, presented at the SPE/IADC Drilling
Conference, 9-11 March 1999, Amsterdam, Netherlands.
12. Ruppelt, A.U. & West, C.L. “Shallow Water Flow Geopressures Arising From Confined Surface Slumps”, paper SPE 90980, presented at the
SPE Ann. Tech. Conf. & Exhib., 26-29 September 2004, Houston, TX, USA.
13. Nesheli, B.A. & Schubert, J.J.: ”Effect of Water Depth on Bridging Tendencies in Ultra-Deepwater Blowouts in Gulf of Mexico”, SPE 103139,
presented at the 2006 SPE ATCE, San Antonio, TX, USA 24-27 September 2006.
14. Jourine, S., Schubert, J.J, & Valkó, P.P. “Saturated Poroelastic Hollow Cylinder Subjected to Non-Stationary Boundary Pressure – Model and
Laboratory Test”, Paper 541, presented at the 2004 North American Rock Mechanics Symposium (Gulfrocks), Houston, TX June 5-10 2004.
15. Jourine, S., Valkó, P.P. & Kronenberg, A.K. “Modelling Poroelastic Hollow Cylinder Experiments With Realistic Boundary Conditions”, Int. J.
Numer. Anal. Meth. Geomech., 2004; 28:1189–1205.
16. See the Bureau of Safety and Environmental Enforcement (BSEE) website: http://www.bsee.gov/Regulations-and-Guidance/Notices-to-Lessees-
and-Operators.aspx
17. Manger, T. et al “Guidance for Complying with BOEM NTL No. 2010-N06 on Worst Case Discharge for Offshore Wells”, Society of Petroleum
Engineers, September 22, 2010. http://www.spe.org/notes/wp-content/uploads/2010/09/spe_wcd_final.doc
18. Crook, A.J.L., Yu, J.G. & Willson, S.M. “Development and Verification of an Orthotropic 3D Elastoplastic Material Model for Assessing
Borehole Stability in Shales”, SPE/ISRM 78238, presented at the OilRock 2002 SPE/ISRM Rock Mechanics Conference, Irving TX 20-23
October 2002.
19. Oudeman, P. “Analysis of Surface and Wellbore Hydraulics Provides Key to Efficient Blowout Control”, SPE Drill. & Compl. 13 (3): 163-173,
SPE-51179-PA, 1998.
20. Oudeman, P. “Validation of Blowout Rate Calculations for Subsea Wells”, SPE Drill. & Compl., pp. 282-289, September 2010.
21. Davoudi, M. et al “Evaluation of Alternative Initial Responses to Kicks Taken During Managed-Pressure Drilling”, SPE Drill. & Compl., pp.
169-181, June 2011.
22. Hasan, A.R., Kabir, C.S. & Lin, D. “Modeling Wellbore Dynamics During Oil Well Blowout”, SPE 64644, presented at the 2000 SPE Int. Oil &
Gas Conf. & Exhib., Beijing, China, 7-10 November 2000.
23. Santos, O.L.A. “A Study on Blowouts in Ultra Deep Waters”, SPE 69530, presented at the SPE LACPEC, Buenos Aires, Argentina, 25-28 March
2001.
24. Willson, S.M.; Moschovidis, J.R.; Cameron, J.R.; and Palmer, I.D.: “New Model for Predicting the Rate of Sand Production”, SPE/ISRM 78368
presented at the SPE/ISRM Rock Mechanics Conference held in Irving, Texas, 20-23 October 2002.
25. Papamichos, E. & van den Hoek, P.J. ”Size dependency of Castlegate and Berea Sandstone hollow cylinder strength”, Proc. 35th US Rock
Mechanics Symposium, Lake Tahoe, NV, USA, 1995.
26. Ewy, R.T., Ray, P., Bovberg, C.A., Norman, P.D., & Goodman, H.E. “Openhole stability and sanding predictions by 3D extrapolation from
hole-collapse tests”, SPE Drilling & Completions, December 2001, pp 243-251.
27. Chien, S.F.: “Settling Velocity of Irregularly Shaped Particles”, SPE Drilling & Completion, December 1994.
28. Edwards, S.T., Matsutsuyu, B. & Willson, S.M. “Real-Time Imaging of Borehole Failures”, SPE Drilling & Completion Journal, Vol. 19, No. 4,
December 2004, pp. 236-243.
29. Einstein, A. “Effect of suspended rigid spheres on viscosity”, Ann. Physik, 19, 289 (1906).
30. Frankel, N.A. & Acrivos, A. “On the viscosity of a concentrated suspension of solid spheres”, Chem. Eng. Sci., 22, pp. 847-853 (1967).
31. Pabst, W. “Fundamental considerations on suspension rheology”, Ceramics – Silikáty, 48, (3) 6-33 (2004).
32. Sanapati, P.K., Panda, D. & Parida, A. “Predicting Viscosity of Limestone-Water Slurry”, Journal of Minerals & Materials Characterization &
Engineering, Vol. 8, No.3, pp 203-221, 2009
33. van den Brule, B. & Jongschaap, R.J.J.: J. Stat. Phys. 62, 3225 (1993).
34. Bratton, T., Bornemann, T., et al “Logging-while-drilling images for geomechanical, geological and petrophysical interpretations”, SPWLA 40th
Annual Logging Symposium, Oslo, Norway, 1999.
35. McNeill, L.C., Ienaga, M. et al “Deformation and in situ stress in the Nankai Accretionary Prism from resistivity-at-bit images, ODP Leg 396”,
Geophysical Research Letters, Vol. 33, L02602, doi:30.3029/2003GL038799, 2004.
36. Crook, A., Willson, S.M., Yu, J. & Owen, R. “Computational Modeling of the Localized Deformation Associated with Borehole Breakout in
Quasi-Brittle Materials”, Journal of Petroleum Science and Engineering Special Issue on Wellbore Stability, JPSE, Vol. 38, 3-4, June 2003, pp
377-386.
37. Abdulhadi, N.M. “An Experimental Investigation into the Stress-Dependent Mechanical Behavior of Cohesive Soil with Application to Wellbore
Instability”, doctoral thesis for the degree of PhD in Geotechnical & Geoenvironmental Engineering, Massachusetts Institute of Technology,
Cambridge, MA, September 2009.
38. Nes, O-M. et al “Improved Drilling Efficiency by Better Handling of Shale Problems (IDE)”, Summary Report, SINTEF Petroleum Research,
Trondheim, Norway, dated 29th October 2007.
14 STEPHEN M. WILLSON SPE 156330
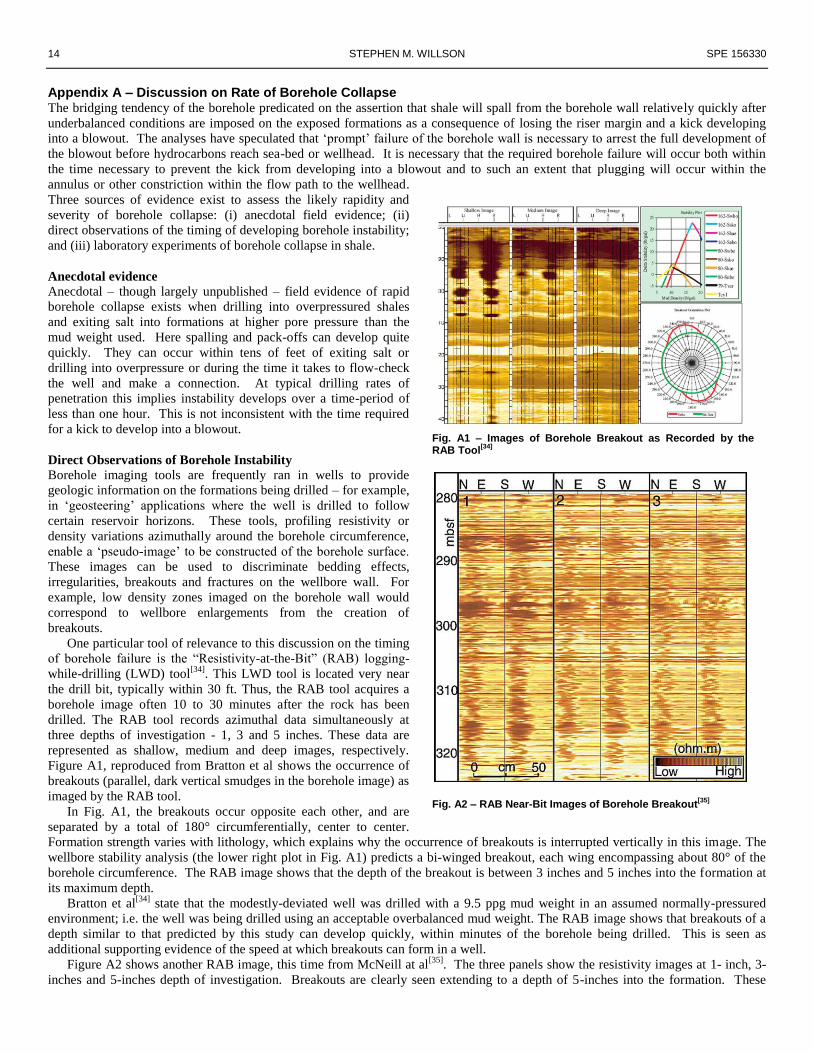
Fig. A1 – Images of Borehole Breakout as Recorded by the RAB Tool
[34]
Fig. A2 – RAB Near-Bit Images of Borehole Breakout
[35]
Appendix A – Discussion on Rate of Borehole Collapse The bridging tendency of the borehole predicated on the assertion that shale will spall from the borehole wall relatively quickly after
underbalanced conditions are imposed on the exposed formations as a consequence of losing the riser margin and a kick developing
into a blowout. The analyses have speculated that ‘prompt’ failure of the borehole wall is necessary to arrest the full development of
the blowout before hydrocarbons reach sea-bed or wellhead. It is necessary that the required borehole failure will occur both within
the time necessary to prevent the kick from developing into a blowout and to such an extent that plugging will occur within the
annulus or other constriction within the flow path to the wellhead.
Three sources of evidence exist to assess the likely rapidity and
severity of borehole collapse: (i) anecdotal field evidence; (ii)
direct observations of the timing of developing borehole instability;
and (iii) laboratory experiments of borehole collapse in shale.
Anecdotal evidence
Anecdotal – though largely unpublished – field evidence of rapid
borehole collapse exists when drilling into overpressured shales
and exiting salt into formations at higher pore pressure than the
mud weight used. Here spalling and pack-offs can develop quite
quickly. They can occur within tens of feet of exiting salt or
drilling into overpressure or during the time it takes to flow-check
the well and make a connection. At typical drilling rates of
penetration this implies instability develops over a time-period of
less than one hour. This is not inconsistent with the time required
for a kick to develop into a blowout.
Direct Observations of Borehole Instability
Borehole imaging tools are frequently ran in wells to provide
geologic information on the formations being drilled – for example,
in ‘geosteering’ applications where the well is drilled to follow
certain reservoir horizons. These tools, profiling resistivity or
density variations azimuthally around the borehole circumference,
enable a ‘pseudo-image’ to be constructed of the borehole surface.
These images can be used to discriminate bedding effects,
irregularities, breakouts and fractures on the wellbore wall. For
example, low density zones imaged on the borehole wall would
correspond to wellbore enlargements from the creation of
breakouts.
One particular tool of relevance to this discussion on the timing
of borehole failure is the “Resistivity-at-the-Bit” (RAB) logging-
while-drilling (LWD) tool[34]
. This LWD tool is located very near
the drill bit, typically within 30 ft. Thus, the RAB tool acquires a
borehole image often 10 to 30 minutes after the rock has been
drilled. The RAB tool records azimuthal data simultaneously at
three depths of investigation - 1, 3 and 5 inches. These data are
represented as shallow, medium and deep images, respectively.
Figure A1, reproduced from Bratton et al shows the occurrence of
breakouts (parallel, dark vertical smudges in the borehole image) as
imaged by the RAB tool.
In Fig. A1, the breakouts occur opposite each other, and are
separated by a total of 180° circumferentially, center to center.
Formation strength varies with lithology, which explains why the occurrence of breakouts is interrupted vertically in this image. The
wellbore stability analysis (the lower right plot in Fig. A1) predicts a bi-winged breakout, each wing encompassing about 80° of the
borehole circumference. The RAB image shows that the depth of the breakout is between 3 inches and 5 inches into the formation at
its maximum depth.
Bratton et al[34]
state that the modestly-deviated well was drilled with a 9.5 ppg mud weight in an assumed normally-pressured
environment; i.e. the well was being drilled using an acceptable overbalanced mud weight. The RAB image shows that breakouts of a
depth similar to that predicted by this study can develop quickly, within minutes of the borehole being drilled. This is seen as
additional supporting evidence of the speed at which breakouts can form in a well.
Figure A2 shows another RAB image, this time from McNeill at al[35]
. The three panels show the resistivity images at 1- inch, 3-
inches and 5-inches depth of investigation. Breakouts are clearly seen extending to a depth of 5-inches into the formation. These
SPE 156330 A WELLBORE STABILITY APPROACH FOR SELF-KILLING BLOWOUT ASSESSMENT 15
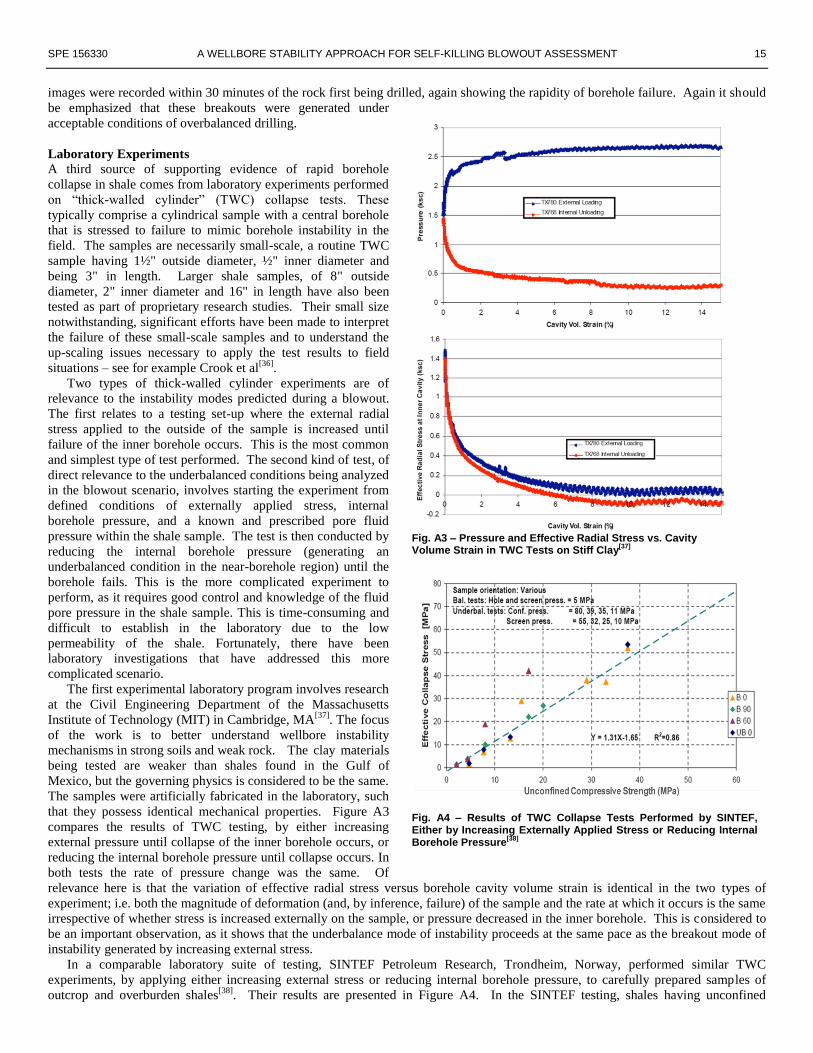
Fig. A3 – Pressure and Effective Radial Stress vs. Cavity Volume Strain in TWC Tests on Stiff Clay
[37]
Fig. A4 – Results of TWC Collapse Tests Performed by SINTEF, Either by Increasing Externally Applied Stress or Reducing Internal Borehole Pressure
[38]
images were recorded within 30 minutes of the rock first being drilled, again showing the rapidity of borehole failure. Again it should
be emphasized that these breakouts were generated under
acceptable conditions of overbalanced drilling.
Laboratory Experiments
A third source of supporting evidence of rapid borehole
collapse in shale comes from laboratory experiments performed
on “thick-walled cylinder” (TWC) collapse tests. These
typically comprise a cylindrical sample with a central borehole
that is stressed to failure to mimic borehole instability in the
field. The samples are necessarily small-scale, a routine TWC
sample having 1½" outside diameter, ½" inner diameter and
being 3" in length. Larger shale samples, of 8" outside
diameter, 2" inner diameter and 16" in length have also been
tested as part of proprietary research studies. Their small size
notwithstanding, significant efforts have been made to interpret
the failure of these small-scale samples and to understand the
up-scaling issues necessary to apply the test results to field
situations – see for example Crook et al[36]
.
Two types of thick-walled cylinder experiments are of
relevance to the instability modes predicted during a blowout.
The first relates to a testing set-up where the external radial
stress applied to the outside of the sample is increased until
failure of the inner borehole occurs. This is the most common
and simplest type of test performed. The second kind of test, of
direct relevance to the underbalanced conditions being analyzed
in the blowout scenario, involves starting the experiment from
defined conditions of externally applied stress, internal
borehole pressure, and a known and prescribed pore fluid
pressure within the shale sample. The test is then conducted by
reducing the internal borehole pressure (generating an
underbalanced condition in the near-borehole region) until the
borehole fails. This is the more complicated experiment to
perform, as it requires good control and knowledge of the fluid
pore pressure in the shale sample. This is time-consuming and
difficult to establish in the laboratory due to the low
permeability of the shale. Fortunately, there have been
laboratory investigations that have addressed this more
complicated scenario.
The first experimental laboratory program involves research
at the Civil Engineering Department of the Massachusetts
Institute of Technology (MIT) in Cambridge, MA[37]
. The focus
of the work is to better understand wellbore instability
mechanisms in strong soils and weak rock. The clay materials
being tested are weaker than shales found in the Gulf of
Mexico, but the governing physics is considered to be the same.
The samples were artificially fabricated in the laboratory, such
that they possess identical mechanical properties. Figure A3
compares the results of TWC testing, by either increasing
external pressure until collapse of the inner borehole occurs, or
reducing the internal borehole pressure until collapse occurs. In
both tests the rate of pressure change was the same. Of
relevance here is that the variation of effective radial stress versus borehole cavity volume strain is identical in the two types of
experiment; i.e. both the magnitude of deformation (and, by inference, failure) of the sample and the rate at which it occurs is the same
irrespective of whether stress is increased externally on the sample, or pressure decreased in the inner borehole. This is considered to
be an important observation, as it shows that the underbalance mode of instability proceeds at the same pace as the breakout mode of
instability generated by increasing external stress.
In a comparable laboratory suite of testing, SINTEF Petroleum Research, Trondheim, Norway, performed similar TWC
experiments, by applying either increasing external stress or reducing internal borehole pressure, to carefully prepared samples of
outcrop and overburden shales[38]
. Their results are presented in Figure A4. In the SINTEF testing, shales having unconfined

16 STEPHEN M. WILLSON SPE 156330
compressive strengths of between 2 MPa (290 psi) and 39 MPa (5655 psi) were used. The underbalanced tests (failed by reducing
internal borehole pressure) are denoted by blue diamonds in Fig. A4, and referred to as “UB 0” in the figure. (The “0” designates that
the samples were cored perpendicular to bedding. The samples failed by increasing external stress were cut at specified orientations
from the rocks provided). The SINTEF results support those obtained by MIT, and show that the failure developed by underbalanced
conditions in these small-scale samples is equivalent to that generated by increasing external stress. Thus, there is no ‘delayed
response’ by the formation failing in underbalanced conditions compared with that from imposed external stress.
Concluding Remarks
In this Appendix we have presented a variety of borehole failure observations, or inferences where hard facts are less certain, to
present the case that borehole failure is considered to be a sufficiently rapid phenomenon upon the imposition of underbalanced
pressure conditions in the borehole that the borehole is expected to fail within the timescale of the developing kick (less than 30
minutes).
Field evidence has shown that when drilling with insufficient mud weight, the drill-pipe can become stuck during the time it takes
to make a connection (minutes only). This can occur at underbalances smaller than that which will be imposed in the event of a riser
break.
Borehole images, collected by near-bit imaging tools, have shown that breakouts extending more than 5 inches into the formation
can be developed very quickly – within 30 minutes of drilling – under acceptable overbalanced drilling conditions. It is anticipated
that the more severe borehole stress state generated by a riser break would create more instability and in a shorter timeframe than seen
in borehole images during normal drilling operations.
Finally, laboratory results on model borehole collapse experiments are presented. These show that instability in these small-scale
samples proceeds at the same rate, and with the same severity, irrespective of whether the instability is generated by reducing internal
borehole pressure or increasing external stress on the outside of the sample. Thus, there is no reason to expect that failure by imposing
underbalanced conditions should occur slower than that resulting from having insufficient mud weight to resist the externally existing
earth stresses.