Embed Size (px)
Citation preview

2021: Issue 804, Week: 6th - 10th September A Weekly Update from SMC
(For private circulation only)
Bra
nd
sm
c 5
87
From The Desk Of Editor
(Saurabh Jain)
SMC Global Securities Ltd. (hereinafter referred to as “SMC”) is a registered Member of National Stock Exchange of India Limited, Bombay Stock Exchange Limited and its associate is member of MCX stock Exchange Limited. It is also registered as a Depository Participant with CDSL and NSDL. Its associates merchant banker and Portfolio Manager are registered with SEBI and NBFC registered with RBI. It also has registration with AMFI as a Mutual Fund Distributor.
SMC is a SEBI registered Research Analyst having registration number INH100001849. SMC or its associates has not been debarred/ suspended by SEBI or any other regulatory authority for accessing /dealing in securities market.
SMC or its associates including its relatives/analyst do not hold any financial interest/beneficial ownership of more than 1% in the company covered by Analyst. SMC or its associates and relatives does not have any material conflict of interest. SMC or its associates/analyst has not received any compensation from the company covered by Analyst during the past twelve months. The subject company has not been a client of SMC during the past twelve months. SMC or its associates has not received any compensation or other benefits from the company covered by analyst or third party in connection with the research report. The Analyst has not served as an officer, director or employee of company covered by Analyst and SMC has not been engaged in market making activity of the company covered by Analyst.
The views expressed are based solely on information available publicly available/internal data/ other reliable sources believed to be true.
SMC does not represent/ provide any warranty express or implied to the accuracy, contents or views expressed herein and investors are advised to independently evaluate the market conditions/risks involved before making any investment decision.
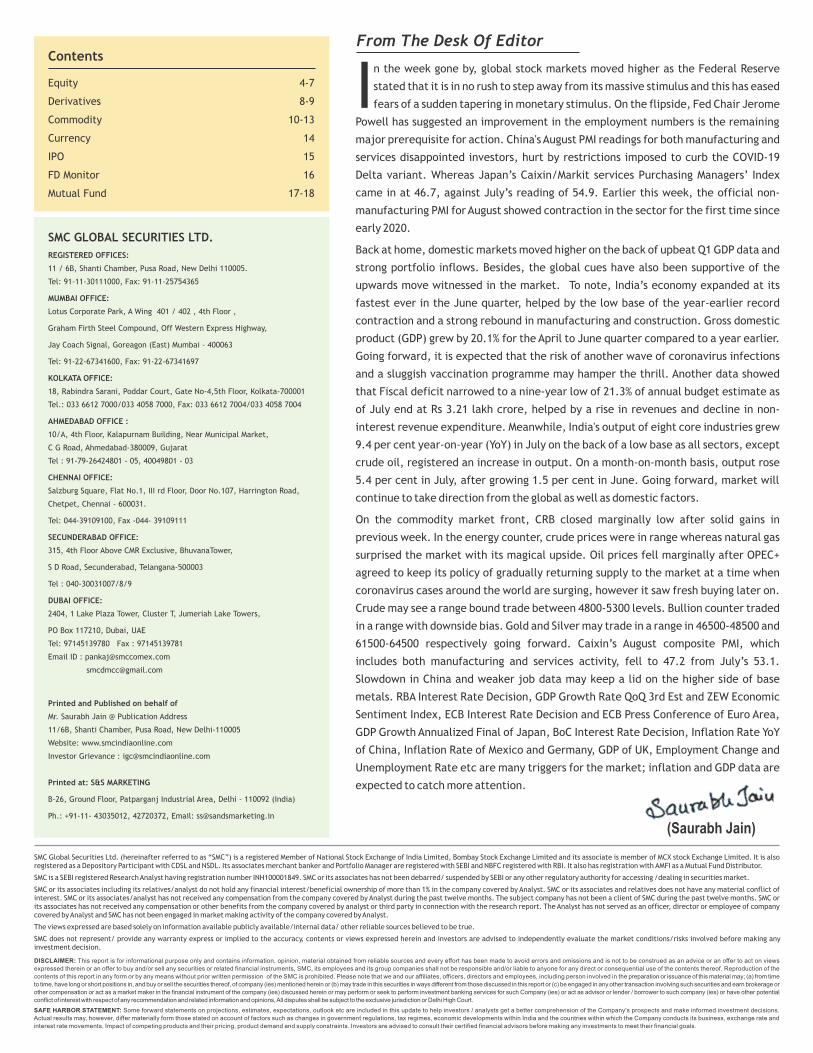
n the week gone by, global stock markets moved higher as the Federal Reserve
Istated that it is in no rush to step away from its massive stimulus and this has eased
fears of a sudden tapering in monetary stimulus. On the flipside, Fed Chair Jerome
Powell has suggested an improvement in the employment numbers is the remaining
major prerequisite for action. China's August PMI readings for both manufacturing and
services disappointed investors, hurt by restrictions imposed to curb the COVID-19
Delta variant. Whereas Japan’s Caixin/Markit services Purchasing Managers’ Index
came in at 46.7, against July’s reading of 54.9. Earlier this week, the official non-
manufacturing PMI for August showed contraction in the sector for the first time since
early 2020.
Back at home, domestic markets moved higher on the back of upbeat Q1 GDP data and
strong portfolio inflows. Besides, the global cues have also been supportive of the
upwards move witnessed in the market. To note, India’s economy expanded at its
fastest ever in the June quarter, helped by the low base of the year-earlier record
contraction and a strong rebound in manufacturing and construction. Gross domestic
product (GDP) grew by 20.1% for the April to June quarter compared to a year earlier.
Going forward, it is expected that the risk of another wave of coronavirus infections
and a sluggish vaccination programme may hamper the thrill. Another data showed
that Fiscal deficit narrowed to a nine-year low of 21.3% of annual budget estimate as
of July end at Rs 3.21 lakh crore, helped by a rise in revenues and decline in non-
interest revenue expenditure. Meanwhile, India's output of eight core industries grew
9.4 per cent year-on-year (YoY) in July on the back of a low base as all sectors, except
crude oil, registered an increase in output. On a month-on-month basis, output rose
5.4 per cent in July, after growing 1.5 per cent in June. Going forward, market will
continue to take direction from the global as well as domestic factors.
On the commodity market front, CRB closed marginally low after solid gains in
previous week. In the energy counter, crude prices were in range whereas natural gas
surprised the market with its magical upside. Oil prices fell marginally after OPEC+
agreed to keep its policy of gradually returning supply to the market at a time when
coronavirus cases around the world are surging, however it saw fresh buying later on.
Crude may see a range bound trade between 4800-5300 levels. Bullion counter traded
in a range with downside bias. Gold and Silver may trade in a range in 46500-48500 and
61500-64500 respectively going forward. Caixin’s August composite PMI, which
includes both manufacturing and services activity, fell to 47.2 from July’s 53.1.
Slowdown in China and weaker job data may keep a lid on the higher side of base
metals. RBA Interest Rate Decision, GDP Growth Rate QoQ 3rd Est and ZEW Economic
Sentiment Index, ECB Interest Rate Decision and ECB Press Conference of Euro Area,
GDP Growth Annualized Final of Japan, BoC Interest Rate Decision, Inflation Rate YoY
of China, Inflation Rate of Mexico and Germany, GDP of UK, Employment Change and
Unemployment Rate etc are many triggers for the market; inflation and GDP data are
expected to catch more attention.
SMC GLOBAL SECURITIES LTD.
REGISTERED OFFICES:
11 / 6B, Shanti Chamber, Pusa Road, New Delhi 110005.
Tel: 91-11-30111000, Fax: 91-11-25754365
MUMBAI OFFICE:
Lotus Corporate Park, A Wing 401 / 402 , 4th Floor ,
Graham Firth Steel Compound, Off Western Express Highway,
Jay Coach Signal, Goreagon (East) Mumbai - 400063
Tel: 91-22-67341600, Fax: 91-22-67341697
KOLKATA OFFICE:
18, Rabindra Sarani, Poddar Court, Gate No-4,5th Floor, Kolkata-700001
Tel.: 033 6612 7000/033 4058 7000, Fax: 033 6612 7004/033 4058 7004
AHMEDABAD OFFICE :
10/A, 4th Floor, Kalapurnam Building, Near Municipal Market,
C G Road, Ahmedabad-380009, Gujarat
Tel : 91-79-26424801 - 05, 40049801 - 03
CHENNAI OFFICE:
Salzburg Square, Flat No.1, III rd Floor, Door No.107, Harrington Road,
Chetpet, Chennai - 600031.
Tel: 044-39109100, Fax -044- 39109111
SECUNDERABAD OFFICE:
315, 4th Floor Above CMR Exclusive, BhuvanaTower,
S D Road, Secunderabad, Telangana-500003
Tel : 040-30031007/8/9
DUBAI OFFICE:
2404, 1 Lake Plaza Tower, Cluster T, Jumeriah Lake Towers,
PO Box 117210, Dubai, UAE
Tel: 97145139780 Fax : 97145139781
Email ID : [email protected]
Printed and Published on behalf of
Mr. Saurabh Jain @ Publication Address
11/6B, Shanti Chamber, Pusa Road, New Delhi-110005
Website: www.smcindiaonline.com
Investor Grievance : [email protected]
Printed at: S&S MARKETING
B-26, Ground Floor, Patparganj Industrial Area, Delhi - 110092 (India)
Ph.: +91-11- 43035012, 42720372, Email: [email protected]
DISCLAIMER: This report is for informational purpose only and contains information, opinion, material obtained from reliable sources and every effort has been made to avoid errors and omissions and is not to be construed as an advice or an offer to act on views
expressed therein or an offer to buy and/or sell any securities or related financial instruments, SMC, its employees and its group companies shall not be responsible and/or liable to anyone for any direct or consequential use of the contents thereof. Reproduction of the
contents of this report in any form or by any means without prior written permission of the SMC is prohibited. Please note that we and our affiliates, officers, directors and employees, including person involved in the preparation or issuance of this material may; (a) from time
to time, have long or short positions in, and buy or sell the securities thereof, of company (ies) mentioned herein or (b) may trade in this securities in ways different from those discussed in this report or (c) be engaged in any other transaction involving such securities and earn brokerage or
other compensation or act as a market maker in the financial instrument of the company (ies) discussed herein or may perform or seek to perform investment banking services for such Company (ies) or act as advisor or lender / borrower to such company (ies) or have other potential
conflict of interest with respect of any recommendation and related information and opinions, All disputes shall be subject to the exclusive jurisdiction or Delhi High Court.
SAFE HARBOR STATEMENT: Some forward statements on projections, estimates, expectations, outlook etc are included in this update to help investors / analysts get a better comprehension of the Company's prospects and make informed investment decisions.
Actual results may, however, differ materially form those stated on account of factors such as changes in government regulations, tax regimes, economic developments within India and the countries within which the Company conducts its business, exchange rate and
interest rate movements, Impact of competing products and their pricing, product demand and supply constraints. Investors are advised to consult their certified financial advisors before making any investments to meet their financial goals.
Contents
Equity 4-7
Derivatives 8-9
Commodity 10-13
Currency 14
IPO 15
FD Monitor 16
Mutual Fund 17-18
TREND SHEET
Stocks *Closing Trend Date Rate Support Resistance Closing Price Trend Trend S/l
Changed Changed
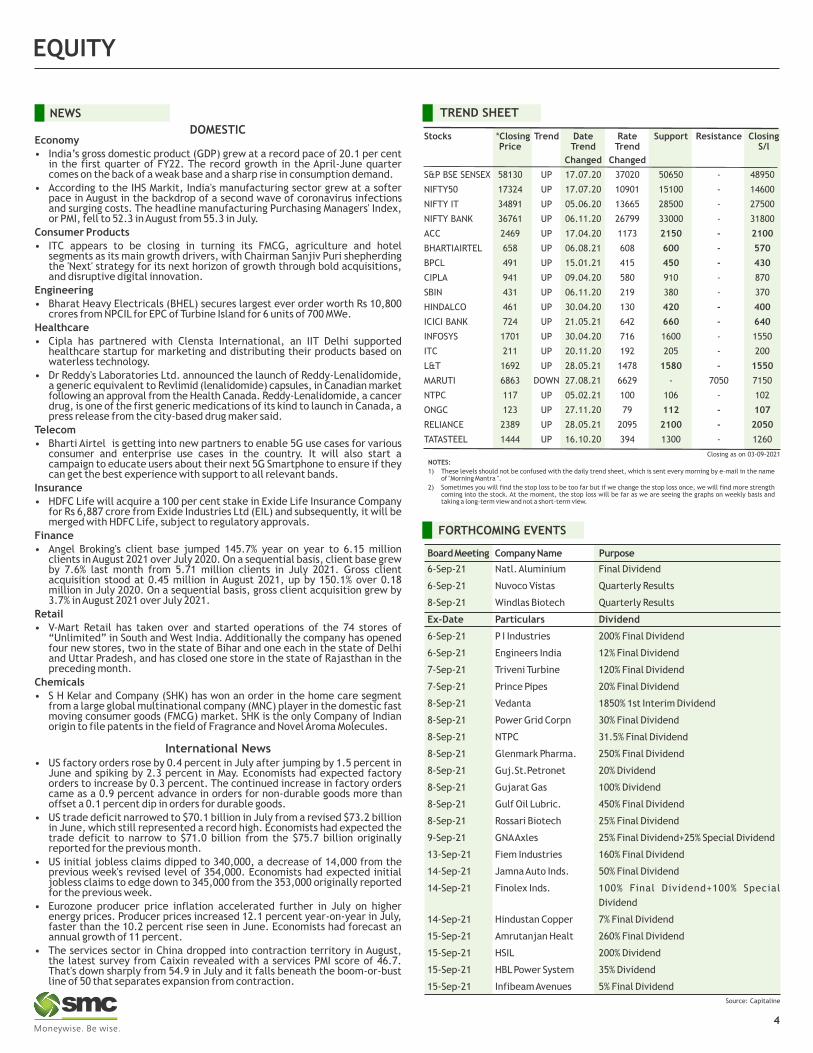
S&P BSE SENSEX 58130 UP 17.07.20 37020 50650 - 48950
NIFTY50 17324 UP 17.07.20 10901 15100 - 14600
NIFTY IT 34891 UP 05.06.20 13665 28500 - 27500
NIFTY BANK 36761 UP 06.11.20 26799 33000 - 31800
ACC 2469 UP 17.04.20 1173 2150 - 2100
BHARTIAIRTEL 658 UP 06.08.21 608 600 - 570
BPCL 491 UP 15.01.21 415 450 - 430
CIPLA 941 UP 09.04.20 580 910 - 870
SBIN 431 UP 06.11.20 219 380 - 370
HINDALCO 461 UP 30.04.20 130 420 - 400
ICICI BANK 724 UP 21.05.21 642 660 - 640
INFOSYS 1701 UP 30.04.20 716 1600 - 1550
ITC 211 UP 20.11.20 192 205 - 200
L&T 1692 UP 28.05.21 1478 1580 - 1550
MARUTI 6863 DOWN 27.08.21 6629 - 7050 7150
NTPC 117 UP 05.02.21 100 106 - 102
ONGC 123 UP 27.11.20 79 112 - 107
RELIANCE 2389 UP 28.05.21 2095 2100 - 2050
TATASTEEL 1444 UP 16.10.20 394 1300 - 1260
NOTES:
1) These levels should not be confused with the daily trend sheet, which is sent every morning by e-mail in the name of "Morning Mantra ".
2) Sometimes you will find the stop loss to be too far but if we change the stop loss once, we will find more strength coming into the stock. At the moment, the stop loss will be far as we are seeing the graphs on weekly basis and taking a long-term view and not a short-term view.
Closing as on 03-09-2021
EQUITY
NEWS
Economy
• India’s gross domestic product (GDP) grew at a record pace of 20.1 per cent in the first quarter of FY22. The record growth in the April-June quarter comes on the back of a weak base and a sharp rise in consumption demand.
• According to the IHS Markit, India's manufacturing sector grew at a softer pace in August in the backdrop of a second wave of coronavirus infections and surging costs. The headline manufacturing Purchasing Managers' Index, or PMI, fell to 52.3 in August from 55.3 in July.
Consumer Products
• ITC appears to be closing in turning its FMCG, agriculture and hotel segments as its main growth drivers, with Chairman Sanjiv Puri shepherding the 'Next' strategy for its next horizon of growth through bold acquisitions, and disruptive digital innovation.
Engineering
• Bharat Heavy Electricals (BHEL) secures largest ever order worth Rs 10,800 crores from NPCIL for EPC of Turbine Island for 6 units of 700 MWe.
Healthcare
• Cipla has partnered with Clensta International, an IIT Delhi supported healthcare startup for marketing and distributing their products based on waterless technology.
• Dr Reddy's Laboratories Ltd. announced the launch of Reddy-Lenalidomide, a generic equivalent to Revlimid (lenalidomide) capsules, in Canadian market following an approval from the Health Canada. Reddy-Lenalidomide, a cancer drug, is one of the first generic medications of its kind to launch in Canada, a press release from the city-based drug maker said.
Telecom
• Bharti Airtel is getting into new partners to enable 5G use cases for various consumer and enterprise use cases in the country. It will also start a campaign to educate users about their next 5G Smartphone to ensure if they can get the best experience with support to all relevant bands.
Insurance
• HDFC Life will acquire a 100 per cent stake in Exide Life Insurance Company for Rs 6,887 crore from Exide Industries Ltd (EIL) and subsequently, it will be merged with HDFC Life, subject to regulatory approvals.
Finance
• Angel Broking's client base jumped 145.7% year on year to 6.15 million clients in August 2021 over July 2020. On a sequential basis, client base grew by 7.6% last month from 5.71 million clients in July 2021. Gross client acquisition stood at 0.45 million in August 2021, up by 150.1% over 0.18 million in July 2020. On a sequential basis, gross client acquisition grew by 3.7% in August 2021 over July 2021.
Retail
• V-Mart Retail has taken over and started operations of the 74 stores of “Unlimited” in South and West India. Additionally the company has opened four new stores, two in the state of Bihar and one each in the state of Delhi and Uttar Pradesh, and has closed one store in the state of Rajasthan in the preceding month.
Chemicals
• S H Kelar and Company (SHK) has won an order in the home care segment from a large global multinational company (MNC) player in the domestic fast moving consumer goods (FMCG) market. SHK is the only Company of Indian origin to file patents in the field of Fragrance and Novel Aroma Molecules.
International News• US factory orders rose by 0.4 percent in July after jumping by 1.5 percent in
June and spiking by 2.3 percent in May. Economists had expected factory orders to increase by 0.3 percent. The continued increase in factory orders came as a 0.9 percent advance in orders for non-durable goods more than offset a 0.1 percent dip in orders for durable goods.
• US trade deficit narrowed to $70.1 billion in July from a revised $73.2 billion in June, which still represented a record high. Economists had expected the trade deficit to narrow to $71.0 billion from the $75.7 billion originally reported for the previous month.
• US initial jobless claims dipped to 340,000, a decrease of 14,000 from the previous week's revised level of 354,000. Economists had expected initial jobless claims to edge down to 345,000 from the 353,000 originally reported for the previous week.
• Eurozone producer price inflation accelerated further in July on higher energy prices. Producer prices increased 12.1 percent year-on-year in July, faster than the 10.2 percent rise seen in June. Economists had forecast an annual growth of 11 percent.
• The services sector in China dropped into contraction territory in August, the latest survey from Caixin revealed with a services PMI score of 46.7. That's down sharply from 54.9 in July and it falls beneath the boom-or-bust line of 50 that separates expansion from contraction.
4
DOMESTIC
FORTHCOMING EVENTS
Board Meeting Company Name Purpose
6-Sep-21 Natl. Aluminium Final Dividend
6-Sep-21 Nuvoco Vistas Quarterly Results
8-Sep-21 Windlas Biotech Quarterly Results
Ex-Date Particulars Div idend
6-Sep-21 P I Industries 200% Final Dividend
6-Sep-21 Engineers India 12% Final Dividend
7-Sep-21 Triveni Turbine 120% Final Dividend
7-Sep-21 Prince Pipes 20% Final Dividend
8-Sep-21 Vedanta 1850% 1st Interim Dividend
8-Sep-21 Power Grid Corpn 30% Final Dividend
8-Sep-21 NTPC 31.5% Final Dividend
8-Sep-21 Glenmark Pharma. 250% Final Dividend
8-Sep-21 Guj.St.Petronet 20% Dividend
8-Sep-21 Gujarat Gas 100% Dividend
8-Sep-21 Gulf Oil Lubric. 450% Final Dividend
8-Sep-21 Rossari Biotech 25% Final Dividend
9-Sep-21 GNA Axles 25% Final Dividend+25% Special Dividend
13-Sep-21 Fiem Industries 160% Final Dividend
14-Sep-21 Jamna Auto Inds. 50% Final Dividend
14-Sep-21 Finolex Inds. 100% Final Dividend+100% Special
Dividend
14-Sep-21 Hindustan Copper 7% Final Dividend
15-Sep-21 Amrutanjan Healt 260% Final Dividend
15-Sep-21 HSIL 200% Dividend
15-Sep-21 HBL Power System 35% Dividend
15-Sep-21 Infibeam Avenues 5% Final Dividend
Source: Capitaline
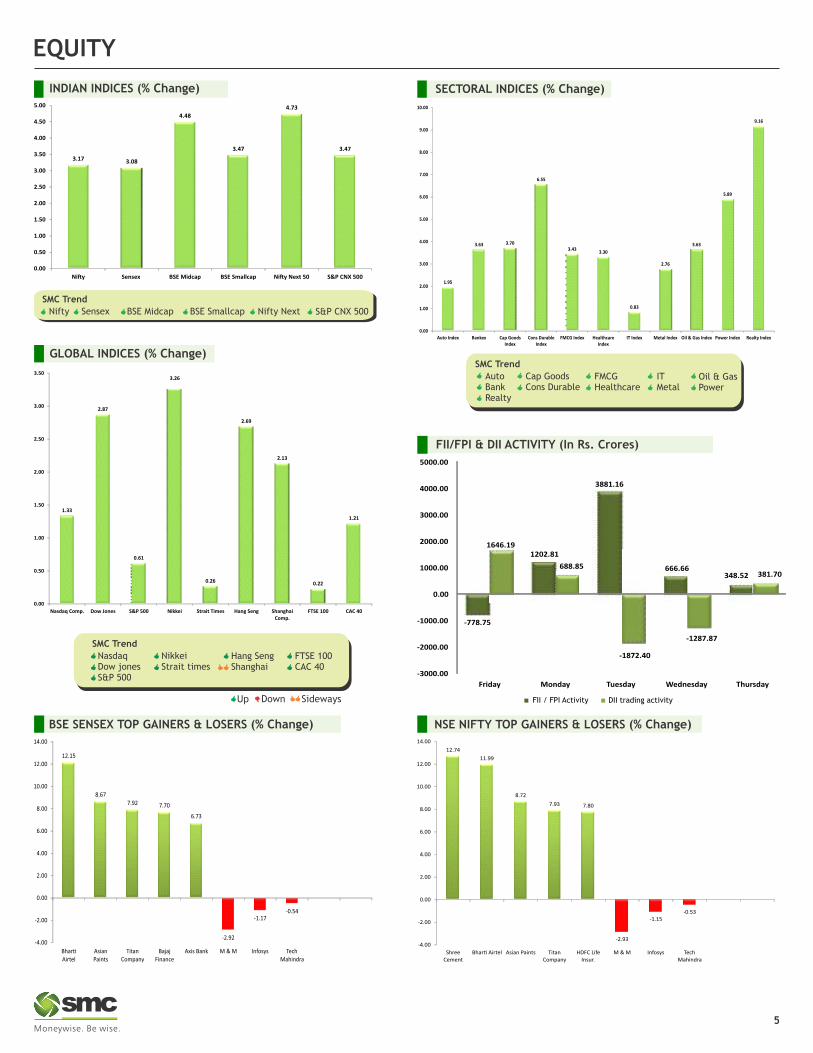
BSE SENSEX TOP GAINERS & LOSERS (% Change) NSE NIFTY TOP GAINERS & LOSERS (% Change)
SECTORAL INDICES (% Change)
GLOBAL INDICES (% Change)
INDIAN INDICES (% Change)
FII/FPI & DII ACTIVITY (In Rs. Crores)
5
EQUITY
SMC Trend
SMC Trend
ITMetal
Oil & GasPower
Cap GoodsCons Durable
Auto BankRealty
FMCGHealthcare
BSE Midcap BSE Smallcap
FII / FPI Activity DII trading activity
Nifty Sensex Nifty Next S&P CNX 500
Down SidewaysUp
SMC Trend
Hang SengShanghai
FTSE 100CAC 40
NikkeiStrait times
NasdaqDow jonesS&P 500
3.17 3.08
4.48
3.47
4.73
3.47
0.00
0.50
1.00
1.50
2.00
2.50
3.00
3.50
4.00
4.50
5.00
Ni�y Sensex BSE Midcap BSE Smallcap Ni�y Next 50 S&P CNX 5001.95
3.63 3.70
6.55
3.433.30
0.83
2.76
3.63
5.89
9.16
0.00
1.00
2.00
3.00
4.00
5.00
6.00
7.00
8.00
9.00
10.00
Auto Index Bankex Cap GoodsIndex
Cons DurableIndex
FMCG Index HealthcareIndex
IT Index Metal Index Oil & Gas Index Power Index Realty Index
1.33
2.87
0.61
3.26
0.26
2.69
2.13
0.22
1.21
0.00
0.50
1.00
1.50
2.00
2.50
3.00
3.50
Nasdaq Comp. Dow Jones S&P 500 Nikkei Strait Times Hang Seng ShanghaiComp.
FTSE 100 CAC 40
-778.75
-3000.00
-2000.00
-1000.00
0.00
1000.00
2000.00
3000.00
4000.00
5000.00
Friday Monday Tuesday Wednesday Thursday
-1872.40
-1287.87
1202.81
3881.16
666.66348.52
1646.19
688.85381.70
12.15
8.677.92 7.70
6.73
-2.92
-1.17-0.54
-4.00
-2.00
0.00
2.00
4.00
6.00
8.00
10.00
12.00
14.00
Bhar�Airtel
AsianPaints
TitanCompany
BajajFinance
Axis Bank M & M Infosys TechMahindra
12.74
11.99
8.72
7.93 7.80
-2.93
-1.15-0.53
-4.00
-2.00
0.00
2.00
4.00
6.00
8.00
10.00
12.00
14.00
ShreeCement
Bhar� Airtel Asian Paints TitanCompany
HDFC LifeInsur.
M & M Infosys TechMahindra
Beat the street - Fundamental Analysis
Source: Company Website Reuters CapitalineAbove calls are recommended with a time horizon of 8 to 10 months.
6
EQUITY
Beat the street - Fundamental Analysis
Source: Company Website Reuters CapitalineAbove calls are recommended with a time horizon of 8 to 10 months.
6
EQUITY
Face Value (Rs.) 1.00
52 Week High/Low 408.35/197.80
M.Cap (Rs. in Cr.) 8880.08
EPS (Rs.) 9.51
P/E Ratio (times) 38.41
P/B Ratio (times) 6.17
Dividend Yield (%) 0.30
Stock Exchange BSE
% OF SHARE HOLDING
VALUE PARAMETERS
HEXAWARE TECHNOLOGIES LIMITED CMP: 382.90 Upside: 15%Target Price: 441
% OF SHARE HOLDING
VALUE PARAMETERS
ASAHI INDIA GLASS LIMITED CMP: 365.30 Upside: 17%Target Price: 429
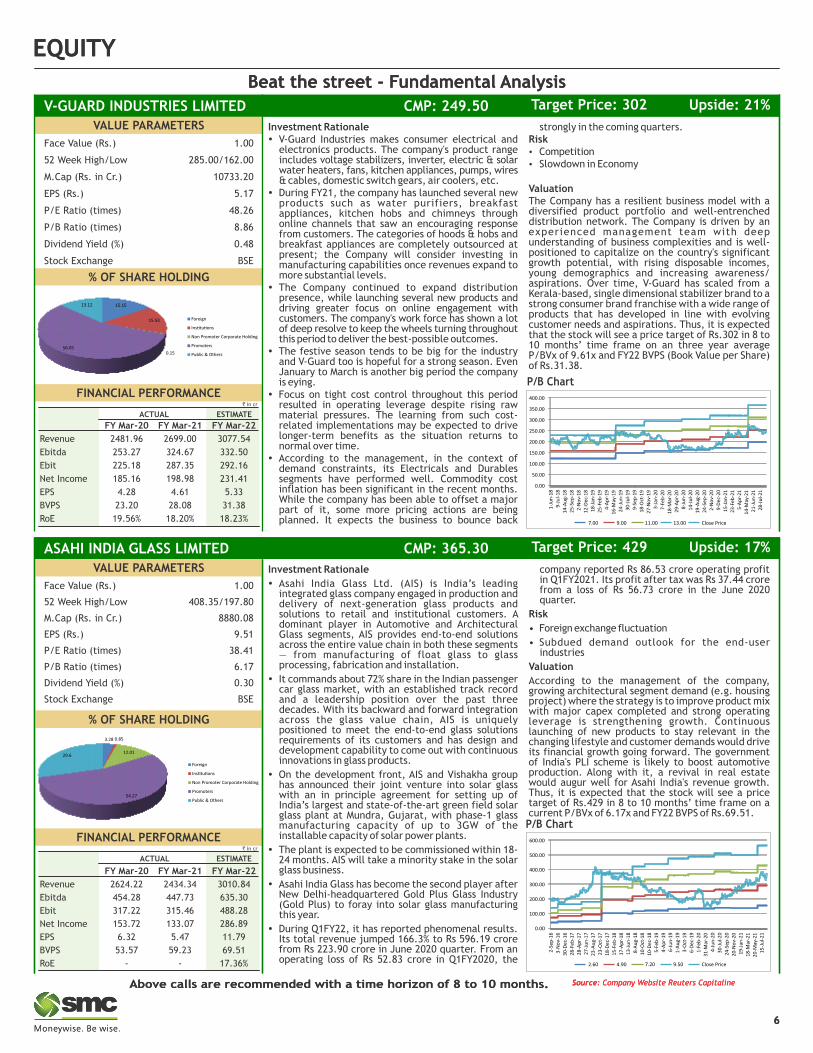
Investment Rationale
Ÿ Asahi India Glass Ltd. (AIS) is India’s leading integrated glass company engaged in production and delivery of next-generation glass products and solutions to retail and institutional customers. A dominant player in Automotive and Architectural Glass segments, AIS provides end-to-end solutions across the entire value chain in both these segments — from manufacturing of float glass to glass processing, fabrication and installation.
Ÿ It commands about 72% share in the Indian passenger car glass market, with an established track record and a leadership position over the past three decades. With its backward and forward integration across the glass value chain, AIS is uniquely positioned to meet the end-to-end glass solutions requirements of its customers and has design and development capability to come out with continuous innovations in glass products.
Ÿ On the development front, AIS and Vishakha group has announced their joint venture into solar glass with an in principle agreement for setting up of India’s largest and state-of-the-art green field solar glass plant at Mundra, Gujarat, with phase-1 glass manufacturing capacity of up to 3GW of the installable capacity of solar power plants.
Ÿ The plant is expected to be commissioned within 18-24 months. AIS will take a minority stake in the solar glass business.
Ÿ Asahi India Glass has become the second player after New Delhi-headquartered Gold Plus Glass Industry (Gold Plus) to foray into solar glass manufacturing this year.
Ÿ During Q1FY22, it has reported phenomenal results. Its total revenue jumped 166.3% to Rs 596.19 crore from Rs 223.90 crore in June 2020 quarter. From an operating loss of Rs 52.83 crore in Q1FY2020, the
company reported Rs 86.53 crore operating profit in Q1FY2021. Its profit after tax was Rs 37.44 crore from a loss of Rs 56.73 crore in the June 2020 quarter.
Risk
• Foreign exchange fluctuation
• Subdued demand outlook for the end-user industries
Valuation
According to the management of the company, growing architectural segment demand (e.g. housing project) where the strategy is to improve product mix with major capex completed and strong operating leverage is strengthening growth. Continuous launching of new products to stay relevant in the changing lifestyle and customer demands would drive its financial growth going forward. The government of India's PLI scheme is likely to boost automotive production. Along with it, a revival in real estate would augur well for Asahi India's revenue growth. Thus, it is expected that the stock will see a price target of Rs.429 in 8 to 10 months’ time frame on a current P/BVx of 6.17x and FY22 BVPS of Rs.69.51.P/B Chart
Face Value (Rs.) 1.00
52 Week High/Low 285.00/162.00
M.Cap (Rs. in Cr.) 10733.20
EPS (Rs.) 5.17
P/E Ratio (times) 48.26
P/B Ratio (times) 8.86
Dividend Yield (%) 0.48
Stock Exchange BSE
% OF SHARE HOLDING
VALUE PARAMETERS
HEXAWARE TECHNOLOGIES LIMITED CMP: 382.90 Upside: 15%Target Price: 441
VALUE PARAMETERS
V-GUARD INDUSTRIES LIMITED CMP: 249.50 Upside: 21%Target Price: 302
` in cr
ACTUAL ESTIMATE
FY Mar-20 FY Mar-21 FY Mar-22
Revenue 2481.96 2699.00 3077.54
Ebitda 253.27 324.67 332.50
Ebit 225.18 287.35 292.16
Net Income 185.16 198.98 231.41
EPS 4.28 4.61 5.33
BVPS 23.20 28.08 31.38
RoE 19.56% 18.20% 18.23%
FINANCIAL PERFORMANCE
` in cr
ACTUAL ESTIMATE
FY Mar-20 FY Mar-21 FY Mar-22
Revenue 2624.22 2434.34 3010.84
Ebitda 454.28 447.73 635.30
Ebit 317.22 315.46 488.28
Net Income 153.72 133.07 286.89
EPS 6.32 5.47 11.79
BVPS 53.57 59.23 69.51
RoE - - 17.36%
FINANCIAL PERFORMANCE
Investment RationaleŸ V-Guard Industries makes consumer electrical and
electronics products. The company's product range includes voltage stabilizers, inverter, electric & solar water heaters, fans, kitchen appliances, pumps, wires & cables, domestic switch gears, air coolers, etc.
Ÿ During FY21, the company has launched several new products such as water purifiers, breakfast appliances, kitchen hobs and chimneys through online channels that saw an encouraging response from customers. The categories of hoods & hobs and breakfast appliances are completely outsourced at present; the Company will consider investing in manufacturing capabilities once revenues expand to more substantial levels.
Ÿ The Company continued to expand distribution presence, while launching several new products and driving greater focus on online engagement with customers. The company's work force has shown a lot of deep resolve to keep the wheels turning throughout this period to deliver the best-possible outcomes.
Ÿ The festive season tends to be big for the industry and V-Guard too is hopeful for a strong season. Even January to March is another big period the company is eying.
Ÿ Focus on tight cost control throughout this period resulted in operating leverage despite rising raw material pressures. The learning from such cost- related implementations may be expected to drive longer-term benefits as the situation returns to normal over time.
Ÿ According to the management, in the context of demand constraints, its Electricals and Durables segments have performed well. Commodity cost inflation has been significant in the recent months. While the company has been able to offset a major part of it, some more pricing actions are being planned. It expects the business to bounce back
strongly in the coming quarters.RiskŸ CompetitionŸ Slowdown in Economy
ValuationThe Company has a resilient business model with a diversified product portfolio and well-entrenched distribution network. The Company is driven by an experienced management team with deep understanding of business complexities and is well- positioned to capitalize on the country's significant growth potential, with rising disposable incomes, young demographics and increasing awareness/ aspirations. Over time, V-Guard has scaled from a Kerala-based, single dimensional stabilizer brand to a strong consumer brand franchise with a wide range of products that has developed in line with evolving customer needs and aspirations. Thus, it is expected that the stock will see a price target of Rs.302 in 8 to 10 months’ time frame on an three year average P/BVx of 9.61x and FY22 BVPS (Book Value per Share) of Rs.31.38.
P/B Chart
3.28 0.85
12.01
54.27
29.6
Foreign
Ins�tu�ons
Non Promoter Corporate Holding
Promoters
Public & Others
15.15
15.53
0.1556.05
13.12
Foreign
Ins�tu�ons
Non Promoter Corporate Holding
Promoters
Public & Others
2.60 4.90 7.20 9.50 Close Price
0.00
100.00
200.00
300.00
400.00
500.00
600.00
2-S
ep-1
6
3-N
ov-
16
30
-Dec
-16
28
-Feb
-17
28
-Ap
r-1
7
27
-Ju
n-1
7
23
-Au
g-1
7
23
-Oct
-17
18
-Dec
-17
15
-Feb
-18
17
-Ap
r-1
8
13
-Ju
n-1
8
8-A
ug-
18
10
-Oct
-18
10
-Dec
-18
5-F
eb-1
9
4-A
pr-
19
6-J
un
-19
1-A
ug-
19
3-O
ct-1
9
6-D
ec-1
9
1-F
eb-2
0
31
-Mar
-20
4-J
un
-20
30
-Ju
l-2
0
24
-Sep
-20
20
-No
v-2
0
19
-Jan
-21
18
-Mar
-21
20
-May
-21
15
-Ju
l-2
1
7.00 9.00 11.00 13.00 Close Price
0.00
50.00
100.00
150.00
200.00
250.00
300.00
350.00
400.00
1-J
un
-18
9-J
ul-
18
14
-Au
g-1
8
25
-Sep
-18
2-N
ov-
18
12
-Dec
-18
18
-Jan
-19
25
-Feb
-19
4-A
pr-
19
16
-May
-19
24
-Ju
n-1
9
30
-Ju
l-1
9
9-S
ep-1
9
18
-Oct
-19
27
-No
v-1
9
3-J
an-2
0
7-F
eb-2
0
18
-Mar
-20
29
-Ap
r-2
0
8-J
un
-20
14
-Ju
l-2
0
19
-Au
g-2
0
24
-Sep
-20
2-N
ov-
20
9-D
ec-2
0
15
-Jan
-21
23
-Feb
-21
5-A
pr-
21
14
-May
-21
21
-Ju
n-2
1
28
-Ju
l-2
1
Charts by Reliable software
EQUITY
Above calls are recommended with a time horizon of 1-2 months
Disclaimer : The analyst and its affiliates companies make no representation or warranty in relation to the accuracy, completeness or reliability of the information contained in its research. The analysis contained in the analyst research is based on numerous assumptions. Different assumptions could result in materially different results.The analyst not any of its affiliated companies not any of their, members, directors, employees or agents accepts any liability for any loss or damage arising out of the use of all or any part of the analysis research.
SOURCE: RELIABLE SOFTWARE
7
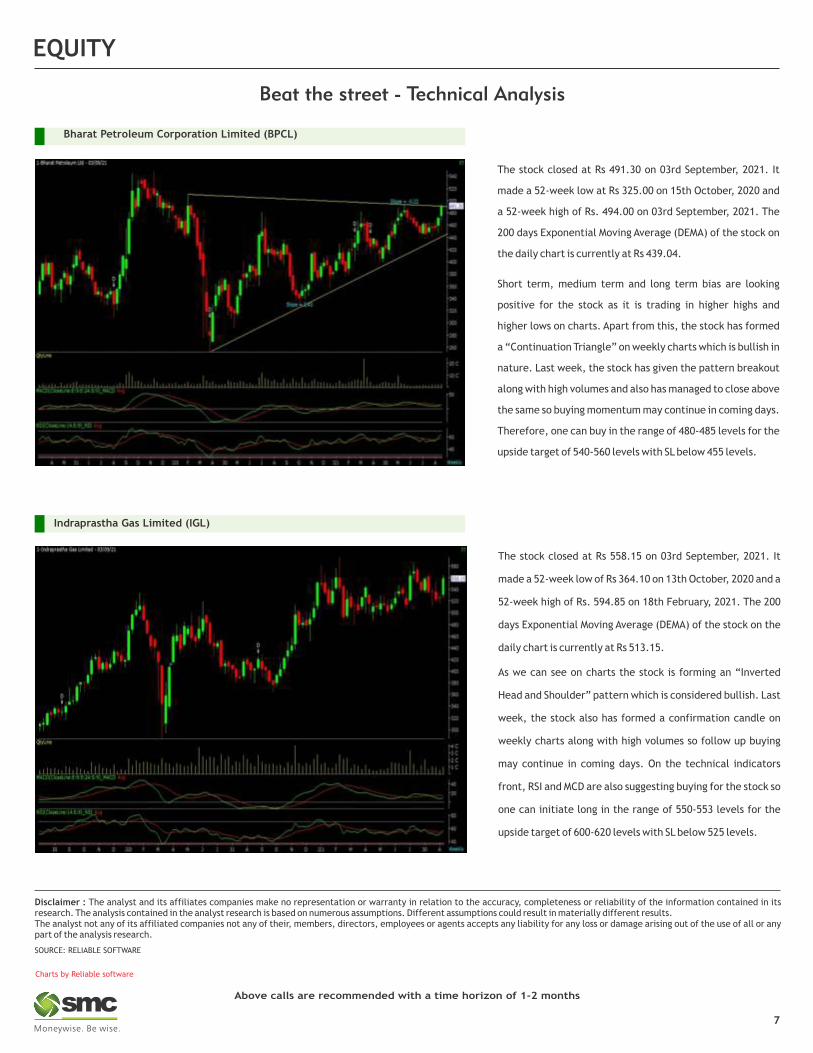
The stock closed at Rs 491.30 on 03rd September, 2021. It
made a 52-week low at Rs 325.00 on 15th October, 2020 and
a 52-week high of Rs. 494.00 on 03rd September, 2021. The
200 days Exponential Moving Average (DEMA) of the stock on
the daily chart is currently at Rs 439.04.
Short term, medium term and long term bias are looking
positive for the stock as it is trading in higher highs and
higher lows on charts. Apart from this, the stock has formed
a “Continuation Triangle” on weekly charts which is bullish in
nature. Last week, the stock has given the pattern breakout
along with high volumes and also has managed to close above
the same so buying momentum may continue in coming days.
Therefore, one can buy in the range of 480-485 levels for the
upside target of 540-560 levels with SL below 455 levels.
The stock closed at Rs 558.15 on 03rd September, 2021. It
made a 52-week low of Rs 364.10 on 13th October, 2020 and a
52-week high of Rs. 594.85 on 18th February, 2021. The 200
days Exponential Moving Average (DEMA) of the stock on the
daily chart is currently at Rs 513.15.
As we can see on charts the stock is forming an “Inverted
Head and Shoulder” pattern which is considered bullish. Last
week, the stock also has formed a confirmation candle on
weekly charts along with high volumes so follow up buying
may continue in coming days. On the technical indicators
front, RSI and MCD are also suggesting buying for the stock so
one can initiate long in the range of 550-553 levels for the
upside target of 600-620 levels with SL below 525 levels.
Indraprastha Gas Limited (IGL)
Bharat Petroleum Corporation Limited (BPCL)
DERIVATIVES
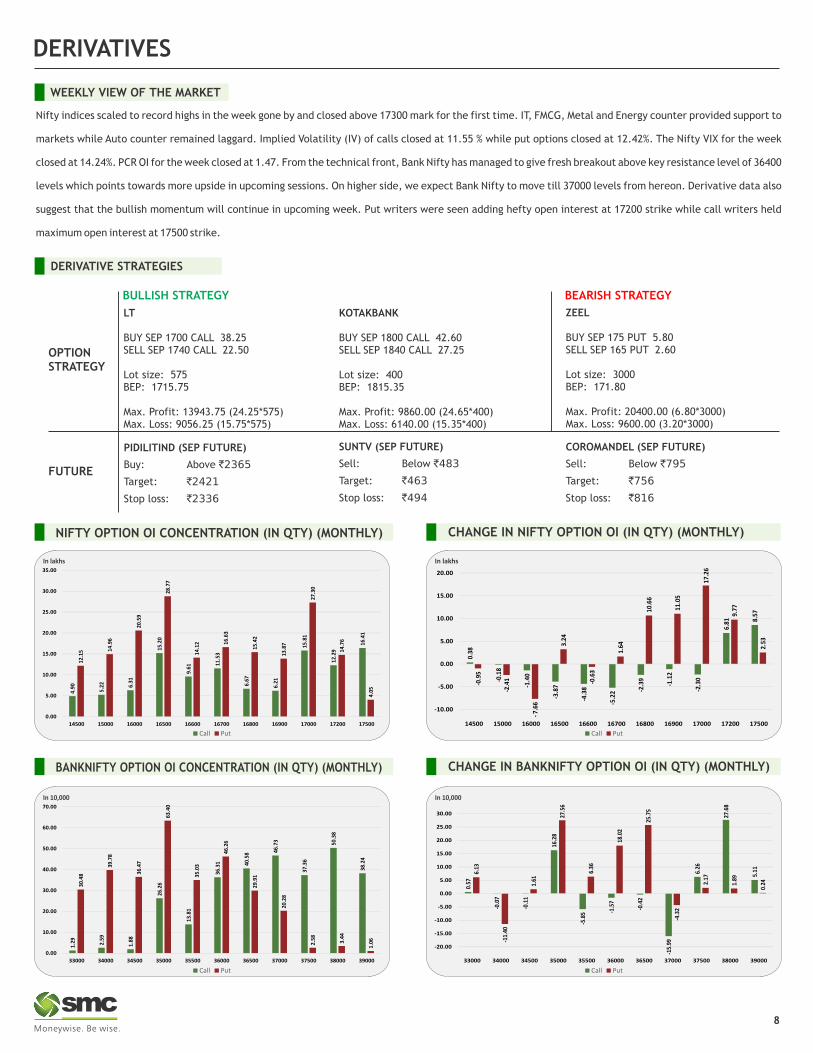
WEEKLY VIEW OF THE MARKET
Nifty indices scaled to record highs in the week gone by and closed above 17300 mark for the first time. IT, FMCG, Metal and Energy counter provided support to
markets while Auto counter remained laggard. Implied Volatility (IV) of calls closed at 11.55 % while put options closed at 12.42%. The Nifty VIX for the week
closed at 14.24%. PCR OI for the week closed at 1.47. From the technical front, Bank Nifty has managed to give fresh breakout above key resistance level of 36400
levels which points towards more upside in upcoming sessions. On higher side, we expect Bank Nifty to move till 37000 levels from hereon. Derivative data also
suggest that the bullish momentum will continue in upcoming week. Put writers were seen adding hefty open interest at 17200 strike while call writers held
maximum open interest at 17500 strike.
ZEEL
BUY SEP 175 PUT 5.80SELL SEP 165 PUT 2.60
Lot size: 3000BEP: 171.80
Max. Profit: 20400.00 (6.80*3000)Max. Loss: 9600.00 (3.20*3000)
OPTIONSTRATEGY
FUTURE
KOTAKBANK
BUY SEP 1800 CALL 42.60SELL SEP 1840 CALL 27.25
Lot size: 400BEP: 1815.35
Max. Profit: 9860.00 (24.65*400)Max. Loss: 6140.00 (15.35*400)
DERIVATIVE STRATEGIES
LT
BUY SEP 1700 CALL 38.25SELL SEP 1740 CALL 22.50
Lot size: 575BEP: 1715.75
Max. Profit: 13943.75 (24.25*575)Max. Loss: 9056.25 (15.75*575)
8
PIDILITIND (SEP FUTURE)
Buy: Above `2365
Target: `2421
Stop loss: `2336
COROMANDEL (SEP FUTURE)
Sell: Below `795
Target: `756
Stop loss: `816
BULLISH STRATEGY
CHANGE IN NIFTY OPTION OI (IN QTY) (MONTHLY)NIFTY OPTION OI CONCENTRATION (IN QTY) (MONTHLY)
CHANGE IN BANKNIFTY OPTION OI (IN QTY) (MONTHLY)BANKNIFTY OPTION OI CONCENTRATION (IN QTY) (MONTHLY)
In lakhs
In 10,000
In lakhs
In 10,000
BEARISH STRATEGY
SUNTV (SEP FUTURE)
Sell: Below `483
Target: `463
Stop loss: `494
1.29 2.
59
1.88
26.2
6
13.8
1
36.3
1 40.5
8 46.7
3
37.3
6
50.3
8
38.2
4
30.4
8
39.7
8
36.4
7
63.4
0
35.0
3
46.2
6
29.9
1
20.2
8
2.58 3.44
1.06
0.00
10.00
20.00
30.00
40.00
50.00
60.00
70.00
33000 34000 34500 35000 35500 36000 36500 37000 37500 38000 39000
4.90
5.22 6.
31
15.2
0
9.61
11.5
3
6.67
6.21
15.8
1
12.2
9
16.4
1
12.1
5 14.9
6
20.5
9
28.7
7
14.1
2 16.6
3
15.4
2
13.8
7
27.3
0
14.7
6
4.05
0.00
5.00
10.00
15.00
20.00
25.00
30.00
35.00
14500 15000 16000 16500 16600 16700 16800 16900 17000 17200 17500
0.38
-0.1
8
-1.4
0
-3.8
7
-4.3
8
-5.2
2 -2.3
9
-1.1
2
-2.3
0
6.81 8.
57
-0.9
5
-2.4
1
-7.6
6
3.24
-0.6
3
1.64
10.6
6
11.0
5
17.2
6
9.77
2.53
-10.00
-5.00
0.00
5.00
10.00
15.00
20.00
14500 15000 16000 16500 16600 16700 16800 16900 17000 17200 17500
0.57
-0.0
7
-0.1
1
16.2
8
-5.8
5 -1.5
7
-0.4
2
-15.
99
6.26
27.6
8
5.116.
13
-11.
40
1.61
27.5
6
6.36
18.0
2
25.7
5
-4.3
2
2.17
1.89
0.24
-20.00
-15.00
-10.00
-5.00
0.00
5.00
10.00
15.00
20.00
25.00
30.00
33000 34000 34500 35000 35500 36000 36500 37000 37500 38000 39000
Call Put Call Put
Call Put Call Put
DERIVATIVES
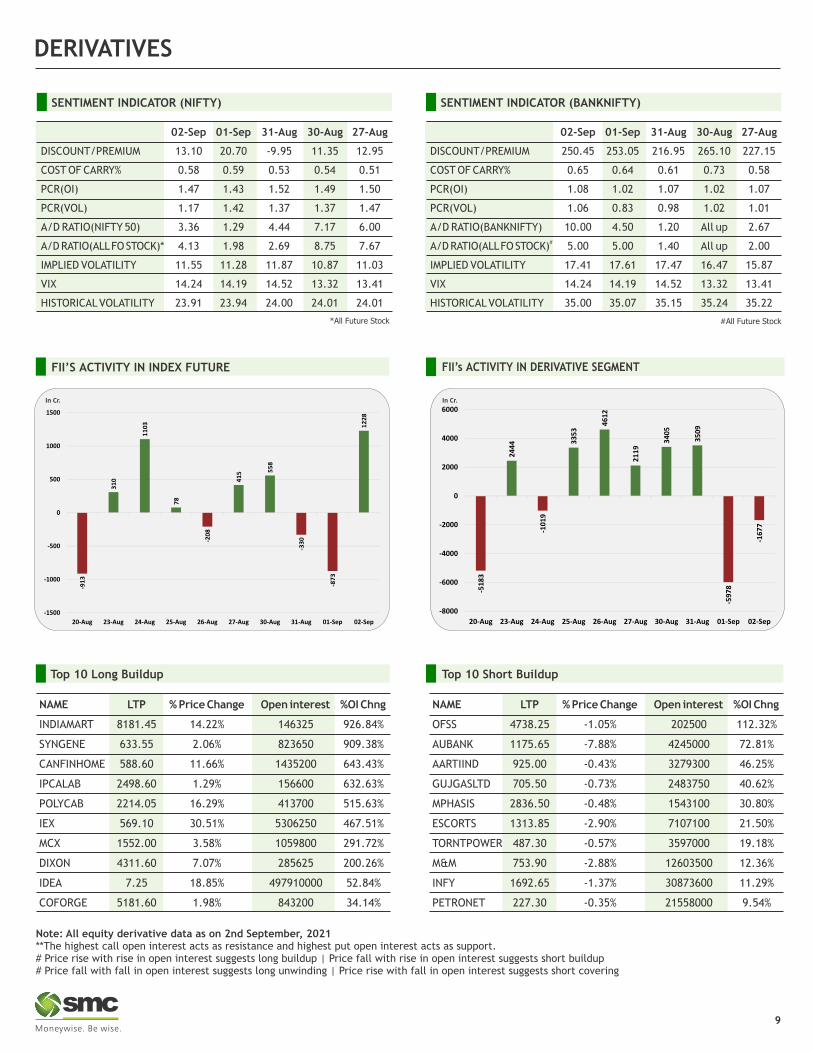
SENTIMENT INDICATOR (NIFTY)
02-Sep 01-Sep 31-Aug 30-Aug 27-Aug
DISCOUNT/PREMIUM 13.10 20.70 -9.95 11.35 12.95
COST OF CARRY% 0.58 0.59 0.53 0.54 0.51
PCR(OI) 1.47 1.43 1.52 1.49 1.50
PCR(VOL) 1.17 1.42 1.37 1.37 1.47
A/D RATIO(NIFTY 50) 3.36 1.29 4.44 7.17 6.00
A/D RATIO(ALL FO STOCK)* 4.13 1.98 2.69 8.75 7.67
IMPLIED VOLATILITY 11.55 11.28 11.87 10.87 11.03
VIX 14.24 14.19 14.52 13.32 13.41
HISTORICAL VOLATILITY 23.91 23.94 24.00 24.01 24.01
*All Future Stock
SENTIMENT INDICATOR (BANKNIFTY)
Note: All equity derivative data as on 2nd September, 2021**The highest call open interest acts as resistance and highest put open interest acts as support.# Price rise with rise in open interest suggests long buildup | Price fall with rise in open interest suggests short buildup # Price fall with fall in open interest suggests long unwinding | Price rise with fall in open interest suggests short covering
#All Future Stock
02-Sep 01-Sep 31-Aug 30-Aug 27-Aug
DISCOUNT/PREMIUM 250.45 253.05 216.95 265.10 227.15
COST OF CARRY% 0.65 0.64 0.61 0.73 0.58
PCR(OI) 1.08 1.02 1.07 1.02 1.07
PCR(VOL) 1.06 0.83 0.98 1.02 1.01
A/D RATIO(BANKNIFTY) 10.00 4.50 1.20 All up 2.67#A/D RATIO(ALL FO STOCK) 5.00 5.00 1.40 All up 2.00
IMPLIED VOLATILITY 17.41 17.61 17.47 16.47 15.87
VIX 14.24 14.19 14.52 13.32 13.41
HISTORICAL VOLATILITY 35.00 35.07 35.15 35.24 35.22
9
FII’s ACTIVITY IN DERIVATIVE SEGMENTFII’S ACTIVITY IN INDEX FUTURE
In Cr. In Cr.
Top 10 Long Buildup Top 10 Short Buildup
NAME LTP % Price Change Open interest %OI Chng
INDIAMART 8181.45 14.22% 146325 926.84%
SYNGENE 633.55 2.06% 823650 909.38%
CANFINHOME 588.60 11.66% 1435200 643.43%
IPCALAB 2498.60 1.29% 156600 632.63%
POLYCAB 2214.05 16.29% 413700 515.63%
IEX 569.10 30.51% 5306250 467.51%
MCX 1552.00 3.58% 1059800 291.72%
DIXON 4311.60 7.07% 285625 200.26%
IDEA 7.25 18.85% 497910000 52.84%
COFORGE 5181.60 1.98% 843200 34.14%
-51
83
24
44
-10
19
33
53
46
12
21
19
34
05
35
09
-59
78
-16
77
-8000
-6000
-4000
-2000
0
2000
4000
6000
20-Aug 23-Aug 24-Aug 25-Aug 26-Aug 27-Aug 30-Aug 31-Aug 01-Sep 02-Sep
-91
3
31
0
11
03
78
-20
8
41
5 55
8
-33
0
-87
3
12
28
-1500
-1000
-500
0
500
1000
1500
20-Aug 23-Aug 24-Aug 25-Aug 26-Aug 27-Aug 30-Aug 31-Aug 01-Sep 02-Sep
NAME LTP % Price Change Open interest %OI Chng
OFSS 4738.25 -1.05% 202500 112.32%
AUBANK 1175.65 -7.88% 4245000 72.81%
AARTIIND 925.00 -0.43% 3279300 46.25%
GUJGASLTD 705.50 -0.73% 2483750 40.62%
MPHASIS 2836.50 -0.48% 1543100 30.80%
ESCORTS 1313.85 -2.90% 7107100 21.50%
TORNTPOWER 487.30 -0.57% 3597000 19.18%
M&M 753.90 -2.88% 12603500 12.36%
INFY 1692.65 -1.37% 30873600 11.29%
PETRONET 227.30 -0.35% 21558000 9.54%
10
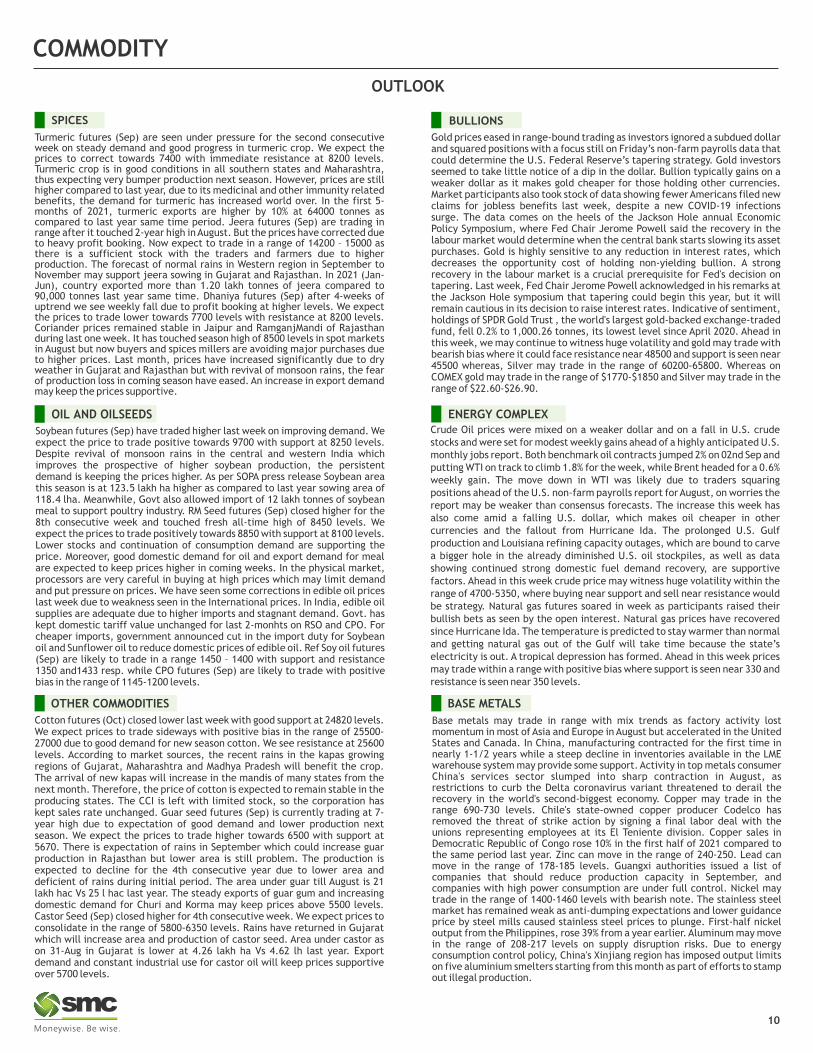
Turmeric futures (Sep) are seen under pressure for the second consecutive week on steady demand and good progress in turmeric crop. We expect the prices to correct towards 7400 with immediate resistance at 8200 levels. Turmeric crop is in good conditions in all southern states and Maharashtra, thus expecting very bumper production next season. However, prices are still higher compared to last year, due to its medicinal and other immunity related benefits, the demand for turmeric has increased world over. In the first 5-months of 2021, turmeric exports are higher by 10% at 64000 tonnes as compared to last year same time period. Jeera futures (Sep) are trading in range after it touched 2-year high in August. But the prices have corrected due to heavy profit booking. Now expect to trade in a range of 14200 – 15000 as there is a sufficient stock with the traders and farmers due to higher production. The forecast of normal rains in Western region in September to November may support jeera sowing in Gujarat and Rajasthan. In 2021 (Jan-Jun), country exported more than 1.20 lakh tonnes of jeera compared to 90,000 tonnes last year same time. Dhaniya futures (Sep) after 4-weeks of uptrend we see weekly fall due to profit booking at higher levels. We expect the prices to trade lower towards 7700 levels with resistance at 8200 levels. Coriander prices remained stable in Jaipur and RamganjMandi of Rajasthan during last one week. It has touched season high of 8500 levels in spot markets in August but now buyers and spices millers are avoiding major purchases due to higher prices. Last month, prices have increased significantly due to dry weather in Gujarat and Rajasthan but with revival of monsoon rains, the fear of production loss in coming season have eased. An increase in export demand may keep the prices supportive.
SPICES
Gold prices eased in range-bound trading as investors ignored a subdued dollar and squared positions with a focus still on Friday’s non-farm payrolls data that could determine the U.S. Federal Reserve’s tapering strategy. Gold investors seemed to take little notice of a dip in the dollar. Bullion typically gains on a weaker dollar as it makes gold cheaper for those holding other currencies. Market participants also took stock of data showing fewer Americans filed new claims for jobless benefits last week, despite a new COVID-19 infections surge. The data comes on the heels of the Jackson Hole annual Economic Policy Symposium, where Fed Chair Jerome Powell said the recovery in the labour market would determine when the central bank starts slowing its asset purchases. Gold is highly sensitive to any reduction in interest rates, which decreases the opportunity cost of holding non-yielding bullion. A strong recovery in the labour market is a crucial prerequisite for Fed's decision on tapering. Last week, Fed Chair Jerome Powell acknowledged in his remarks at the Jackson Hole symposium that tapering could begin this year, but it will remain cautious in its decision to raise interest rates. Indicative of sentiment, holdings of SPDR Gold Trust , the world's largest gold-backed exchange-traded fund, fell 0.2% to 1,000.26 tonnes, its lowest level since April 2020. Ahead in this week, we may continue to witness huge volatility and gold may trade with bearish bias where it could face resistance near 48500 and support is seen near 45500 whereas, Silver may trade in the range of 60200-65800. Whereas on COMEX gold may trade in the range of $1770-$1850 and Silver may trade in the range of $22.60-$26.90.
BULLIONS
Soybean futures (Sep) have traded higher last week on improving demand. We expect the price to trade positive towards 9700 with support at 8250 levels. Despite revival of monsoon rains in the central and western India which improves the prospective of higher soybean production, the persistent demand is keeping the prices higher. As per SOPA press release Soybean area this season is at 123.5 lakh ha higher as compared to last year sowing area of 118.4 lha. Meanwhile, Govt also allowed import of 12 lakh tonnes of soybean meal to support poultry industry. RM Seed futures (Sep) closed higher for the 8th consecutive week and touched fresh all-time high of 8450 levels. We expect the prices to trade positively towards 8850 with support at 8100 levels. Lower stocks and continuation of consumption demand are supporting the price. Moreover, good domestic demand for oil and export demand for meal are expected to keep prices higher in coming weeks. In the physical market, processors are very careful in buying at high prices which may limit demand and put pressure on prices. We have seen some corrections in edible oil prices last week due to weakness seen in the International prices. In India, edible oil supplies are adequate due to higher imports and stagnant demand. Govt. has kept domestic tariff value unchanged for last 2-monhts on RSO and CPO. For cheaper imports, government announced cut in the import duty for Soybean oil and Sunflower oil to reduce domestic prices of edible oil. Ref Soy oil futures (Sep) are likely to trade in a range 1450 – 1400 with support and resistance 1350 and1433 resp. while CPO futures (Sep) are likely to trade with positive bias in the range of 1145-1200 levels.
OIL AND OILSEEDSCrude Oil prices were mixed on a weaker dollar and on a fall in U.S. crude stocks and were set for modest weekly gains ahead of a highly anticipated U.S. monthly jobs report. Both benchmark oil contracts jumped 2% on 02nd Sep and putting WTI on track to climb 1.8% for the week, while Brent headed for a 0.6% weekly gain. The move down in WTI was likely due to traders squaring positions ahead of the U.S. non-farm payrolls report for August, on worries the report may be weaker than consensus forecasts. The increase this week has also come amid a falling U.S. dollar, which makes oil cheaper in other currencies and the fallout from Hurricane Ida. The prolonged U.S. Gulf production and Louisiana refining capacity outages, which are bound to carve a bigger hole in the already diminished U.S. oil stockpiles, as well as data showing continued strong domestic fuel demand recovery, are supportive factors. Ahead in this week crude price may witness huge volatility within the range of 4700-5350, where buying near support and sell near resistance would be strategy. Natural gas futures soared in week as participants raised their bullish bets as seen by the open interest. Natural gas prices have recovered since Hurricane Ida. The temperature is predicted to stay warmer than normal and getting natural gas out of the Gulf will take time because the state’s electricity is out. A tropical depression has formed. Ahead in this week prices may trade within a range with positive bias where support is seen near 330 and resistance is seen near 350 levels.
ENERGY COMPLEX
Cotton futures (Oct) closed lower last week with good support at 24820 levels. We expect prices to trade sideways with positive bias in the range of 25500-27000 due to good demand for new season cotton. We see resistance at 25600 levels. According to market sources, the recent rains in the kapas growing regions of Gujarat, Maharashtra and Madhya Pradesh will benefit the crop. The arrival of new kapas will increase in the mandis of many states from the next month. Therefore, the price of cotton is expected to remain stable in the producing states. The CCI is left with limited stock, so the corporation has kept sales rate unchanged. Guar seed futures (Sep) is currently trading at 7-year high due to expectation of good demand and lower production next season. We expect the prices to trade higher towards 6500 with support at 5670. There is expectation of rains in September which could increase guar production in Rajasthan but lower area is still problem. The production is expected to decline for the 4th consecutive year due to lower area and deficient of rains during initial period. The area under guar till August is 21 lakh hac Vs 25 l hac last year. The steady exports of guar gum and increasing domestic demand for Churi and Korma may keep prices above 5500 levels. Castor Seed (Sep) closed higher for 4th consecutive week. We expect prices to consolidate in the range of 5800-6350 levels. Rains have returned in Gujarat which will increase area and production of castor seed. Area under castor as on 31-Aug in Gujarat is lower at 4.26 lakh ha Vs 4.62 lh last year. Export demand and constant industrial use for castor oil will keep prices supportive over 5700 levels.
OTHER COMMODITIES
Base metals may trade in range with mix trends as factory activity lost momentum in most of Asia and Europe in August but accelerated in the United States and Canada. In China, manufacturing contracted for the first time in nearly 1-1/2 years while a steep decline in inventories available in the LME warehouse system may provide some support. Activity in top metals consumer China's services sector slumped into sharp contraction in August, as restrictions to curb the Delta coronavirus variant threatened to derail the recovery in the world's second-biggest economy. Copper may trade in the range 690-730 levels. Chile's state-owned copper producer Codelco has removed the threat of strike action by signing a final labor deal with the unions representing employees at its El Teniente division. Copper sales in Democratic Republic of Congo rose 10% in the first half of 2021 compared to the same period last year. Zinc can move in the range of 240-250. Lead can move in the range of 178-185 levels. Guangxi authorities issued a list of companies that should reduce production capacity in September, and companies with high power consumption are under full control. Nickel may trade in the range of 1400-1460 levels with bearish note. The stainless steel market has remained weak as anti-dumping expectations and lower guidance price by steel mills caused stainless steel prices to plunge. First-half nickel output from the Philippines, rose 39% from a year earlier. Aluminum may move in the range of 208-217 levels on supply disruption risks. Due to energy consumption control policy, China's Xinjiang region has imposed output limits on five aluminium smelters starting from this month as part of efforts to stamp out illegal production.
BASE METALS
11
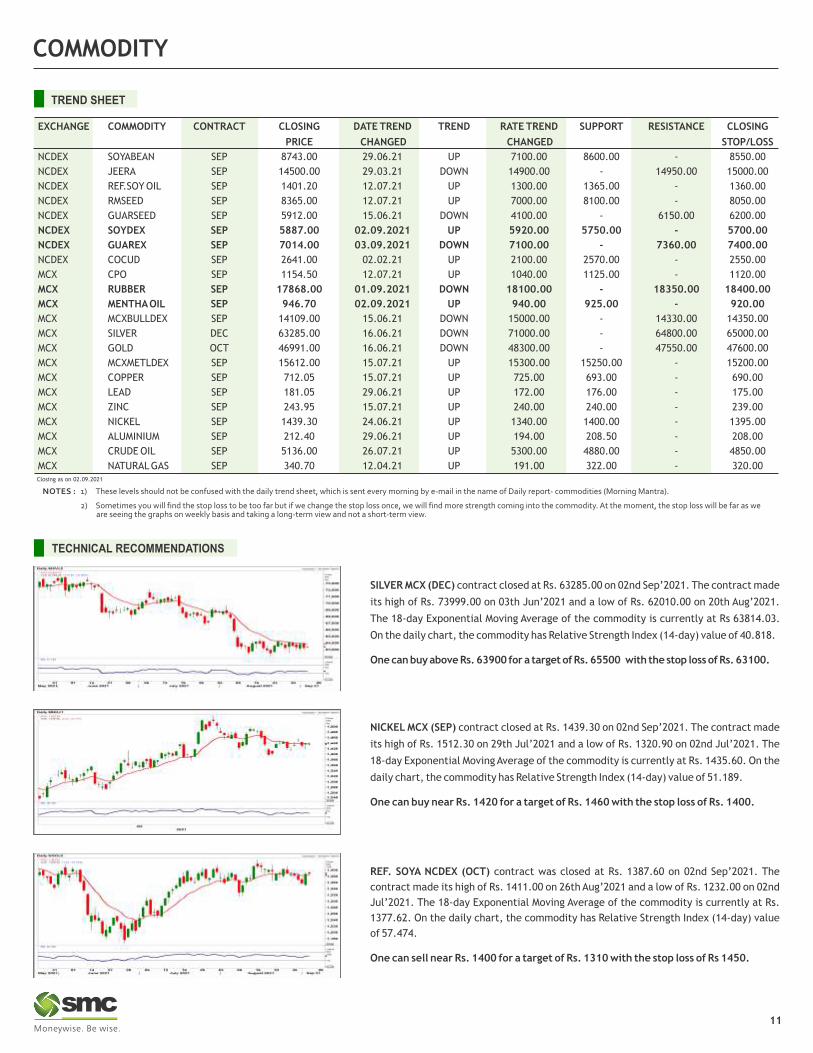
TREND SHEET
Closing as on 02.09.2021
EXCHANGE COMMODITY CONTRACT CLOSING DATE TREND TREND RATE TREND SUPPORT RESISTANCE CLOSING
PRICE CHANGED CHANGED STOP/LOSS
NCDEX SOYABEAN SEP 8743.00 29.06.21 UP 7100.00 8600.00 - 8550.00
NCDEX JEERA SEP 14500.00 29.03.21 DOWN 14900.00 - 14950.00 15000.00
NCDEX REF.SOY OIL SEP 1401.20 12.07.21 UP 1300.00 1365.00 - 1360.00
NCDEX RMSEED SEP 8365.00 12.07.21 UP 7000.00 8100.00 - 8050.00
NCDEX GUARSEED SEP 5912.00 15.06.21 DOWN 4100.00 - 6150.00 6200.00
NCDEX SOYDEX SEP 5887.00 02.09.2021 UP 5920.00 5750.00 - 5700.00
NCDEX GUAREX SEP 7014.00 03.09.2021 DOWN 7100.00 - 7360.00 7400.00
NCDEX COCUD SEP 2641.00 02.02.21 UP 2100.00 2570.00 - 2550.00
MCX CPO SEP 1154.50 12.07.21 UP 1040.00 1125.00 - 1120.00
MCX RUBBER SEP 17868.00 01.09.2021 DOWN 18100.00 - 18350.00 18400.00
MCX MENTHA OIL SEP 946.70 02.09.2021 UP 940.00 925.00 - 920.00
MCX MCXBULLDEX SEP 14109.00 15.06.21 DOWN 15000.00 - 14330.00 14350.00
MCX SILVER DEC 63285.00 16.06.21 DOWN 71000.00 - 64800.00 65000.00
MCX GOLD OCT 46991.00 16.06.21 DOWN 48300.00 - 47550.00 47600.00
MCX MCXMETLDEX SEP 15612.00 15.07.21 UP 15300.00 15250.00 - 15200.00
MCX COPPER SEP 712.05 15.07.21 UP 725.00 693.00 - 690.00
MCX LEAD SEP 181.05 29.06.21 UP 172.00 176.00 - 175.00
MCX ZINC SEP 243.95 15.07.21 UP 240.00 240.00 - 239.00
MCX NICKEL SEP 1439.30 24.06.21 UP 1340.00 1400.00 - 1395.00
MCX ALUMINIUM SEP 212.40 29.06.21 UP 194.00 208.50 - 208.00
MCX CRUDE OIL SEP 5136.00 26.07.21 UP 5300.00 4880.00 - 4850.00
MCX NATURAL GAS SEP 340.70 12.04.21 UP 191.00 322.00 - 320.00
TECHNICAL RECOMMENDATIONS
SILVER MCX (DEC) contract closed at Rs. 63285.00 on 02nd Sep’2021. The contract made
its high of Rs. 73999.00 on 03th Jun’2021 and a low of Rs. 62010.00 on 20th Aug’2021.
The 18-day Exponential Moving Average of the commodity is currently at Rs 63814.03.
On the daily chart, the commodity has Relative Strength Index (14-day) value of 40.818.
One can buy above Rs. 63900 for a target of Rs. 65500 with the stop loss of Rs. 63100.
NICKEL MCX (SEP) contract closed at Rs. 1439.30 on 02nd Sep’2021. The contract made
its high of Rs. 1512.30 on 29th Jul’2021 and a low of Rs. 1320.90 on 02nd Jul’2021. The
18-day Exponential Moving Average of the commodity is currently at Rs. 1435.60. On the
daily chart, the commodity has Relative Strength Index (14-day) value of 51.189.
One can buy near Rs. 1420 for a target of Rs. 1460 with the stop loss of Rs. 1400.
REF. SOYA NCDEX (OCT) contract was closed at Rs. 1387.60 on 02nd Sep’2021. The
contract made its high of Rs. 1411.00 on 26th Aug’2021 and a low of Rs. 1232.00 on 02nd
Jul’2021. The 18-day Exponential Moving Average of the commodity is currently at Rs.
1377.62. On the daily chart, the commodity has Relative Strength Index (14-day) value
of 57.474.
One can sell near Rs. 1400 for a target of Rs. 1310 with the stop loss of Rs 1450.
NEWS DIGEST
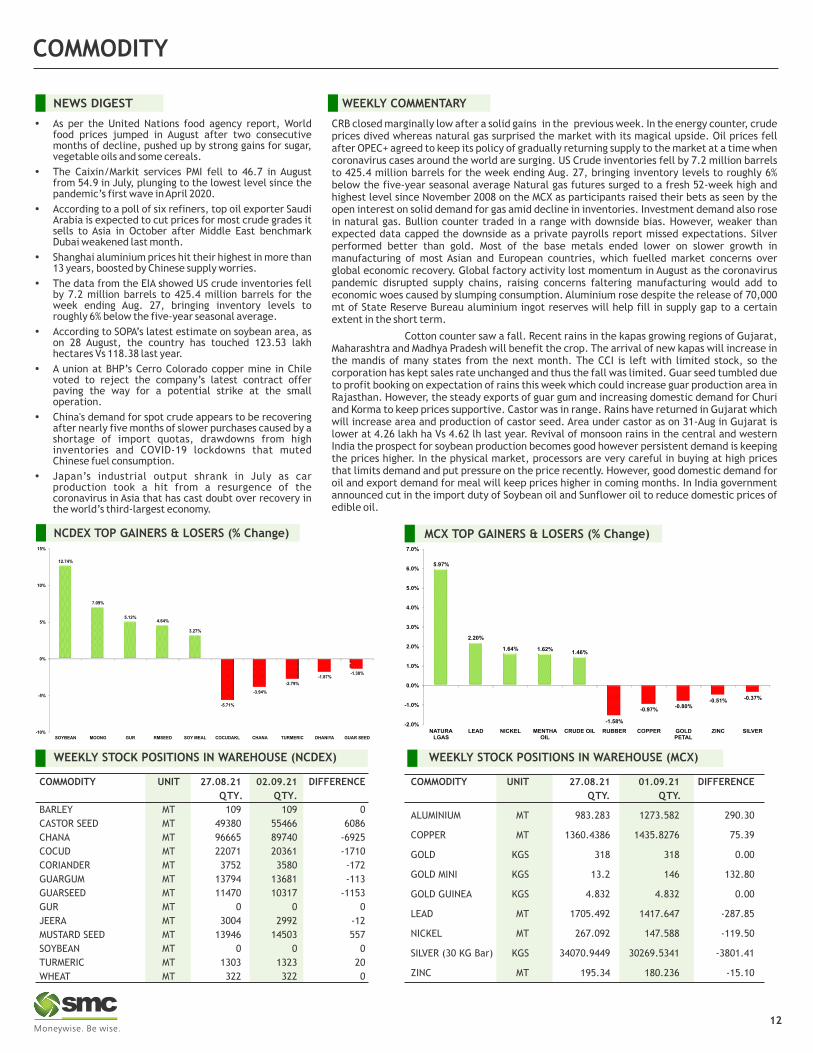
CRB closed marginally low after a solid gains in the previous week. In the energy counter, crude prices dived whereas natural gas surprised the market with its magical upside. Oil prices fell after OPEC+ agreed to keep its policy of gradually returning supply to the market at a time when coronavirus cases around the world are surging. US Crude inventories fell by 7.2 million barrels to 425.4 million barrels for the week ending Aug. 27, bringing inventory levels to roughly 6% below the five-year seasonal average Natural gas futures surged to a fresh 52-week high and highest level since November 2008 on the MCX as participants raised their bets as seen by the open interest on solid demand for gas amid decline in inventories. Investment demand also rose in natural gas. Bullion counter traded in a range with downside bias. However, weaker than expected data capped the downside as a private payrolls report missed expectations. Silver performed better than gold. Most of the base metals ended lower on slower growth in manufacturing of most Asian and European countries, which fuelled market concerns over global economic recovery. Global factory activity lost momentum in August as the coronavirus pandemic disrupted supply chains, raising concerns faltering manufacturing would add to economic woes caused by slumping consumption. Aluminium rose despite the release of 70,000 mt of State Reserve Bureau aluminium ingot reserves will help fill in supply gap to a certain extent in the short term.
Cotton counter saw a fall. Recent rains in the kapas growing regions of Gujarat, Maharashtra and Madhya Pradesh will benefit the crop. The arrival of new kapas will increase in the mandis of many states from the next month. The CCI is left with limited stock, so the corporation has kept sales rate unchanged and thus the fall was limited. Guar seed tumbled due to profit booking on expectation of rains this week which could increase guar production area in Rajasthan. However, the steady exports of guar gum and increasing domestic demand for Churi and Korma to keep prices supportive. Castor was in range. Rains have returned in Gujarat which will increase area and production of castor seed. Area under castor as on 31-Aug in Gujarat is lower at 4.26 lakh ha Vs 4.62 lh last year. Revival of monsoon rains in the central and western India the prospect for soybean production becomes good however persistent demand is keeping the prices higher. In the physical market, processors are very careful in buying at high prices that limits demand and put pressure on the price recently. However, good domestic demand for oil and export demand for meal will keep prices higher in coming months. In India government announced cut in the import duty of Soybean oil and Sunflower oil to reduce domestic prices of edible oil.
12
WEEKLY COMMENTARY
COMMODITY UNIT 27.08.21 02.09.21 DIFFERENCE
QTY. QTY.
BARLEY MT 109 109 0
CASTOR SEED MT 49380 55466 6086
CHANA MT 96665 89740 -6925
COCUD MT 22071 20361 -1710
CORIANDER MT 3752 3580 -172
GUARGUM MT 13794 13681 -113
GUARSEED MT 11470 10317 -1153
GUR MT 0 0 0
JEERA MT 3004 2992 -12
MUSTARD SEED MT 13946 14503 557
SOYBEAN MT 0 0 0
TURMERIC MT 1303 1323 20
WHEAT MT 322 322 0
WEEKLY STOCK POSITIONS IN WAREHOUSE (NCDEX)
Ÿ As per the United Nations food agency report, World food prices jumped in August after two consecutive months of decline, pushed up by strong gains for sugar, vegetable oils and some cereals.
Ÿ The Caixin/Markit services PMI fell to 46.7 in August from 54.9 in July, plunging to the lowest level since the pandemic’s first wave in April 2020.
Ÿ According to a poll of six refiners, top oil exporter Saudi Arabia is expected to cut prices for most crude grades it sells to Asia in October after Middle East benchmark Dubai weakened last month.
Ÿ Shanghai aluminium prices hit their highest in more than 13 years, boosted by Chinese supply worries.
Ÿ The data from the EIA showed US crude inventories fell by 7.2 million barrels to 425.4 million barrels for the week ending Aug. 27, bringing inventory levels to roughly 6% below the five-year seasonal average.
Ÿ According to SOPA’s latest estimate on soybean area, as on 28 August, the country has touched 123.53 lakh hectares Vs 118.38 last year.
Ÿ A union at BHP’s Cerro Colorado copper mine in Chile voted to reject the company’s latest contract offer paving the way for a potential strike at the small operation.
Ÿ China's demand for spot crude appears to be recovering after nearly five months of slower purchases caused by a shortage of import quotas, drawdowns from high inventories and COVID-19 lockdowns that muted Chinese fuel consumption.
Ÿ Japan’s industrial output shrank in July as car production took a hit from a resurgence of the coronavirus in Asia that has cast doubt over recovery in the world’s third-largest economy.
NCDEX TOP GAINERS & LOSERS (% Change)
COMMODITY UNIT 27.08.21 01.09.21 DIFFERENCE
QTY. QTY.
ALUMINIUM MT 983.283 1273.582 290.30
COPPER MT 1360.4386 1435.8276 75.39
GOLD KGS 318 318 0.00
GOLD MINI KGS 13.2 146 132.80
GOLD GUINEA KGS 4.832 4.832 0.00
LEAD MT 1705.492 1417.647 -287.85
NICKEL MT 267.092 147.588 -119.50
SILVER (30 KG Bar) KGS 34070.9449 30269.5341 -3801.41
ZINC MT 195.34 180.236 -15.10
WEEKLY STOCK POSITIONS IN WAREHOUSE (MCX)
MCX TOP GAINERS & LOSERS (% Change)
12.74%
7.09%
5.12%4.64%
3.27%
-5.71%
-3.94%
-2.79%
-1.87%-1.38%
-10%
-5%
0%
5%
10%
15%
SOYBEAN MOONG GUR RMSEED SOY MEAL COCUDAKL CHANA TURMERIC DHANIYA GUAR SEED
5.97%
2.20%
1.64% 1.62%1.46%
-0.51% -0.37%
-1.58%
-0.97%-0.80%
-2.0%
-1.0%
0.0%
1.0%
2.0%
3.0%
4.0%
5.0%
6.0%
7.0%
NATURALGAS
LEAD NICKEL MENTHAOIL
CRUDE OIL RUBBER COPPER GOLDPETAL
ZINC SILVER
COMMODITY
WEEKLY STOCK POSITIONS IN LME (IN TONNES)
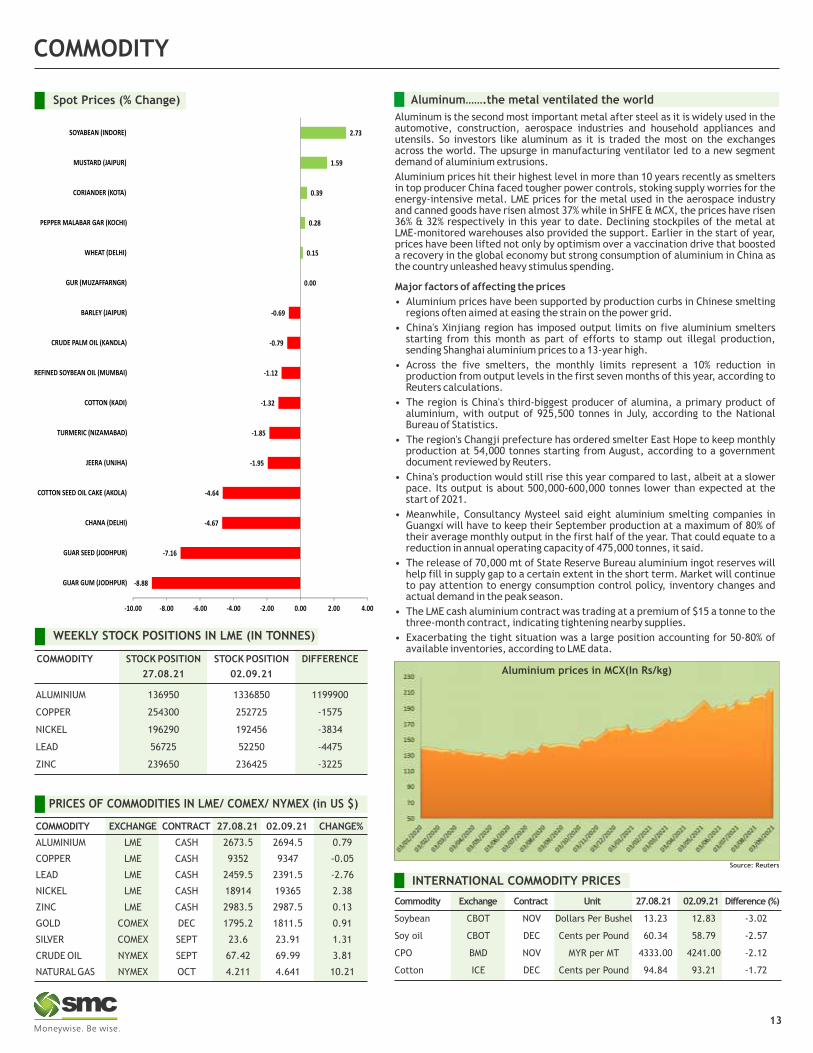
Spot Prices (% Change) Aluminum…….the metal ventilated the world
13
COMMODITY STOCK POSITION STOCK POSITION DIFFERENCE
27.08.21 02.09.21
ALUMINIUM 136950 1336850 1199900
COPPER 254300 252725 -1575
NICKEL 196290 192456 -3834
LEAD 56725 52250 -4475
ZINC 239650 236425 -3225
Aluminum is the second most important metal after steel as it is widely used in the automotive, construction, aerospace industries and household appliances and utensils. So investors like aluminum as it is traded the most on the exchanges across the world. The upsurge in manufacturing ventilator led to a new segment demand of aluminium extrusions.
Aluminium prices hit their highest level in more than 10 years recently as smelters in top producer China faced tougher power controls, stoking supply worries for the energy-intensive metal. LME prices for the metal used in the aerospace industry and canned goods have risen almost 37% while in SHFE & MCX, the prices have risen 36% & 32% respectively in this year to date. Declining stockpiles of the metal at LME-monitored warehouses also provided the support. Earlier in the start of year, prices have been lifted not only by optimism over a vaccination drive that boosted a recovery in the global economy but strong consumption of aluminium in China as the country unleashed heavy stimulus spending.
Major factors of affecting the prices
• Aluminium prices have been supported by production curbs in Chinese smelting regions often aimed at easing the strain on the power grid.
• China's Xinjiang region has imposed output limits on five aluminium smelters starting from this month as part of efforts to stamp out illegal production, sending Shanghai aluminium prices to a 13-year high.
• Across the five smelters, the monthly limits represent a 10% reduction in production from output levels in the first seven months of this year, according to Reuters calculations.
• The region is China's third-biggest producer of alumina, a primary product of aluminium, with output of 925,500 tonnes in July, according to the National Bureau of Statistics.
• The region's Changji prefecture has ordered smelter East Hope to keep monthly production at 54,000 tonnes starting from August, according to a government document reviewed by Reuters.
• China's production would still rise this year compared to last, albeit at a slower pace. Its output is about 500,000-600,000 tonnes lower than expected at the start of 2021.
• Meanwhile, Consultancy Mysteel said eight aluminium smelting companies in Guangxi will have to keep their September production at a maximum of 80% of their average monthly output in the first half of the year. That could equate to a reduction in annual operating capacity of 475,000 tonnes, it said.
• The release of 70,000 mt of State Reserve Bureau aluminium ingot reserves will help fill in supply gap to a certain extent in the short term. Market will continue to pay attention to energy consumption control policy, inventory changes and actual demand in the peak season.
• The LME cash aluminium contract was trading at a premium of $15 a tonne to the three-month contract, indicating tightening nearby supplies.
• Exacerbating the tight situation was a large position accounting for 50-80% of available inventories, according to LME data.
PRICES OF COMMODITIES IN LME/ COMEX/ NYMEX (in US $)
COMMODITY EXCHANGE CONTRACT 27.08.21 02.09.21 CHANGE%
ALUMINIUM LME CASH 2673.5 2694.5 0.79
COPPER LME CASH 9352 9347 -0.05
LEAD LME CASH 2459.5 2391.5 -2.76
NICKEL LME CASH 18914 19365 2.38
ZINC LME CASH 2983.5 2987.5 0.13
GOLD COMEX DEC 1795.2 1811.5 0.91
SILVER COMEX SEPT 23.6 23.91 1.31
CRUDE OIL NYMEX SEPT 67.42 69.99 3.81
NATURAL GAS NYMEX OCT 4.211 4.641 10.21
INTERNATIONAL COMMODITY PRICES
Commodity Exchange Contract Unit 27.08.21 02.09.21 Difference (%)
Soybean CBOT NOV Dollars Per Bushel 13.23 12.83 -3.02
Soy oil CBOT DEC Cents per Pound 60.34 58.79 -2.57
CPO BMD NOV MYR per MT 4333.00 4241.00 -2.12
Cotton ICE DEC Cents per Pound 94.84 93.21 -1.72
Source: Reuters
Aluminium prices in MCX(In Rs/kg)
-8.88
-7.16
-4.67
-4.64
-1.95
-1.85
-1.32
-1.12
-0.79
-0.69
0.00
0.15
0.28
0.39
1.59
2.73
-10.00 -8.00 -6.00 -4.00 -2.00 0.00 2.00 4.00
GUAR GUM (JODHPUR)
GUAR SEED (JODHPUR)
CHANA (DELHI)
COTTON SEED OIL CAKE (AKOLA)
JEERA (UNJHA)
TURMERIC (NIZAMABAD)
COTTON (KADI)
REFINED SOYBEAN OIL (MUMBAI)
CRUDE PALM OIL (KANDLA)
BARLEY (JAIPUR)
GUR (MUZAFFARNGR)
WHEAT (DELHI)
PEPPER MALABAR GAR (KOCHI)
CORIANDER (KOTA)
MUSTARD (JAIPUR)
SOYABEAN (INDORE)
CURRENCY
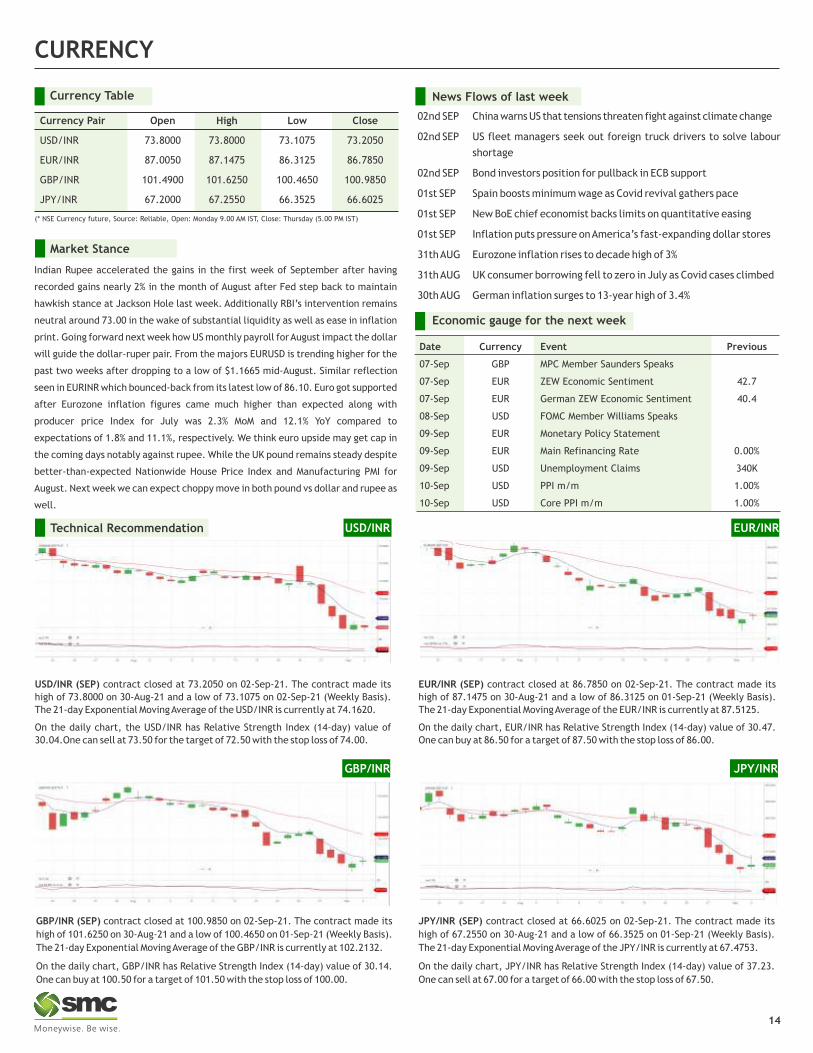
Currency Table
Currency Pair Open High Low Close
USD/INR 73.8000 73.8000 73.1075 73.2050
EUR/INR 87.0050 87.1475 86.3125 86.7850
GBP/INR 101.4900 101.6250 100.4650 100.9850
JPY/INR 67.2000 67.2550 66.3525 66.6025
News Flows of last week
(* NSE Currency future, Source: Reliable, Open: Monday 9.00 AM IST, Close: Thursday (5.00 PM IST)
02nd SEP China warns US that tensions threaten fight against climate change
02nd SEP US fleet managers seek out foreign truck drivers to solve labour
shortage
02nd SEP Bond investors position for pullback in ECB support
01st SEP Spain boosts minimum wage as Covid revival gathers pace
01st SEP New BoE chief economist backs limits on quantitative easing
01st SEP Inflation puts pressure on America’s fast-expanding dollar stores
31th AUG Eurozone inflation rises to decade high of 3%
31th AUG UK consumer borrowing fell to zero in July as Covid cases climbed
30th AUG German inflation surges to 13-year high of 3.4%
Market Stance
Indian Rupee accelerated the gains in the first week of September after having
recorded gains nearly 2% in the month of August after Fed step back to maintain
hawkish stance at Jackson Hole last week. Additionally RBI’s intervention remains
neutral around 73.00 in the wake of substantial liquidity as well as ease in inflation
print. Going forward next week how US monthly payroll for August impact the dollar
will guide the dollar-ruper pair. From the majors EURUSD is trending higher for the
past two weeks after dropping to a low of $1.1665 mid-August. Similar reflection
seen in EURINR which bounced-back from its latest low of 86.10. Euro got supported
after Eurozone inflation figures came much higher than expected along with
producer price Index for July was 2.3% MoM and 12.1% YoY compared to
expectations of 1.8% and 11.1%, respectively. We think euro upside may get cap in
the coming days notably against rupee. While the UK pound remains steady despite
better-than-expected Nationwide House Price Index and Manufacturing PMI for
August. Next week we can expect choppy move in both pound vs dollar and rupee as
well.
14
EUR/INR (SEP) contract closed at 86.7850 on 02-Sep-21. The contract made its
high of 87.1475 on 30-Aug-21 and a low of 86.3125 on 01-Sep-21 (Weekly Basis).
The 21-day Exponential Moving Average of the EUR/INR is currently at 87.5125.
On the daily chart, EUR/INR has Relative Strength Index (14-day) value of 30.47.
One can buy at 86.50 for a target of 87.50 with the stop loss of 86.00.
EUR/INR
USD/INR (SEP) contract closed at 73.2050 on 02-Sep-21. The contract made its
high of 73.8000 on 30-Aug-21 and a low of 73.1075 on 02-Sep-21 (Weekly Basis).
The 21-day Exponential Moving Average of the USD/INR is currently at 74.1620.
On the daily chart, the USD/INR has Relative Strength Index (14-day) value of
30.04.One can sell at 73.50 for the target of 72.50 with the stop loss of 74.00.
USD/INRTechnical Recommendation
GBP/INR (SEP) contract closed at 100.9850 on 02-Sep-21. The contract made its
high of 101.6250 on 30-Aug-21 and a low of 100.4650 on 01-Sep-21 (Weekly Basis).
The 21-day Exponential Moving Average of the GBP/INR is currently at 102.2132.
On the daily chart, GBP/INR has Relative Strength Index (14-day) value of 30.14.
One can buy at 100.50 for a target of 101.50 with the stop loss of 100.00.
GBP/INR
JPY/INR (SEP) contract closed at 66.6025 on 02-Sep-21. The contract made its
high of 67.2550 on 30-Aug-21 and a low of 66.3525 on 01-Sep-21 (Weekly Basis).
The 21-day Exponential Moving Average of the JPY/INR is currently at 67.4753.
On the daily chart, JPY/INR has Relative Strength Index (14-day) value of 37.23.
One can sell at 67.00 for a target of 66.00 with the stop loss of 67.50.
JPY/INR
Economic gauge for the next week
Date Currency Event Previous
07-Sep GBP MPC Member Saunders Speaks
07-Sep EUR ZEW Economic Sentiment 42.7
07-Sep EUR German ZEW Economic Sentiment 40.4
08-Sep USD FOMC Member Williams Speaks
09-Sep EUR Monetary Policy Statement
09-Sep EUR Main Refinancing Rate 0.00%
09-Sep USD Unemployment Claims 340K
10-Sep USD PPI m/m 1.00%
10-Sep USD Core PPI m/m 1.00%
IPOIPOIPOIPO
15
IPO NEWS
Around 18 unicorns to hit street with $11-12 bn IPOs in 2 years: Bofa
According to the industry report, 18 unicorn heavyweights like online education major Byju's, e-commerce giant Flipkart, digital payments leader Paytm, ride-
hailing app Ola, and hotel and room aggregator Oyo planning to tap the IPO market over the next 24 months. Then there are also players like online insurance
retailer Policybazaar, furniture retailer Pepperfry, tech player Inmobi, online grocery delivery player Grofers, payment app Mobikwik, Saas-based solutions
Freshworks, online fashion and apparel brand Nykaa, merchant platform Pinelabs that provides financing and last-mile retail transaction technology; pharma
retailer Pharmeasy, online grocery delivery platform Delhivery; Droom, and Tracxn, among others, are set to hit the market over the next two years. Of these,
Paytm (Rs 16,600 crore issue), Ola (Rs 11,000 crore issue on Monday), Policybazzar (filed for a Rs 6,000 crore IPO), Mobikwik (Rs 1,900 crore issue that opens next
month), and Nykaa (Rs 4,000 crore) have already filed for IPOs earlier this month. The first startup to hit the market was food delivery platform Zomato that had
raised Rs 6,300 crore last month.
MapMyIndia files DRHP with SEBI for IPO
ndian digital mapping firm MapMyIndia filed its DRHP documents on August 31, 2021. The initial public offering (IPO) will see an offer-for-sale up to 7,547,959
equity shares by selling shareholders, according to the draft red herring prospectus (DRHP). The selling shareholders include Rashmi Verma, and investors
Qualcomm and Japanese map maker Zenrin. PhonePe holds 36.11 percent of equity shares on fully diluted basis and Zenrin invests 17.82 percent. Founders
Rashmi and Rakesh Verma hold 17.66 percent and 14.11 percent in fully diluted stories, and Qualcomm's at 8.48 percent. According to the DRHP, the total Indian
addressable market of digital maps and location-based intelligence services is expected to grow to $7.74 billion in 2025 at the CAGR of 15.5 percent CAGR from
2019 to 2025. The company registered Rs 192 crore in revenue for the year ending March 31, 2021, up from Rs 163.5 crore the previous year in FY20. The
company’s profits doubled in FY21 to Rs 59 crore, from Rs 23 crore in FY20. MapMyIndia is one of the few profitable internet companies that are going for IPO.
Other profitable companies that are going for IPO are Nykaa, and CarTrade, which was listed recently. After Zomato’s successful listing in July 2021, other
companies that are looking at IPO include Paytm, PolicyBazaar, and Droom.
Veeda Clinical Research filing for Rs 500 crore - Rs 700 crore IPO
Veeda Clinical Research plans to raise Rs 500-Rs 700 crore from an Initial Public Offering (IPO) and offer for sale (OFS). The Ahmedabad-based Clinical Research
Organisation, backed by private equity investor CX Partners, in June announced that it had raised $16 million from PE firm Sabre Partners and high networth
individuals like Pranab Mody of JB Chemicals, Havells India family office, Nikhil Vora founder of Sixth Sense Ventures and Arjun Bhartia of Jubilant, among others.
Go Airlines gets Sebi nod for Rs 3,600 crore IPO
Budget carrier Go Airlines, which has rebranded itself as 'Go First', has received market regulator Sebi's go-ahead for an initial public offer worth Rs 3,600 crore.
The airline plans to garner up to Rs 3,600 crore through sale of shares, according to the Draft Red Herring Prospectus (DRHP). It also plans to raise up to Rs 1,500
crore by way of a pre-IPO (Initial Public Offer) placement. The carrier, which filed its preliminary papers for the IPO in May, received its observations on August
26, according to Sebi's latest update on processing status of the draft offer documents. The information was updated on August 27 and made public on Monday. In
Sebi parlance, issuance of observations implies its go-ahead for the IPO. In June, Sebi had kept in abeyance the processing of Go Airlines' draft papers for the
initial share sale. From the net IPO proceeds, the airline plans to utilise over Rs 2,015.81 crore towards pre-payment or scheduled repayment of all or a portion of
certain outstanding borrowings, according to the DRHP.
LIC IPO | Govt selects 10 banks including Goldman Sachs, Citigroup to manage share sale
The government has selected 10 investment banks including Goldman Sachs, Citigroup, and SBI Capital Market to handle the initial public offering of Life
Insurance Corp of India. The government expects to raise Rs 80,000 crore-90,000 crore ($11 bln-12.2 bln) from its stake sale in Life Insurance Corp (LIC), as part
of its plans to raise Rs 1.75 lakh crore from a privatisation programme in the current fiscal year ending in March 2022. LIC, India's biggest insurance company with
assets of over 34 trillion rupees ($461.4 billion), has a subsidiary in Singapore and joint ventures in Bahrain, Kenya, Sri Lanka, Nepal, Saudi Arabia, and
Bangladesh. Sixteen banks including seven global banks and nine domestic banks had been in the race to handle the IPO.
ESDS Software plans IPO of up to Rs 1,300 cr
Cloud services and data center firm ESDS Software is likely to raise Rs1200-1300 crore through an initial public offering. The company is expected to file a draft
red herring prospectors (DRHP) with the Securities and Exchange Board of India soon. Founded in 2005 by Piyush Somani, ESDS is into the business of cloud
services, data center services, and product R&D across sectors. In 2015, the company raised $4 million in funding by the Canbank Venture Capital fund, followed
by another round of stake sale in 2018 to South Asia Growth Fund and Global Environment Capital Company LLC. For the year ended March 31, 2020, the company
reported a revenue of Rs 160.5 crore and operating profits of Rs 51.7 crore. Cloud services give companies of any size access to technological capabilities,
previously accessible to large enterprises only. In India, the industry has gained momentum with more than 200 data centers and more than 10 cloud operators
present. The company provides tailored solutions, including Small Industries Development Bank of India, Larsen & Toubro, Tech Mahindra, Vadilal, Symphony,
NTT Data, Tata Capital, and MIDC. The company has built an end-to-end cloud platform and also provides cloud infrastructure as value addition. In the recent
budget, the Government of India allocated $7.3 bn to the IT and telecom sector and provided tax holidays to the IT sector for Software Technology Parks of India
and Special Economic Zones. The push towards cloud services has boosted hyper-scale data center investments, with global assets estimated US$ 200 billion
annually by 2025.
*Closing price as on 02-09-2021
IPO TRACKER
Company Sector M.Cap (In Rs Cr.) Issue Size (in Rs Cr.) List Date Issue Price List Price Last Price %Gain/Loss*
Aptus Value Housing Finance India Ltd Housing Finance 18418.25 2780.05 24-Aug-21 353.00 330.00 366.85 3.92
Chemplast Sanmar Limited Specialty chemical 9581.44 3850.00 24-Aug-21 541.00 525.00 615.60 13.79
Nuvoco Vistas Corporation Ltd Cement 20011.46 5000.00 23-Aug-21 570.00 471.00 563.90 -1.07
CarTrade Tech Limited Auto platform 6691.54 2998.51 20-Aug-21 1618.00 1600.00 1456.70 -9.97
Krsnaa Diagnostics Limited Diagnostic 932.40 1213.33 16-Aug-21 954.00 1025.00 932.40 -2.26
Devyani International Limited Quick-service restaurants 15223.95 1838.00 16-Aug-21 90.00 141.00 124.70 38.56
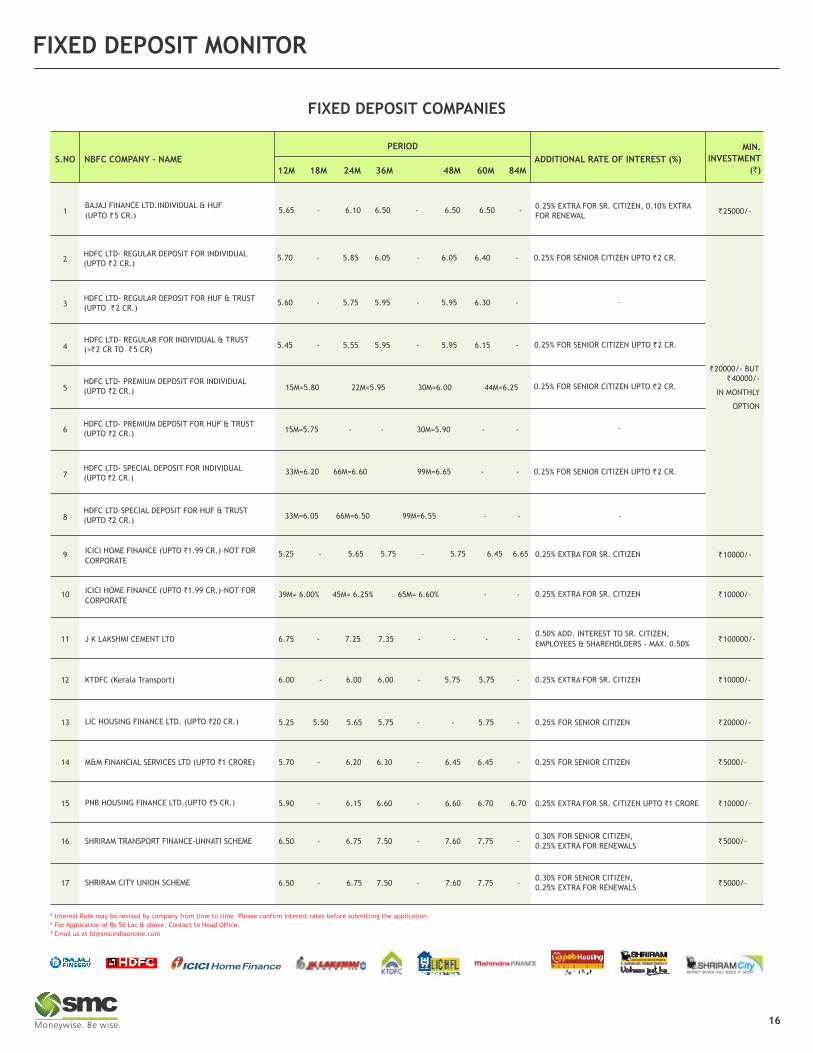
FIXED DEPOSIT MONITOR
16
FIXED DEPOSIT COMPANIES
12M 18M 24M 36M 48M 60M 84M
PERIOD
ADDITIONAL RATE OF INTEREST (%)
MIN.
INVESTMENT
(`)NBFC COMPANY - NAME S.NO
` 20000/- BUT` 40000/-
IN MONTHLY
OPTION
HDFC LTD- SPECIAL DEPOSIT FOR INDIVIDUAL(UPTO `2 CR.)
0.25% FOR SENIOR CITIZEN UPTO ` 2 CR.33M=6.20 66M=6.60 99M=6.65 - -
33M=6.05 66M=6.50 99M=6.55 - - -
39M= 6.00% 45M= 6.25% 65M= 6.60% - -ICICI HOME FINANCE (UPTO `1.99 CR.)-NOT FOR
CORPORATE
6.75 - 7.25 7.35 - - - -J K LAKSHMI CEMENT LTD ` 100000/-0.50% ADD. INTEREST TO SR. CITIZEN,
EMPLOYEES & SHAREHOLDERS - MAX. 0.50%
LIC HOUSING FINANCE LTD. (UPTO `20 CR.) 5.25 5.50 5.65 5.75 - - 5.75 - ` 20000/-0.25% FOR SENIOR CITIZEN
6.50 - 6.75 7.50 - 7.60 7.75 -SHRIRAM TRANSPORT FINANCE-UNNATI SCHEME ` 5000/-0.30% FOR SENIOR CITIZEN,0.25% EXTRA FOR RENEWALS
6.50 - 6.75 7.50 - 7.60 7.75 -SHRIRAM CITY UNION SCHEME ` 5000/-0.30% FOR SENIOR CITIZEN,0.25% EXTRA FOR RENEWALS
HDFC LTD- REGULAR DEPOSIT FOR INDIVIDUAL(UPTO ` 2 CR.)
0.25% FOR SENIOR CITIZEN UPTO ` 2 CR.5.70 - 5.85 6.05 - 6.05 6.40 -
6.00 - 6.00 6.00 - 5.75 5.75 -KTDFC (Kerala Transport) ` 10000/-
HDFC LTD- PREMIUM DEPOSIT FOR HUF & TRUST(UPTO `2 CR.)
-15M=5.75 - - 30M=5.90 - -
0.25% EXTRA FOR SR. CITIZEN5.25 - 5.65 5.75 - 5.75 6.45 6.65
` 5000/-M&M FINANCIAL SERVICES LTD (UPTO `1 CRORE) 0.25% FOR SENIOR CITIZEN
0.25% EXTRA FOR SR. CITIZEN, 0.10% EXTRAFOR RENEWAL
BAJAJ FINANCE LTD.INDIVIDUAL & HUF
(UPTO ` 5 CR.)` 25000/-5.65 - 6.10 6.50 - 6.50 6.50 -
HDFC LTD- REGULAR FOR INDIVIDUAL & TRUST(>` 2 CR TO ` 5 CR)
0.25% FOR SENIOR CITIZEN UPTO ` 2 CR.
15M=5.80 22M=5.95 30M=6.00 44M=6.25
` 10000/-
HDFC LTD- REGULAR DEPOSIT FOR HUF & TRUST(UPTO ` 2 CR.)
-5.60 - 5.75 5.95 - 5.95 6.30 -
HDFC LTD- PREMIUM DEPOSIT FOR INDIVIDUAL(UPTO `2 CR.)
0.25% FOR SENIOR CITIZEN UPTO ` 2 CR.
5.70 - 6.20 6.30 - 6.45 6.45 -
* Interest Rate may be revised by company from time to time. Please confirm Interest rates before submitting the application.
* For Application of Rs.50 Lac & above, Contact to Head Office.
* Email us at [email protected]
1
2
3
4
5
6
7
8
9
10
11
12
13
14
16
17
` 10000/-PNB HOUSING FINANCE LTD.(UPTO `5 CR.) 0.25% EXTRA FOR SR. CITIZEN UPTO `1 CRORE5.90 - 6.15 6.60 - 6.60 6.70 6.7015
5.45 - 5.55 5.95 - 5.95 6.15 -
HDFC LTD-SPECIAL DEPOSIT FOR HUF & TRUST(UPTO `2 CR.)
0.25% EXTRA FOR SR. CITIZEN ` 10000/-
0.25% EXTRA FOR SR. CITIZEN
ICICI HOME FINANCE (UPTO `1.99 CR.)-NOT FOR
CORPORATE
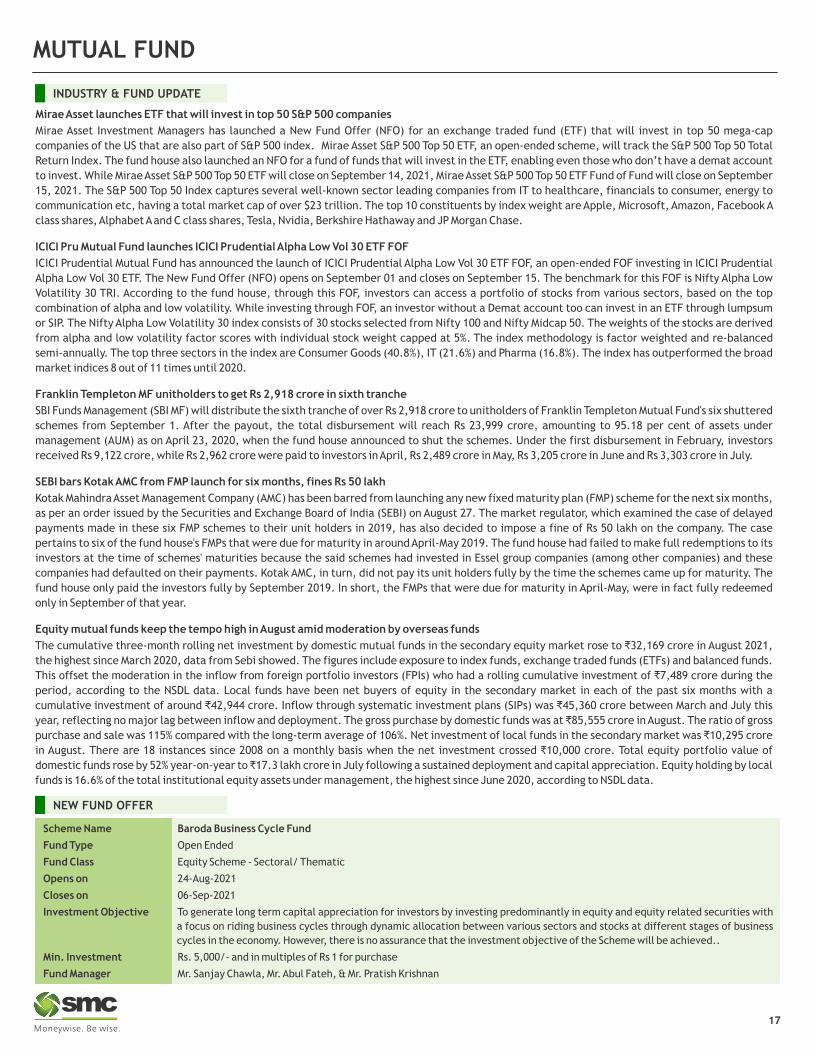
Mirae Asset launches ETF that will invest in top 50 S&P 500 companies
Mirae Asset Investment Managers has launched a New Fund Offer (NFO) for an exchange traded fund (ETF) that will invest in top 50 mega-cap
companies of the US that are also part of S&P 500 index. Mirae Asset S&P 500 Top 50 ETF, an open-ended scheme, will track the S&P 500 Top 50 Total
Return Index. The fund house also launched an NFO for a fund of funds that will invest in the ETF, enabling even those who don’t have a demat account
to invest. While Mirae Asset S&P 500 Top 50 ETF will close on September 14, 2021, Mirae Asset S&P 500 Top 50 ETF Fund of Fund will close on September
15, 2021. The S&P 500 Top 50 Index captures several well-known sector leading companies from IT to healthcare, financials to consumer, energy to
communication etc, having a total market cap of over $23 trillion. The top 10 constituents by index weight are Apple, Microsoft, Amazon, Facebook A
class shares, Alphabet A and C class shares, Tesla, Nvidia, Berkshire Hathaway and JP Morgan Chase.
ICICI Pru Mutual Fund launches ICICI Prudential Alpha Low Vol 30 ETF FOF
ICICI Prudential Mutual Fund has announced the launch of ICICI Prudential Alpha Low Vol 30 ETF FOF, an open-ended FOF investing in ICICI Prudential
Alpha Low Vol 30 ETF. The New Fund Offer (NFO) opens on September 01 and closes on September 15. The benchmark for this FOF is Nifty Alpha Low
Volatility 30 TRI. According to the fund house, through this FOF, investors can access a portfolio of stocks from various sectors, based on the top
combination of alpha and low volatility. While investing through FOF, an investor without a Demat account too can invest in an ETF through lumpsum
or SIP. The Nifty Alpha Low Volatility 30 index consists of 30 stocks selected from Nifty 100 and Nifty Midcap 50. The weights of the stocks are derived
from alpha and low volatility factor scores with individual stock weight capped at 5%. The index methodology is factor weighted and re-balanced
semi-annually. The top three sectors in the index are Consumer Goods (40.8%), IT (21.6%) and Pharma (16.8%). The index has outperformed the broad
market indices 8 out of 11 times until 2020.
Franklin Templeton MF unitholders to get Rs 2,918 crore in sixth tranche
SBI Funds Management (SBI MF) will distribute the sixth tranche of over Rs 2,918 crore to unitholders of Franklin Templeton Mutual Fund's six shuttered
schemes from September 1. After the payout, the total disbursement will reach Rs 23,999 crore, amounting to 95.18 per cent of assets under
management (AUM) as on April 23, 2020, when the fund house announced to shut the schemes. Under the first disbursement in February, investors
received Rs 9,122 crore, while Rs 2,962 crore were paid to investors in April, Rs 2,489 crore in May, Rs 3,205 crore in June and Rs 3,303 crore in July.
SEBI bars Kotak AMC from FMP launch for six months, fines Rs 50 lakh
Kotak Mahindra Asset Management Company (AMC) has been barred from launching any new fixed maturity plan (FMP) scheme for the next six months,
as per an order issued by the Securities and Exchange Board of India (SEBI) on August 27. The market regulator, which examined the case of delayed
payments made in these six FMP schemes to their unit holders in 2019, has also decided to impose a fine of Rs 50 lakh on the company. The case
pertains to six of the fund house's FMPs that were due for maturity in around April-May 2019. The fund house had failed to make full redemptions to its
investors at the time of schemes' maturities because the said schemes had invested in Essel group companies (among other companies) and these
companies had defaulted on their payments. Kotak AMC, in turn, did not pay its unit holders fully by the time the schemes came up for maturity. The
fund house only paid the investors fully by September 2019. In short, the FMPs that were due for maturity in April-May, were in fact fully redeemed
only in September of that year.
Equity mutual funds keep the tempo high in August amid moderation by overseas funds
The cumulative three-month rolling net investment by domestic mutual funds in the secondary equity market rose to ₹32,169 crore in August 2021,
the highest since March 2020, data from Sebi showed. The figures include exposure to index funds, exchange traded funds (ETFs) and balanced funds.
This offset the moderation in the inflow from foreign portfolio investors (FPIs) who had a rolling cumulative investment of ₹7,489 crore during the
period, according to the NSDL data. Local funds have been net buyers of equity in the secondary market in each of the past six months with a
cumulative investment of around ₹42,944 crore. Inflow through systematic investment plans (SIPs) was ₹45,360 crore between March and July this
year, reflecting no major lag between inflow and deployment. The gross purchase by domestic funds was at ₹85,555 crore in August. The ratio of gross
purchase and sale was 115% compared with the long-term average of 106%. Net investment of local funds in the secondary market was ₹10,295 crore
in August. There are 18 instances since 2008 on a monthly basis when the net investment crossed ₹10,000 crore. Total equity portfolio value of
domestic funds rose by 52% year-on-year to ₹17.3 lakh crore in July following a sustained deployment and capital appreciation. Equity holding by local
funds is 16.6% of the total institutional equity assets under management, the highest since June 2020, according to NSDL data.
INDUSTRY & FUND UPDATE
MUTUAL FUND
17
NEW FUND OFFER
Scheme Name Baroda Business Cycle Fund
Fund Type Open Ended
Fund Class Equity Scheme - Sectoral/ Thematic
Opens on 24-Aug-2021
Closes on 06-Sep-2021
Investment Objective To generate long term capital appreciation for investors by investing predominantly in equity and equity related securities with
a focus on riding business cycles through dynamic allocation between various sectors and stocks at different stages of business
cycles in the economy. However, there is no assurance that the investment objective of the Scheme will be achieved..
Min. Investment Rs. 5,000/- and in multiples of Rs 1 for purchase
Fund Manager Mr. Sanjay Chawla, Mr. Abul Fateh, & Mr. Pratish Krishnan
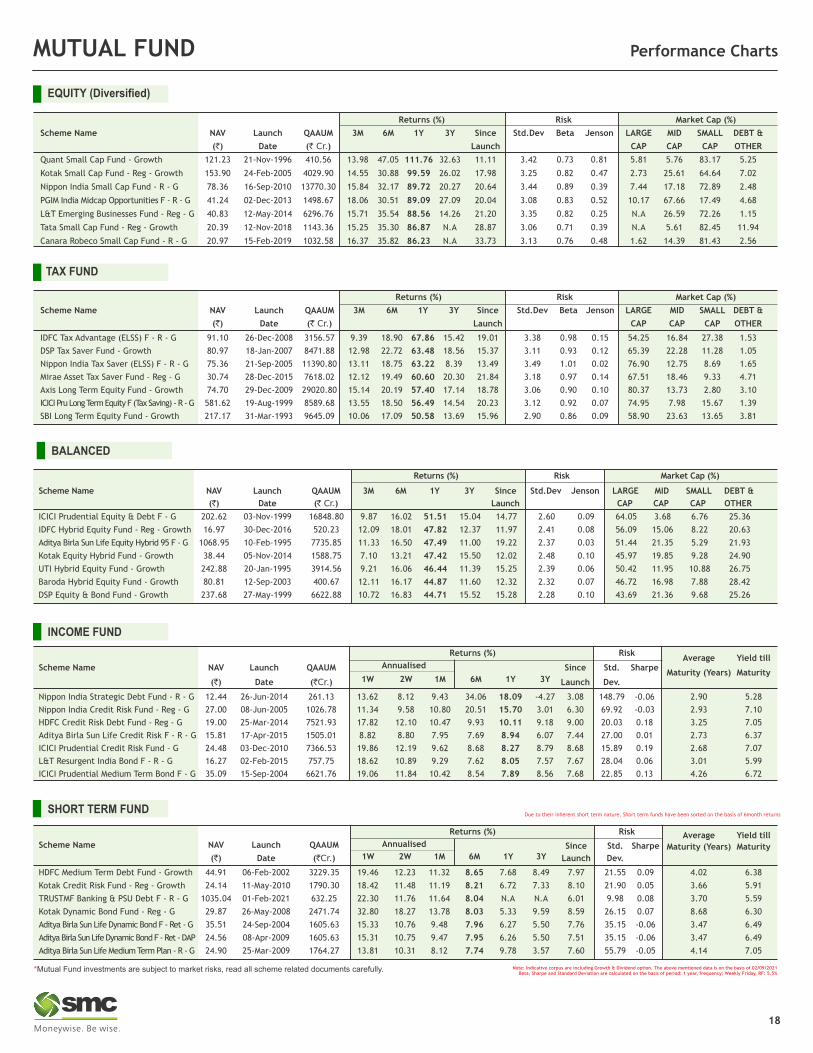
Note: Indicative corpus are including Growth & Dividend option . The above mentioned data is on the basis of 02/09/2021Beta, Sharpe and Standard Deviation are calculated on the basis of period: 1 year, frequency: Weekly Friday, RF: 5.5%
MUTUAL FUND Performance Charts
TAX FUND
EQUITY (Diversified)
INCOME FUND
SHORT TERM FUNDDue to their inherent short term nature, Short term funds have been sorted on the basis of 6month returns
BALANCED
Returns (%) Risk Average Yield till Scheme Name NAV Launch QAAUM Since Std. Sharpe
1W 2W 1M 6M 1Y 3YMaturity (Years) Maturity
(`) Date (`Cr.) Launch Dev.
HDFC Medium Term Debt Fund - Growth 44.91 06-Feb-2002 3229.35 19.46 12.23 11.32 8.65 7.68 8.49 7.97 21.55 0.09 4.02 6.38
Kotak Credit Risk Fund - Reg - Growth 24.14 11-May-2010 1790.30 18.42 11.48 11.19 8.21 6.72 7.33 8.10 21.90 0.05 3.66 5.91
TRUSTMF Banking & PSU Debt F - R - G 1035.04 01-Feb-2021 632.25 22.30 11.76 11.64 8.04 N.A N.A 6.01 9.98 0.08 3.70 5.59
Kotak Dynamic Bond Fund - Reg - G 29.87 26-May-2008 2471.74 32.80 18.27 13.78 8.03 5.33 9.59 8.59 26.15 0.07 8.68 6.30
Aditya Birla Sun Life Dynamic Bond F - Ret - G 35.51 24-Sep-2004 1605.63 15.33 10.76 9.48 7.96 6.27 5.50 7.76 35.15 -0.06 3.47 6.49
Aditya Birla Sun Life Dynamic Bond F - Ret - DAP 24.56 08-Apr-2009 1605.63 15.31 10.75 9.47 7.95 6.26 5.50 7.51 35.15 -0.06 3.47 6.49
Aditya Birla Sun Life Medium Term Plan - R - G 24.90 25-Mar-2009 1764.27 13.81 10.31 8.12 7.74 9.78 3.57 7.60 55.79 -0.05 4.14 7.05
Annualised
Annualised
Returns (%) RiskAverage Yield till
Scheme Name NAV Launch QAAUM Since Std. Sharpe
1W 2W 1M 6M 1Y 3YMaturity (Years) Maturity
(`) Date (`Cr.) Launch Dev.
Nippon India Strategic Debt Fund - R - G 12.44 26-Jun-2014 261.13 13.62 8.12 9.43 34.06 18.09 -4.27 3.08 148.79 -0.06 2.90 5.28
Nippon India Credit Risk Fund - Reg - G 27.00 08-Jun-2005 1026.78 11.34 9.58 10.80 20.51 15.70 3.01 6.30 69.92 -0.03 2.93 7.10
HDFC Credit Risk Debt Fund - Reg - G 19.00 25-Mar-2014 7521.93 17.82 12.10 10.47 9.93 10.11 9.18 9.00 20.03 0.18 3.25 7.05
Aditya Birla Sun Life Credit Risk F - R - G 15.81 17-Apr-2015 1505.01 8.82 8.80 7.95 7.69 8.94 6.07 7.44 27.00 0.01 2.73 6.37
ICICI Prudential Credit Risk Fund - G 24.48 03-Dec-2010 7366.53 19.86 12.19 9.62 8.68 8.27 8.79 8.68 15.89 0.19 2.68 7.07
L&T Resurgent India Bond F - R - G 16.27 02-Feb-2015 757.75 18.62 10.89 9.29 7.62 8.05 7.57 7.67 28.04 0.06 3.01 5.99
ICICI Prudential Medium Term Bond F - G 35.09 15-Sep-2004 6621.76 19.06 11.84 10.42 8.54 7.89 8.56 7.68 22.85 0.13 4.26 6.72
Returns (%) Risk Market Cap (%)
Scheme Name NAV Launch QAAUM 3M 6M 1Y 3Y Since Std.Dev Jenson LARGE MID SMALL DEBT &
(`) Date (` Cr.) Launch CAP CAP CAP OTHER
ICICI Prudential Equity & Debt F - G 202.62 03-Nov-1999 16848.80 9.87 16.02 51.51 15.04 14.77 2.60 0.09 64.05 3.68 6.76 25.36
IDFC Hybrid Equity Fund - Reg - Growth 16.97 30-Dec-2016 520.23 12.09 18.01 47.82 12.37 11.97 2.41 0.08 56.09 15.06 8.22 20.63
Aditya Birla Sun Life Equity Hybrid 95 F - G 1068.95 10-Feb-1995 7735.85 11.33 16.50 47.49 11.00 19.22 2.37 0.03 51.44 21.35 5.29 21.93
Kotak Equity Hybrid Fund - Growth 38.44 05-Nov-2014 1588.75 7.10 13.21 47.42 15.50 12.02 2.48 0.10 45.97 19.85 9.28 24.90
UTI Hybrid Equity Fund - Growth 242.88 20-Jan-1995 3914.56 9.21 16.06 46.44 11.39 15.25 2.39 0.06 50.42 11.95 10.88 26.75
Baroda Hybrid Equity Fund - Growth 80.81 12-Sep-2003 400.67 12.11 16.17 44.87 11.60 12.32 2.32 0.07 46.72 16.98 7.88 28.42
DSP Equity & Bond Fund - Growth 237.68 27-May-1999 6622.88 10.72 16.83 44.71 15.52 15.28 2.28 0.10 43.69 21.36 9.68 25.26
Returns (%) Risk Market Cap (%)
Scheme Name NAV Launch QAAUM 3M 6M 1Y 3Y Since Std.Dev Beta Jenson LARGE MID SMALL DEBT &
(`) Date (` Cr.) Launch CAP CAP CAP OTHER
IDFC Tax Advantage (ELSS) F - R - G 91.10 26-Dec-2008 3156.57 9.39 18.90 67.86 15.42 19.01 3.38 0.98 0.15 54.25 16.84 27.38 1.53
DSP Tax Saver Fund - Growth 80.97 18-Jan-2007 8471.88 12.98 22.72 63.48 18.56 15.37 3.11 0.93 0.12 65.39 22.28 11.28 1.05
Nippon India Tax Saver (ELSS) F - R - G 75.36 21-Sep-2005 11390.80 13.11 18.75 63.22 8.39 13.49 3.49 1.01 0.02 76.90 12.75 8.69 1.65
Mirae Asset Tax Saver Fund - Reg - G 30.74 28-Dec-2015 7618.02 12.12 19.49 60.60 20.30 21.84 3.18 0.97 0.14 67.51 18.46 9.33 4.71
Axis Long Term Equity Fund - Growth 74.70 29-Dec-2009 29020.80 15.14 20.19 57.40 17.14 18.78 3.06 0.90 0.10 80.37 13.73 2.80 3.10
ICICI Pru Long Term Equity F (Tax Saving) - R - G 581.62 19-Aug-1999 8589.68 13.55 18.50 56.49 14.54 20.23 3.12 0.92 0.07 74.95 7.98 15.67 1.39
SBI Long Term Equity Fund - Growth 217.17 31-Mar-1993 9645.09 10.06 17.09 50.58 13.69 15.96 2.90 0.86 0.09 58.90 23.63 13.65 3.81
Returns (%) Risk Market Cap (%)
Scheme Name NAV Launch QAAUM 3M 6M 1Y 3Y Since Std.Dev Beta Jenson LARGE MID SMALL DEBT &
(`) Date (` Cr.) Launch CAP CAP CAP OTHER
Quant Small Cap Fund - Growth 121.23 21-Nov-1996 410.56 13.98 47.05 111.76 32.63 11.11 3.42 0.73 0.81 5.81 5.76 83.17 5.25
Kotak Small Cap Fund - Reg - Growth 153.90 24-Feb-2005 4029.90 14.55 30.88 99.59 26.02 17.98 3.25 0.82 0.47 2.73 25.61 64.64 7.02
Nippon India Small Cap Fund - R - G 78.36 16-Sep-2010 13770.30 15.84 32.17 89.72 20.27 20.64 3.44 0.89 0.39 7.44 17.18 72.89 2.48
PGIM India Midcap Opportunities F - R - G 41.24 02-Dec-2013 1498.67 18.06 30.51 89.09 27.09 20.04 3.08 0.83 0.52 10.17 67.66 17.49 4.68
L&T Emerging Businesses Fund - Reg - G 40.83 12-May-2014 6296.76 15.71 35.54 88.56 14.26 21.20 3.35 0.82 0.25 N.A 26.59 72.26 1.15
Tata Small Cap Fund - Reg - Growth 20.39 12-Nov-2018 1143.36 15.25 35.30 86.87 N.A 28.87 3.06 0.71 0.39 N.A 5.61 82.45 11.94
Canara Robeco Small Cap Fund - R - G 20.97 15-Feb-2019 1032.58 16.37 35.82 86.23 N.A 33.73 3.13 0.76 0.48 1.62 14.39 81.43 2.56
18
*Mutual Fund investments are subject to market risks, read all scheme related documents carefully.