Embed Size (px)
Citation preview

Abstract— The Department of Public Works and Highways
(DPWH) Cagayan de Oro District 1 and 2 is one of the regional
offices of the DPWH that responsible for all the projects in the field
of public works, maintenance of the city road network and irrigation
system. The office is also responsible for implementing
transparency on its project information through released and
accessed by the public. However, most of the accomplished and
on-going road projects information is not highly available and not
easy to navigate in the current website.
Considering many road projects information requires it to be
reliable, updated, relevant and easily accessible. A web-based
geographical system as new approach is introduced in this study.
The purpose of this study is to design and develop a program
application that could provide information about the road projects in
a more detailed and informative way that can be easily accessed by
the public.
Usability test was used to evaluation the application. Based on
the results, the visual clarity, consistency, and effectiveness of the
project are rated as excellent. The information is presented in clearer
and more satisfying view.
Index Terms— DPWH, Road projects, web-based, web mapping
I. INTRODUCTION
Roads and Highways are cornerstones of any nation’s
infrastructure. For centuries, roads and highways have carried
people, goods and ideas from one corner of the earth to
another. Roads are identifiable routes or paths between two or
more places. They are typically smoothed, paved, or
otherwise prepared to allow easy travel. Historically, many
roads were simply recognizable routes without any formal
construction or maintenance [1]. It is the responsibility of the
designated executive department of the government to build
and maintain quality roads and highways, maximizing public
convenience [2].
The Department of Public Works and Highways is the
executive department of the Philippine government
responsible for all the projects in the field of public works. It
is responsible for the maintenance of the Philippine road
network and irrigation system. DPWH is also responsible for
collecting, storing, retrieving, managing, analyzing and
presenting the data to the public.
Manuscript received December 11, 2014. This work was supported in
part by the DPWH District 1 and 2 Cagayan de Oro, Philippines.
J. A. Landicho is a faculty member in the Department of Information
Technology in Mindanao University of Science and Technology
(MUST),Cagayan de Oro City, Philippines (e-mail:
Many development projects have serious dependence on
transport network. Authentic information on the transport
infrastructure is fundamental requirement for many decision
making process [3]. Therefore information requires it to be
reliable, updated, relevant and easily accessible. This demand
for information requires new approaches in which data related
to transportation network should be identified, collected,
stored, retrieved, managed, analyzed, communicated and
presented. Considering the complexities in developing,
updating and processing of the transport related data, there is
an urgent need to adopt new concepts and technologies for
designing and developing the information resource
management of transport infrastructure in the city[4][5].
Therefore, the development in the field of information
technology is especially relevant to the field of transportation
engineering.
Web mapping is the process of using maps delivered by
geographical information systems. The locations can be
express in many different ways, such as latitude and
longitude, address, or ZIP code. Many different types of
information can be compared and contrasted [6]. Web
Mapping clearly promises many great benefits to DPWH and
to its functionality. Web mapping can be a great help in its aim
to inform the citizens about their road projects as well as to
build positive relations with the citizens it is serving [7].
Here in Cagayan de Oro, the DPWH consists of two
districts. The 1st District office is located at RES Compound,
Barangay Bulua while the 2nd District is at Barangay Puntod.
The first district’s area of responsibility starts from the roads
of Barangay Iponan to the Cagayan de Oro River while the
second district starts from the Cagayan de Oro River to Syre
Highway.
II. METHODOLOGY
2.1 Designing the graphical user interface
2.1.1 Website Architecture and Design
The first step during the creation of the website is
performing a research. Getting an understanding of the client's
needs and others through thorough examination and
brainstorming to learn more about the subject that is to be
expose on the site is the first thing to do. There is a need to a
keen gathering of information as much as possible to help
develop an outline for the site and also for its design when
meeting with the client. This includes asking about the target
audience, goals, creative direction and other variables that
A Web-Based Geographical Road Project Monitoring and
Information System for the Department of Public Works
and Highways - Cagayan De Oro District, Philippines
Junar A. Landicho, MIT
2014 International Conference on Informatics and Advanced Computing (ICIAC-14) Dec. 30-31, 2014 Bangkok, Thailand
http://dx.doi.org/10.15242/IAE.IAE1214015 27

may affect what they can offer to the client. Performing some
industry or market research is most likely done before and
after gathering information from the client. This is as simple
as looking to see what other websites in the field look like to
in-depth research with focus groups. Figure 1 above is what
has been come up.
2.1.2 Database Design
Fig. 1.Website Architectural Structure
2.1.2.1 Entity Relationship Diagram
After gathering enough information for the database, the
entities is then identify for the database designing and classify
for its relationships. Throughout the long process of making
lists, creating tables and normalizing, Figure 2 have come up
with a design that best suits to the system they develop.
Figure 2. ERD Model of the System
2.1.3 The Map
On today’s Web, using map is a common feature. They
are used to see the location of things, to search for the position
of an address, to get driving directions, and to do numerous
other things. The proposed system is design in a completely
modular and open way, and allowing for the incorporation of
alternative data sources and software implementations for
future development. Embedding a map to the system adds to
the design development and also meets the desired
functionality of the system [8]
2.2 Developing the web-based graphical user interface
and the geographical map of Cagayan de Oro City
The primary decision is what should be the underlying
structure of the site, which determines the software to be use
and what system will make the site “work.” The following are
the software use:
a. HTML5. This language is use because of its
cross-browser support. The language also has the ability to
deliver everything from animation to graphics. As more and
more elements got adopted more and more companies start to
develop in HTML5.
b. CSS3. This style sheet language is use for the site’s
stylish design. It also offers browser compatibility that makes
the designing faster and easier.
c. jQuery. This cross-platform JavaScript library is utilize
because it makes things like HTML document traversal and
manipulation, event handling and animation much simpler
with an easy-to-use API that works across a multitude of
browsers. It is versatile and extensible.
d. JavaScript (JS). It is use for map manipulation. It is
mainly use for creating polylines, markers and other overlays
to fully utilize the map.
2.2.1 Framework
In developing the system, framework use to add system
functionalities as well as improving the design. Codeigniter, a
proven agile and open source PHP web application
framework is use because it offers a good code separation and
keep things clean. This organizes codes and keeps them in
track. With Codeigniter, understanding and changing the
behavior of the existing libraries is easy. It also permits the
web pages to contain minimal scripting since the
presentations separates from the PHP scripting. It is base on
the Model-View-Controller development pattern. MVC is a
software approach that separates application logic from
presentation.
2.2.2 Database development
MySQL database system is used because it is open source.
It is widely available in the market with no ownership cost and
is also easy to learn and operate. It also contains APIs
integration with PHP and easily connects with different
development platforms. Lastly, the MySQL is secure as all
access passwords are stored in an encrypted format restricting
any unauthorized access to the system.
2.2.3 Embedding the Map
There are several mapping solutions including Yahoo
Maps and Bing Maps, but the most popular one is Google
Maps [9]. In order to add a Google map to the site, there is a
need register to have a Google Account to get a Google Maps
API key. This allows embedding of the maps into their web
pages with the terms and services[10].
2.2.4 Project Testing
As the developing of the system progresses, several units
testing are necessary. Performing unit tests is to ensure that
the system’s need to be changed in the future can be deal with
in predictable ways without causing unexpected side effects.
Unit testing is a check against the programmers themselves
2014 International Conference on Informatics and Advanced Computing (ICIAC-14) Dec. 30-31, 2014 Bangkok, Thailand
http://dx.doi.org/10.15242/IAE.IAE1214015 28
inadvertently wreaking havoc when trying to modify system
behavior. Unit testing gives a bit more confidence in the
overall system stability.
2.3 Implementation of the web-based geographical road
project monitoring and information system.
During the implementation process, the system together
with the main system of the DPWH simultaneously runs. This
parallel operation is done so that if the new system does not
work correctly, the DPWH can still use the old system as a
backup. This is made until the users, management and the IT
personnel are satisfied with the function of the new system
and see that it is completely utilizable.
2.4 To evaluate the web-based geographical road project
monitoring and information system.
Performing an evaluation process assesses the performance
of the website after the implementation. This process helps
the researchers determine whether the site is effective or not.
III. RESULTS AND DISCUSSION
3.1 System Screenshots
The Figure 5 below shows the login page of the
administrator. The 1st and 2
nd District of DPWH Cagayan de
Oro City have different administrator and they can only add
and update projects according to which district they log in.
Once the admin is logged in the system, he can now add and
update projects and contractors. He can also update and view
the map. Figure 6 shows the administrator profile and menus
that admin can access. This area is where manipulation of
information that the public viewer sees on the main page.
Adding and updating project is essential in the department’s
transparency of the project status. Figure 7 shows the adding
section of the project which is to be done by the administrator.
After adding all the project information it will then be
registered on the database and those info will then be
retrieved for the viewer to see the newly added project. When
the admin updates, the same process occurs.
In order for the viewer to visualize the data clearly, getting the
main information from the database to be displayed on the
table is done. Figures 8 show the said results. Base on the
results it is clearer if the data are categorized according to
what project category it belongs.
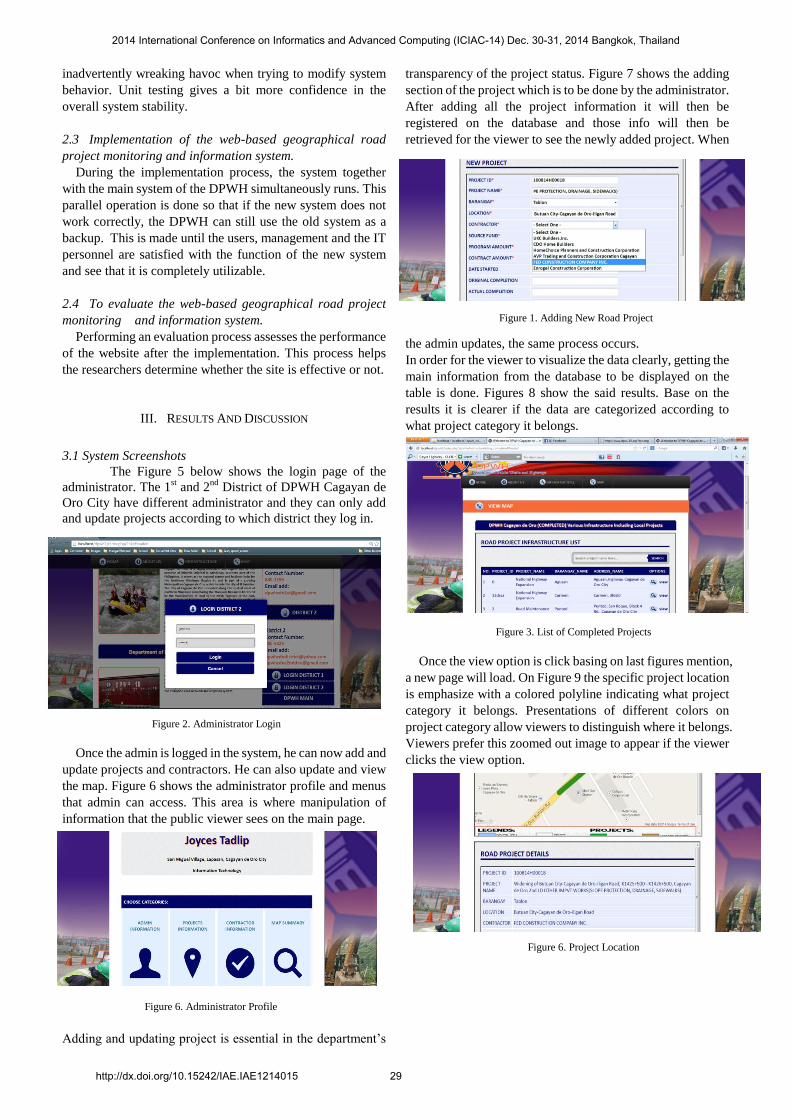
Once the view option is click basing on last figures mention,
a new page will load. On Figure 9 the specific project location
is emphasize with a colored polyline indicating what project
category it belongs. Presentations of different colors on
project category allow viewers to distinguish where it belongs.
Viewers prefer this zoomed out image to appear if the viewer
clicks the view option.
Figure 2. Administrator Login
Figure 6. Administrator Profile
Figure 1. Adding New Road Project
Figure 3. List of Completed Projects
Figure 6. Project Location
2014 International Conference on Informatics and Advanced Computing (ICIAC-14) Dec. 30-31, 2014 Bangkok, Thailand
http://dx.doi.org/10.15242/IAE.IAE1214015 29

3.2 Evaluation Results
The following graphs show the results of the evaluation
from the public users. There are 20 respondents who evaluate
the system.
The results assess the performance of the website being
implemented. Figure 11 shows the evaluation results. The
first criterion deals with the visual clarity which discusses
about the organization of the site from the user's perspective.
The findings show that data is truly quick and easy basing on
the average rating at 4.75. Necessary animations display in
fact fit the site according to the 4.9 very good rating of the
respondents. When it comes to the sites’ design respondents’
average rating is 4.5. A clear presentation of the data it is at
4.85 rating.
With all of these results the system achieves a very good
rating which means that public users agree that it coincide the
visual clarity criterion. Figure 12 shows all the said results.
Rating Scale: 1 poor 2 fair 3 good 4 very good 5 excellent
Figure 11. Public Evaluation for Visual Clarity
At Figure 13 the second criterion which deals with the
consistency of navigating different pages of the site which
must reflect to the homepage is seen. When navigating the
site, consistency and uniformity are the things that user
considers so respondents’ rate it as 4.75. Icons are
understandable basing on the 4.75 rate of the respondents.
Basing on the 4.85 mark, links labelled with certain texts
provide a vivid indication where they are leading to. The data
from the table in fact corresponds to the data displayed on the
map base on the computed average at 4.65. The convenience
in navigating from pages is achieved basing on the 4.45
evaluation of the respondents. To sum it all, basing from this
criterion the system attains a very good rating indicating that
respondents agree to its consistency from each page when
users access it. The conformity in the application of
something, typically that which is necessary for the sake of
logic, accuracy, or fairness is accomplish.
Figure 12.Public Evaluation for Consistency
In Figure 13 tells the results from the evaluation that tackles
about the effectiveness of the system. With the system’s
capacity it facilitates the department’s growth and
development which marks as 4.33. Execution of the tasks is
correctly done, this conclusion is according to the 4.5 admin
evaluation. The projects’ locations are precisely displayed as
what the 4.17 average results illustrate. 4.33 average results
demonstrate that it is very effective to use map on displaying
projects for the public’s awareness. The given information on
the map was very necessary based on the 4.33 result. The
usefulness of the site is at 4.5 rating. The effectiveness on
using map on the project monitoring of the department really
helps according to the 4.33 average rating. Effectiveness
issues are solved and it is prove that with the systems’ help,
the DPWH will surely improve their public service.
Figure 13. Public’s Evaluation for Effectiveness
IV. CONCLUSION
In the past, the DPWH road projects information is not well
presented or displayed. Specific project location is not
available as well as the basic information needed by the
public.
Through the map, the viewer can easily locate the location of
the road projects. It is clearly proven that with aid of the
system the data displayed truly match the data being displayed
on the map from 4.65 public rating and 4.33 admin rating.
They can easily access its information and details. It is more
convenient than the main website and the bulletin board
posted outside the department’s compound. The aim to a
vivid display of data is certainly attain.
The user interface is not easy to navigate. With the
Web-based Geographical Road Projects Monitoring and
Information System, the information presents in an organized
tabular form together with a map that presents a clearer and
more satisfying view. A very good visual comprehensive
presentation of the data achieves as 4.85 public' viewer mark
and at 4.67 admin' mark.
Only the administrator can edit and update the data so that the
information presented will secure and cannot be easily alter or
delete. It is easy to navigate. The map is dynamic and
connected to the database so it can store a lot of data that the
admin can update from time to time. With the results given
public viewer marks 4.75 and admin at 4.33, users mostly
agree that the study reach its goal to improve the public's
2014 International Conference on Informatics and Advanced Computing (ICIAC-14) Dec. 30-31, 2014 Bangkok, Thailand
http://dx.doi.org/10.15242/IAE.IAE1214015 30
awareness while facilitating the department's capacity for
growth and development. While targeting the effectiveness of
the system to road project monitoring it confirms from admin
rating at 4.33 which certainly mean that the study is a great
help to the department.
In accordance to the Cagayan de Oro DPWH’s specification,
the system’s capability will definitely give them the support
they need in providing and managing for the public’s
consciousness specifically on the project transparency of the
department.
REFERENCES
[1] Igbokwe-Ibeto, Chinyeaka Justine. Issues And Challenges In Local
Government Project Monitoring And Evaluation In Nigeria:The Way
Forward, vol. 8,No.18
[2] Fiatornu , Stephen Yao(2006) .GIS a Tool for Transportation
Infrastructure Planning in Ghana A Case Study to the Department of
Feeder Roads, Ghana
[3] Planning of Roads and Highways Planning Tools and Analysis
Methods. Online. 17 July 2013.
http://www.worldbank.org/transport/roads/pl_sect6.htm
[4] Basu, Bikramaditya (2002). Accelerated Construction and
Rehabilitation of Bridges. Masteral Thesis. B.E Bangalore University,
India. 2002
[5] Djindjan, F. “Webmapping In The Historical And Archaeological
Sciences”. 2008.Online 5 October
2013.http://soi.cnr.it/archcalc/indice/PDF19/1_Djindjian.pdf
[6] Kraak, Menno Jan. “Settings and needs for web cartography”. 2001.
New York, p. 3–4.
[7] Almirante, Vanessa (2013). Transcript of Copy of DPWH
Corruption.Online 20 December 2013.
http://prezi.com/2er3wpx0fe2r/copy-of-copy-of-copy-of-dpwh-corru
ption/
[8] Condon, T. “Information Mapping as Support for Learning and
Teaching”. Computer Education.2002.Online 2 October 2013.
http://.parlog.com/infomap.doc.
[9] Google Maps JavaScript API V3. 2012. Online 5 November
2013.www.code.google.com.
[10] Avraam, M. (2009) “Geoweb, web mapping and web GIS”.Online. 2
October 2013.http://michalisavraam.org/2009/03/geoweb-web-
mapping-and-web-gis/
Junar A. Landicho was born at Butuan City,
Philippines. He take his BS Computer Science at
Caraga State University, Butuan City,
Philippines last 2006. He earned his Master in
Information Technology at Mindanao University
of Science and Technology, Cagayan de Oro
City, Philippines last 2012.
He is a faculty member in the Department of
Information Technology of the Mindanao
University of Science and Technology, Philippines.. His research interest is
in the field of database system, mobile application, image and sound
processing. He is Certified Cisco Academy Instructor. He is an IBM
Certified Database Associate and a National TVET Assessors and Trainers
in the field of Computer Programming, Visual Graphic Design and PC
Operation.
Author’s formal
photo
2014 International Conference on Informatics and Advanced Computing (ICIAC-14) Dec. 30-31, 2014 Bangkok, Thailand
http://dx.doi.org/10.15242/IAE.IAE1214015 31