Embed Size (px)
Citation preview
1
SUPPORTING INFORMATION FOR :
A water soluble probe with near infra-red two-photon absorption
and polarity-induced fluorescence for cerebral vascular imaging
Julien Massin,a Azzam Charaf-Eddin,
b Florence Appaix,
c Denis Jacquemin,
b,d Boudewijn
VanDerSanden,c Yann Bretonnière,
a Chantal Andraud
a and Cyrille Monnereau
a
Figure S1. Plot of emission Stokes shift (top) absorption shift (center), and emission shift(bottom)t to Lippert-
Mataga polarity scale .......................................................................................................................................... 2
Figure S2. Plot of the fluorescence lifetime vs emission energy, and fit of the evolution to an exponential
model ................................................................................................................................................................... 3
Figure S3 Excited state decay’s kinetic constants vs emission wavelength ........................................................ 3
Scheme S1 bond numbering for the values in Table S-1 .................................................................................... 4
Table S1 .............................................................................................................................................................. 4
Figures S4-S5 ...................................................................................................................................................... 4
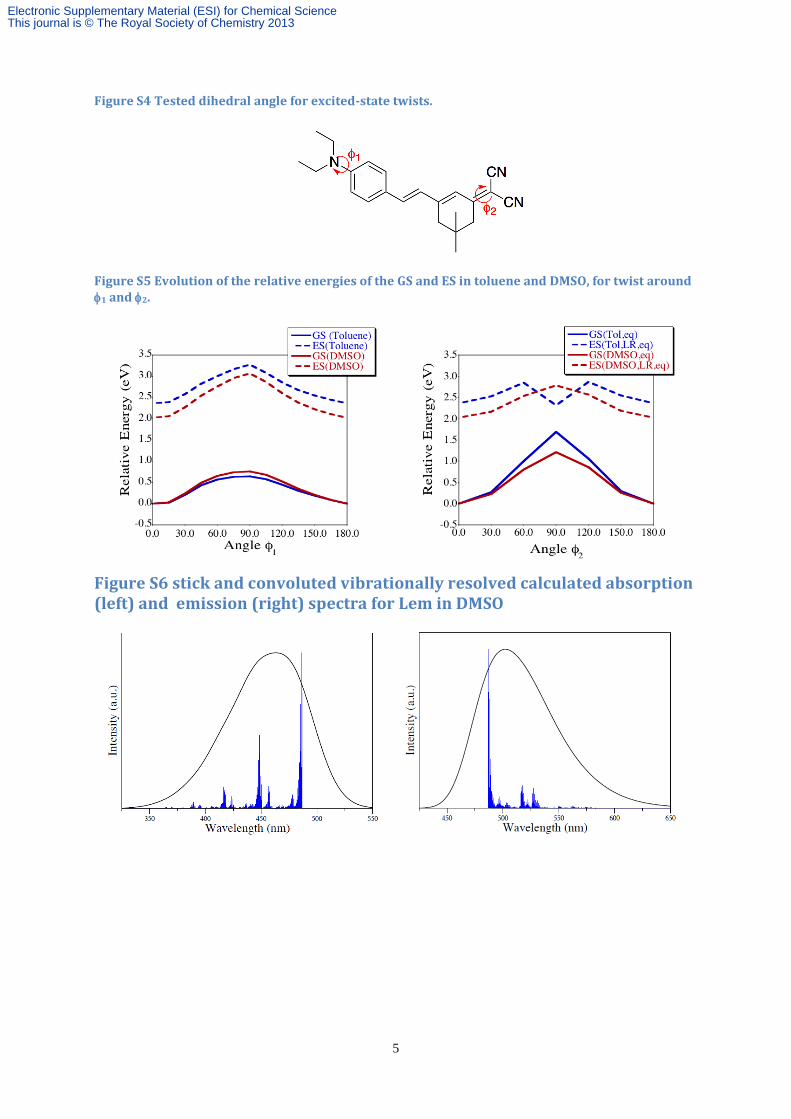
Figure S4 Tested dihedral angle for excited-state twists. ................................................................................ 5
Figure S5 Evolution of the relative energies of the GS and ES in toluene and DMSO, for twist around 1
and 2. ............................................................................................................................................................. 5
Figure S6 stick and convoluted vibrationally resolved calculated absorption (left) and emission (right) spectra
for Lem in DMSO ............................................................................................................................................... 5
Figures S7. 1H and
13C NMR spectra of all new compounds in this paper ......................................................... 6
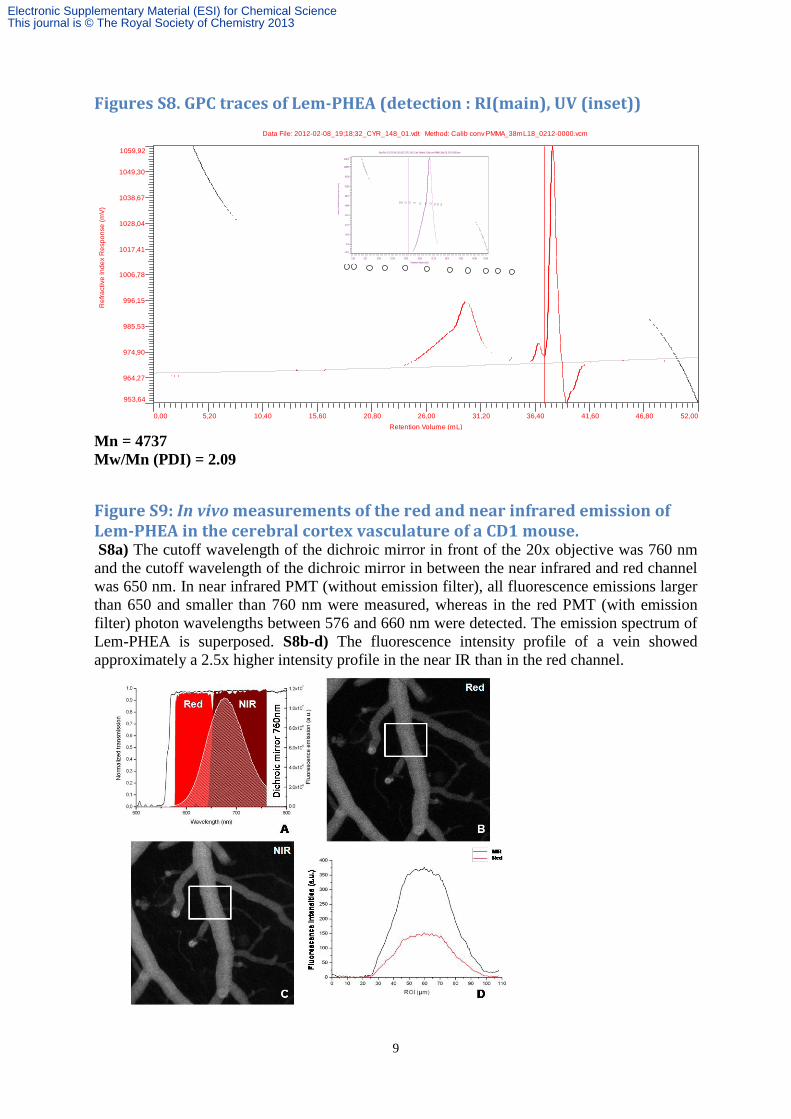
Figures S8. GPC traces of Lem-PHEA (detection : RI(main), UV (inset))......................................................... 9
Figure S9: In vivo measurements of the red and near infrared emission of Lem-PHEA in the cerebral cortex
vasculature of a CD1 mouse................................................................................................................................ 9
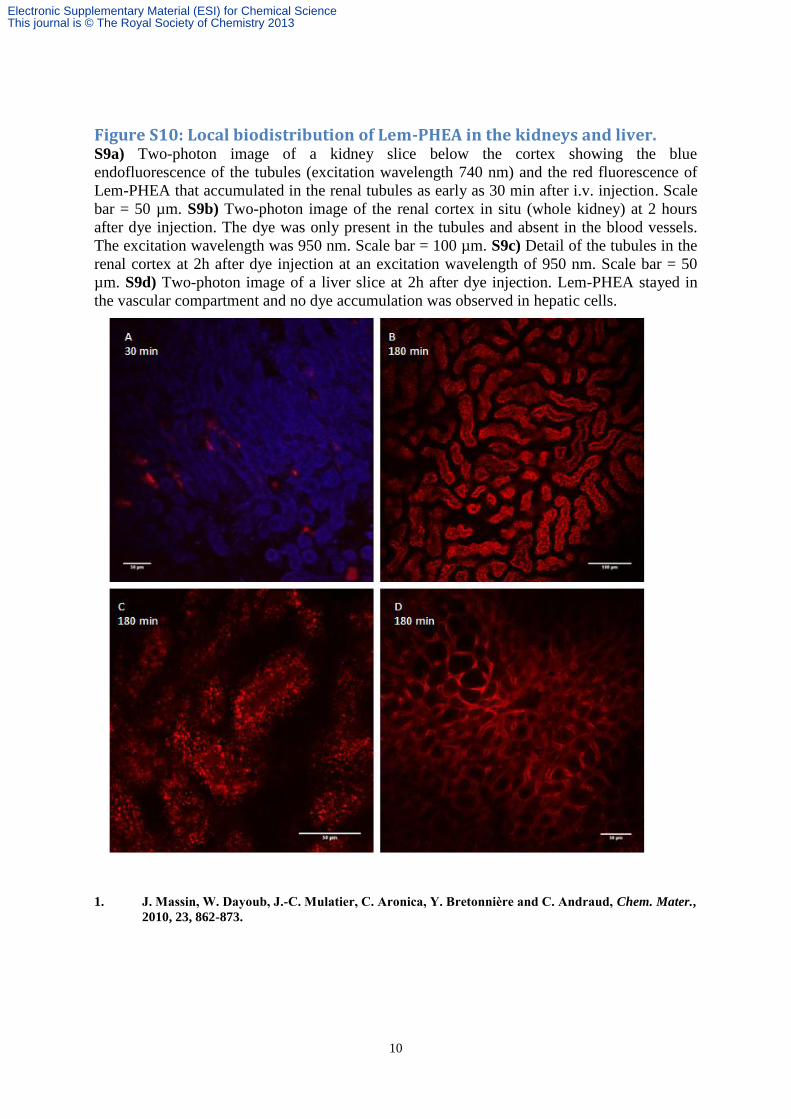
Figure S10: Local biodistribution of Lem-PHEA in the kidneys and liver. ...................................................... 10
Electronic Supplementary Material (ESI) for Chemical ScienceThis journal is © The Royal Society of Chemistry 2013
2
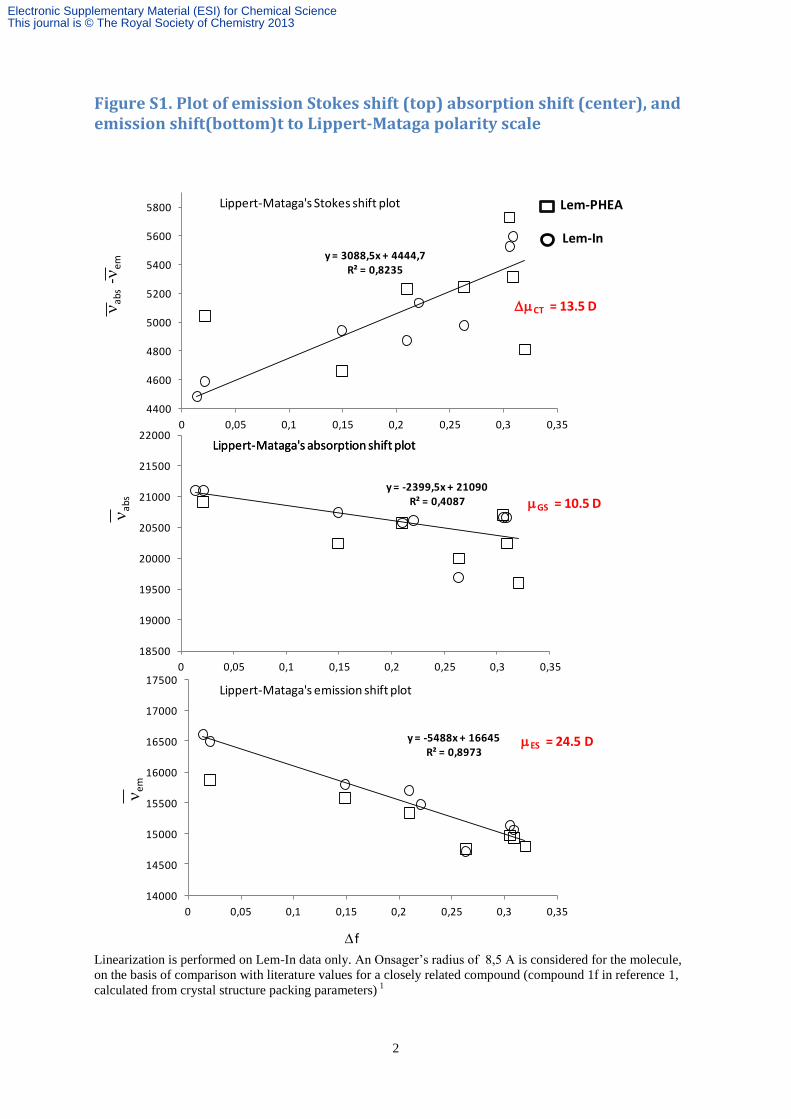
Figure S1. Plot of emission Stokes shift (top) absorption shift (center), and emission shift(bottom)t to Lippert-Mataga polarity scale
Linearization is performed on Lem-In data only. An Onsager’s radius of 8,5 A is considered for the molecule,
on the basis of comparison with literature values for a closely related compound (compound 1f in reference 1,
calculated from crystal structure packing parameters) 1
Df
nab
s-n
em
y = 3088,5x + 4444,7R² = 0,8235
4400
4600
4800
5000
5200
5400
5600
5800
0 0,05 0,1 0,15 0,2 0,25 0,3 0,35
Lippert-Mataga's Stokes shift plot
y = -2399,5x + 21090R² = 0,4087
18500
19000
19500
20000
20500
21000
21500
22000
0 0,05 0,1 0,15 0,2 0,25 0,3 0,35
Lippert-Mataga's absorption shift plotLippert-Mataga's absorption shift plot
y = -5488x + 16645R² = 0,8973
14000
14500
15000
15500
16000
16500
17000
17500
0 0,05 0,1 0,15 0,2 0,25 0,3 0,35
Lippert-Mataga's emission shift plot
nab
sn
em
DmCT = 13.5 D
mGS = 10.5 D
mES = 24.5 D
Lem-PHEA
Lem-In
Electronic Supplementary Material (ESI) for Chemical ScienceThis journal is © The Royal Society of Chemistry 2013
3
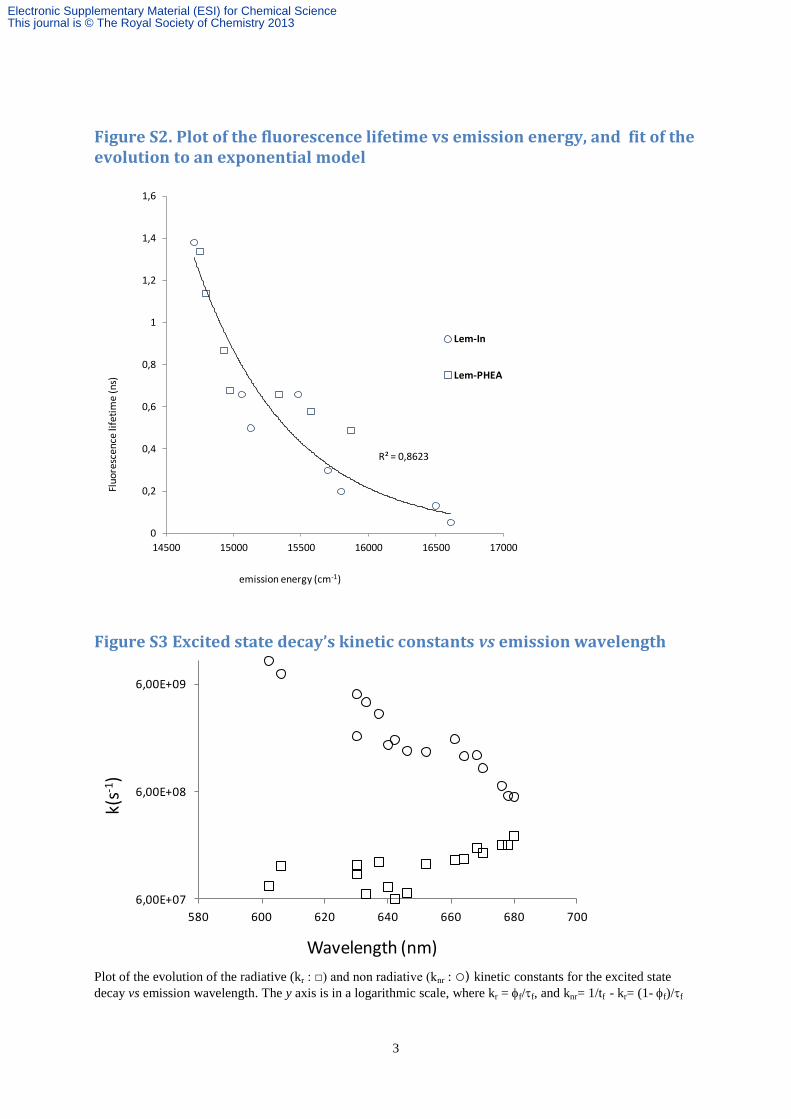
Figure S2. Plot of the fluorescence lifetime vs emission energy, and fit of the evolution to an exponential model
Figure S3 Excited state decay’s kinetic constants vs emission wavelength
Plot of the evolution of the radiative (kr : □) and non radiative (knr : ○) kinetic constants for the excited state
decay vs emission wavelength. The y axis is in a logarithmic scale, where kr = f/f, and knr= 1/tf - kr= (1-f)/f
R² = 0,8623
0
0,2
0,4
0,6
0,8
1
1,2
1,4
1,6
14500 15000 15500 16000 16500 17000
Lem-In
Lem-PHEA
Fluo
resc
ence
life
tim
e (n
s)
emission energy (cm-1)
6,00E+07
6,00E+08
6,00E+09
580 600 620 640 660 680 700
Wavelength (nm)
k(s-1
)
Electronic Supplementary Material (ESI) for Chemical ScienceThis journal is © The Royal Society of Chemistry 2013
4
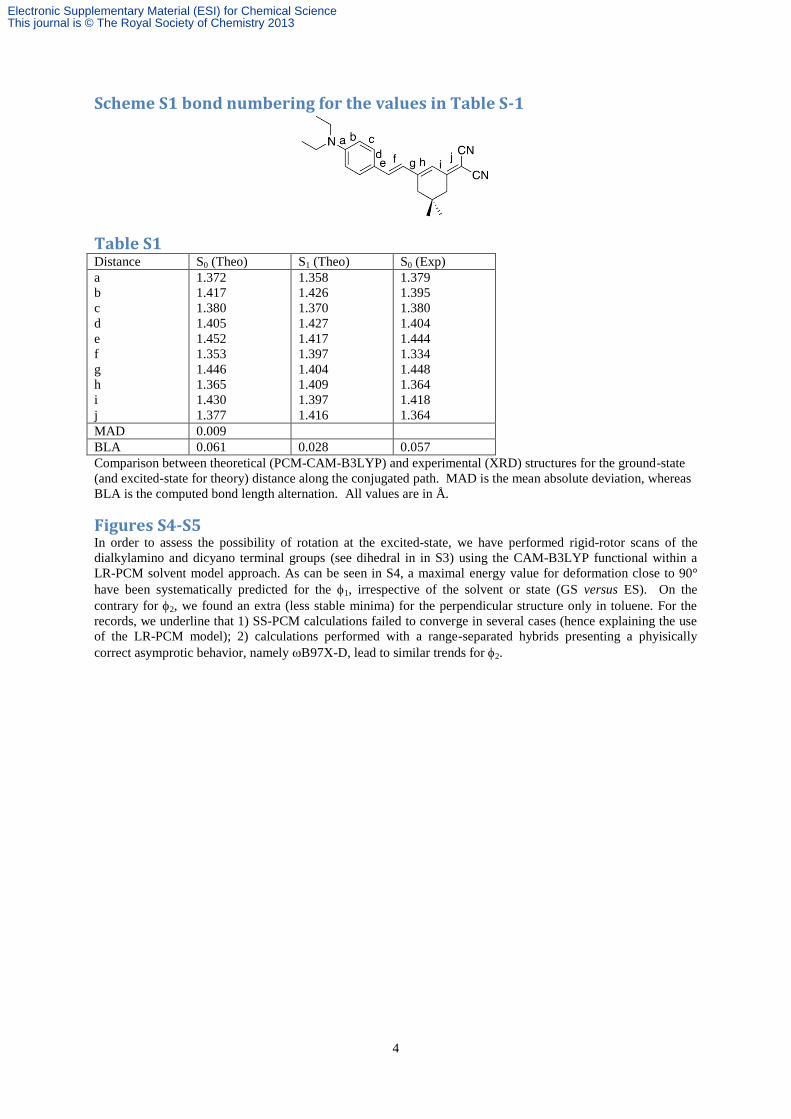
Scheme S1 bond numbering for the values in Table S-1
Table S1 Distance S0 (Theo) S1 (Theo) S0 (Exp)
a
b
c
d
e
f
g
h
i
j
1.372
1.417
1.380
1.405
1.452
1.353
1.446
1.365
1.430
1.377
1.358
1.426
1.370
1.427
1.417
1.397
1.404
1.409
1.397
1.416
1.379
1.395
1.380
1.404
1.444
1.334
1.448
1.364
1.418
1.364
MAD 0.009
BLA 0.061 0.028 0.057
Comparison between theoretical (PCM-CAM-B3LYP) and experimental (XRD) structures for the ground-state
(and excited-state for theory) distance along the conjugated path. MAD is the mean absolute deviation, whereas
BLA is the computed bond length alternation. All values are in Å.
Figures S4-S5 In order to assess the possibility of rotation at the excited-state, we have performed rigid-rotor scans of the
dialkylamino and dicyano terminal groups (see dihedral in in S3) using the CAM-B3LYP functional within a
LR-PCM solvent model approach. As can be seen in S4, a maximal energy value for deformation close to 90°
have been systematically predicted for the 1, irrespective of the solvent or state (GS versus ES). On the
contrary for 2, we found an extra (less stable minima) for the perpendicular structure only in toluene. For the
records, we underline that 1) SS-PCM calculations failed to converge in several cases (hence explaining the use
of the LR-PCM model); 2) calculations performed with a range-separated hybrids presenting a phyisically
correct asymprotic behavior, namely B97X-D, lead to similar trends for 2.
Electronic Supplementary Material (ESI) for Chemical ScienceThis journal is © The Royal Society of Chemistry 2013
5
Figure S4 Tested dihedral angle for excited-state twists.
Figure S5 Evolution of the relative energies of the GS and ES in toluene and DMSO, for twist around 1 and 2.
Figure S6 stick and convoluted vibrationally resolved calculated absorption (left) and emission (right) spectra for Lem in DMSO
Electronic Supplementary Material (ESI) for Chemical ScienceThis journal is © The Royal Society of Chemistry 2013
6
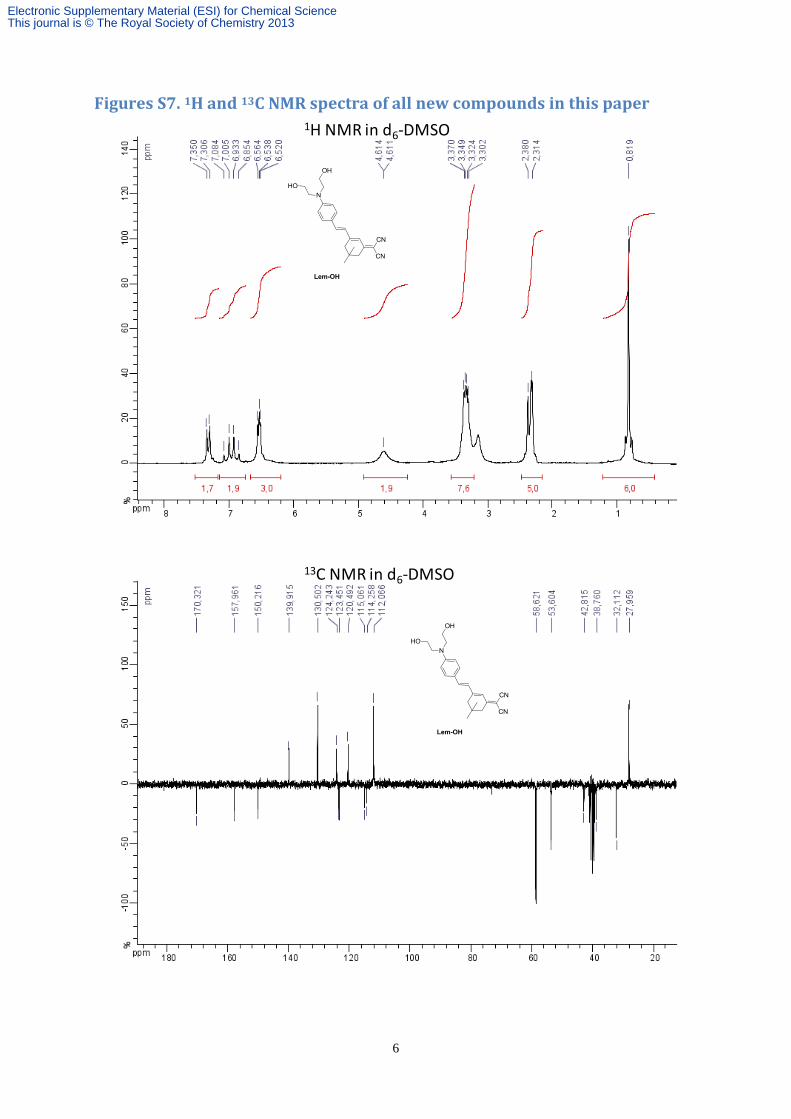
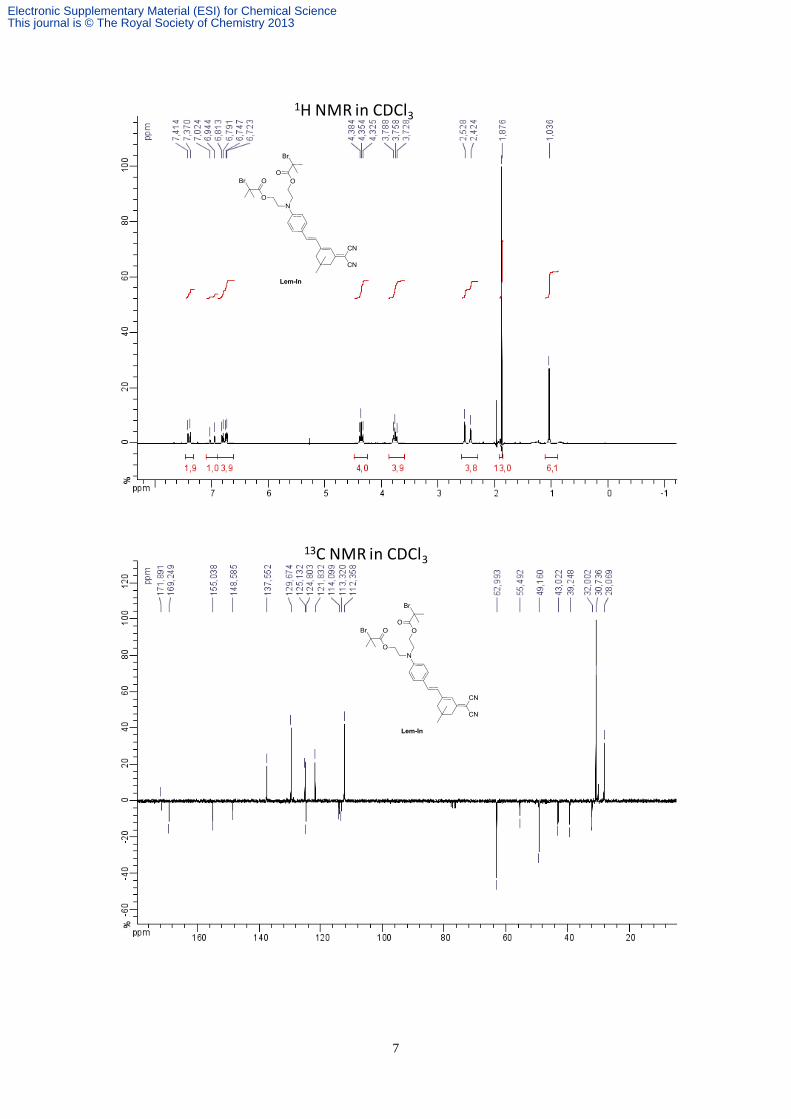
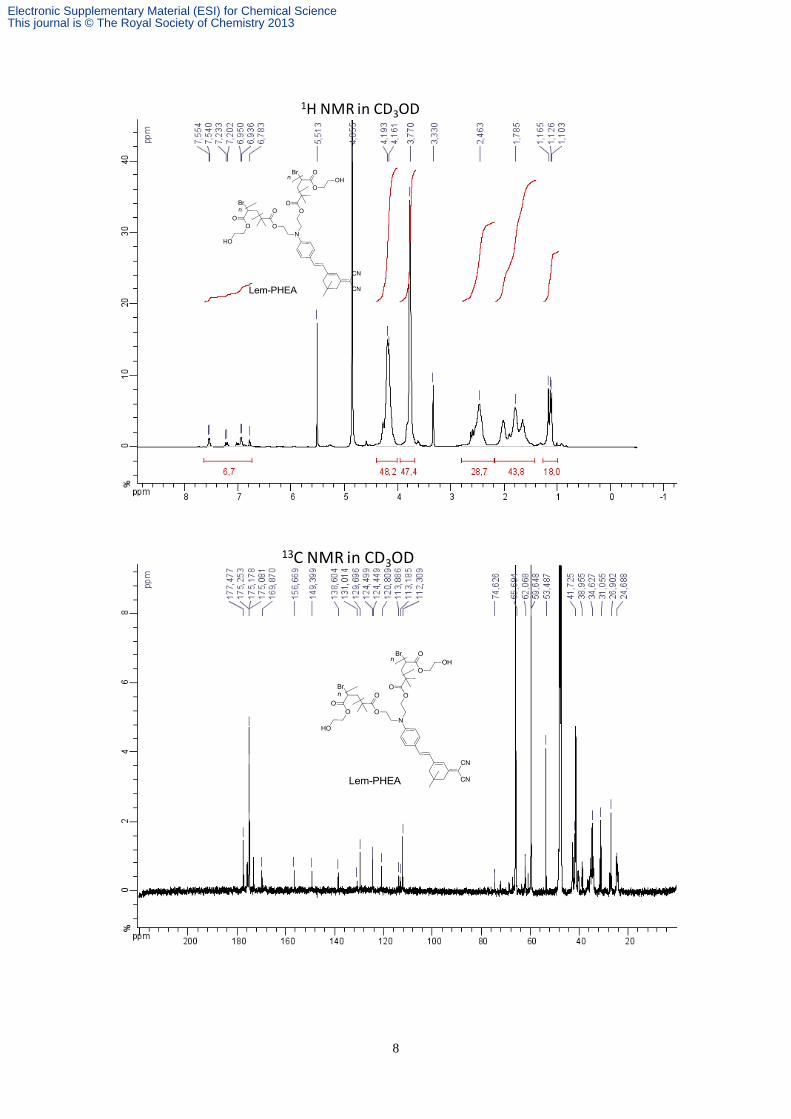
Figures S7. 1H and 13C NMR spectra of all new compounds in this paper
1H NMR in d6-DMSO
13C NMR in d6-DMSO
Electronic Supplementary Material (ESI) for Chemical ScienceThis journal is © The Royal Society of Chemistry 2013
7
1H NMR in CDCl3
13C NMR in CDCl3
Electronic Supplementary Material (ESI) for Chemical ScienceThis journal is © The Royal Society of Chemistry 2013
8
1H NMR in CD3OD
13C NMR in CD3OD
Electronic Supplementary Material (ESI) for Chemical ScienceThis journal is © The Royal Society of Chemistry 2013
9
Figures S8. GPC traces of Lem-PHEA (detection : RI(main), UV (inset))
Mn = 4737
Mw/Mn (PDI) = 2.09
Figure S9: In vivo measurements of the red and near infrared emission of Lem-PHEA in the cerebral cortex vasculature of a CD1 mouse. S8a) The cutoff wavelength of the dichroic mirror in front of the 20x objective was 760 nm
and the cutoff wavelength of the dichroic mirror in between the near infrared and red channel
was 650 nm. In near infrared PMT (without emission filter), all fluorescence emissions larger
than 650 and smaller than 760 nm were measured, whereas in the red PMT (with emission
filter) photon wavelengths between 576 and 660 nm were detected. The emission spectrum of
Lem-PHEA is superposed. S8b-d) The fluorescence intensity profile of a vein showed
approximately a 2.5x higher intensity profile in the near IR than in the red channel.
Re
fra
ctive
In
de
x R
esp
on
se
(m
V)
Retention Volume (mL)
5,20 10,40 15,60 20,80 26,00 31,20 36,40 41,60 46,80
1049,30
1038,67
1028,04
1017,41
1006,78
996,15
985,53
974,90
964,27
Data File: 2012-02-08_19;18;32_CYR_148_01.vdt Method: Calib conv PMMA_38mL18_0212-0000.vcm
1059,92
953,64
0,00 52,00
Ultra
Vio
let R
esp
on
se
(m
V)
Retention Volume (mL)
5,20 10,40 15,60 20,80 26,00 31,20 36,40 41,60 46,80
108,53
95,06
81,59
68,11
54,64
41,17
27,70
14,23
0,76
Data File: 2012-02-08_19;18;32_CYR_148_01.vdt Method: Calib conv PMMA_38mL18_0212-0000.vcm
122,00
-12,71
0,00 52,00
Electronic Supplementary Material (ESI) for Chemical ScienceThis journal is © The Royal Society of Chemistry 2013
10
Figure S10: Local biodistribution of Lem-PHEA in the kidneys and liver. S9a) Two-photon image of a kidney slice below the cortex showing the blue
endofluorescence of the tubules (excitation wavelength 740 nm) and the red fluorescence of
Lem-PHEA that accumulated in the renal tubules as early as 30 min after i.v. injection. Scale
bar = 50 µm. S9b) Two-photon image of the renal cortex in situ (whole kidney) at 2 hours
after dye injection. The dye was only present in the tubules and absent in the blood vessels.
The excitation wavelength was 950 nm. Scale bar = 100 µm. S9c) Detail of the tubules in the
renal cortex at 2h after dye injection at an excitation wavelength of 950 nm. Scale bar = 50
µm. S9d) Two-photon image of a liver slice at 2h after dye injection. Lem-PHEA stayed in
the vascular compartment and no dye accumulation was observed in hepatic cells.
1. - Chem. Mater.,
2010, 23, 862-873.
Electronic Supplementary Material (ESI) for Chemical ScienceThis journal is © The Royal Society of Chemistry 2013


![Infra [ initiatives ]](https://img.pdfslide.us/doc/110x75/589ecd381a28ab47138b61d3/infra-initiatives-.jpg)