Embed Size (px)
Citation preview

A water budget perspective of leaky aquifer response
to pumping
David Scott1 and Bruce Hunt2
1Environment Canterbury2University of Canterbury (Retired)

Leaky aquifer behaviour

Characterizing leaky aquifers
Standard measures– Leakance - units of length– K’/B’ - units of 1/time
Alternative measure– t50 - units of time
More general applicability

The two-aquifer model
From Hunt & Scott (2007)
Q
Sy, T0,
S, T, s
B’, K’

The problem
Q
Sy, T0,
S, T, s
B’, K’

The solution
Excel macro W_11 from Hunt’s Function.xls

Hypothetical example
Water table aquifer (B = 5m)
Pumped aquifer (B = 10m)
Aquitard (B = 5m)
200 m
Q = 50 L/s

Pumped and water-table aquifers
Time = 0.1 day
3.2 m
5 mm

Pumped and water-table aquifers
Time = 0.177 day

Pumped and water-table aquifers
Time = 0.316 day

Pumped and water-table aquifers
Time = 0.562 day

Pumped and water-table aquifers
Time = 1 day

Pumped and water-table aquifers
Time = 1.77 days

Pumped and water-table aquifers
Time = 3.16 days

Pumped and water-table aquifers
Time = 5.62 days

Pumped and water-table aquifers
Time = 10 days

Pumped and water-table aquifers
Time = 11.77 days

Pumped and water-table aquifers
Time = 31.6 days

Pumped and water-table aquifers
Time = 56.2 days

Pumped and water-table aquifers
Time = 100 days

Pumped and water-table aquifers
Time = 177 days

Pumped and water-table aquifers
Time = 316 days

Pumped and water-table aquifers
Time = 562 days

Pumped and water-table aquifers
Time = 1000 days
3.8 m
0.9 m

Vertical drainage after 0.1 days
1 mm drawdown, 1 km radius circle
Specific yield 0.1
Volume = 314 m3, Qavg = 36 L/s
Qavg = 72% of pumping rate

Drainage rate
0
12.5
25
37.5
50
0.001 0.01 0.1 1 10 100 1000
Time (days)
Flo
w r
ate
(l/s
) Instantaneous drainage rate
Average drainage rate

Drainage rate
0
12.5
25
37.5
50
0.001 0.01 0.1 1 10 100 1000
Time (days)
Flo
w r
ate
(l/s
)
Instantaneous Drainage rate
Numerical model

0
10
20
30
40
50
0.001 0.01 0.1 1 10 100 1000
Time (days)
Flo
w r
ate
(l/s
)
0
0.4
0.8
1.2
1.6
2
Dra
wd
ow
n (
m)
Drainage rate
Water table drawdownPumped aquifer drawdown
Drainage rate & drawdown

Sensitivity of t50 to Sy, T0 & K’/B’
0
0.05
0.1
0.15
1 10 100 1000 10000
Sy/S
t 50
(day
s)
Sy
0
0.005
0.01
0.015
0.02
0.025
0.03
1 10 100 1000 10000
T0 (m2/day)
t 50
(day
s)T0
0.001
0.01
0.1
1
10
100
0.000001 0.00001 0.0001 0.001 0.01 0.1
K'/B' (1/days)
t 50
(da
ys
)
K'/B'
Clay
Silt, sandy silt

Modflow solution
● Independent check● Allows consideration of less
idealised cases● Underlying layer● Sloping aquifer● Alternative boundary conditions
● Zone budget● Modpath - visualisation


Effect of an underlying layer?
0
12.5
25
37.5
50
0.001 0.01 0.1 1 10 100 1000
Time (days)
Flo
w r
ate
(l/s
) 2 aquifer case
3 layer case
from lower aquiferr

Pumping from the lower layer…
0
12.5
25
37.5
50
0.001 0.01 0.1 1 10 100 1000
Time (days)
Flo
w r
ate
(l/s
)
2 aquifer case
3 layer case
pumping from lower layer

Effects of adjacent boundary
0
12.5
25
37.5
50
0.001 0.01 0.1 1 10 100 1000
Time (days)
Flo
w r
ate
(l/s
) 5 km from boundary
2 aquifer case
2 km from boundary

Sloping aquifer (1:1000)
0
10
20
30
40
50
0.001 0.01 0.1 1 10 100 1000 10000
Time (days)
Flo
w r
ate
(l/s
)
2 aquifer case
sloping
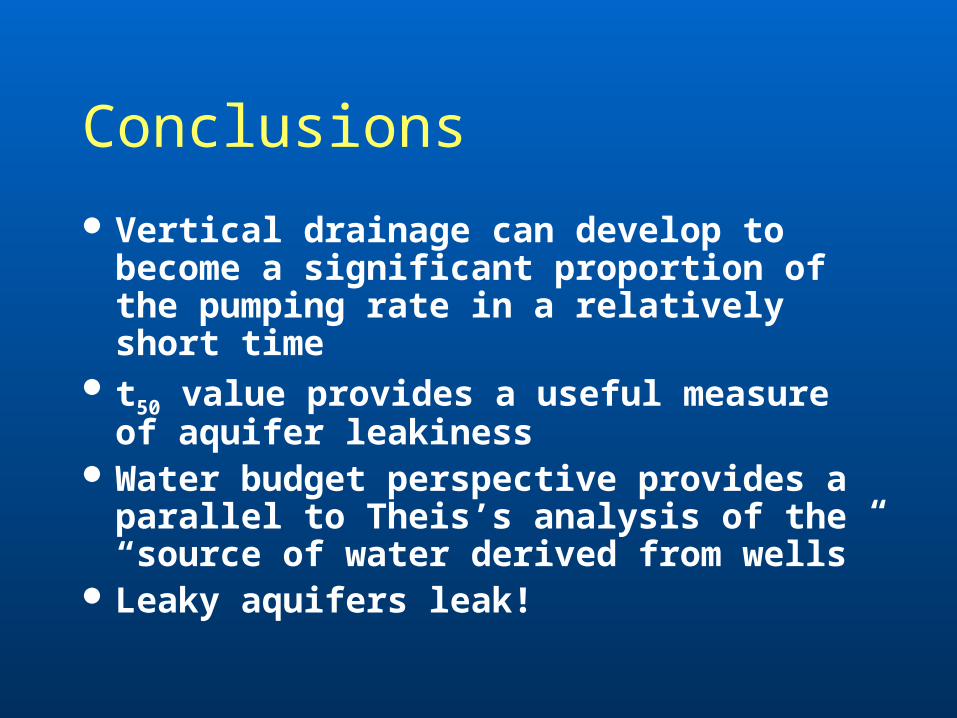
Conclusions
Vertical drainage can develop to become a significant proportion of the pumping rate in a relatively short time
t50 value provides a useful measure of aquifer leakiness
Water budget perspective provides a parallel to Theis’s analysis of the “source of water derived from wells”
Leaky aquifers leak!

0
10
20
30
40
50
0.001 0.01 0.1 1 10 100 1000
Time (days)
Flo
w r
ate
(l/
s)
2 aquifer case
drainage from shallow aquifer
total vertical drainage through aquitard
released from aquitard storage
Aquitard storativity
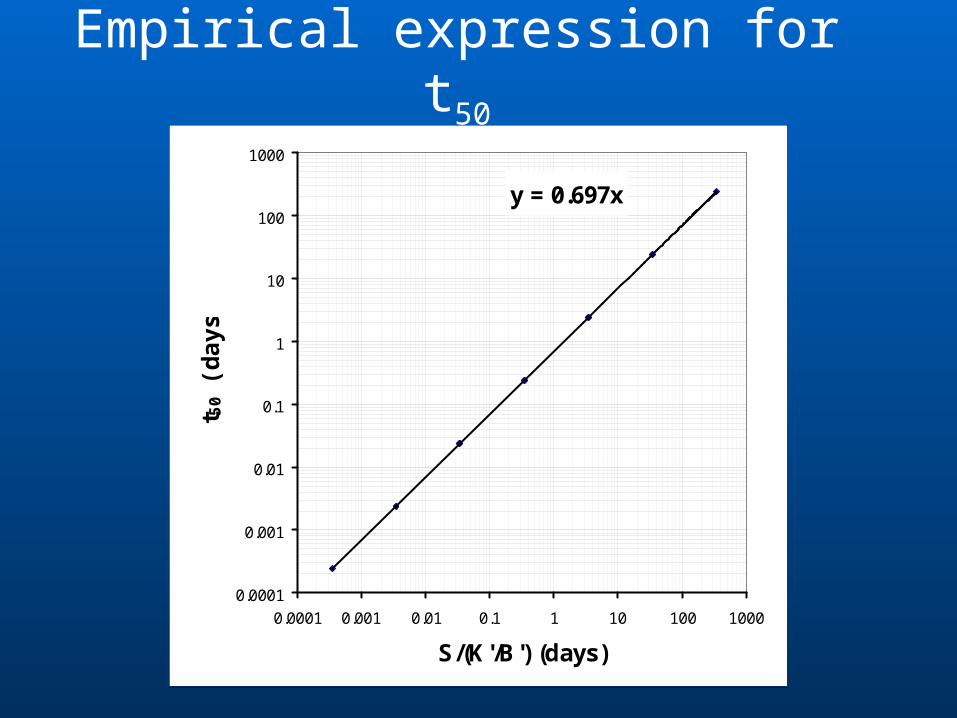
Empirical expression for t50
y = 0.697x
0.0001
0.001
0.01
0.1
1
10
100
1000
0.0001 0.001 0.01 0.1 1 10 100 1000
S/(K'/B') (days)
t 50 (
day
s)
“. . . the term aquitard has been coined to describe the less-permeable beds in a stratigraphic sequence. These beds may be permeable enough to transmit water in quantities that are significant in the study of regional ground-water flow, but their permeability is not sufficient to allow the completion of production wells within them.”
—Freeze and Cherry,1979