Embed Size (px)
Citation preview

A Visual Tour of Colorado’s
Regional Economies
BOOT CAMP SESSION Wednesday, October 5, 2016
Presented by

Today’s Panelists Elizabeth Garner
State Demographer
Colorado Department of Local Affairs, State Demography Office
James Conner Economic and Market Analysis Division Field Director
HUD Region VIII – Rocky Mountain Region
Ryan McMaken Editor, Mises Wire and The Austrian
The Mises Institute
Today’s Moderator
Alison O’Kelly CDBG-DR and NSP Programs Manager
Colorado Department of Local Affairs, Division of Housing

Workshop Overview
Colorado is maturing economically and
demographically.
With desirable living/working conditions, the
Front Range has landed at the top of many
lists for net migrants within the US.
Demographic factors are pushing Colorado
into a “demographic transition” – are we
ready for how global and national trends may
affect Colorado’s economies?
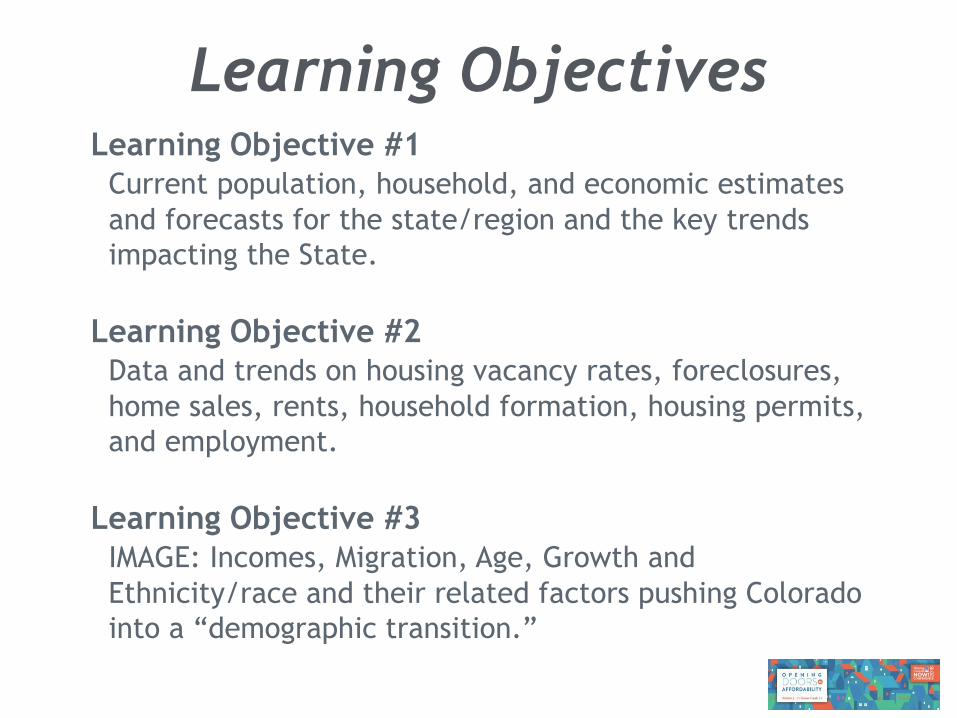
Learning Objectives Learning Objective #1
Current population, household, and economic estimates
and forecasts for the state/region and the key trends
impacting the State.
Learning Objective #2
Data and trends on housing vacancy rates, foreclosures,
home sales, rents, household formation, housing permits,
and employment.
Learning Objective #3
IMAGE: Incomes, Migration, Age, Growth and
Ethnicity/race and their related factors pushing Colorado
into a “demographic transition.”

Agenda
Panelist Presentations • Feel free to raise your hand and ask questions
during the presentations
• Panelists may answer later in presentation, or
• We may add issues to “Parking Lot” to discuss or
answer during discussion sessions later in the
workshop
Panelist Discussion
Audience Discussion and Q&A
Elizabeth Garner
State Demography Office
Colorado Department of Local Affairs
October 2016
Demography.dola.colorado.gov
Growing Forward
Population and Economic
Transitions for Colorado
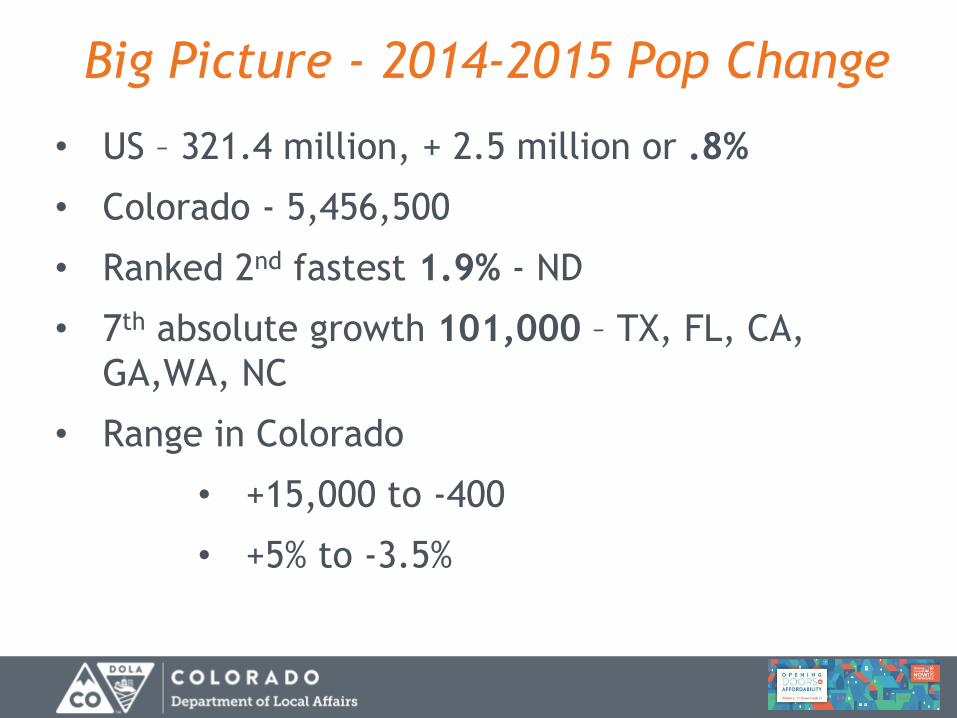
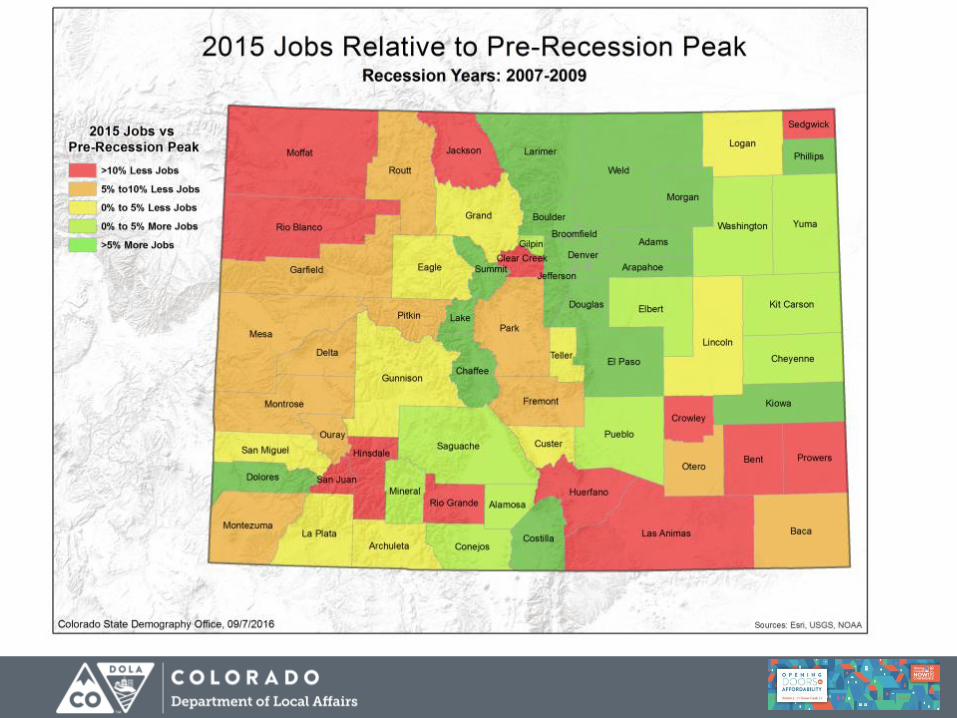
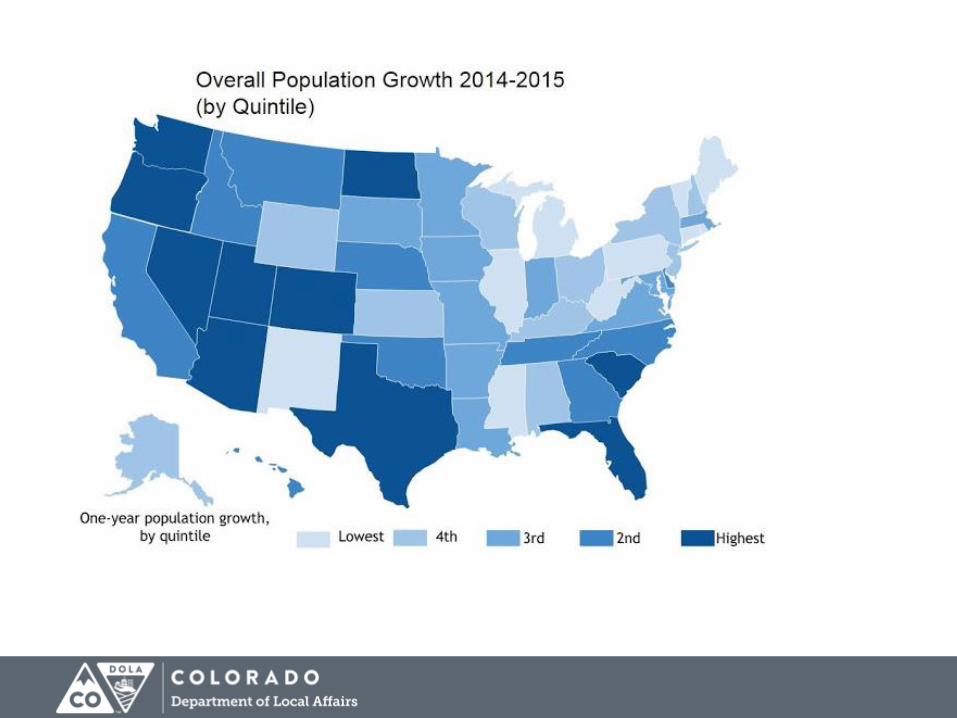
Big Picture - 2014-2015 Pop Change
• US – 321.4 million, + 2.5 million or .8%
• Colorado - 5,456,500
• Ranked 2nd fastest 1.9% - ND
• 7th absolute growth 101,000 – TX, FL, CA,
GA,WA, NC
• Range in Colorado
• +15,000 to -400
• +5% to -3.5%


Age
State Demography Office v2014


Forecast


2010-40
State 2.8M
Front Range 2.4M
Denver Metro 1.5 M
North Front Range 500K
South Front Range 400K
Rest of State 400K

AGE
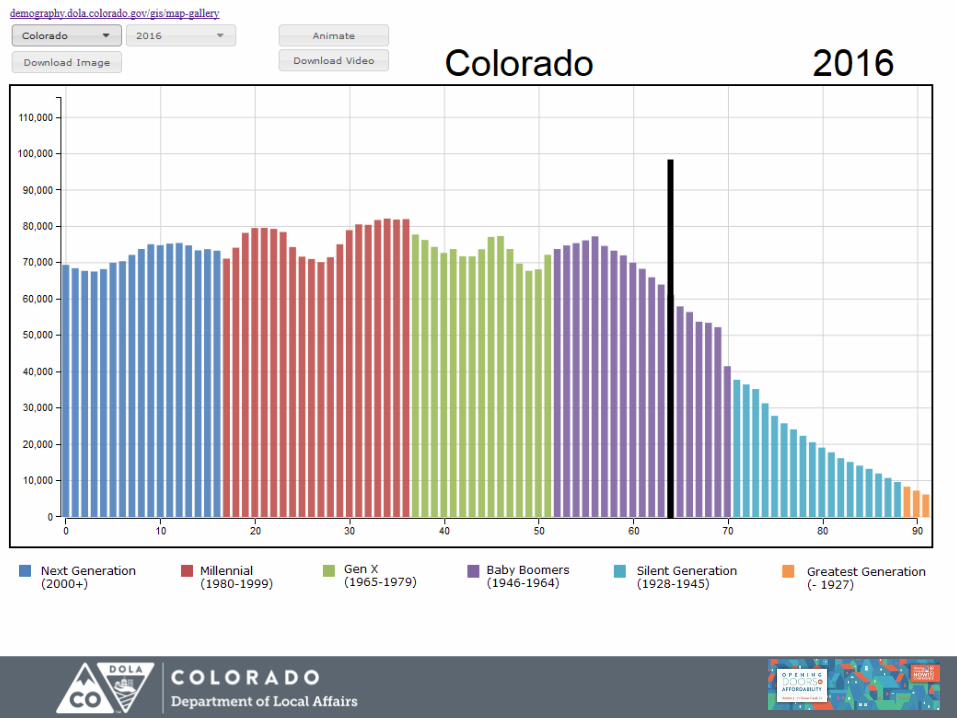


Age Summary
• Fastest growth in households in the 65+ (2.5 as
fast as the Millennials)
• 1991 peak year born for Millennials. Currently
25 years old.
• 43% of 25-34 year olds are home-owners.
• 25-29 year olds move on average every 2.5
years.
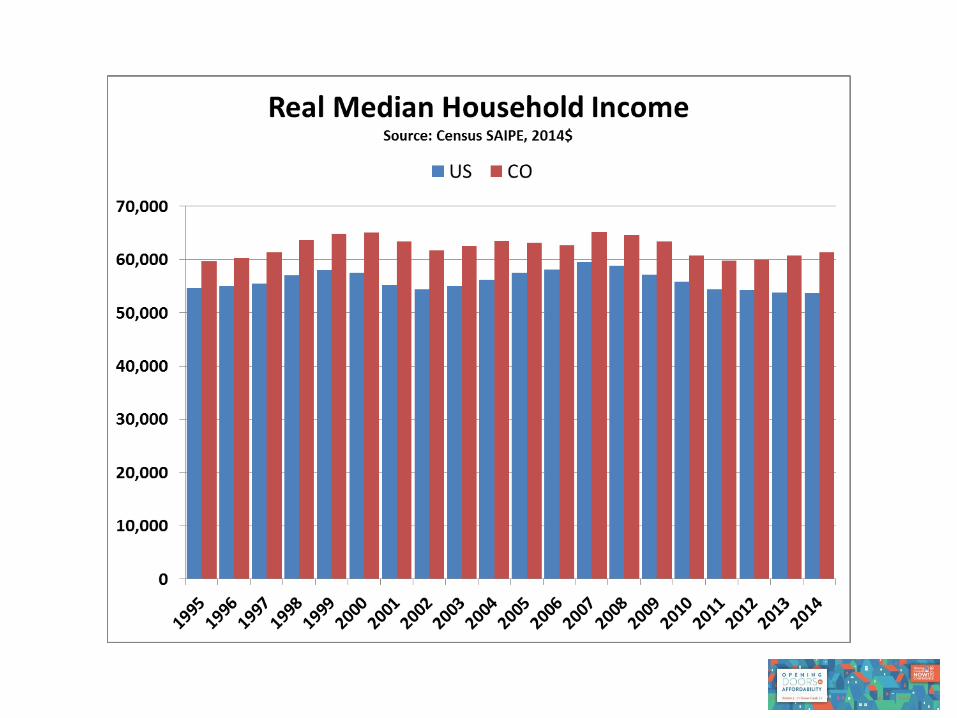
• Millennials 25-34 have a lower Real median
household income compared to Boomers and
Xers at the same age.

Income

Household Income….its future is
demographically challenged
• Age distributions – End of “demographic
dividend”. Slow growth in the 45-64 year olds.
• Occupational Mix – high and low service
• More race/ethnicity diverse especially at young
end but achievement gap is growing as well –
impacts income
• Household type and size – single and smaller
• Youth un- and under employment - Long term
permanent impacts on earnings
State Demography Office
To Ponder in State • Disparate Growth and Migration – how much,
where, and can we compete for the best and the
brightest?
• Aging – we are getting old fast, is the state ready for
the changes to the labor force, income, industrial mix,
housing, etc.
• Income Challenges – how could downward pressure
impact our state?
• Housing –Right amount, right place, right price, right
type.

Thank you
State Demography Office
Department of Local Affairs
Elizabeth Garner
303-864-7750
Demography.dola.colorado.gov

October 2016
James Conner
EMAD Field Director
HUD Region VIII – Rocky Mountain Region
Economic and Market Analysis Division
(EMAD) Overview
Regional Economic and
Housing Market Conditions

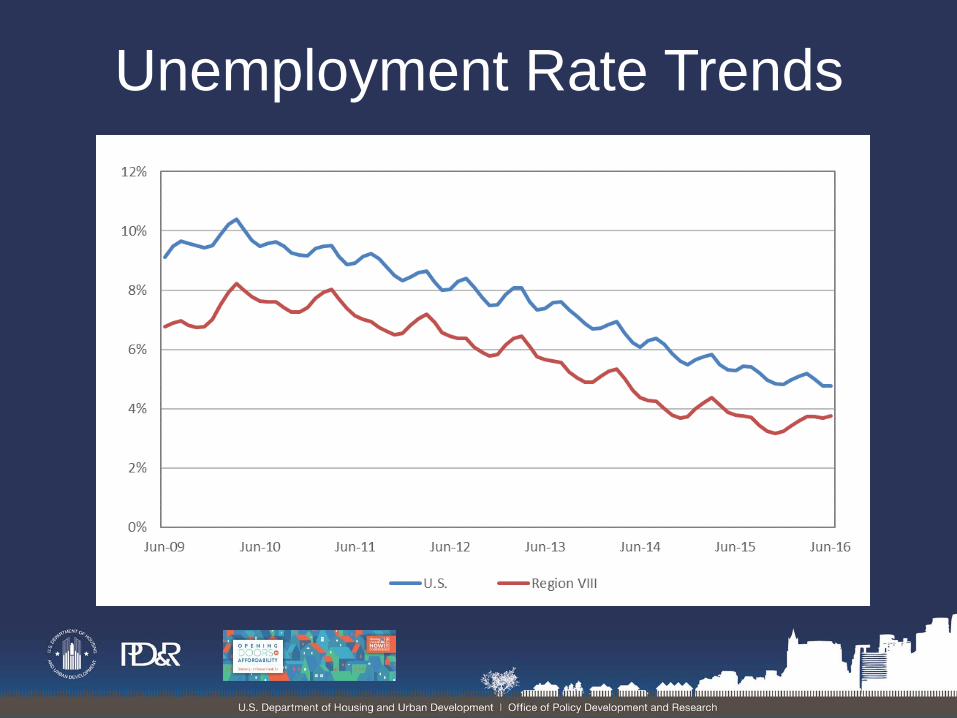
• The region’s economy continued to grow in second
quarter 2016, but at a slower pace than previously.
• The rate of nonfarm payroll growth in the Rocky
Mountain region now lags that of the nation.
• Declines in the energy industry were offset by
growth in the tourism, healthcare, and construction
industries.
• Job losses in energy producing areas were offset
by strong job growth in Colorado and Utah.
Economic Conditions:

Nonfarm Payroll Growth

Payroll Changes by Sector
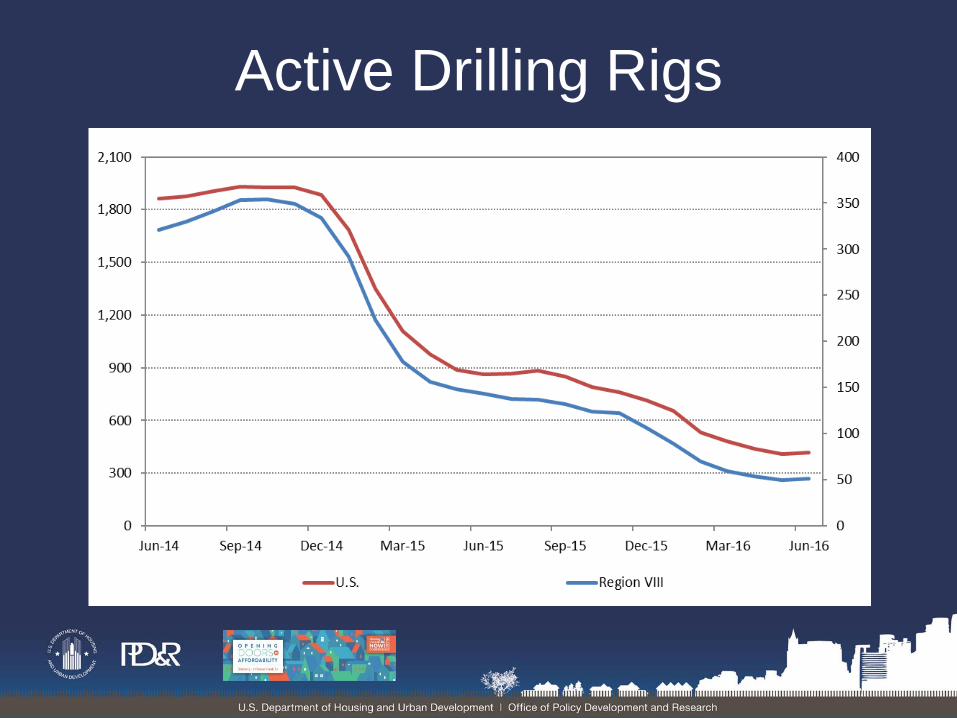
Active Drilling Rigs
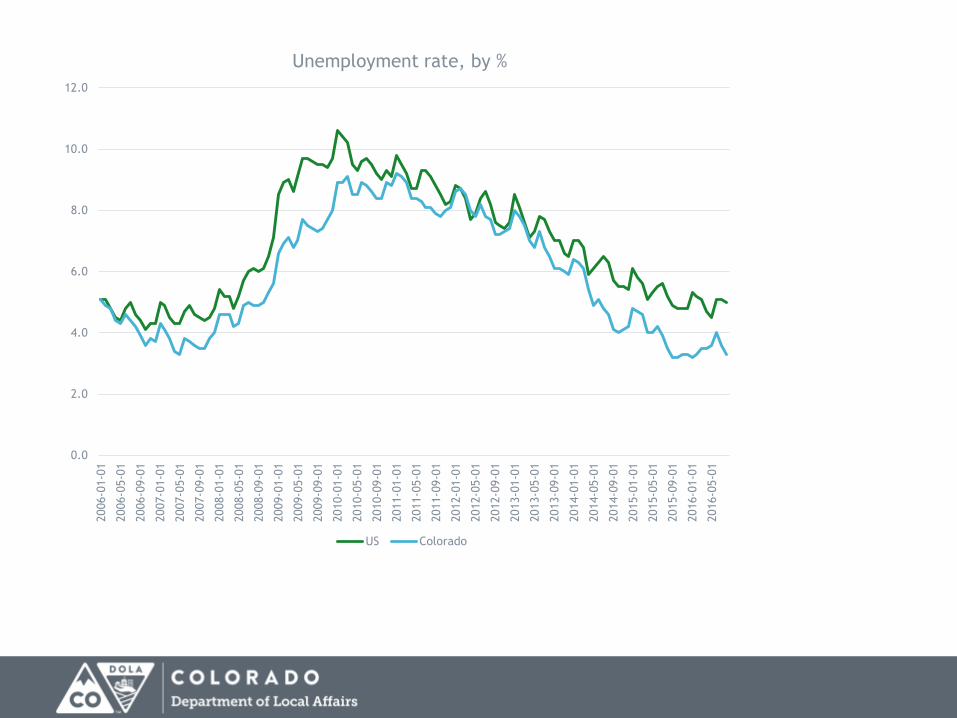
Unemployment Rate Trends
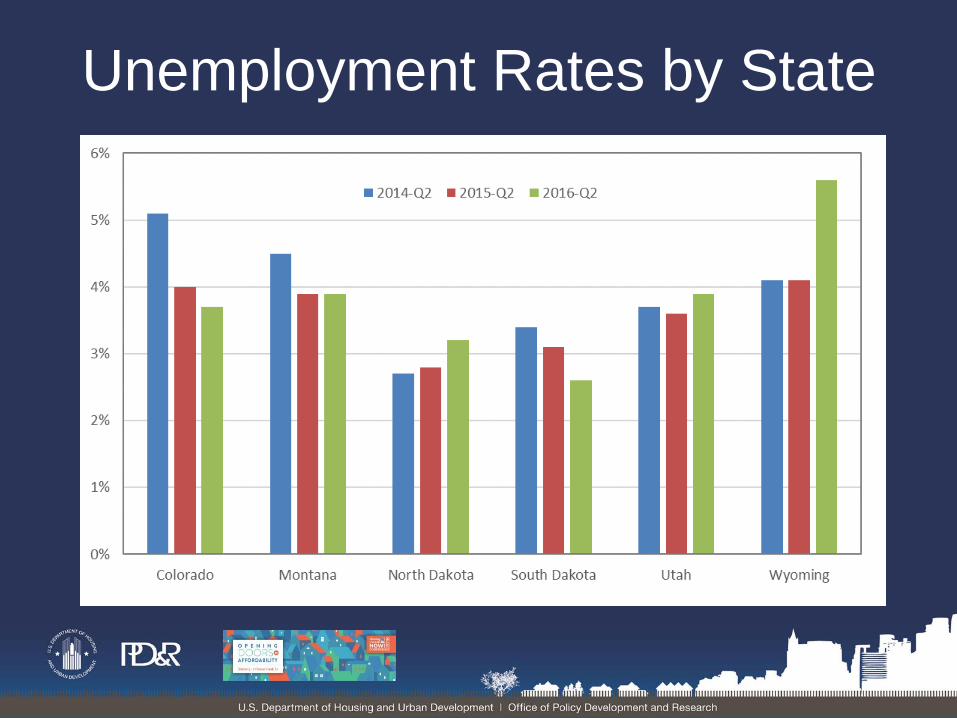
Unemployment Rates by State

• The population in the region grew at double the
national rate from July 2014 to July 2015.
• Net in-migration to the region was relatively strong,
particularly in Colorado.
• In Utah, strong population growth was driven by
net natural increase (births minus deaths).
• Population growth was comparatively slower in
Montana, South Dakota, and Wyoming.
Population Trends:
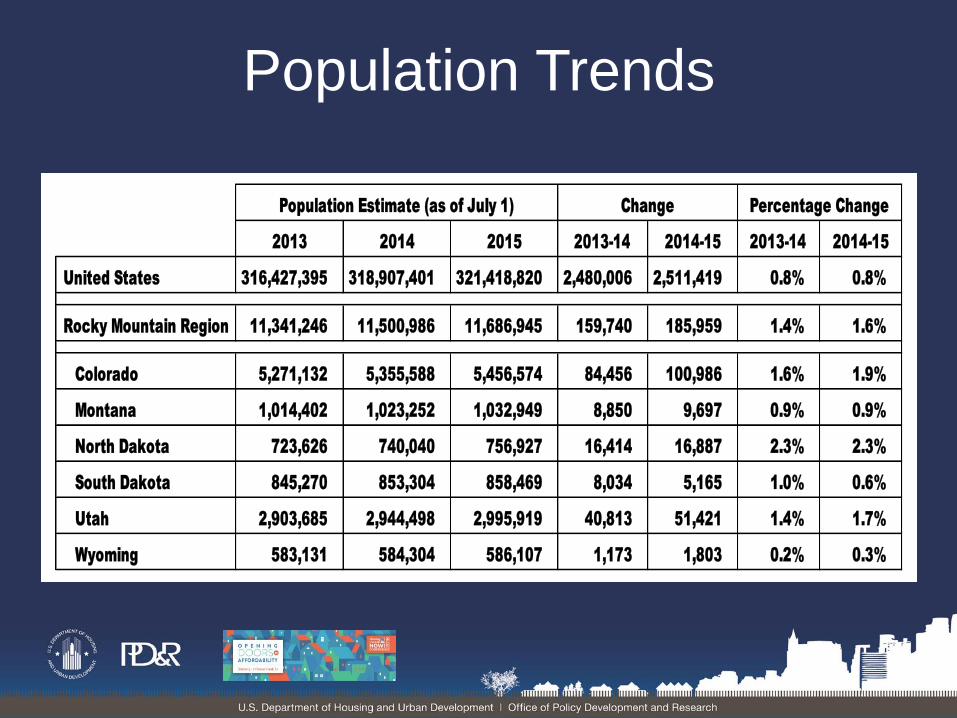
Population Trends
2013 2014 2015 2013-14 2014-15 2013-14 2014-15
United States 316,427,395 318,907,401 321,418,820 2,480,006 2,511,419 0.8% 0.8%
Rocky Mountain Region 11,341,246 11,500,986 11,686,945 159,740 185,959 1.4% 1.6%
Colorado 5,271,132 5,355,588 5,456,574 84,456 100,986 1.6% 1.9%
Montana 1,014,402 1,023,252 1,032,949 8,850 9,697 0.9% 0.9%
North Dakota 723,626 740,040 756,927 16,414 16,887 2.3% 2.3%
South Dakota 845,270 853,304 858,469 8,034 5,165 1.0% 0.6%
Utah 2,903,685 2,944,498 2,995,919 40,813 51,421 1.4% 1.7%
Wyoming 583,131 584,304 586,107 1,173 1,803 0.2% 0.3%
Population Estimate (as of July 1) Change Percentage Change

• Home sales demand remains strong.
• Sales market conditions are tight or slightly tight in
much of the region.
• Supply of for-sale home listings very low in many
metropolitan areas.
• Year-over-year home price increases as high as
10% in some metropolitan areas in the region.
Home Sales Market:

Home Sales Market Conditions

Single-Family Homes Permitted
• Population growth continues to support demand.
• Development activity has been very strong during
the past 1-2 years in many parts of the region.
• Markets that were previously tight have eased in
many of the major metropolitan areas.
• Pipeline of development activity remains strong in
areas such as Colorado and Utah.
Apartment Market:

Apartment Market Conditions
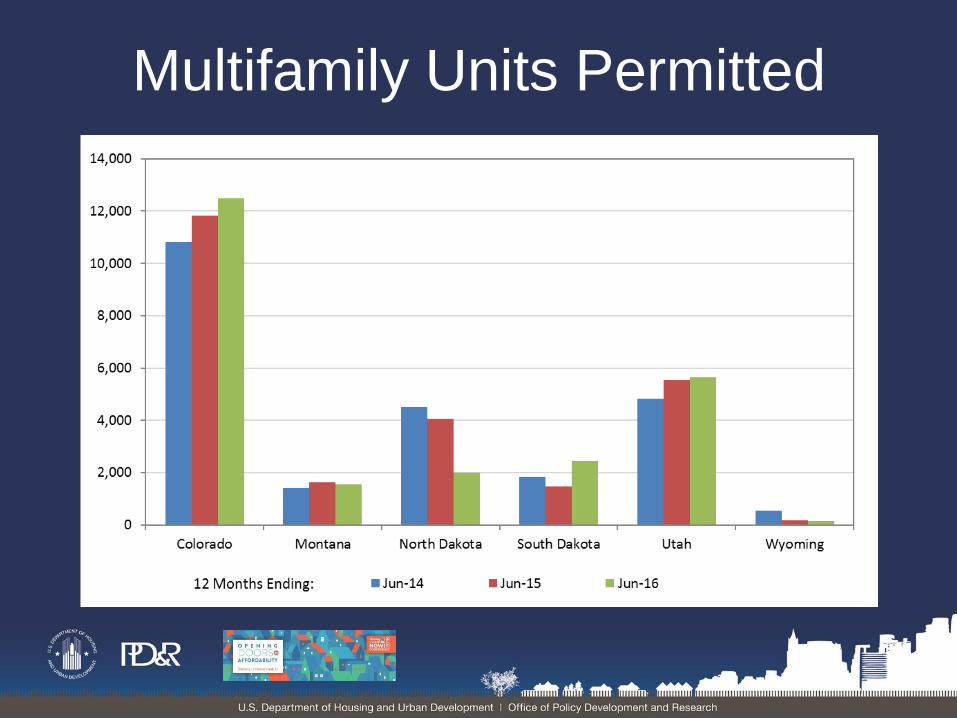
Multifamily Units Permitted
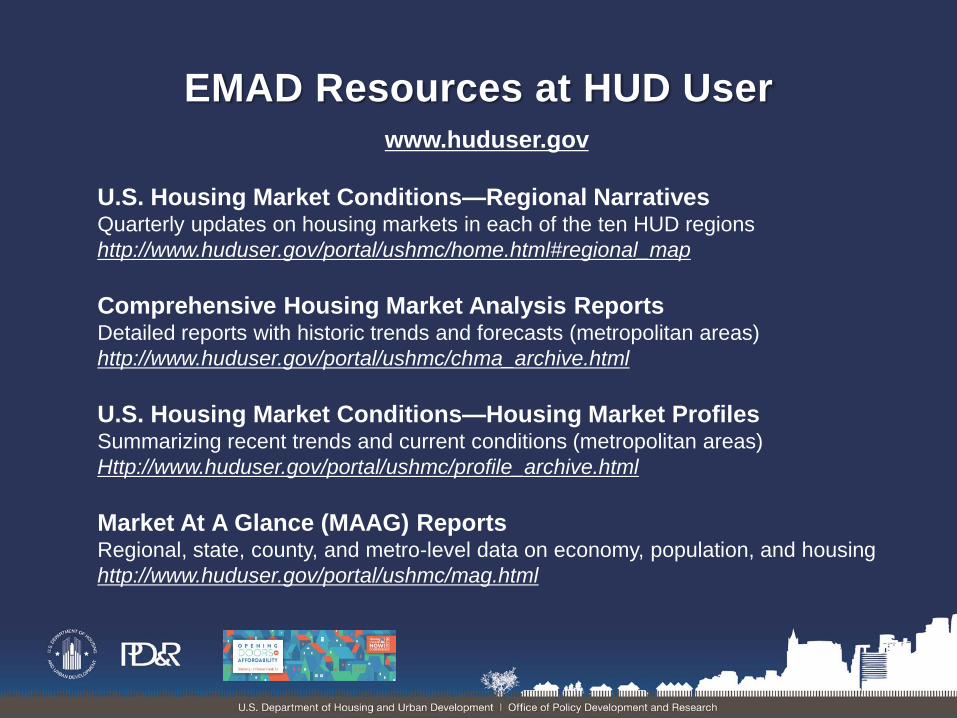
EMAD Resources at HUD User www.huduser.gov
U.S. Housing Market Conditions—Regional Narratives Quarterly updates on housing markets in each of the ten HUD regions
http://www.huduser.gov/portal/ushmc/home.html#regional_map
Comprehensive Housing Market Analysis Reports Detailed reports with historic trends and forecasts (metropolitan areas)
http://www.huduser.gov/portal/ushmc/chma_archive.html
U.S. Housing Market Conditions—Housing Market Profiles Summarizing recent trends and current conditions (metropolitan areas)
Http://www.huduser.gov/portal/ushmc/profile_archive.html
Market At A Glance (MAAG) Reports Regional, state, county, and metro-level data on economy, population, and housing
http://www.huduser.gov/portal/ushmc/mag.html

EMAD Region VIII
Contact Information
James Conner – Field Director
Sam Young – Field Economist
Katharine Auchter – Field Economist

0.0
2.0
4.0
6.0
8.0
10.0
12.02006-0
1-0
1
2006-0
5-0
1
2006-0
9-0
1
2007-0
1-0
1
2007-0
5-0
1
2007-0
9-0
1
2008-0
1-0
1
2008-0
5-0
1
2008-0
9-0
1
2009-0
1-0
1
2009-0
5-0
1
2009-0
9-0
1
2010-0
1-0
1
2010-0
5-0
1
2010-0
9-0
1
2011-0
1-0
1
2011-0
5-0
1
2011-0
9-0
1
2012-0
1-0
1
2012-0
5-0
1
2012-0
9-0
1
2013-0
1-0
1
2013-0
5-0
1
2013-0
9-0
1
2014-0
1-0
1
2014-0
5-0
1
2014-0
9-0
1
2015-0
1-0
1
2015-0
5-0
1
2015-0
9-0
1
2016-0
1-0
1
2016-0
5-0
1
Unemployment rate, by %
US Colorado

5.3 5 4.9
3.9
3.5 3.3 3.2
2.9
0
1
2
3
4
5
6
Unemployment Rate, by %, August 2016
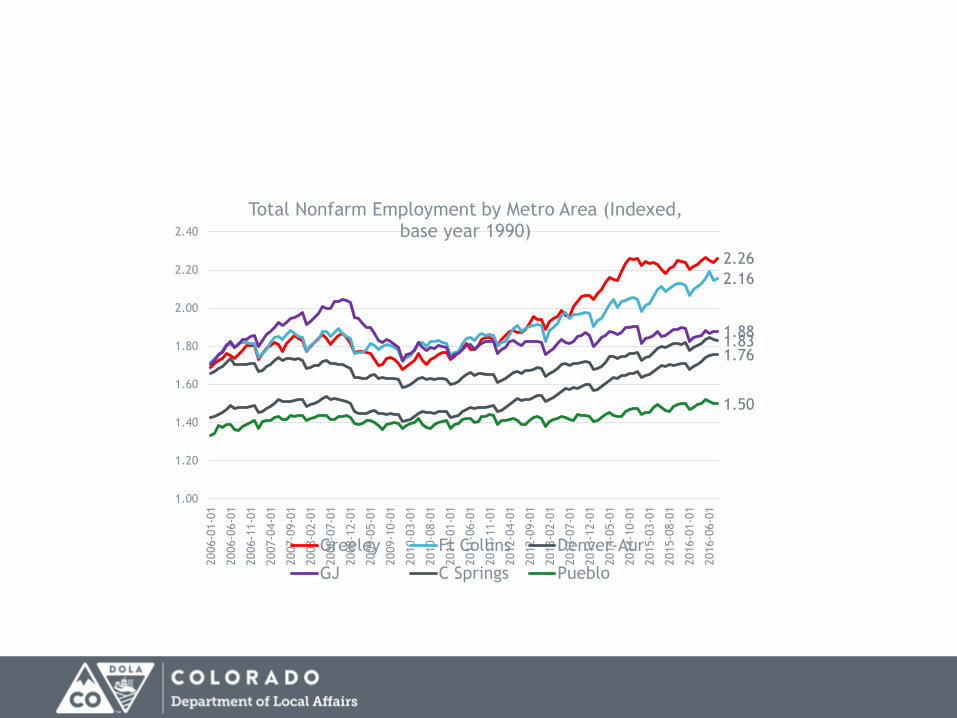
2.26
2.16
1.76
1.88 1.83
1.50
1.00
1.20
1.40
1.60
1.80
2.00
2.20
2.40
2006-0
1-0
1
2006-0
6-0
1
2006-1
1-0
1
2007-0
4-0
1
2007-0
9-0
1
2008-0
2-0
1
2008-0
7-0
1
2008-1
2-0
1
2009-0
5-0
1
2009-1
0-0
1
2010-0
3-0
1
2010-0
8-0
1
2011-0
1-0
1
2011-0
6-0
1
2011-1
1-0
1
2012-0
4-0
1
2012-0
9-0
1
2013-0
2-0
1
2013-0
7-0
1
2013-1
2-0
1
2014-0
5-0
1
2014-1
0-0
1
2015-0
3-0
1
2015-0
8-0
1
2016-0
1-0
1
2016-0
6-0
1
Total Nonfarm Employment by Metro Area (Indexed, base year 1990)
Greeley Ft Collins Denver-Aur
GJ C Springs Pueblo


12,468
1,872
7,117
883
0
2,000
4,000
6,000
8,000
10,000
12,000
14,000
2007q1
2007q2
200
7q
3
2007q4
2008q1
2008q2
2008q3
2008q4
2009q1
200
9q
2
2009q3
2009q4
2010q1
2010q2
2010q3
2010q4
2011q1
2011q2
2011q3
2011q4
2012q1
2012q2
2012q3
2012q4
2013q1
2013q2
2013q3
201
3q
4
2014q1
2014q2
2014q3
2014q4
2015q1
2015q2
2015q3
2015q4
2016q1
2016q2
Quarterly Foreclosure Totals in Colorado
Filings Sales

46,394
4,151
25,054
1,744
0
5,000
10,000
15,000
20,000
25,000
30,000
35,000
40,000
45,000
50,000
2003 2004 2005 2006 2007 2008 2009 2010 2011 2012 2013 2014 2015 2016(YTD)
Annual Foreclosure Totals
Filings
Sales

0
2000
4000
6000
8000
10000
12000
14000
1stQ 2ndQ 3rdQ 4thQ
Foreclosure Filings by Quarter
2007 2008 2009 2010 2011 2012 2013 2014 2015 2016

10,264
8,874
7,603 7,576
5,473
4,097
2,945 2,525
1,264 703 611
0
2,000
4,000
6,000
8,000
10,000
12,000
Number of Households Per Foreclosure Sale, 2nd Q 2016

0
10000
20000
30000
40000
50000
60000
70000
80000
Housing Units vs. Households
New Households Total Housing Units
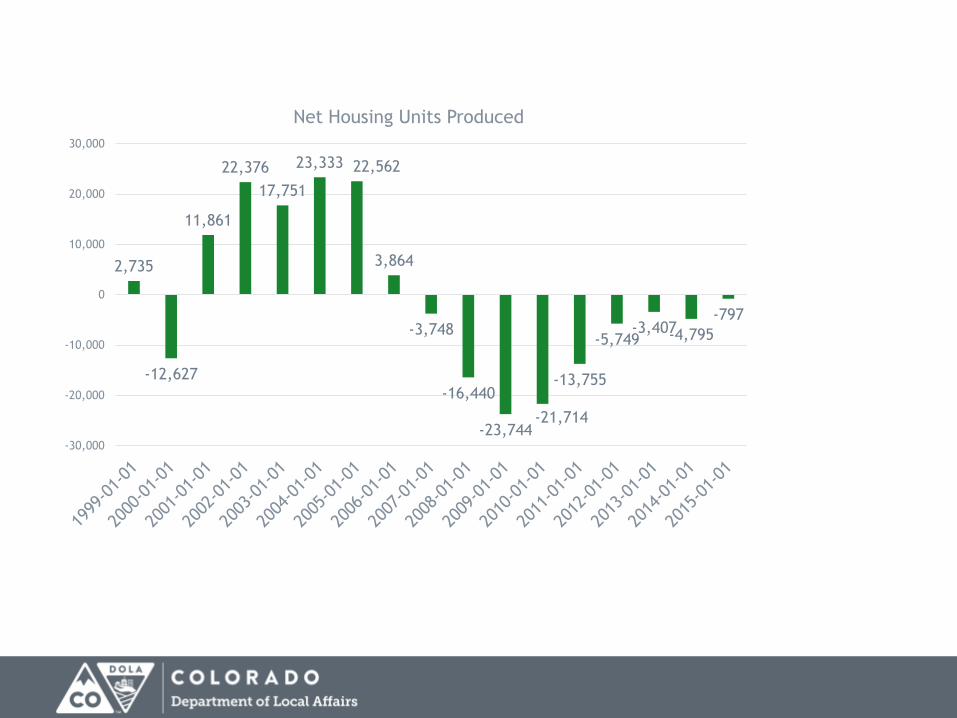
2,735
-12,627
11,861
22,376
17,751
23,333 22,562
3,864
-3,748
-16,440
-23,744 -21,714
-13,755
-5,749 -3,407 -4,795
-797
-30,000
-20,000
-10,000
0
10,000
20,000
30,000
Net Housing Units Produced
0
2
4
6
8
10
12
14
90
q1
91
q1
92
q1
93
q1
94
q1
95
q1
96
q1
97
q1
98
q1
99
q1
00
q1
01
q1
02
q1
03
q1
04
q1
05
q1
06
q1
07
q1
08
q1
09
q1
10
q1
11
q1
12
q1
13
q1
14
q1
15
q1
16
q1
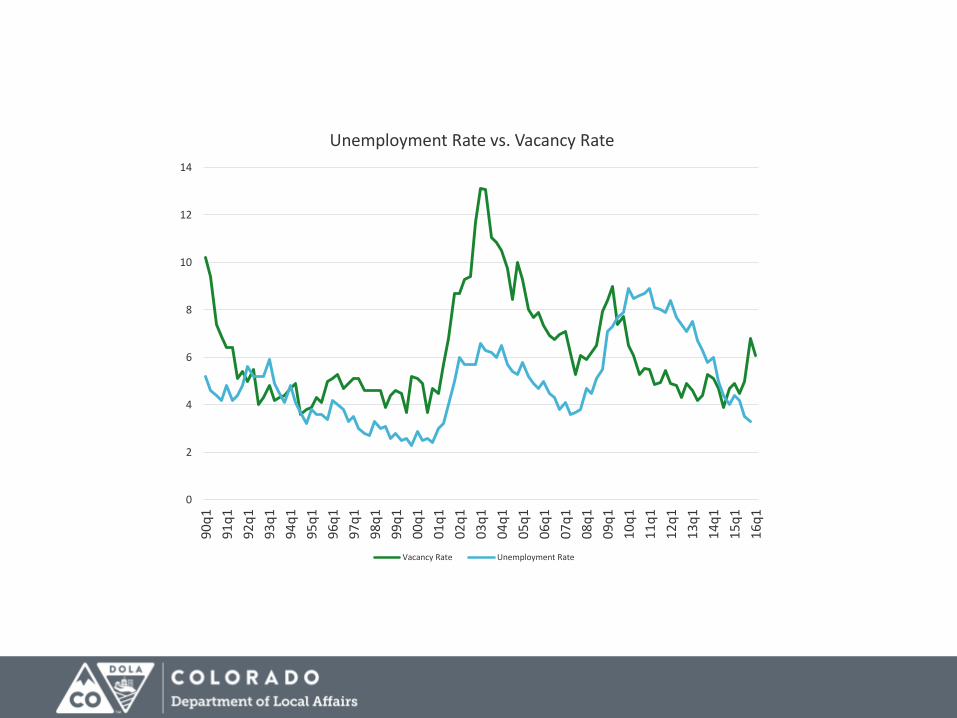
Unemployment Rate vs. Vacancy Rate
Vacancy Rate Unemployment Rate

0
200
400
600
800
1000
1200
1400
1600
81
q3
82
q1
82
q3
83
q1
83
q3
84
q1
84
q3
85
q1
85
q3
86
q1
86
q3
87
q1
87
q3
88
q1
88
q3
89
q1
89
q3
90
q1
90
q3
91
q1
91
q3
92
q1
92
q3
93
q1
93
q3
94
q1
94
q3
95
q1
95
q3
96
q1
96
q3
97
q1
97
q3
98
q1
98
q3
99
q1
99
q3
00
q1
00
q3
01
q1
01
q3
02
q1
02
q3
03
q1
03
q3
04
q1
04
q3
05
q1
05
q3
06
q1
06
q3
07
q1
07
q3
08
q1
08
q3
09
q1
09
q3
10
q1
10
q3
11
q1
11
q3
12
q1
12
q3
13
q1
13
q3
14
q1
14
q3
15
q1
15
q3
16
q1
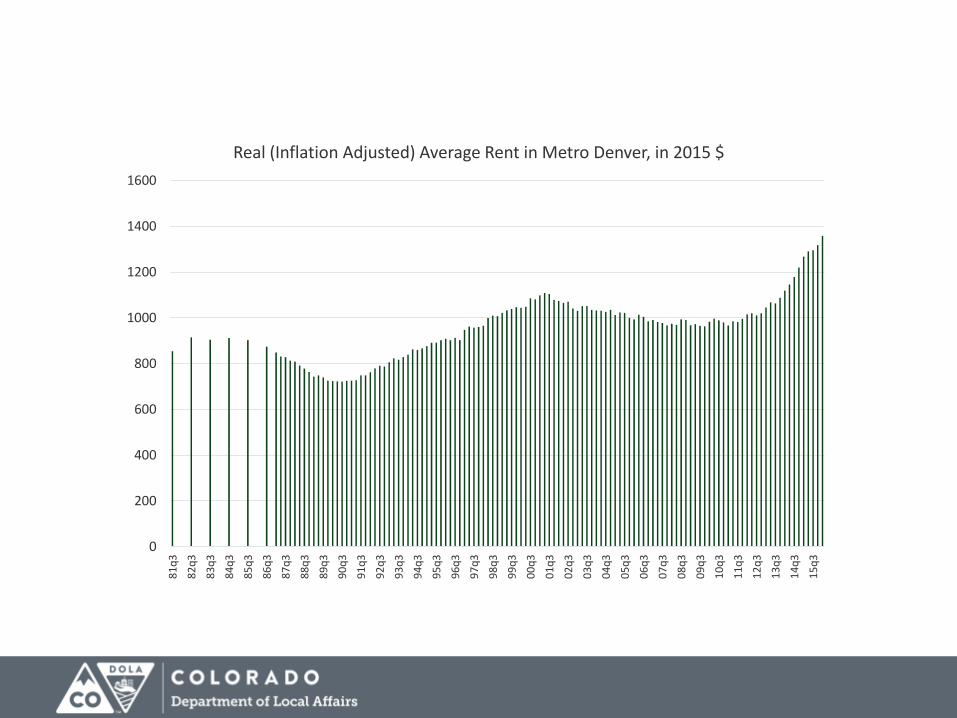
Average Rent in Metro Denver
0
200
400
600
800
1000
1200
1400
16008
1q
3
82
q3
83
q3
84
q3
85
q3
86
q3
87
q3
88
q3
89
q3
90
q3
91
q3
92
q3
93
q3
94
q3
95
q3
96
q3
97
q3
98
q3
99
q3
00
q3
01
q3
02
q3
03
q3
04
q3
05
q3
06
q3
07
q3
08
q3
09
q3
10
q3
11
q3
12
q3
13
q3
14
q3
15
q3
Real (Inflation Adjusted) Average Rent in Metro Denver, in 2015 $

8.9
9.8
8.4
9.1
9.9
4.5 4.2
5.4
11.1
2.2
5.2
10.6
4.5 4.6
5.9
1.6
2.1
3.7
5.4 5
2.1
3.5
2.9 2.6
0
2
4
6
8
10
12
Metro Den C Springs Pueblo Greeley Ft Collins GJ
2nd Q Apt Vacancy Rate, by %
2009 2013 2015 2016

-1.7
1.5 0.9
-0.2 -1.2
0.6
4.3 3.9
-5
7.9
0
-12.5
13.2
4.4
0.16
13.7
17.9
-1.1
8.3
10.2
11.6
4.2
0
-0.5
-15
-10
-5
0
5
10
15
20
Metro Den C Springs Pueblo Greeley Ft Collins GJ
% Growth in Average Rent
2009 2013 2015 2016


2,453,848 2,548,945
0
500,000
1,000,000
1,500,000
2,000,000
2,500,000
3,000,000
Colorado: Total Tax Return Filers

$21,825
$20,581
$18,881
$0
$5,000
$10,000
$15,000
$20,000
$25,000
2000200120022003200420052006200720082009201020112012201320142015
Colorado: Real Average Income Tax Collections, in $ per filer

0
100,000
200,000
300,000
400,000
500,000
600,000
Colorado: SNAP Recipients (Individuals Participating)


Panel Discussion Elizabeth Garner
State Demographer
Colorado Department of Local Affairs, State Demography Office
James Conner Economic and Market Analysis Division Field Director
HUD Region VIII – Rocky Mountain Region
Ryan McMaken Editor, Mises Wire and The Austrian
The Mises Institute
Panel Moderator
Alison O’Kelly CDBG-DR and NSP Programs Manager
Colorado Department of Local Affairs, Division of Housing
Open Discussion
and
Q&A
Did we address everything
in the Parking Lot?

A Visual Tour of Colorado’s
Regional Economies
Please fill out the
workshop evaluations.
Thank you for attending
Boot Camp Workshop #3