Embed Size (px)
Citation preview
Bachelor Informatica
A visual programming environ-ment for the Visualization Toolkitin Virtual Reality
Henk Dreuning
June 8, 2016
Supervisor: Robert Belleman
Signed:
Informatica—
Universiteit
vanAmst
erdam

2
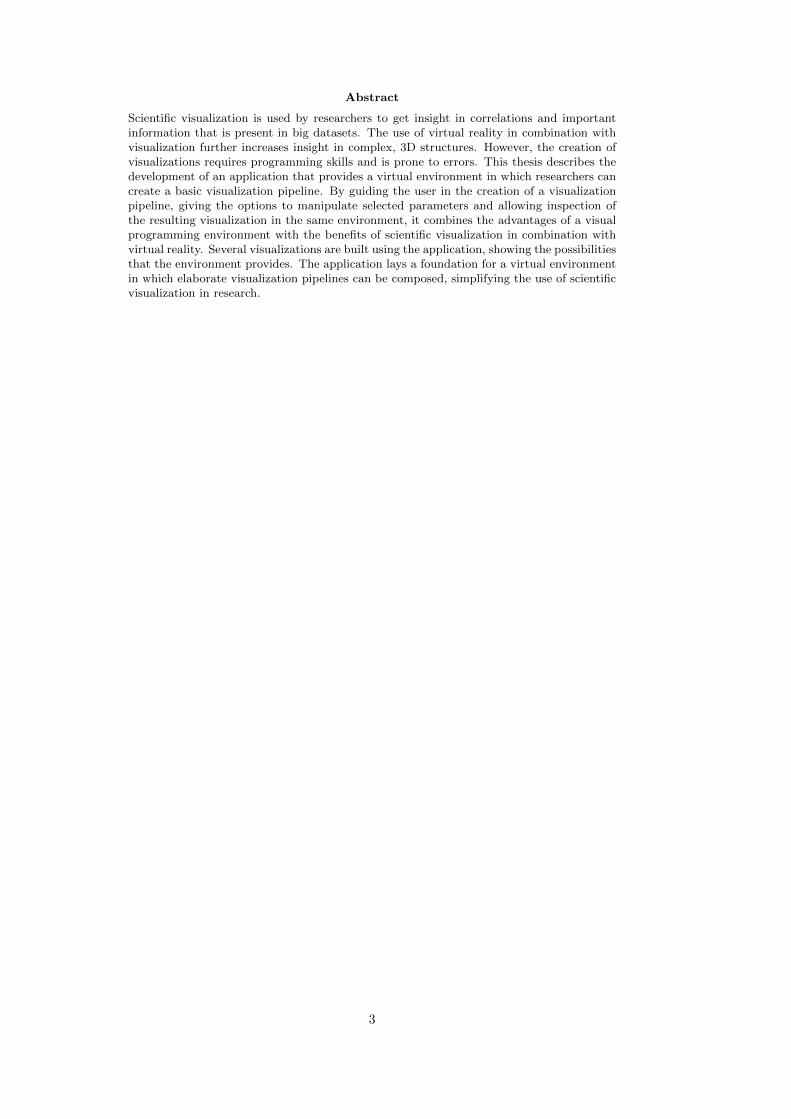
Abstract
Scientific visualization is used by researchers to get insight in correlations and importantinformation that is present in big datasets. The use of virtual reality in combination withvisualization further increases insight in complex, 3D structures. However, the creation ofvisualizations requires programming skills and is prone to errors. This thesis describes thedevelopment of an application that provides a virtual environment in which researchers cancreate a basic visualization pipeline. By guiding the user in the creation of a visualizationpipeline, giving the options to manipulate selected parameters and allowing inspection ofthe resulting visualization in the same environment, it combines the advantages of a visualprogramming environment with the benefits of scientific visualization in combination withvirtual reality. Several visualizations are built using the application, showing the possibilitiesthat the environment provides. The application lays a foundation for a virtual environmentin which elaborate visualization pipelines can be composed, simplifying the use of scientificvisualization in research.
3

4
Contents
1 Introduction 71.1 Related Work . . . . . . . . . . . . . . . . . . . . . . . . . . . . . . . . . . . . . . 71.2 Contribution . . . . . . . . . . . . . . . . . . . . . . . . . . . . . . . . . . . . . . 8
2 Design 92.1 External components . . . . . . . . . . . . . . . . . . . . . . . . . . . . . . . . . . 9
2.1.1 The Visualization Toolkit . . . . . . . . . . . . . . . . . . . . . . . . . . . 92.1.2 Oculus Rift . . . . . . . . . . . . . . . . . . . . . . . . . . . . . . . . . . . 102.1.3 OculusVTK . . . . . . . . . . . . . . . . . . . . . . . . . . . . . . . . . . . 10
2.2 Requirements . . . . . . . . . . . . . . . . . . . . . . . . . . . . . . . . . . . . . . 112.3 Exposing VTK’s API . . . . . . . . . . . . . . . . . . . . . . . . . . . . . . . . . . 122.4 Graphical user interface . . . . . . . . . . . . . . . . . . . . . . . . . . . . . . . . 122.5 Interaction . . . . . . . . . . . . . . . . . . . . . . . . . . . . . . . . . . . . . . . 132.6 Program architecture . . . . . . . . . . . . . . . . . . . . . . . . . . . . . . . . . . 14
3 Implementation 173.1 Python wrapping . . . . . . . . . . . . . . . . . . . . . . . . . . . . . . . . . . . . 173.2 Introspection of VTK . . . . . . . . . . . . . . . . . . . . . . . . . . . . . . . . . 17
3.2.1 The VTK class tree . . . . . . . . . . . . . . . . . . . . . . . . . . . . . . 183.2.2 During program execution . . . . . . . . . . . . . . . . . . . . . . . . . . . 20
3.3 The virtual environment . . . . . . . . . . . . . . . . . . . . . . . . . . . . . . . . 203.4 Rendering to the Oculus Rift . . . . . . . . . . . . . . . . . . . . . . . . . . . . . 233.5 Interaction . . . . . . . . . . . . . . . . . . . . . . . . . . . . . . . . . . . . . . . 23
4 Experiments 254.1 Visualizations . . . . . . . . . . . . . . . . . . . . . . . . . . . . . . . . . . . . . . 25
4.1.1 Visualization of an arrow . . . . . . . . . . . . . . . . . . . . . . . . . . . 254.1.2 Visualization of a disk . . . . . . . . . . . . . . . . . . . . . . . . . . . . . 264.1.3 Marching man . . . . . . . . . . . . . . . . . . . . . . . . . . . . . . . . . 264.1.4 Stream tracer . . . . . . . . . . . . . . . . . . . . . . . . . . . . . . . . . . 27
4.2 Performance . . . . . . . . . . . . . . . . . . . . . . . . . . . . . . . . . . . . . . . 30
5 Conclusion 335.1 Future work . . . . . . . . . . . . . . . . . . . . . . . . . . . . . . . . . . . . . . . 34
5.1.1 Method arguments . . . . . . . . . . . . . . . . . . . . . . . . . . . . . . . 345.1.2 Interaction . . . . . . . . . . . . . . . . . . . . . . . . . . . . . . . . . . . 345.1.3 Performance . . . . . . . . . . . . . . . . . . . . . . . . . . . . . . . . . . 345.1.4 Non-linear pipelines . . . . . . . . . . . . . . . . . . . . . . . . . . . . . . 34
Appendices 39
A Button scheme 41
B Test system specifications 43
5

6
CHAPTER 1
Introduction
Visualization provides a means to get insight in correlations and meaningful phenomena thatare present in big datasets, but are difficult to detect using existing algorithms. By visualizingthe data, the human mind can be put to use for making connections and discovering importantpieces of information that might otherwise have stayed undiscovered. Inspecting a visualizationin a virtual environment can make scientific visualization more accessible and interactive. This,together with the immersion that virtual reality (VR) provides, further increases insight in com-plex, 3D structures.
Visualizing a dataset consists of several steps that transform data from one representation toanother, until the desired end result is obtained. These steps can include reading input datafrom file, applying filters to this data and mapping it to a representation that can be renderedusing existing 3D computer graphics techniques.
The Visualization Toolkit (VTK) is a widely used, open source toolkit for creating visualiza-tion pipelines [16, 17]. VTK consists of a collection of objects that can be used to compose avisualization pipeline. Since recently, a visualization created with VTK can be viewed in VRwith the use of an extension to VTK called OculusVTK. However, OculusVTK does not en-able the user to build a visualization pipeline from within the virtual environment, making itinconvenient to use. This thesis addresses this issue.
1.1 Related Work
For classic desktop use, several applications exist that provide a method for composing a visual-ization pipeline with VTK.
MayaVi is a data visualization software package, which uses VTK at its base [5,8,14]. It aims tointegrate scientific Python libraries with TVTK, a “traits”-based wrapper for VTK. The func-tionality of MayaVi is presented both as a Python API and in the form of a graphical userinterface. The main goal of MayaVi is to provide easy and interactive visualization of data.
MeVisLab is a cross-platform commercial software framework for image processing and visual-ization, combining modules from the MeVis Image Processing Library, the Insight Segmentationand Registration Toolkit (ITK) and the Visualization Toolkit (VTK) [1,12,15]. The frameworkcan be used to build algorithms and applications, including graphical user interfaces with Qt,with the main focus lying on medical image processing.
The Delft Visualization and Image Processing Development Environment (DeVIDE) is a softwareframework that facilitates prototyping and experimentation with image processing and visual-ization algorithms [3, 11]. It incorporates multiple other libraries, including VTK, ITK, numpy
7
and matplotlib into one, by making techniques of all frameworks available to the user as DeVIDEmodules. These modules can be connected to each other and their variables can be changed atruntime, so the user is able to modify network characteristics and see the result immediately.DeVIDE provides a graphical representation of the visualization pipeline (or network) called the“Graph Editor”, in which the user can interact with the network.
Work has also been done to enable the use of VTK inside virtual environments.
Paul Rajlich created a VTK class named vtkActorToPF that translates a VTK actor (an objectvisible in a scene) into a node that the Iris Performer can use [10, 13]. The Iris Performer canthen be used to render the VTK visualization for use in the cave automatic virtual environment(CAVE).
A module was added to VTK lately to add support for viewing visualizations on OpenVRcompatible devices [9]. The module was tested on the HTC Vive virtual reality headset.
None of the mentioned solutions provide methods to compose a visualization from within avirtual environment, or viewing a visualization on the Oculus Rift virtual reality headset, whichwill be the targeted headset for this thesis.
1.2 Contribution
This thesis describes the design and implementation of a program that aims to combine the ad-vantages of using virtual reality in combination with scientific visualization with the advantagesof a visual programming environment for VTK. The ultimate goal of such a project would be tocreate a virtual environment in which the user can build and view a visualization pipeline andchange the variables of the objects that are part of this pipeline.
The research question that follows from the description above is:
How can an interactive virtual environment be created in which a visualization pipeline can beconstructed and modified?
The following chapter will discuss the design considerations for both the program’s componentsand its architecture. Chapter 3 will focus on the actual implementation of the environment andchapter 4 will explain the experiments that were performed together with their results. The lastchapter will contain the conclusions drawn from the experiments.
8
CHAPTER 2
Design
2.1 External components
2.1.1 The Visualization Toolkit
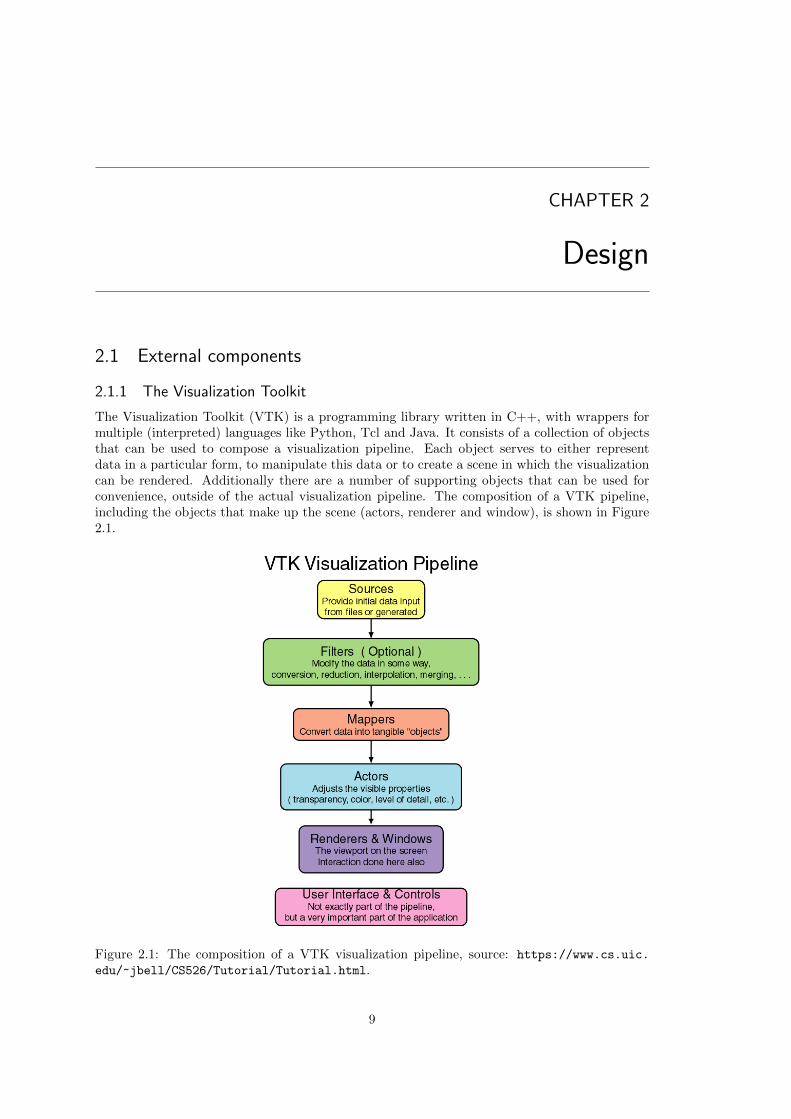
The Visualization Toolkit (VTK) is a programming library written in C++, with wrappers formultiple (interpreted) languages like Python, Tcl and Java. It consists of a collection of objectsthat can be used to compose a visualization pipeline. Each object serves to either representdata in a particular form, to manipulate this data or to create a scene in which the visualizationcan be rendered. Additionally there are a number of supporting objects that can be used forconvenience, outside of the actual visualization pipeline. The composition of a VTK pipeline,including the objects that make up the scene (actors, renderer and window), is shown in Figure2.1.
Figure 2.1: The composition of a VTK visualization pipeline, source: https://www.cs.uic.
edu/~jbell/CS526/Tutorial/Tutorial.html.
9
The use of VTK in scientific research can pose a number of inconveniences. A researcher thatwants to use VTK is obliged to have programming skills. If no programming knowledge is present,a fellow researcher will have to be called in to perform the implementation of the pipeline. Anumber of reviews and revisions are likely to be needed before the desired result is acquired.This can slow down the overall research progress.
The creation of a pipeline in VTK can be prone to errors. The programmer needs to instantiatethe correct objects for its visualization, set the correct parameter values for the end result tobe as expected and connect the appropriate input and output ports of various objects to eachother. When making these connections, VTK’s class hierarchy needs to be taken into account:one particular VTK object might not produce the correct type of output data, while one of itssubclasses does.
The aforementioned inconveniences in the use of VTK for scientific visualization could be solvedby introducing a visual programming environment for VTK. By presenting the VTK objects, thebuilding blocks of a pipeline, in a graphical way and presenting the options to change parame-ters and attributes of these objects in an intuitive way, the need for programming skills can beeliminated. This also gives the opportunity to guide the user in the decisions that need to bemade, by only giving the options for connecting objects that result in a correct pipeline.
2.1.2 Oculus Rift
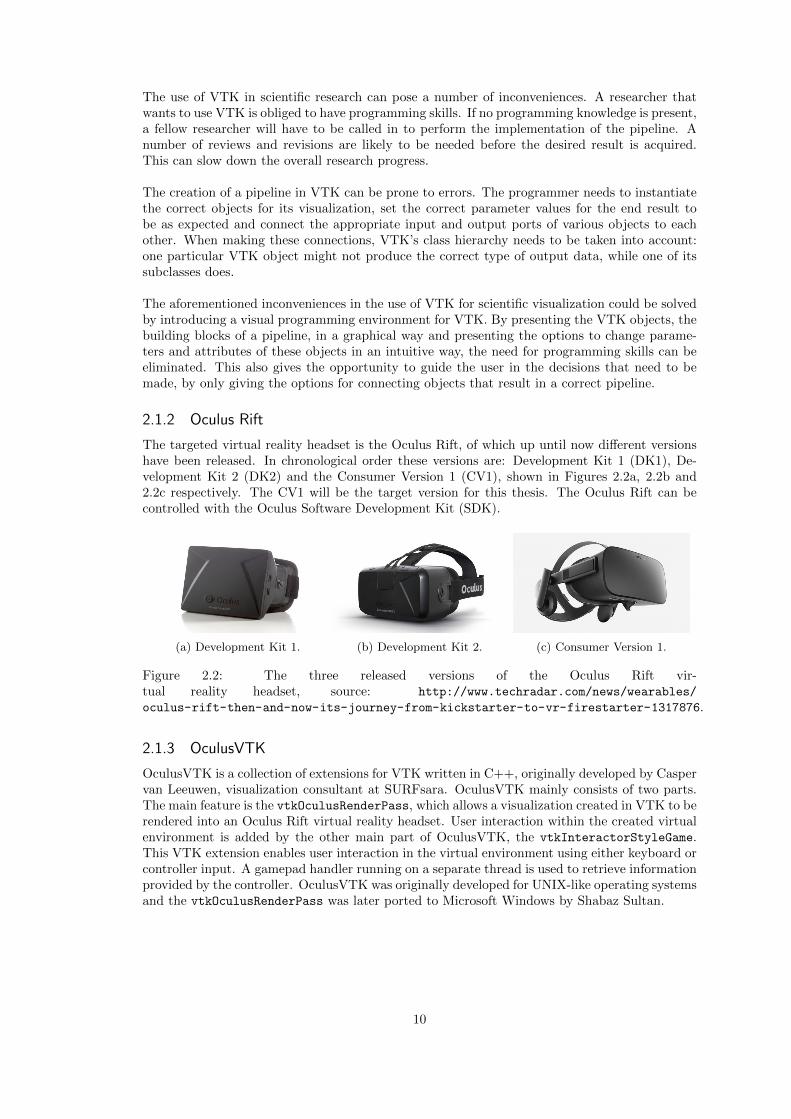
The targeted virtual reality headset is the Oculus Rift, of which up until now different versionshave been released. In chronological order these versions are: Development Kit 1 (DK1), De-velopment Kit 2 (DK2) and the Consumer Version 1 (CV1), shown in Figures 2.2a, 2.2b and2.2c respectively. The CV1 will be the target version for this thesis. The Oculus Rift can becontrolled with the Oculus Software Development Kit (SDK).
(a) Development Kit 1. (b) Development Kit 2. (c) Consumer Version 1.
Figure 2.2: The three released versions of the Oculus Rift vir-tual reality headset, source: http://www.techradar.com/news/wearables/
oculus-rift-then-and-now-its-journey-from-kickstarter-to-vr-firestarter-1317876.
2.1.3 OculusVTK
OculusVTK is a collection of extensions for VTK written in C++, originally developed by Caspervan Leeuwen, visualization consultant at SURFsara. OculusVTK mainly consists of two parts.The main feature is the vtkOculusRenderPass, which allows a visualization created in VTK to berendered into an Oculus Rift virtual reality headset. User interaction within the created virtualenvironment is added by the other main part of OculusVTK, the vtkInteractorStyleGame.This VTK extension enables user interaction in the virtual environment using either keyboard orcontroller input. A gamepad handler running on a separate thread is used to retrieve informationprovided by the controller. OculusVTK was originally developed for UNIX-like operating systemsand the vtkOculusRenderPass was later ported to Microsoft Windows by Shabaz Sultan.
10
2.2 Requirements
The ultimate goal of a project like this would be to create a virtual environment in which theuser can build and view any visualization pipeline and change the variables of the objects thatare part of this pipeline. The result of any changes would be immediately visible inside thevirtual environment, eliminating the need to repeatedly mount and dismount the VR headset.During the building process, the user would be guided in selecting appropriate building blocks,considering the current state of the pipeline. Interaction within the virtual environment shouldbe easily accessible and feel intuitive. Although virtual reality headsets are generally regardedunsuitable for prolonged use, the method of interaction should be comfortable enough to allowusage as long as needed to build (parts of) a pipeline.
Creating a virtual environment as sketched above poses a number of challenges, ranging fromexposing the VTK API to the user to UI design to user interaction. The goal for this thesis isto create an environment that serves as a base for the described environment, including aspectsof all challenges involved. A user should be able to create a relatively simple, linear pipelineconsisting of VTK objects, be guided in the creation by filtering objects that are to be added tothe pipeline and be able to change most variables of basic type (integer, floating point). The usershould be able to perform these tasks, together with the inspection of the resulting visualization,without leaving the virtual environment.
Summarizing, the functional requirements for the software are that the user must be able toperform the following tasks in the virtual environment:
1. Select VTK objects as building blocks for a visualization pipeline;
2. Build a linear visualization pipeline;
3. Inspect a graphical representation of the visualization pipeline;
4. Modify parameters of VTK objects that are of a basic type: integer or floating point;
5. Inspect the visualization resulting from the composed pipeline.
Also,
6. The VTK objects that a user can pick must be filtered to ones that accept the previousobject’s output data as input data.
7. The input method must be comfortable for prolonged use.
8. The user should not have to leave the virtual environment during the creation of the pipelineor inspection of the resulting visualization.
9. The performance of the application while using the graphical user interface must be on acomfortable level.
The targeted operating system is Microsoft Windows and the application should be usable withthe Oculus Rift Consumer Version 1 (CV1).
The stated requirements pose three main problems to be solved:
• How can the API of VTK be exposed to the user, while ensuring that the pipelines builtwith it are valid?
• How can a graphical user interface be created in the virtual environment, while simultane-ously being able to show the visualization built by the user?
• How can user interaction be added to the virtual environment?
The following three sections explain the decisions made regarding these problems. The lastsection provides an overview of the application’s architecture.
11
2.3 Exposing VTK’s API
In order to expose the API of VTK to the user in a graphical manner, a method must be foundthat can automatically determine all classes in VTK. Some characteristics of these classes mustbe determined to know which classes are actually usable for the end user. There must be a meansto determine which VTK objects can be connected to other VTK objects to ensure valid pipelineconfigurations. Finally, it must be able to find out which manipulations can be performed onVTK objects using its methods.
The introspection capabilities of interpreted languages like Python provide means to performthe desired operations. VTK has wrappers for Python, Tcl and Java. Python was chosen as thelanguage to use.
2.4 Graphical user interface
A graphical user interface can generally speaking be implemented in several ways. For use withthe application at hand, two requirements must be met: the method must work in combinationwith VTK and it must work in combination with the vtkOculusRenderPass. Also the difficultyof implementation is taken into account. Some options and the reasons why they are or are notsuitable for the application are discussed.
For classic desktop use, GUI toolkits like Tk or Qt can be used to build a user interface. VTKintegrates a number of these toolkits, so their use in combination with VTK poses no problems.They cannot be used in combination with the vtkOculusRenderPass however, as the renderpass needs to integrate the GUI into the OpenGL context it uses to render to the Oculus Rift.GUI toolkits either make use of a graphics library that cannot be integrated with OpenGL, ordo not allow other applications to use their graphics context. GUI toolkits would make theimplementation of a user interface relatively easy.
Game engines can be used to create graphical user interfaces as well. Whether or not a gameengine interferes with VTK is dependent on the internal workings of the engine. The render passis not ready to be used in combination with a game engine. Further changes to the render passwould be necessary to facilitate this, if at all possible. The implementation of a GUI in a gameengine would be on a relatively high level.
Another option is to create a UI in OpenGL. Because VTK also uses OpenGL to render thevisualization that the user created, the two applications can change OpenGL states without eachother’s notice. This can cause the applications to interfere. After slight modifications, the renderpass should be able to display a GUI built with OpenGL. A disadvantage of this option wouldbe that the implementation is on a relatively low level.
VTK itself can be used to create a user interface. Although several 2D and 3D widgets ex-ist, they are not meant for use in a virtual environment. Using (simple) shapes like planes andcubes that VTK provides “source” objects for, a user interface more appropriate for VR can bebuilt. This method poses no problems regarding the render pass, as it is created to render VTKvisualizations. A disadvantage of this option is that it, as opposed to GUI toolkits and gameengines, requires a relatively low level implementation.
Table 2.1 systematically shows the requirements that were and were not met by the consid-ered methods. With VTK itself being the only reasonable option, this was chosen as the methodto build the graphical user interface.
12
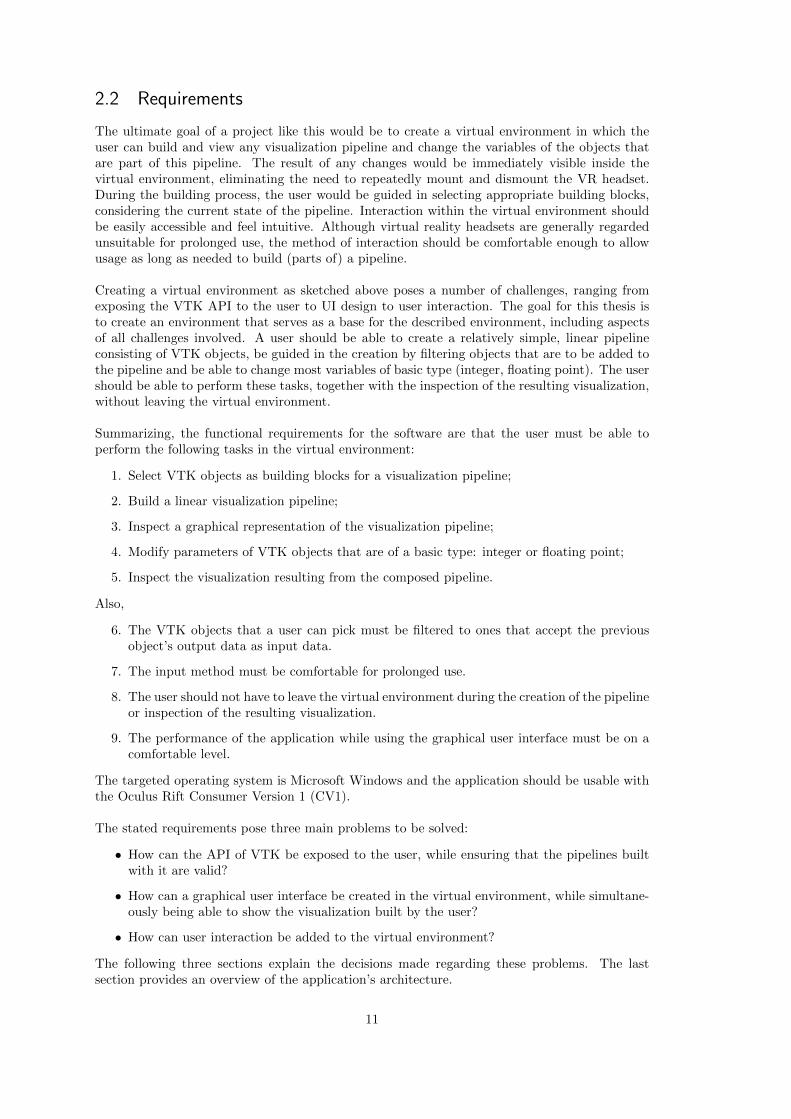
Table 2.1: Requirements that were met and implementational difficulty for all considered methodsto build a graphical user interface.
GUI toolkit Game engine OpenGL VTK
Does not interfere with VTK YesDepends oninternal workings
No Yes
Works with vtkOculusRenderPass No No After modification YesImplementational difficulty Easy Easy Hard Hard
2.5 Interaction
Several options for the method of interaction can be considered. Their advantages and disad-vantages are described here, leading to the decision that was made.
The most general and easy to implement method for interaction is traditional keyboard in-put. This would not require additional software or add implementation complexity on the levelof the application itself, and input of various forms, like (floating point) numbers and text, ispossible in the same way as for a normal desktop program. However, reaching the correct keyson the keyboard can be difficult with a VR headset mounted on one’s head, especially when theperson in question is not able to “touch type”. This forms a major drawback for use in a VRenvironment.
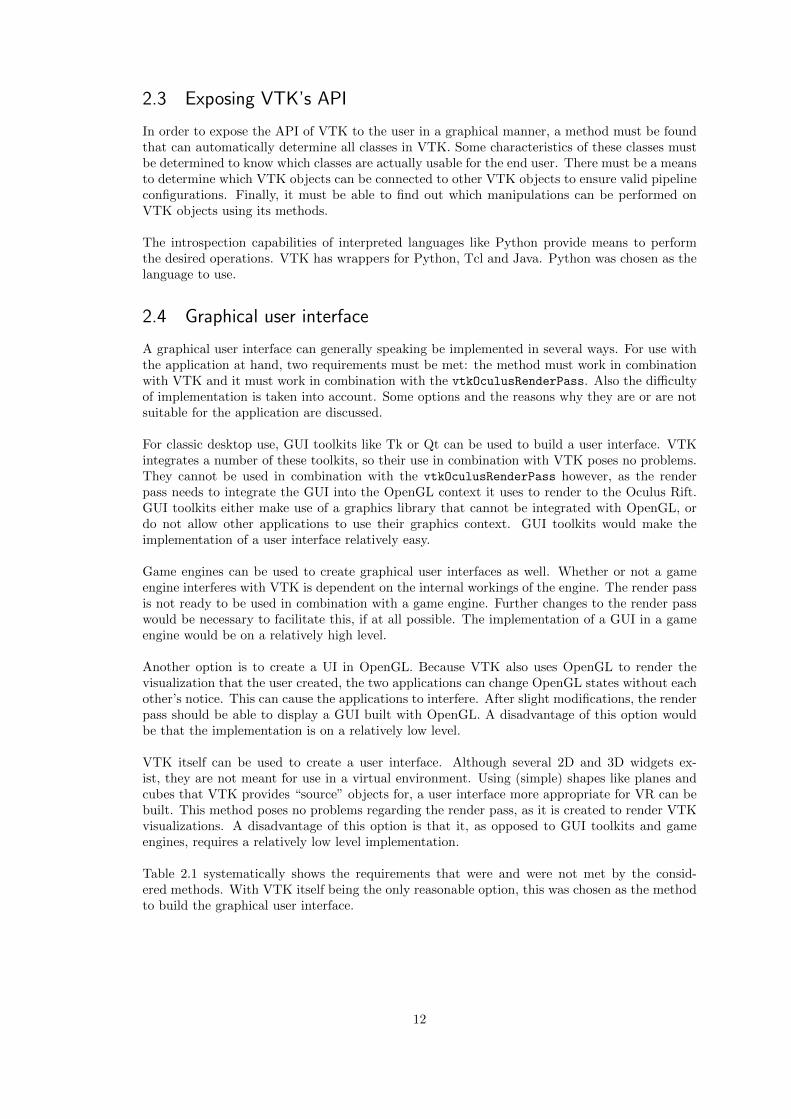
Another option is the use of a gamepad (see Figure 2.3a), which is easy for the user to keepin its hands with a VR headset mounted. The analog sticks allow for easy movement throughthe virtual environment, and the gamepad is suitable for prolonged use. The integration of agamepad into the application requires some programming logic on the application level and pos-sibly the use of an external library, but the extra effort needed is still relatively small. The inputof text and numbers is difficult using a gamepad.
The most advanced option that was considered is the Leap Motion Controller, a USB periph-eral device that is mounted on the front of the VR headset, as shown in Figure 2.3b [4]. Thecontroller registers the position and orientation of the user’s hands, and makes this informationavailable to the developer via an API. This way, a method of interaction is possible that utilizesthe 3-dimensional characteristics of the virtual environment. This can result in a highly intuitivemethod of interaction, given the similarities with interaction in the real world. However, theimplementation is more complex than that of the other input methods considered, and the inputof numbers and text, as well as movement though the environment can be difficult. Finally, theother options will provide better stability than this one.
(a) A gamepad (Xbox controller), source:http://www.xbox.com/en-US/xbox-360/
accessories/controllers.
(b) A Leap Motion Controller mountedon the front of an Oculus Rift CV1,source: http://store-us.leapmotion.com/
products/universal-vr-mount-pre-order.
Figure 2.3: Two considered methods of interaction: a gamepad (Xbox controller) on the left andthe Leap Motion Controller on the right.
13
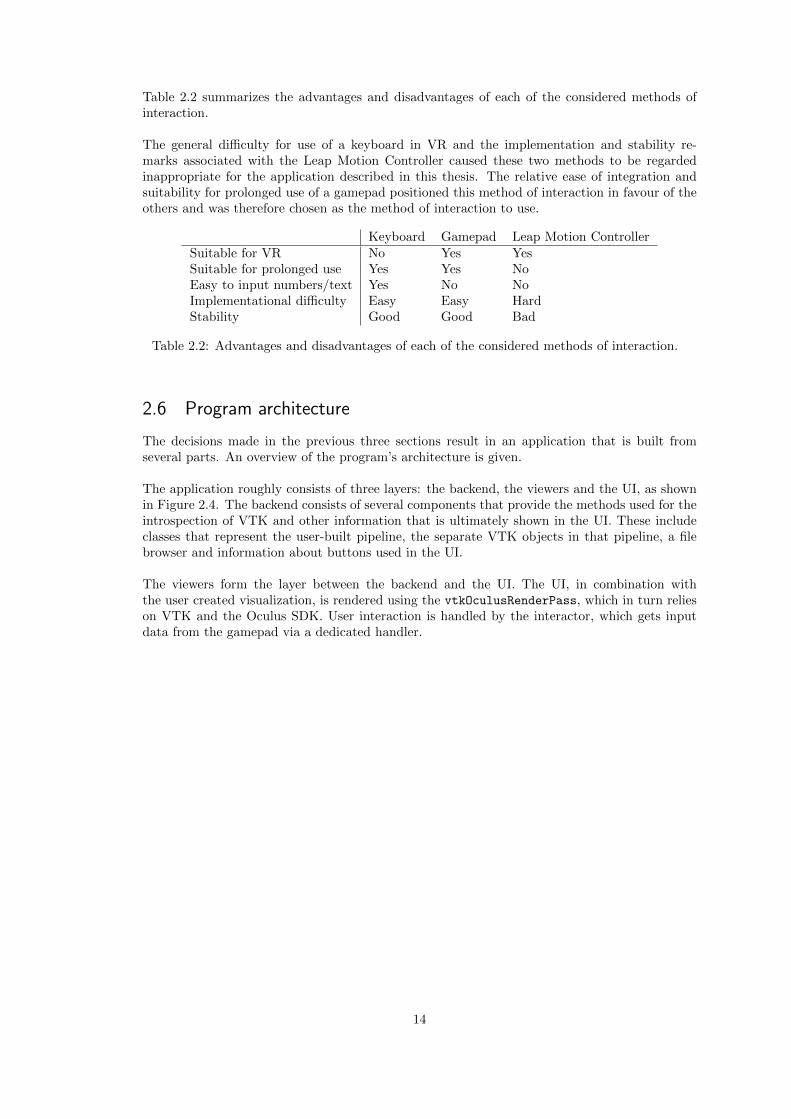
Table 2.2 summarizes the advantages and disadvantages of each of the considered methods ofinteraction.
The general difficulty for use of a keyboard in VR and the implementation and stability re-marks associated with the Leap Motion Controller caused these two methods to be regardedinappropriate for the application described in this thesis. The relative ease of integration andsuitability for prolonged use of a gamepad positioned this method of interaction in favour of theothers and was therefore chosen as the method of interaction to use.
Keyboard Gamepad Leap Motion ControllerSuitable for VR No Yes YesSuitable for prolonged use Yes Yes NoEasy to input numbers/text Yes No NoImplementational difficulty Easy Easy HardStability Good Good Bad
Table 2.2: Advantages and disadvantages of each of the considered methods of interaction.
2.6 Program architecture
The decisions made in the previous three sections result in an application that is built fromseveral parts. An overview of the program’s architecture is given.
The application roughly consists of three layers: the backend, the viewers and the UI, as shownin Figure 2.4. The backend consists of several components that provide the methods used for theintrospection of VTK and other information that is ultimately shown in the UI. These includeclasses that represent the user-built pipeline, the separate VTK objects in that pipeline, a filebrowser and information about buttons used in the UI.
The viewers form the layer between the backend and the UI. The UI, in combination withthe user created visualization, is rendered using the vtkOculusRenderPass, which in turn relieson VTK and the Oculus SDK. User interaction is handled by the interactor, which gets inputdata from the gamepad via a dedicated handler.
14
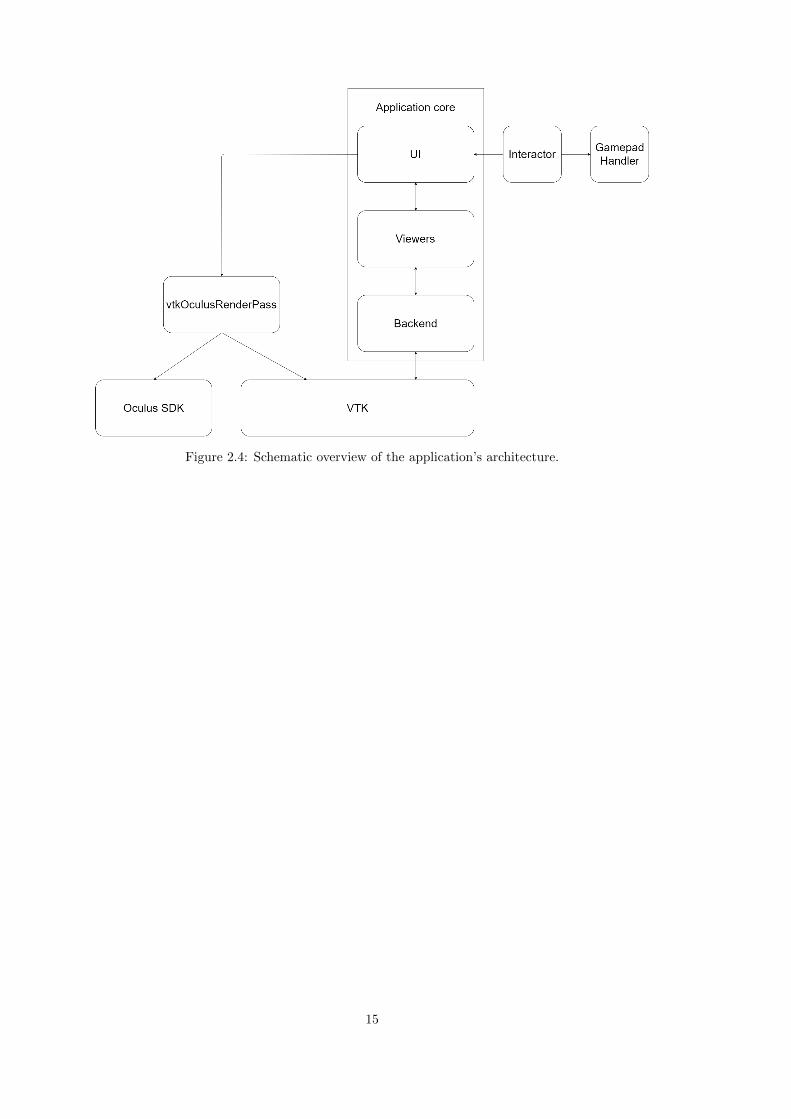
Figure 2.4: Schematic overview of the application’s architecture.
15

16
CHAPTER 3
Implementation
This chapter discusses the implementation of the VR application. First some general informationis provided, after which the introspection of VTK, the UI, the rendering to the Oculus Rift andthe implementation of the method of interaction will be covered in their respective sections.
As mentioned before, the introspection capabilities of the Python programming language areused to determine the characteristics of VTK objects that are needed to, in the end, providethe user with the options that VTK offers in a graphical manner. Not only the introspection ofVTK, but also the rest of the application was implemented in Python.
3.1 Python wrapping
Both the vtkOculusRenderPass, other components of OculusVTK (gamepadHandler andvtkInteractorStyleGame) and the Oculus SDK are written in C++. To use these componentsin the application Python wrappers have to be generated, for which several options exist.
• VTK uses its own wrapping system to generate Python wrappers for VTK objects. Thiswrapping system can also be used to wrap VTK objects that extend the VTK source code,like the vtkOculusRenderPass.
• A wrapper can be generated using a library such as Boost.Python [2].
To ensure compatibility with the rest of VTK, the VTK wrapping system was used to createwrappers for the vtkOculusRenderPass. The use of this system poses one inconvenience however:the initialization of the Oculus Rift is done outside of the render pass, while the Oculus SDK isalso written in C++ and is therefore not accessible in Python. To resolve this, a method calledInitOVR was added to the vtkOculusRenderPass object, which handles the initialization of theVR headset. Finally, the VTK wrapping system makes this method available in Python.
3.2 Introspection of VTK
The introspection of VTK consists of several parts. From a user perspective, two actions requireintrospection of VTK: adding an element to the pipeline and editing an existing pipeline element.When adding a new VTK object to the pipeline, the options should be limited to only thoseVTK objects that accept the output of the previous object in the pipeline as input. Also, theuser should be able to filter the objects it can choose from by category. When editing a pipelineobject, the editable parameters of that VTK object must be shown. Ultimately, this results in anumber of introspection tasks that need to be performed:
• Select VTK objects with the correct number of input and/or output ports.
17
• Given the output of the previous VTK object in the pipeline, select the possible successingVTK objects.
• Categorize VTK objects.
• Retrieve, parse and use the methods of a VTK object to change parameters.
The approach used for each of these subjects will be discussed.
3.2.1 The VTK class tree
At the beginning of the execution of the application, before the virtual environment is created,a class tree is built for VTK. This class tree starts at vtkAlgorithm and recursively traverses allof its subclasses. For each VTK class, a TreeObject is created that represents the class. Severalcharacteristics of the class are determined and stored in the wrapper object:
• Whether the VTK class is a concrete or an abstract class. VTK classes that are definedas being abstract in the C++ source code are not defined as such in the Python wrapper.Instead, the init method (“constructor”) of the Python VTK object raises an exceptionwhen called. This means that no reflective method can be used to find out if a VTK classis abstract or not. Instead, an instance of the class is created inside a try-except block,with the catch of an exception indicating that the class is abstract.
• If the VTK class is abstract, store whether it is implemented, i.e. if one or more of itssubclasses is concrete. Using the information gathered about which classes are abstract
and which are concrete in combination with the recursive nature of building the class tree,this characteristic can be easily determined.
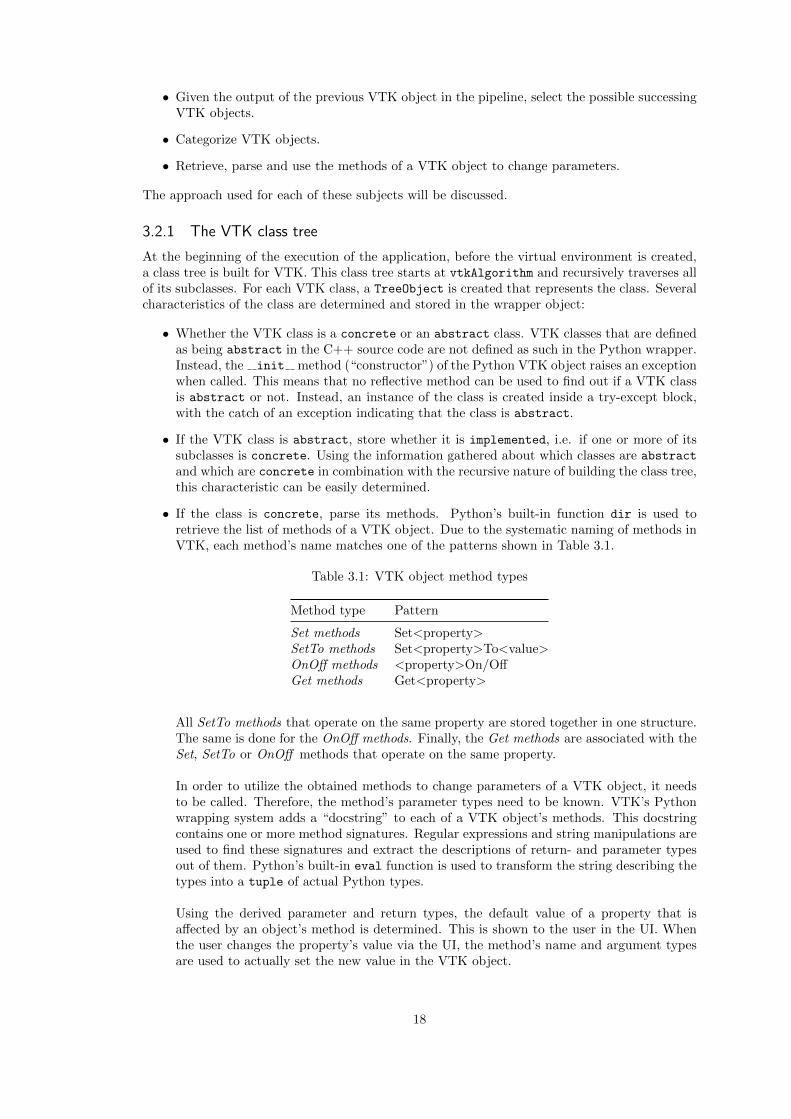
• If the class is concrete, parse its methods. Python’s built-in function dir is used toretrieve the list of methods of a VTK object. Due to the systematic naming of methods inVTK, each method’s name matches one of the patterns shown in Table 3.1.
Table 3.1: VTK object method types
Method type Pattern
Set methods Set<property>SetTo methods Set<property>To<value>OnOff methods <property>On/OffGet methods Get<property>
All SetTo methods that operate on the same property are stored together in one structure.The same is done for the OnOff methods. Finally, the Get methods are associated with theSet, SetTo or OnOff methods that operate on the same property.
In order to utilize the obtained methods to change parameters of a VTK object, it needsto be called. Therefore, the method’s parameter types need to be known. VTK’s Pythonwrapping system adds a “docstring” to each of a VTK object’s methods. This docstringcontains one or more method signatures. Regular expressions and string manipulations areused to find these signatures and extract the descriptions of return- and parameter typesout of them. Python’s built-in eval function is used to transform the string describing thetypes into a tuple of actual Python types.
Using the derived parameter and return types, the default value of a property that isaffected by an object’s method is determined. This is shown to the user in the UI. Whenthe user changes the property’s value via the UI, the method’s name and argument typesare used to actually set the new value in the VTK object.
18
At this moment only parameters that are of integer or floating point type are made avail-able to the user, as described in the next section. The described methodology to extractmethods, their signatures and parameter- and return types is capable of detecting othertypes as well, like booleans, VTK class types and with additional manual mapping alsostrings and tuples. In order to use these types, support should be added to the UI andthe application’s backend.
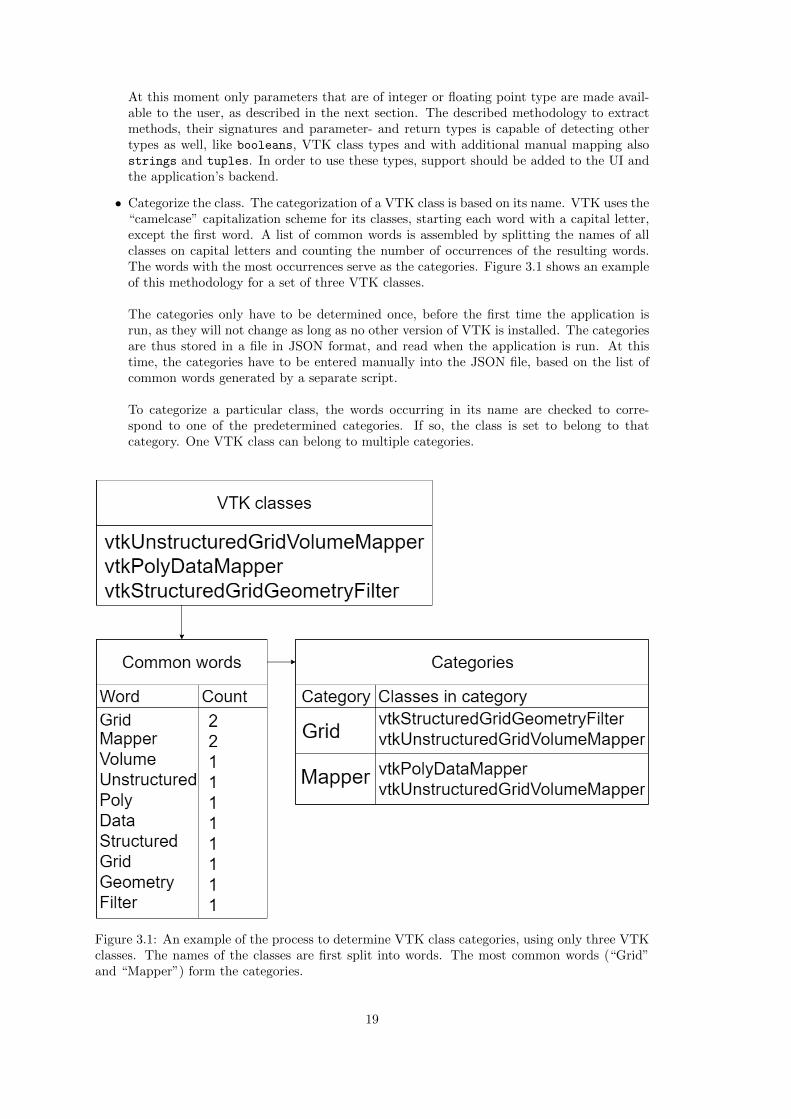
• Categorize the class. The categorization of a VTK class is based on its name. VTK uses the“camelcase” capitalization scheme for its classes, starting each word with a capital letter,except the first word. A list of common words is assembled by splitting the names of allclasses on capital letters and counting the number of occurrences of the resulting words.The words with the most occurrences serve as the categories. Figure 3.1 shows an exampleof this methodology for a set of three VTK classes.
The categories only have to be determined once, before the first time the application isrun, as they will not change as long as no other version of VTK is installed. The categoriesare thus stored in a file in JSON format, and read when the application is run. At thistime, the categories have to be entered manually into the JSON file, based on the list ofcommon words generated by a separate script.
To categorize a particular class, the words occurring in its name are checked to corre-spond to one of the predetermined categories. If so, the class is set to belong to thatcategory. One VTK class can belong to multiple categories.
Figure 3.1: An example of the process to determine VTK class categories, using only three VTKclasses. The names of the classes are first split into words. The most common words (“Grid”and “Mapper”) form the categories.
19
3.2.2 During program execution
After the VTK class tree has been built, two actions can be performed that either make use ofthe information stored in the tree, or require additional introspection of VTK objects.
Adding an object to the pipeline. The user is presented with a list of concrete VTK classesfrom which a new pipeline object can be chosen. Next to that list the categories are shown, serv-ing as filters for the VTK classes to choose from. The VTK classes that pass the categoryfilter can not necessarily be appended to the pipeline. Therefore, these classes are tested tocontain the correct number of input ports (zero if no items are currently in the pipeline, moreotherwise) and to accept the output data of the previous object in the pipeline as their input data.
The output of one VTK object is set as the input of another object using output ports andinput connections. Although the methods that are used to connect two VTK objects provideinformation about the types of their parameters and return value, this information is too generalto determine if the two objects can be connected. To resolve this, each object that passes the cat-egory filters is tested to accept the output port of the previous object in the pipeline by actuallyperforming the connect operation on dummy nodes of the same types. An error handler class isset up to observe VTK’s “ErrorEvent” and “WarningEvent”, which serve as an indication thatthe input port and output connection of two classes cannot be connected. The result is cachedfor future use.
Editing an existing object. When editing an existing VTK object in the pipeline, themethods that were parsed are used to show a list of editable parameters and their current values.After changing a parameter’s value, the corresponding “set” method is called to commit thechange and the “get” method is used to confirm and store the new value.
3.3 The virtual environment
The information extracted from VTK is shown to the user in a graphical user interface at the ap-propriate time. This section will discuss the graphical way in which this information is presented.
The virtual environment consists of three visible items. A visualization of the current stateof the pipeline, a UI plane which shows a graphical user interface and the visualization createdby the user itself. An overview of the scene is shown in Figure 3.2.
20
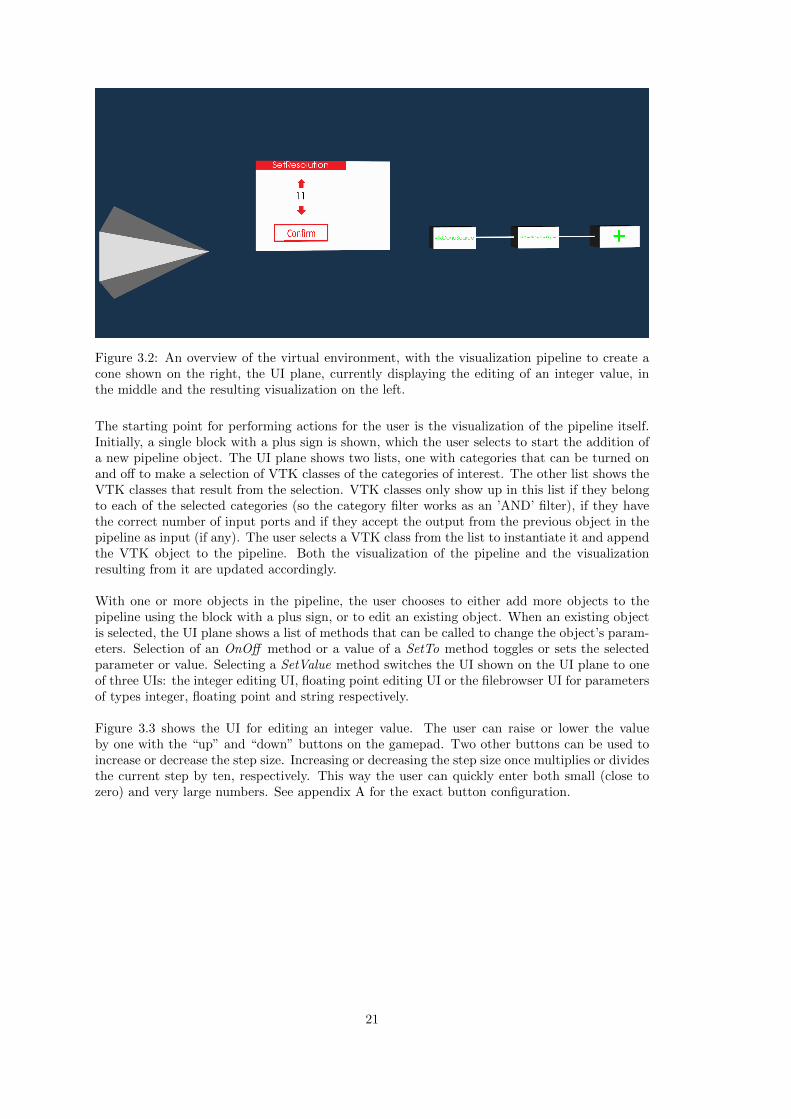
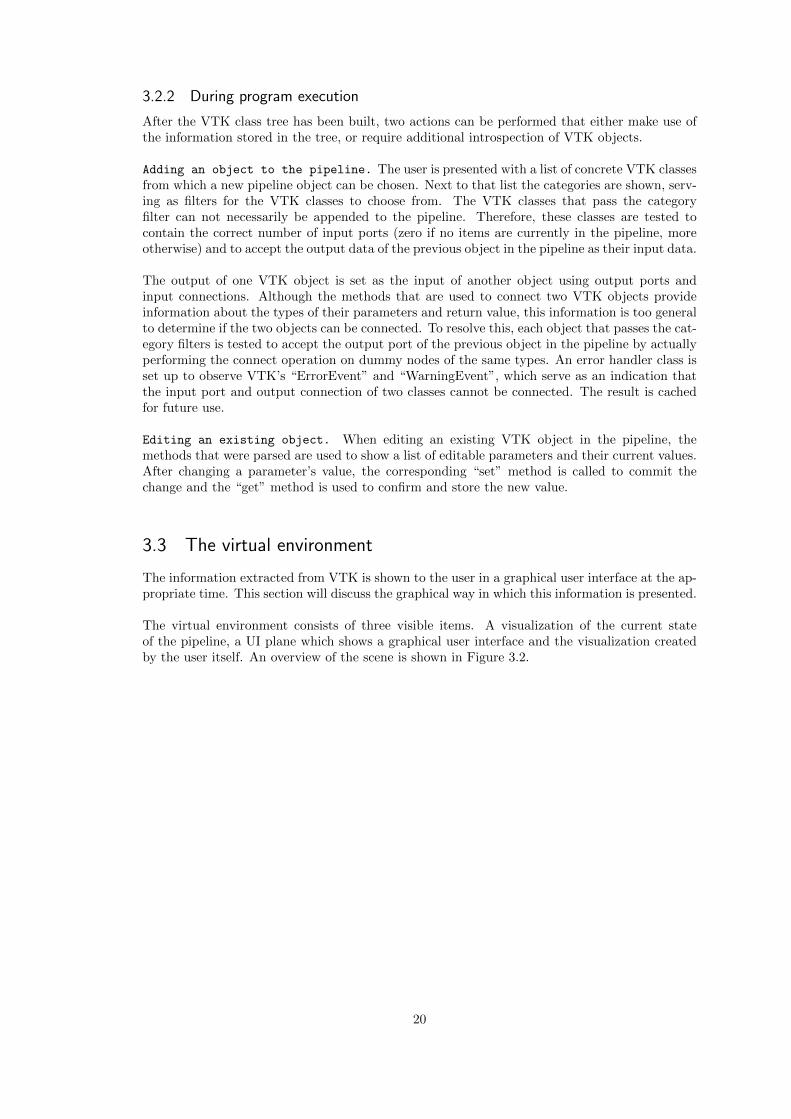
Figure 3.2: An overview of the virtual environment, with the visualization pipeline to create acone shown on the right, the UI plane, currently displaying the editing of an integer value, inthe middle and the resulting visualization on the left.
The starting point for performing actions for the user is the visualization of the pipeline itself.Initially, a single block with a plus sign is shown, which the user selects to start the addition ofa new pipeline object. The UI plane shows two lists, one with categories that can be turned onand off to make a selection of VTK classes of the categories of interest. The other list shows theVTK classes that result from the selection. VTK classes only show up in this list if they belongto each of the selected categories (so the category filter works as an ’AND’ filter), if they havethe correct number of input ports and if they accept the output from the previous object in thepipeline as input (if any). The user selects a VTK class from the list to instantiate it and appendthe VTK object to the pipeline. Both the visualization of the pipeline and the visualizationresulting from it are updated accordingly.
With one or more objects in the pipeline, the user chooses to either add more objects to thepipeline using the block with a plus sign, or to edit an existing object. When an existing objectis selected, the UI plane shows a list of methods that can be called to change the object’s param-eters. Selection of an OnOff method or a value of a SetTo method toggles or sets the selectedparameter or value. Selecting a SetValue method switches the UI shown on the UI plane to oneof three UIs: the integer editing UI, floating point editing UI or the filebrowser UI for parametersof types integer, floating point and string respectively.
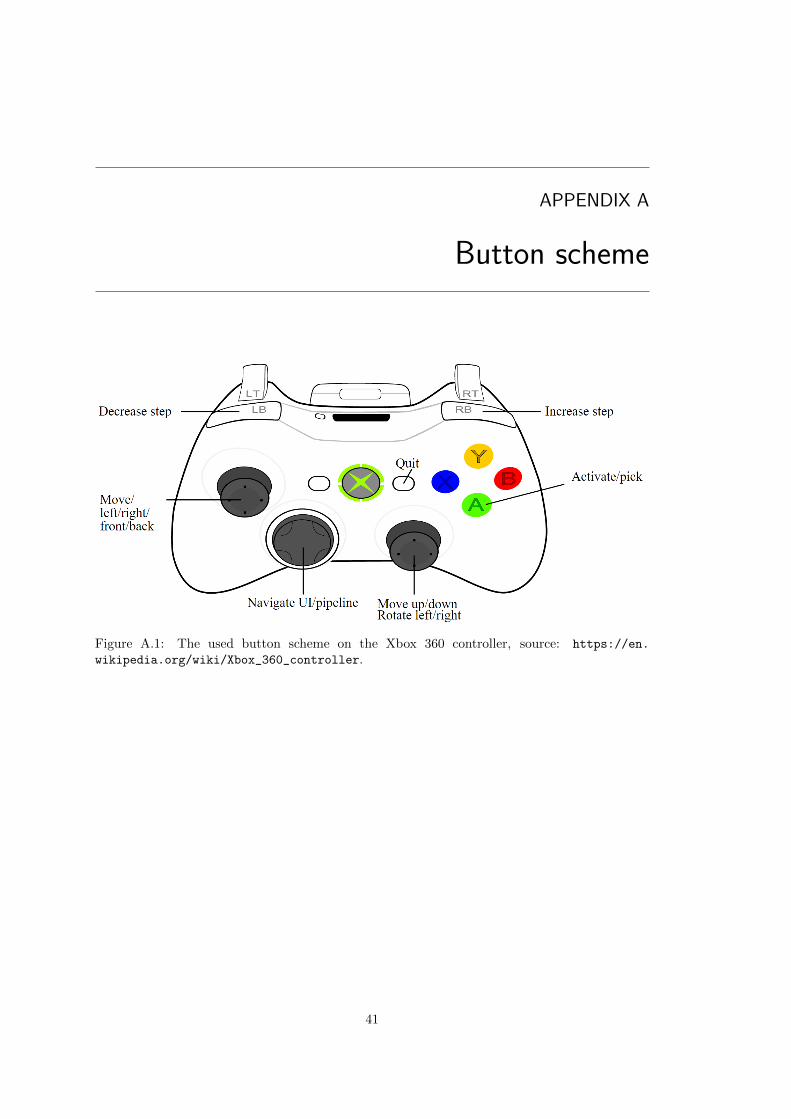
Figure 3.3 shows the UI for editing an integer value. The user can raise or lower the valueby one with the “up” and “down” buttons on the gamepad. Two other buttons can be used toincrease or decrease the step size. Increasing or decreasing the step size once multiplies or dividesthe current step by ten, respectively. This way the user can quickly enter both small (close tozero) and very large numbers. See appendix A for the exact button configuration.
21
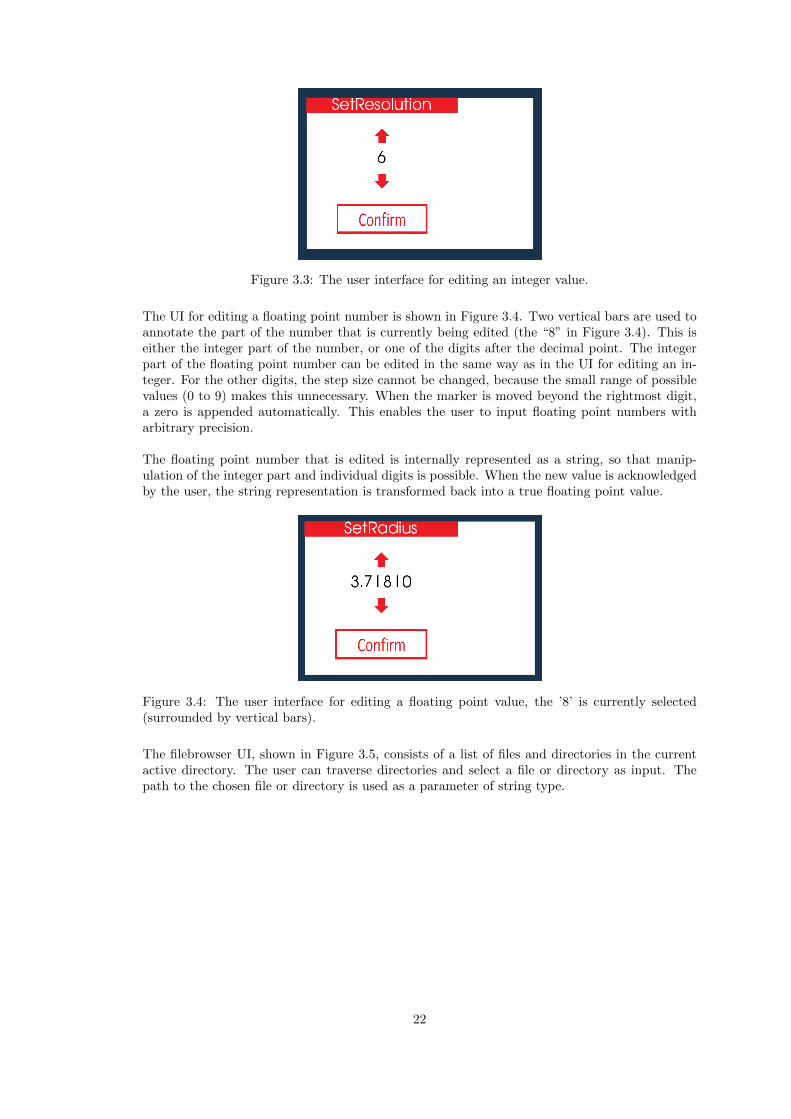
Figure 3.3: The user interface for editing an integer value.
The UI for editing a floating point number is shown in Figure 3.4. Two vertical bars are used toannotate the part of the number that is currently being edited (the “8” in Figure 3.4). This iseither the integer part of the number, or one of the digits after the decimal point. The integerpart of the floating point number can be edited in the same way as in the UI for editing an in-teger. For the other digits, the step size cannot be changed, because the small range of possiblevalues (0 to 9) makes this unnecessary. When the marker is moved beyond the rightmost digit,a zero is appended automatically. This enables the user to input floating point numbers witharbitrary precision.
The floating point number that is edited is internally represented as a string, so that manip-ulation of the integer part and individual digits is possible. When the new value is acknowledgedby the user, the string representation is transformed back into a true floating point value.
Figure 3.4: The user interface for editing a floating point value, the ’8’ is currently selected(surrounded by vertical bars).
The filebrowser UI, shown in Figure 3.5, consists of a list of files and directories in the currentactive directory. The user can traverse directories and select a file or directory as input. Thepath to the chosen file or directory is used as a parameter of string type.
22
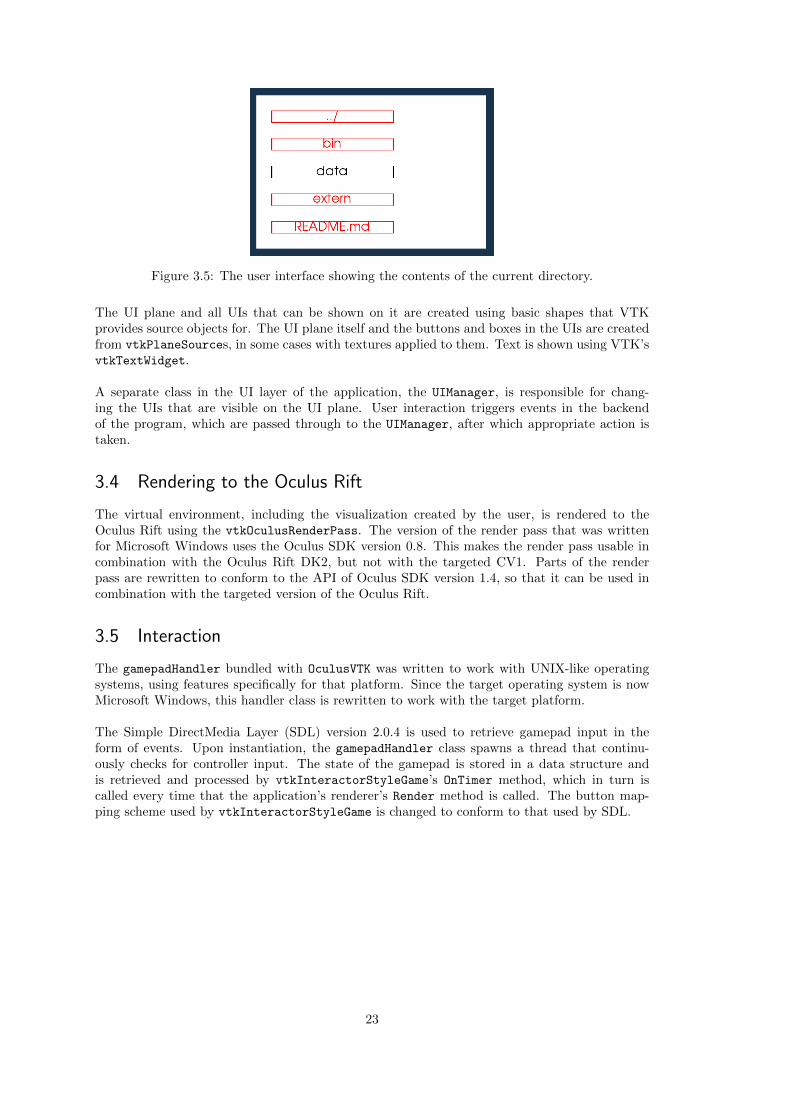
Figure 3.5: The user interface showing the contents of the current directory.
The UI plane and all UIs that can be shown on it are created using basic shapes that VTKprovides source objects for. The UI plane itself and the buttons and boxes in the UIs are createdfrom vtkPlaneSources, in some cases with textures applied to them. Text is shown using VTK’svtkTextWidget.
A separate class in the UI layer of the application, the UIManager, is responsible for chang-ing the UIs that are visible on the UI plane. User interaction triggers events in the backendof the program, which are passed through to the UIManager, after which appropriate action istaken.
3.4 Rendering to the Oculus Rift
The virtual environment, including the visualization created by the user, is rendered to theOculus Rift using the vtkOculusRenderPass. The version of the render pass that was writtenfor Microsoft Windows uses the Oculus SDK version 0.8. This makes the render pass usable incombination with the Oculus Rift DK2, but not with the targeted CV1. Parts of the renderpass are rewritten to conform to the API of Oculus SDK version 1.4, so that it can be used incombination with the targeted version of the Oculus Rift.
3.5 Interaction
The gamepadHandler bundled with OculusVTK was written to work with UNIX-like operatingsystems, using features specifically for that platform. Since the target operating system is nowMicrosoft Windows, this handler class is rewritten to work with the target platform.
The Simple DirectMedia Layer (SDL) version 2.0.4 is used to retrieve gamepad input in theform of events. Upon instantiation, the gamepadHandler class spawns a thread that continu-ously checks for controller input. The state of the gamepad is stored in a data structure andis retrieved and processed by vtkInteractorStyleGame’s OnTimer method, which in turn iscalled every time that the application’s renderer’s Render method is called. The button map-ping scheme used by vtkInteractorStyleGame is changed to conform to that used by SDL.
23

24
CHAPTER 4
Experiments
4.1 Visualizations
Several pipelines were built using the application, in order to asses if the features of VTK thatare exposed to the user can be successfully used and which operations normally performed whilecreating pipelines cannot currently be performed in the virtual environment. It also assesses ifthe stated requirements for the application are met and provides other insights into the use ofthe application.
4.1.1 Visualization of an arrow
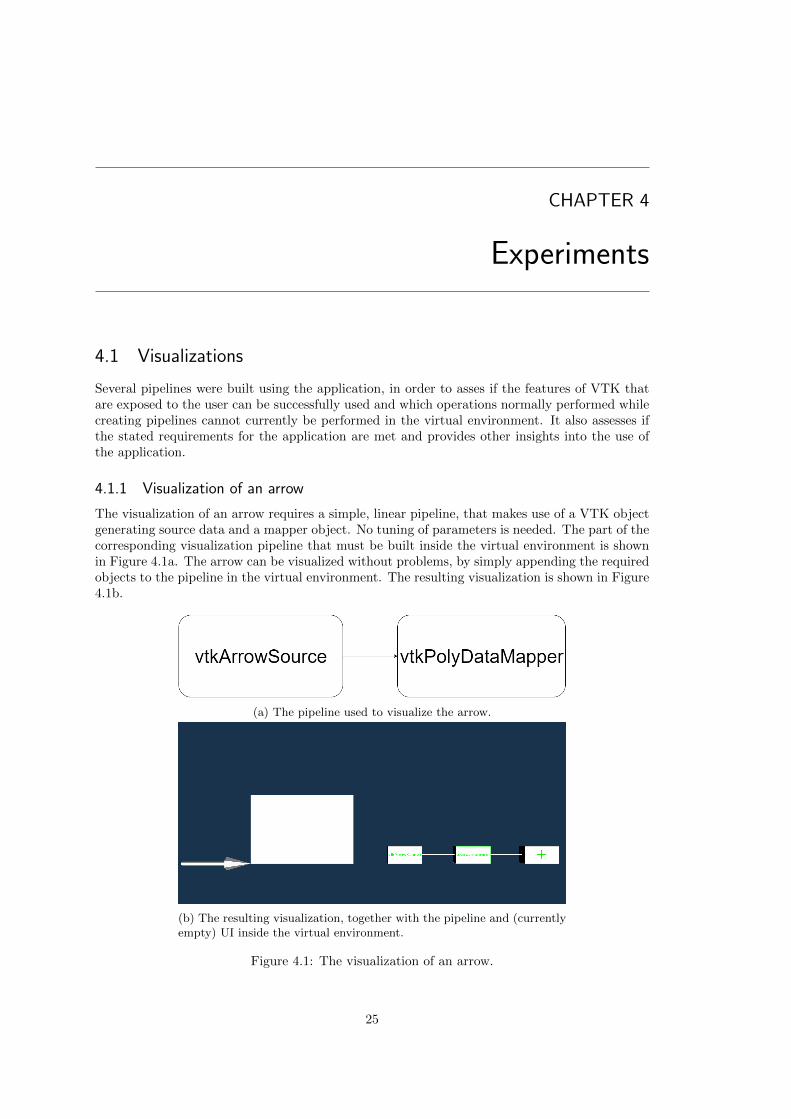
The visualization of an arrow requires a simple, linear pipeline, that makes use of a VTK objectgenerating source data and a mapper object. No tuning of parameters is needed. The part of thecorresponding visualization pipeline that must be built inside the virtual environment is shownin Figure 4.1a. The arrow can be visualized without problems, by simply appending the requiredobjects to the pipeline in the virtual environment. The resulting visualization is shown in Figure4.1b.
(a) The pipeline used to visualize the arrow.
(b) The resulting visualization, together with the pipeline and (currentlyempty) UI inside the virtual environment.
Figure 4.1: The visualization of an arrow.
25
4.1.2 Visualization of a disk
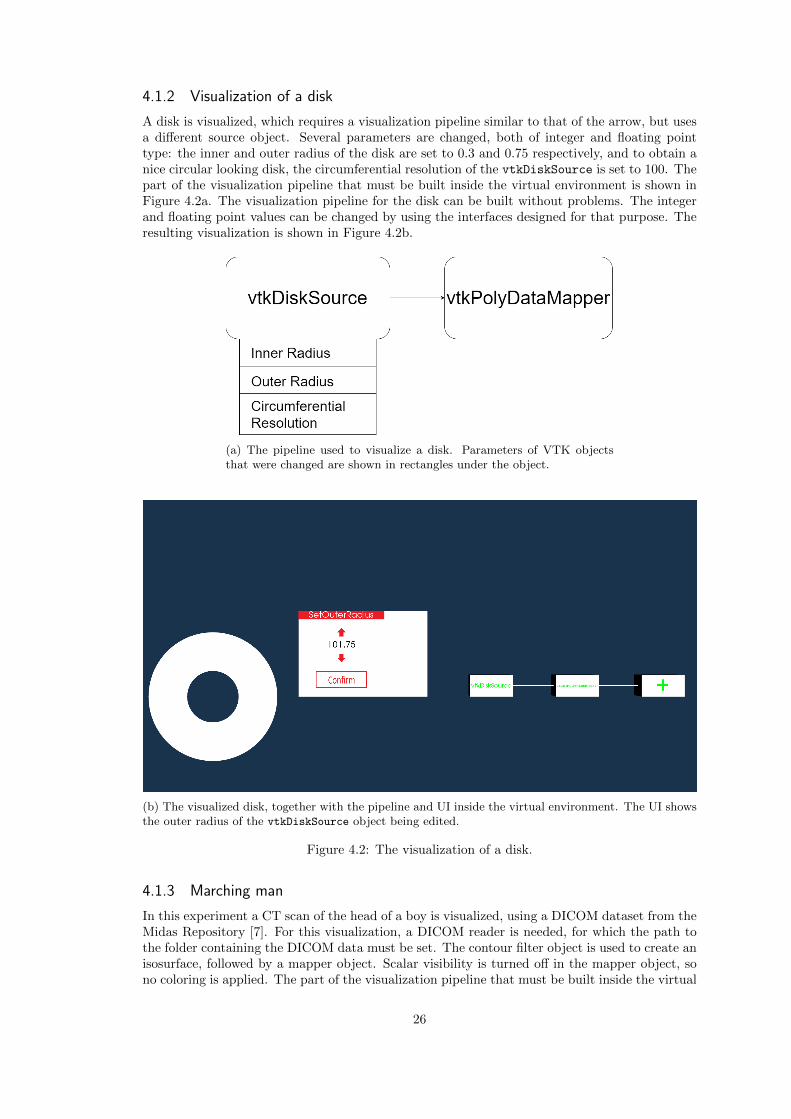
A disk is visualized, which requires a visualization pipeline similar to that of the arrow, but usesa different source object. Several parameters are changed, both of integer and floating pointtype: the inner and outer radius of the disk are set to 0.3 and 0.75 respectively, and to obtain anice circular looking disk, the circumferential resolution of the vtkDiskSource is set to 100. Thepart of the visualization pipeline that must be built inside the virtual environment is shown inFigure 4.2a. The visualization pipeline for the disk can be built without problems. The integerand floating point values can be changed by using the interfaces designed for that purpose. Theresulting visualization is shown in Figure 4.2b.
(a) The pipeline used to visualize a disk. Parameters of VTK objectsthat were changed are shown in rectangles under the object.
(b) The visualized disk, together with the pipeline and UI inside the virtual environment. The UI showsthe outer radius of the vtkDiskSource object being edited.
Figure 4.2: The visualization of a disk.
4.1.3 Marching man
In this experiment a CT scan of the head of a boy is visualized, using a DICOM dataset from theMidas Repository [7]. For this visualization, a DICOM reader is needed, for which the path tothe folder containing the DICOM data must be set. The contour filter object is used to create anisosurface, followed by a mapper object. Scalar visibility is turned off in the mapper object, sono coloring is applied. The part of the visualization pipeline that must be built inside the virtual
26
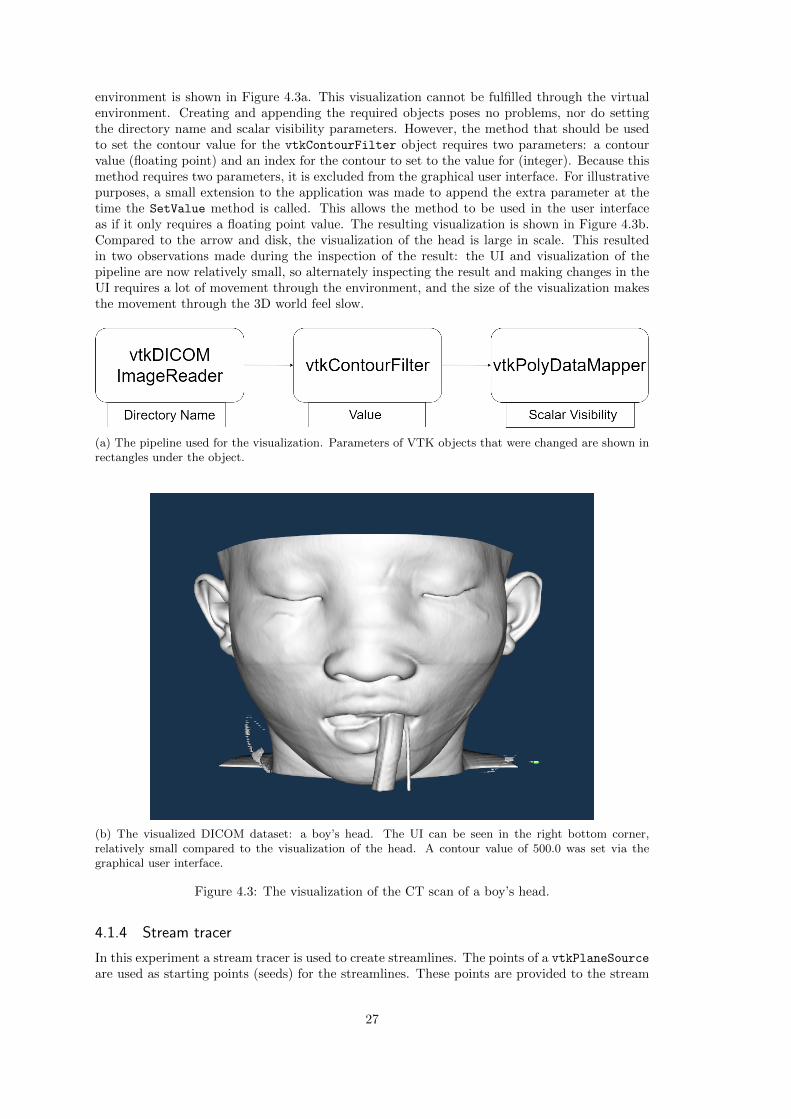
environment is shown in Figure 4.3a. This visualization cannot be fulfilled through the virtualenvironment. Creating and appending the required objects poses no problems, nor do settingthe directory name and scalar visibility parameters. However, the method that should be usedto set the contour value for the vtkContourFilter object requires two parameters: a contourvalue (floating point) and an index for the contour to set to the value for (integer). Because thismethod requires two parameters, it is excluded from the graphical user interface. For illustrativepurposes, a small extension to the application was made to append the extra parameter at thetime the SetValue method is called. This allows the method to be used in the user interfaceas if it only requires a floating point value. The resulting visualization is shown in Figure 4.3b.Compared to the arrow and disk, the visualization of the head is large in scale. This resultedin two observations made during the inspection of the result: the UI and visualization of thepipeline are now relatively small, so alternately inspecting the result and making changes in theUI requires a lot of movement through the environment, and the size of the visualization makesthe movement through the 3D world feel slow.
(a) The pipeline used for the visualization. Parameters of VTK objects that were changed are shown inrectangles under the object.
(b) The visualized DICOM dataset: a boy’s head. The UI can be seen in the right bottom corner,relatively small compared to the visualization of the head. A contour value of 500.0 was set via thegraphical user interface.
Figure 4.3: The visualization of the CT scan of a boy’s head.
4.1.4 Stream tracer
In this experiment a stream tracer is used to create streamlines. The points of a vtkPlaneSource
are used as starting points (seeds) for the streamlines. These points are provided to the stream
27
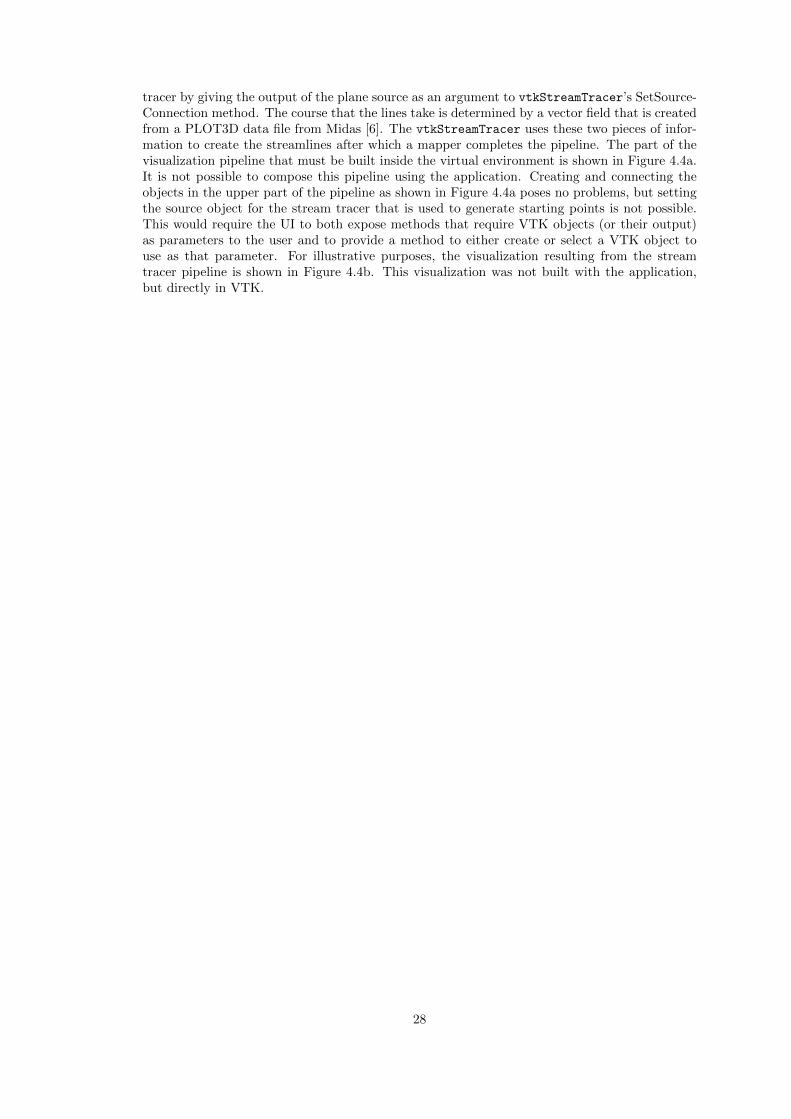
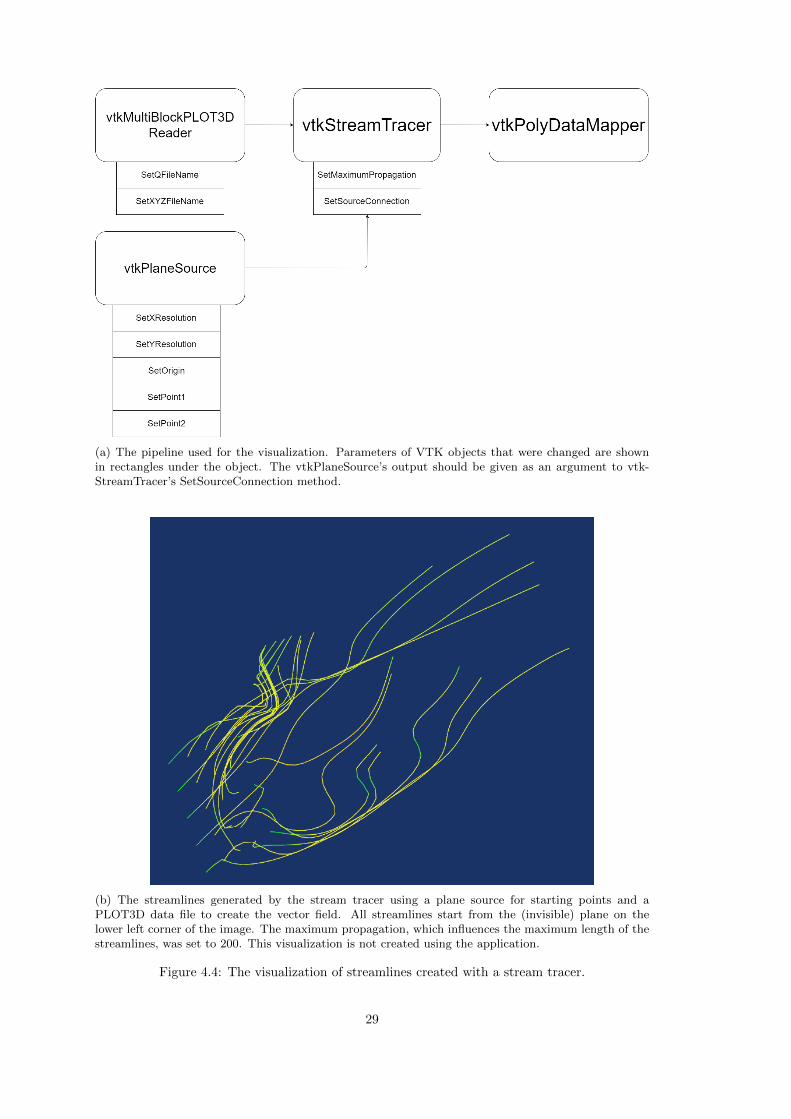
tracer by giving the output of the plane source as an argument to vtkStreamTracer’s SetSource-Connection method. The course that the lines take is determined by a vector field that is createdfrom a PLOT3D data file from Midas [6]. The vtkStreamTracer uses these two pieces of infor-mation to create the streamlines after which a mapper completes the pipeline. The part of thevisualization pipeline that must be built inside the virtual environment is shown in Figure 4.4a.It is not possible to compose this pipeline using the application. Creating and connecting theobjects in the upper part of the pipeline as shown in Figure 4.4a poses no problems, but settingthe source object for the stream tracer that is used to generate starting points is not possible.This would require the UI to both expose methods that require VTK objects (or their output)as parameters to the user and to provide a method to either create or select a VTK object touse as that parameter. For illustrative purposes, the visualization resulting from the streamtracer pipeline is shown in Figure 4.4b. This visualization was not built with the application,but directly in VTK.
28
(a) The pipeline used for the visualization. Parameters of VTK objects that were changed are shownin rectangles under the object. The vtkPlaneSource’s output should be given as an argument to vtk-StreamTracer’s SetSourceConnection method.
(b) The streamlines generated by the stream tracer using a plane source for starting points and aPLOT3D data file to create the vector field. All streamlines start from the (invisible) plane on thelower left corner of the image. The maximum propagation, which influences the maximum length of thestreamlines, was set to 200. This visualization is not created using the application.
Figure 4.4: The visualization of streamlines created with a stream tracer.
29
4.2 Performance
Previous chapters pointed out that some introspection and other VTK related actions are per-formed during the usage span of the application. Because rendering a visualization to the OculusRift CV1 on its own is already a performance intensive task, the effects of the additional VTKrelated actions on the performance of the application are measured.
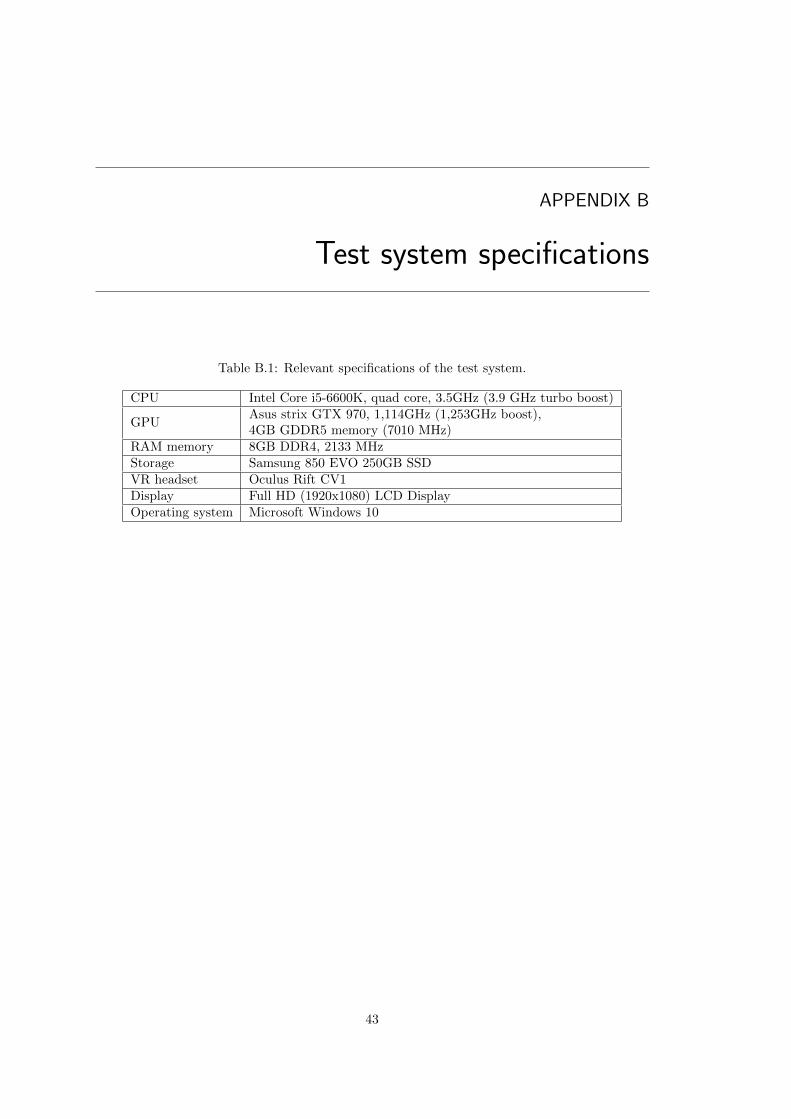
The performance of the application is expressed in the number of frames that are renderedto the display in the Oculus Rift per second (FPS). The measurements were performed duringthe creation of the visualizations of an arrow, disk and a boy’s head, as explained in the previoussection. Each visualization was created five times. The last element (vtkPolyDataMapper) wasnot added to the pipeline in order to be able to inspect the performance implications of using theUI and visualized pipeline, rather than that of rendering the created visualization. The value ofthe “scalar visibility” parameter in the visualization that uses a contour filter is left unchanged.The input was emulated and not performed by an actual gamepad, in order to keep input con-sistent across multiple measurements. The relevant specifications of the test system used for theexperiments are listed in appendix B.
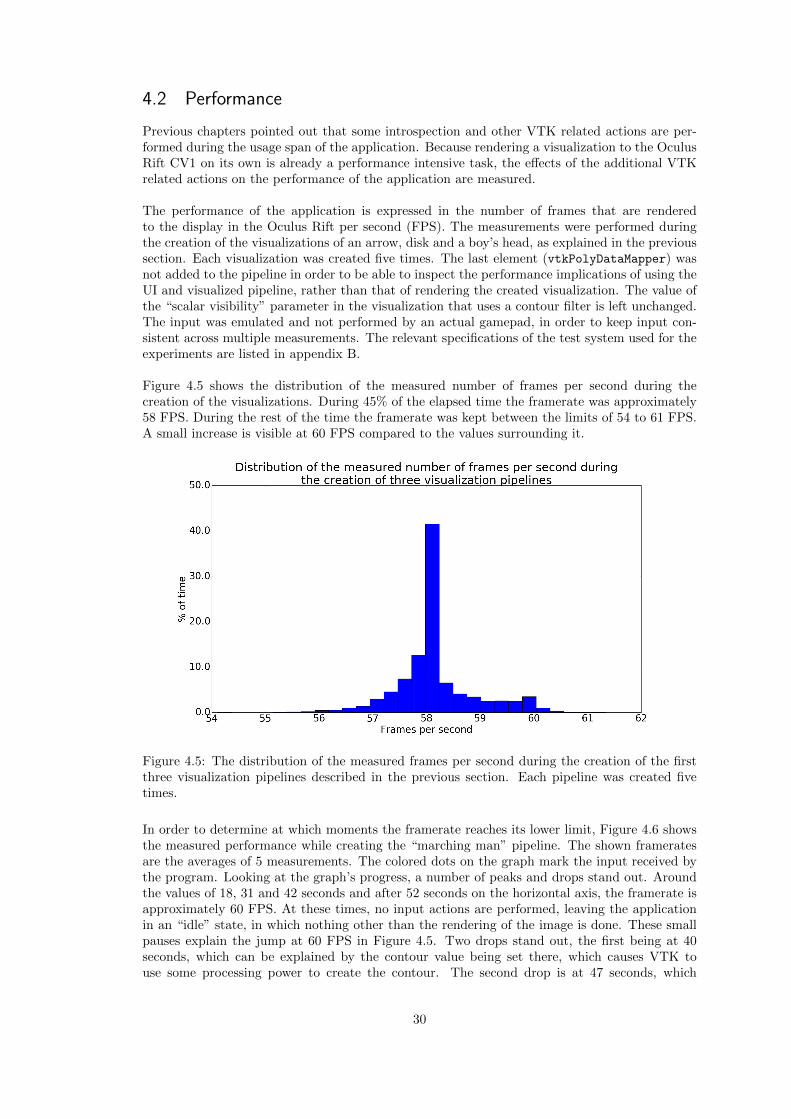
Figure 4.5 shows the distribution of the measured number of frames per second during thecreation of the visualizations. During 45% of the elapsed time the framerate was approximately58 FPS. During the rest of the time the framerate was kept between the limits of 54 to 61 FPS.A small increase is visible at 60 FPS compared to the values surrounding it.
Figure 4.5: The distribution of the measured frames per second during the creation of the firstthree visualization pipelines described in the previous section. Each pipeline was created fivetimes.
In order to determine at which moments the framerate reaches its lower limit, Figure 4.6 showsthe measured performance while creating the “marching man” pipeline. The shown frameratesare the averages of 5 measurements. The colored dots on the graph mark the input received bythe program. Looking at the graph’s progress, a number of peaks and drops stand out. Aroundthe values of 18, 31 and 42 seconds and after 52 seconds on the horizontal axis, the framerate isapproximately 60 FPS. At these times, no input actions are performed, leaving the applicationin an “idle” state, in which nothing other than the rendering of the image is done. These smallpauses explain the jump at 60 FPS in Figure 4.5. Two drops stand out, the first being at 40seconds, which can be explained by the contour value being set there, which causes VTK touse some processing power to create the contour. The second drop is at 47 seconds, which
30
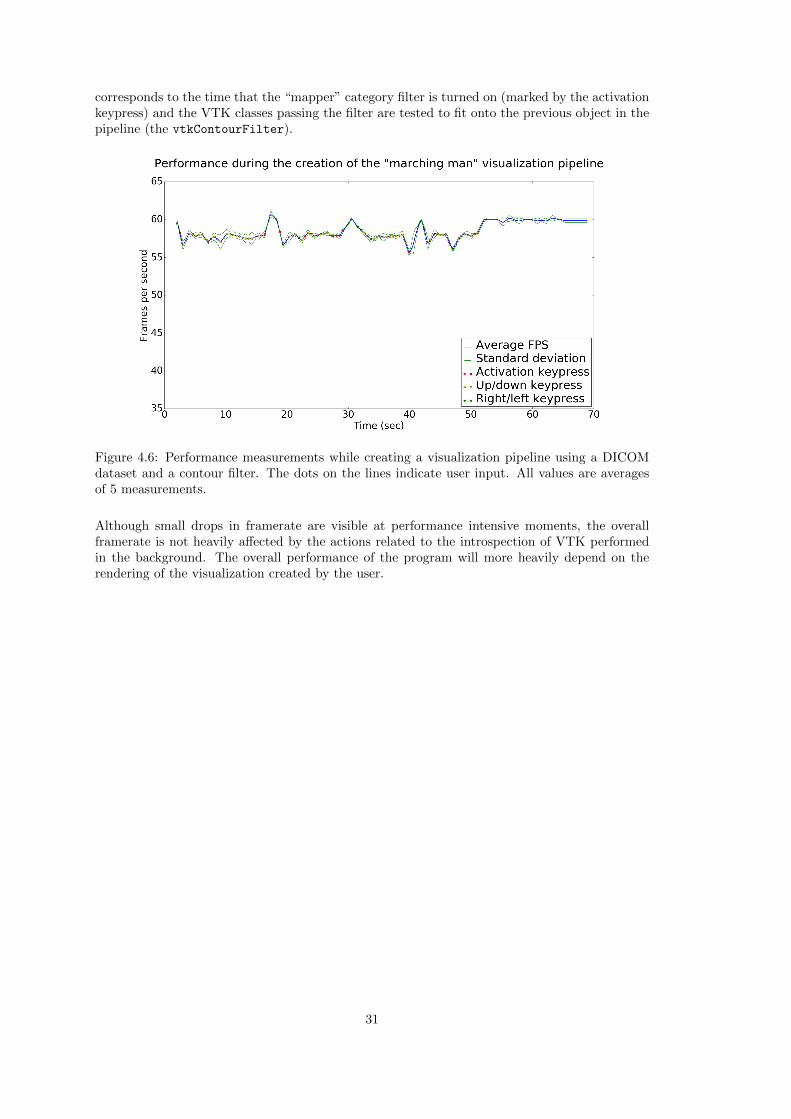
corresponds to the time that the “mapper” category filter is turned on (marked by the activationkeypress) and the VTK classes passing the filter are tested to fit onto the previous object in thepipeline (the vtkContourFilter).
Figure 4.6: Performance measurements while creating a visualization pipeline using a DICOMdataset and a contour filter. The dots on the lines indicate user input. All values are averagesof 5 measurements.
Although small drops in framerate are visible at performance intensive moments, the overallframerate is not heavily affected by the actions related to the introspection of VTK performedin the background. The overall performance of the program will more heavily depend on therendering of the visualization created by the user.
31

32
CHAPTER 5
Conclusion
The goal for this project was to develop an application that serves as a foundation for a vir-tual environment in which a visualization pipeline can be created using VTK. The exposure ofVTK’s API, the creation of a graphical user interface and the use of an appropriate method ofinteraction formed the three main problems that assemble to the goal. Several experiments wereperformed to asses if the stated goal and requirements are met.
The pipelines built during the experiments show that appending VTK objects to a linear pipeline,using SetTo, OnOff and selected (integer and floating point) SetValue methods to change VTKobjects’ parameters work successfully. Visualization pipelines that only need this functionalityto be built, can be successfully composed.
However, not all linear visualization pipelines can be built using the application. The reasons forthat do not particularly depend on the type of pipeline that is built, so no concrete classificationis possible for which pipelines can, and which cannot be composed. It merely depends on whetheror not smaller operations that need to be performed are possible via the UI. The reason for notbeing able to modify a parameter is that the use of a method is necessary that is not availablevia the UI. The reason for this can be one of two (or both):
The method requires more than one argument. The UI currently only supports the use ofmethods that require one argument. In general, these methods influence a parameter of theVTK object they belong to, of which the meaning is apparent from the method’s name. Addingsupport for methods that require multiple arguments can be done in multiple ways, each intro-ducing new challenges.
The task of setting the values for method arguments can be given to the user. This meansa mechanism must be built into the UI to enable the user to manipulate multiple values, for eachof the respective arguments. The meaning of each of the edited arguments must be made clear tothe user in order for him to understand what value should be set. However, the docstring usedto parse method names and argument types does not always provide an explanation or name ofthe arguments. Even if a name of or explanation about the arguments can be provided, the userwould need rather extensive knowledge of VTK in order to use the arguments.
An alternative would be to move the task of filling in arguments that do not directly relateto a parameters value to the application. The automatic addition of the index of the contourvalue in one of the experiments can serve as an example of this. This means that the applicationmust be extended with specific support for certain methods, either using predetermined valuesfor arguments, or adding some mechanism to decide which arguments to use depending on thecurrent state of the pipeline. Either way, this would require a lot of manual work on the appli-cation developer’s side.
33
The method requires an argument of an unsupported type. This type can be a VTK class or anyother type, like a tuple or function. Support for non VTK related types requires an extensionto the UI that gives the user the option to set a value for it. Arguments of a VTK class typerequire the creation or selection of an existing VTK object, or the output of one of its methods.This could be added to the application by letting the user create a VTK object at the time itwants to give it as an argument to a method, or by letting the user choose an existing VTK object.
A graphical visualization of the pipelines that can be composed can be inspected by the user, aswell as the visualization resulting from the built pipeline. The user experience of this inspectioncould be further improved by the addition of the possibility to resize and move the UI planeand visualized pipeline, as well as a variable movement speed. The method of interaction provedsuitable for the operations that needed to be performed and would provide enough options forthe improvements just described. At no time there is the need to leave the virtual environment.
The performance experiments show that the introspection tasks performed in the backgroundhave only a limited effect on performance. The overall performance of the program will mostlydepend on the processing power needed to render the visualization created by the user. As longas this is kept within comfortable limits, so will the overall framerate.
Although limited in its use for real world applications, the created program serves as a goodbasis for further development. Additions to the UI and backend can be easily made when mak-ing use of the design ideas currently present in the program architecture. Also, a foundationis laid for further use of the characteristics of VTK currently determined. For example, theclasstree that was built can be helpful when enabling the use of VTK objects as arguments.Instead of the exact type specified by the documentation, the user may want to create an objectfrom a subclass of this type to use as an argument. The classtree provides a means to list andinspect these subclasses.
5.1 Future work
5.1.1 Method arguments
As pointed out previously, support for multiple arguments can be added to the application, aswell as support for other types of parameters than supported now, including VTK objects. Theway this is presented to the user and the division of work between the user and the applicationare subjects for research.
5.1.2 Interaction
The usability of the user interface and visualization of the pipeline can be further improved, forexample by making it possible to move or resize them. Movement through the virtual environ-ment can be improved by introducing a variable movement speed. Options for adding interactionwith the resulting visualization can be explored, possibly in combination with another input de-vice.
5.1.3 Performance
Although the background activities involving VTK introspection did not pose a problem forthe performance of the application, more processing work could be moved to the beginning ofthe execution of the program. Giving in on memory usage, the performance may be slightlyimproved.
5.1.4 Non-linear pipelines
Another option for future work is the addition of support for non-linear pipelines. Next to theneed for changes in the backend of the application, a method for visualizing the pipeline will
34

have to be determined. The 3-dimensional characteristics of the virtual environment can be putto use even more when it comes to showing branches in the visualization pipeline created by theuser.
35

36
Bibliography
[1] About MeVisLab. http://www.mevislab.de/mevislab/. Accessed: 2016-05-30.
[2] Boost.python. http://www.boost.org/doc/libs/1_61_0/libs/python/doc/html/
index.html. Accessed: 2016-06-08.
[3] DeVIDE. https://www.openhub.net/p/DeVIDE. Accessed: 2016-05-30.
[4] Leap motion. https://www.leapmotion.com/. Accessed: 2016-06-08.
[5] Mayavi Project 3D Scientific Data Visualization and Plotting. http://code.enthought.
com/projects/mayavi/. Accessed: 2016-05-30.
[6] Midas. https://midas3.kitware.com/midas/folder/10108. Accessed: 2016-06-07.
[7] Midas Oldies but Goodies. https://placid.nlm.nih.gov/community/21. Accessed: 2016-06-02.
[8] An overview of Mayavi. http://docs.enthought.com/mayavi/mayavi/overview.html.Accessed: 2016-05-30.
[9] Using Virtual Reality Devices with VTK. https://blog.kitware.com/
using-virtual-reality-devices-with-vtk/. Accessed: 2016-06-05.
[10] vtkActorToPF. http://archive.ncsa.illinois.edu/prajlich/vtkActorToPF/. Ac-cessed: 2016-06-05.
[11] Charl P Botha. Technical Report: DeVIDE - The Delft Visualisation and Image processingDevelopment Environment. May, 31:1–49, 2006.
[12] Frank Heckel, Michael Schwier, and Heinz-Otto Peitgen. Object-oriented application de-velopment with MeVisLab and Python. In GI Jahrestagung, pages 1338–1351. Citeseer,2009.
[13] Jason Leigh, Paul J Rajlich, Robert J Stein, Andrew E Johnson, and Thomas A DeFanti.LIMBO/VTK: A tool for rapid tele-immersive visualization. In CDROM proc. of IEEEVisualizaton’98, pages 18–23, 1998.
[14] Prabhu Ramachandran and Gael Varoquaux. Mayavi: 3D visualization of scientific data.Computing in Science & Engineering, 13(2):40–51, 2011.
[15] Jan Rexilius, Wolf Spindler, Julien Jomier, Matthias Konig, Horst Hahn, Florian Link,and Heinz-Otto Peitgen. A framework for algorithm evaluation and clinical applicationprototyping using ITK. In The Insight Journal-2005 MICCAI Open-Source Workshop, 2005.
[16] William J Schroeder, Kenneth M Martin, and William E Lorensen. The design and imple-mentation of an object-oriented toolkit for 3D graphics and visualization. In Proceedings ofthe 7th conference on Visualization’96, pages 93–ff. IEEE Computer Society Press, 1996.
[17] William J Schroeder, Kenneth M Martin, and William E Lorensen. The VisualizationToolkit, An Object-Oriented Approach to 3D Graphics. Kitware, Inc., 3 edition, 2003.
37

38
Appendices
39

APPENDIX A
Button scheme
Figure A.1: The used button scheme on the Xbox 360 controller, source: https://en.
wikipedia.org/wiki/Xbox_360_controller.
41

42
APPENDIX B
Test system specifications
Table B.1: Relevant specifications of the test system.
CPU Intel Core i5-6600K, quad core, 3.5GHz (3.9 GHz turbo boost)
GPUAsus strix GTX 970, 1,114GHz (1,253GHz boost),4GB GDDR5 memory (7010 MHz)
RAM memory 8GB DDR4, 2133 MHzStorage Samsung 850 EVO 250GB SSDVR headset Oculus Rift CV1Display Full HD (1920x1080) LCD DisplayOperating system Microsoft Windows 10
43