Embed Size (px)
Citation preview

A Vision for Future Observations for Western U.S.
Extreme Precipitation and Flooding
Dr. Marty Ralph Center for Western Weather and Water Extremes (CW3E)
UCSD/Scripps Institution of Oceanography
24 June 2014
“Workshop on Hydroclimate Monitoring and Measurement Needs”
Western States Water Council
San Diego, California 1

2
California has deployed key land-based sensors
An Atmospheric River-focused long-term observing network is being installed in CA as part of a 5-year project between CA Dept. of Water Resources (DWR), NOAA and Scripps Inst. Of Oceanography - Installed 2008-2014 - >100 field sites
¼-scale 449-MHz wind profiler with RASS
FM-CW snow-level
radar
GPS receiver for
integrated water vapor
Soil Moisture and
Temperature Probes
White et al. 2013, J.Tech.

Core Observing System Concepts
• The lower 5,000 feet of the atmosphere is where much of the “action” takes place, but is poorly observed
• Mountains complicate use of radars in the West, requiring special attention to siting, scanning and profiles
• Many important storms initially take form over the Pacific Ocean, where satellites help, but major gaps remain
• Soil and snowpack conditions in mountains impact floods
3
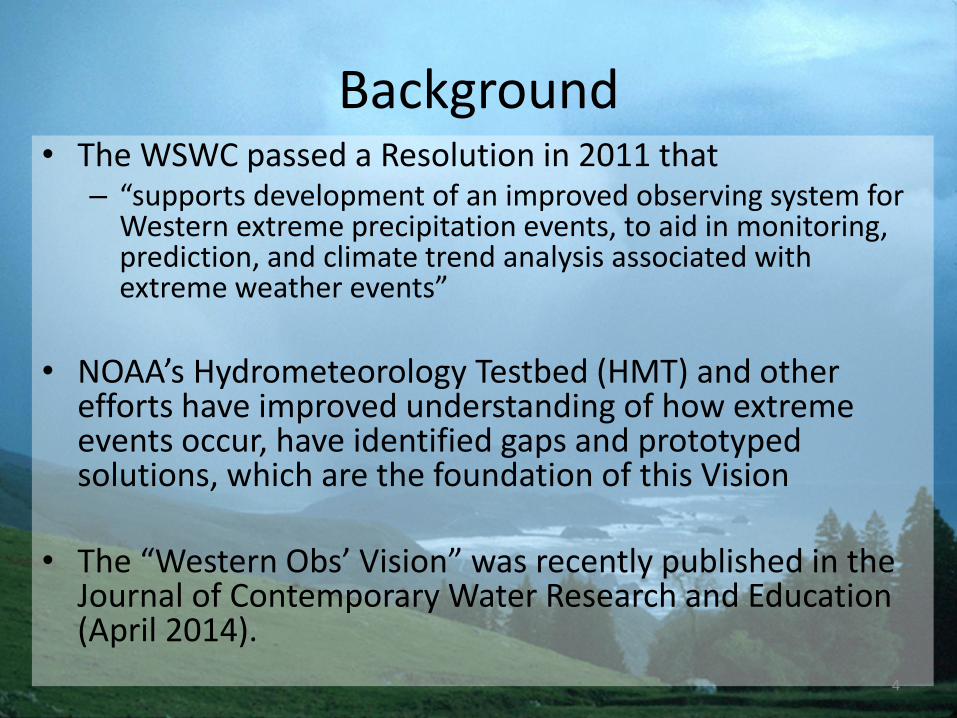
Background • The WSWC passed a Resolution in 2011 that
– “supports development of an improved observing system for Western extreme precipitation events, to aid in monitoring, prediction, and climate trend analysis associated with extreme weather events”
• NOAA’s Hydrometeorology Testbed (HMT) and other
efforts have improved understanding of how extreme events occur, have identified gaps and prototyped solutions, which are the foundation of this Vision
• The “Western Obs’ Vision” was recently published in the
Journal of Contemporary Water Research and Education (April 2014).
4

5

Key reports, papers and other sources used to inform the development of this Vision
6
Source Description and references
NRC reports Flooding in Complex Terrain; Network of Networks; GPM Satellite system
Needs assessments Workshop on non-stationarity…(2010), USBR Science and Technology Program (2011),
NOAA’s Water Cycle Science Challenge Workshop (2012), USWRP Workshop (2005)
IWRSS USACE, USGS, NOAA formal agreement and coordination; National Water Center
NOAA/HMT 10-year effort on extreme precipitation causes and predictions (Ralph et al. 2005; 2013a)
Atmospheric rivers Understanding of the joint roles of atmospheric rivers in extreme events and water
supplies in the west (Dettinger et al. 2011)
ARkStorm USGS-led emergency preparedness exercise in California focused on atmospheric rivers
NOAA/RISA Regional Integrated Science and Assessment (RISA) studies on climate change
State Climatologists Regional expertise and deep experience in states’ needs for climate information
Unmanned Aircraft NOAA UAS Program observing system gap analysis for atmospheric rivers over Pacific
NOAA Radars Cross-NOAA Radar planning team reports
NOAA Science Plans NOAA held interagency workshops on water cycle and climate science that produced
detailed recommendations for future science directions nationally (NOAA 2012a, 2012b)

Analysis from COOP daily precipitation observations. -Each site uses at least 30 years of data -The top 10 daily precip dates are found -The season for which most of these top-10 dates occurred at that site is color coded.
Ralph et al. 2014 (JCWRE)

Schematic illustration of regional variations in the primary weather phenomena that lead to extreme precipitation, flooding and contribute to water supply in the Western U.S. (Ralph et al. 2014)
8
Atmospheric Rivers
(fall and winter)
Southwest Monsoon
(summer & fall)
Great Plains Deep Convection
(spring and summer)
Front Range Upslope
(rain/snow)
Key Weather Phenomena

Figure from an article in
Scientific American by Dettinger and
Ingram (January 2013)
A Major Result from 10-years of Research
Atmospheric rivers – what they are, how they work, and their
crucial role in both water supply and flooding across much of the
U.S. West Coast

Atmospheric rivers: Two recent examples that produced extreme rainfall and flooding
From Ralph et al. 2011, Mon. Wea. Rev.
These color images represent satellite observations of atmospheric water vapor over the oceans. Warm colors = moist air Cool colors = dry air ARs can be detected with these data due to their distinctive spatial pattern. In the top panel, the AR hit central California and produced 18 inches of rain in 24 hours. In the bottom panel, the AR hit the Pacific Northwest and stalled, creating over 25 inches of rain in 3 days. 10
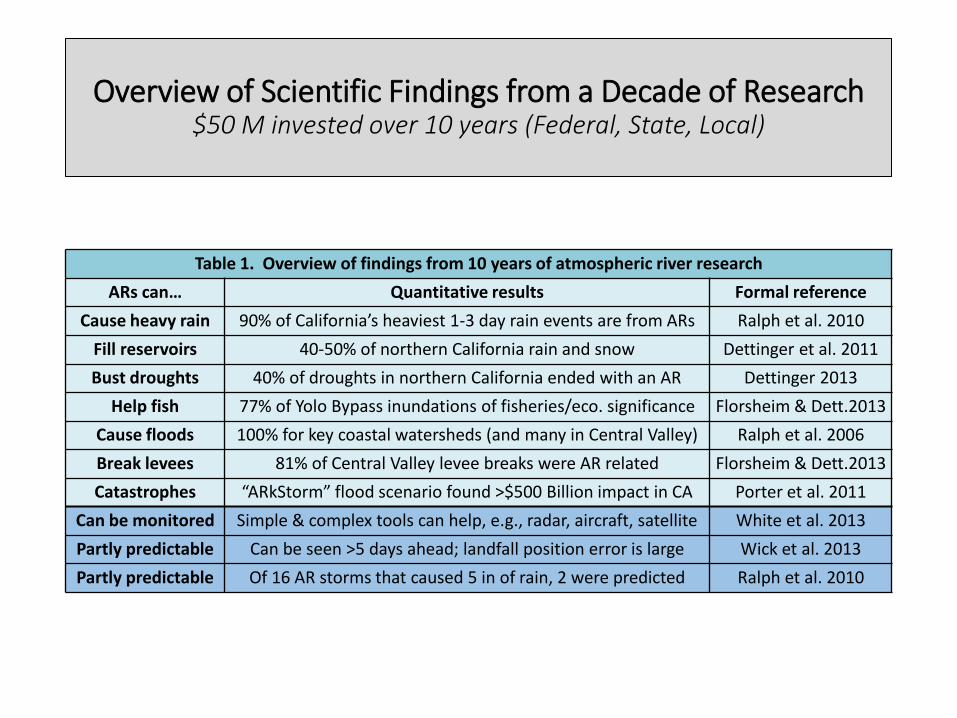
Overview of Scientific Findings from a Decade of Research $50 M invested over 10 years (Federal, State, Local)
Table 1. Overview of findings from 10 years of atmospheric river research
ARs can… Quantitative results Formal reference
Cause heavy rain 90% of California’s heaviest 1-3 day rain events are from ARs Ralph et al. 2010
Fill reservoirs 40-50% of northern California rain and snow Dettinger et al. 2011
Bust droughts 40% of droughts in northern California ended with an AR Dettinger 2013
Help fish 77% of Yolo Bypass inundations of fisheries/eco. significance Florsheim & Dett.2013
Cause floods 100% for key coastal watersheds (and many in Central Valley) Ralph et al. 2006
Break levees 81% of Central Valley levee breaks were AR related Florsheim & Dett.2013
Catastrophes “ARkStorm” flood scenario found >$500 Billion impact in CA Porter et al. 2011
Can be monitored Simple & complex tools can help, e.g., radar, aircraft, satellite White et al. 2013
Partly predictable Can be seen >5 days ahead; landfall position error is large Wick et al. 2013
Partly predictable Of 16 AR storms that caused 5 in of rain, 2 were predicted Ralph et al. 2010

1895-2010
Dettinger, Michael D., 2013: Atmospheric Rivers as Drought Busters on the U.S. West Coast. J. Hydrometeor, 14, 1721–1732.
Droughts, on average, end with a bang (and begin with a whimper) all over the U.S.
• Atmospheric rivers provide the bang in a large fraction of the west coast drought breaks, especially in winters

Methodology for AR duration data analysis: 13 Nov. 2004 – 8 Aug 2010
Oro
grap
hic
co
ntr
olli
ng
laye
r fo
r u
psl
op
e fl
ow
: 0
.75
– 1
.25
km
MSL
(N
eim
an e
t al
. 20
02
)
BBY 915 MHz wind profiler: 27 Dec 2005
Russian River flooding: Feb. 2004 photo courtesy of David Kingsmill
915 MHz wind profiler GPS receiver ARO

Alt
itu
de
MSL
(km
)
0
1
2
3
GPS satellite
GPS-met receiver
Wind profiler (915 or 449 MHz)
10-m surface meteorology
tower
Wind profiler beam with 100-m vertical resolution
Atmospheric River
“Controlling layer” (upslope winds)
Surface friction and barrier jet
S-PROF precipitation
profiler; surface met; disdrometer
Snow level
Orographic cloud and precipitation
Atmospheric River Observatory
0-50 km between wind profiler/GPS-met site and S-PROF precipitation profiler
Ocean
Rain shadow
Plan view Rain
shadow
Wind direction
in AR Mountains
S-PROF data up to 10 km MSL
ARO
14

Defining an AR event using three thresholds: (1) The IWV has to meet or exceed
2 cm (as in Ralph et al. 2004 and subsequent studies).
(2) The upslope IWV flux (Neiman et al. 2009) has to meet or exceed 15 cm m s-1.
(3) Both variables had to simultaneously meet or exceed those thresholds for at least 8 consecutive hours.
Example: Case 26 From: 12/26/05 08z To: 12/30/05 08z
The ending time occurs when either IWV or upslope flux falls below its respective threshold. Each case was then uniquely defined by a 96 h time interval with the 24th hour representing the start of the period for which IWV ≥ 2 cm and IWV flux ≥ 15 cm m s-1 for at least 8 h.
96 hours
At least 8 hours
ATMOSPHERIC FORCING

Storm-total upslope water vapor flux at BBY (cm m/s)
Sto
rm-t
ota
l rai
nfa
ll at
CZD
(m
m)
91 AR events observed
over 6 years
From Ralph et al. 2013, J. Hydrometeorology

Storm-total upslope water vapor flux at BBY (cm m/s)
Storm-total upslope water vapor flux at BBY (cm m/s)
Sto
rm-t
ota
l ru
no
ff o
n A
ust
in C
k (m
illio
ns
of
m3)
Sto
rm-t
ota
l rai
nfa
ll at
CZD
(m
m)
91 AR events observed
over 6 years

Neiman, Hughes, Moore, Ralph, and Sukovich (MWR 2013)
The Sierra Barrier Jet is
key to regional
precipitation
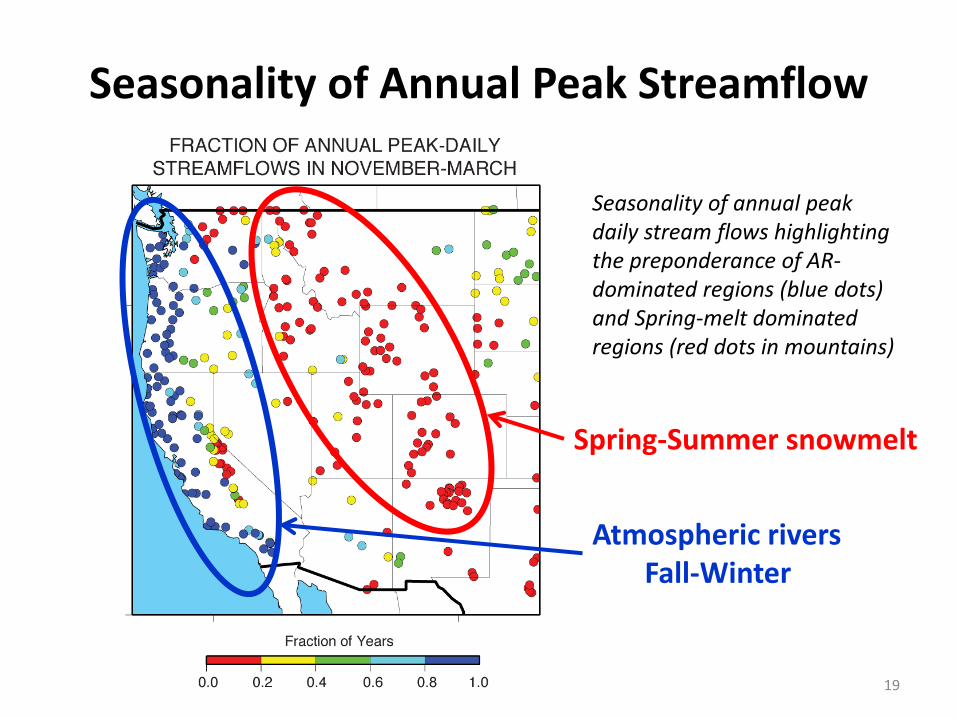
Seasonality of Annual Peak Streamflow
19
Seasonality of annual peak daily stream flows highlighting the preponderance of AR-dominated regions (blue dots) and Spring-melt dominated regions (red dots in mountains)
Spring-Summer snowmelt
Atmospheric rivers Fall-Winter

20
Existing SNOTEL sites color coded to their altitude range. Red ovals highlight regions where a subset of the existing SNOTEL sites would have additional sensors emplaced to support better spring snow melt monitoring and prediction, or where new sites would be needed to broaden the altitude range of coverage.

21
Schematic “strawman” network of new sensors to improve monitoring, prediction and climate trend detection for hydrometeorological conditions that create extreme precipitation & flooding.
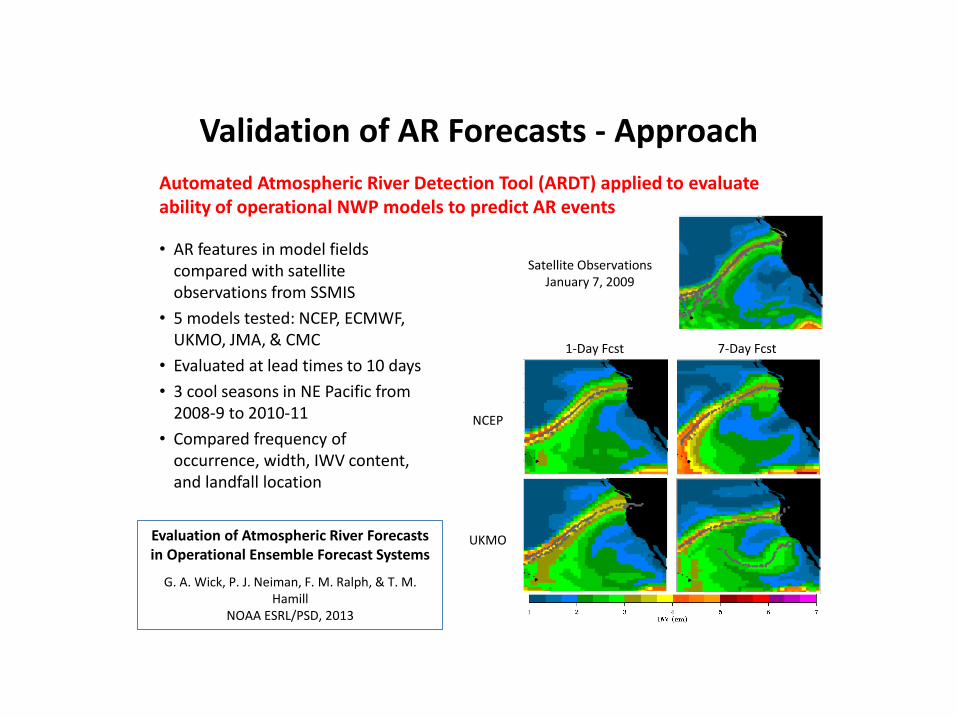
Validation of AR Forecasts - Approach
• AR features in model fields compared with satellite observations from SSMIS
• 5 models tested: NCEP, ECMWF, UKMO, JMA, & CMC
• Evaluated at lead times to 10 days
• 3 cool seasons in NE Pacific from 2008-9 to 2010-11
• Compared frequency of occurrence, width, IWV content, and landfall location
Automated Atmospheric River Detection Tool (ARDT) applied to evaluate ability of operational NWP models to predict AR events
NCEP
Satellite Observations January 7, 2009
UKMO
1-Day Fcst 7-Day Fcst
Evaluation of Atmospheric River Forecasts in Operational Ensemble Forecast Systems
G. A. Wick, P. J. Neiman, F. M. Ralph, & T. M. Hamill
NOAA ESRL/PSD, 2013

AR Landfall Position Forecast Errors While overall occurrence well forecast out to 10 days, landfall is less well predicted
and the location is subject to significant errors, especially at longer lead times
• Errors in location increase to over 800 km at 10-day lead
• Errors in 3-5 day forecasts comparable with current hurricane track errors
• Model resolution a key factor
• Models provide useful heads-up for AR impact and IWV content, but location highly uncertain
• Location uncertainty highlights limitations in ability to predict extreme precipitation and flooding
• Improvements in predictions clearly desirable
RMS Error in Forecast AR Landfall Location
From Wick et al., 2013 (Weather and Forecasting)
500 km forecast error at 5-day lead
time

Doyle, James D., Clark Amerault, Carolyn A. Reynolds, P. Alex Reinecke, 2014: Initial Condition Sensitivity and Predictability of a Severe Extratropical Cyclone Using a Moist Adjoint. Mon. Wea. Rev., 142, 320–342
Uncertainty in predicted extreme surface winds found to be associated with an AR
“The sensitivity maxima are found in the low- and midlevels, oriented in a sloped region along the warm front, and maximized within the warm conveyor belt. The moisture sensitivity indicates that only a relatively small filament of moisture within an atmospheric river present at the initial time was critically important for the development of Xynthia.”
Adjoint sensitivity valid at the initial time of 1200 UTC 26 Feb 2010 at 700 mb for water vapor (color coded). Hatched area is water vapor mixing ration >4 g kg-1.

CalWater-2* “Early Start” field campaign 3-25 February 2014
Summary Courtesy of Marty Ralph UCSD/Scripps/Center for Western Weather and Water Extremes
Up to > 12 inches of rain – some drought relief
This AR increased precipitation-to-date from 16% to 40% of normal in < 4 days in key Northern California watersheds, but runoff was muted due to dry soils.
*CalWater-2 is a 5-year program (from 2015-2019) proposed to focus on West Coast precipitation processes and how a changing climate will affect them. It is led by UCSD/Scripps with partners from DWR, CEC, NOAA, NASA, DOE and others.
SSM/I satellite observations of water vapor on 8 Feb 2014 (Courtesy G. Wick, NOAA)
Russian River’s highest flow in > 1 year
Flight area for NOAA’s G-IV aircraft on 8 Feb 2014 Goal: developing AR flight method to sample a
“frontal wave” that can cause an AR to stall over one area at landfall (G-IV PI: Chris Fairall –
NOAA; Mission Scientists: Marty Ralph – Scripps, Ryan Spackman – STC)
Hawaii

The NOAA Unmanned Aircraft Systems (UAS) Program:
Status and Activities
Gary Wick
Robbie Hood, Program Director
NASA Global Hawk during Test flight for NOAA-led Winter Storm and Pacific Atmospheric River
“WISPAR” dropsonde demonstration project
January 2011
*Courtesy Dr. Gary Wick (WISPAR Mission Scientist) 26

Benefits
Flood damages
• Western US averages $1.5 B/year
• Mitigation of 2% of this damage (or $30 M/yr) is likely
• This does not account for potential water supply benefits
27

Cost Comparisons
28
Scanning NEXRAD Radar on WA coast $13 M (operating Sept 2011)
California AR Network >90 sites, 4 sensor types $10 M (underway)
Operate, Maintain and Optimize - $35 M/year
Offshore Buoy and Aircraft Network $40 M to develop, acquire and deploy - 5 buoy-mounted AROs - 1-2 reconnaissance aircraft
Complete Western Network $65 M to develop, acquire and deploy - 325 new surface obs - 25 Atmospheric river observatories - 25 precipitation profiling radars - 24 new C- or X-band scanning radars
Co
mb
ine
d: $
21
0 M
ove
r 6 ye
ars

Next Step: Implementation Planning
Some alternative funding approaches
• Master Plan with Integrated Federal Appropriation(s)
• Federal, State, Local (each agency supports what it can)
• Private sector (users buy data)
Some alternative execution strategies
• Use and better support existing expertise
• Develop Regional Centers coordinated across agencies
• A single center coordinates and fills remaining gaps
29

Thank You • CW3E web page
http://cw3e.ucsd.edu
Ralph, F. M., M. Dettinger, A. White, D. Reynolds, D. Cayan, T. Schneider, R. Cifelli, K. Redmond, M. Anderson, F. Gherke, J. Jones, K. Mahoney, L. Johnson, S. Gutman, V. Chandrasekar, J. Lundquist, N.P. Molotch, L. Brekke, R. Pulwarty, J. Horel, L. Schick, A. Edman, P. Mote, J. Abatzoglou, R. Pierce and G. Wick, 2014: A vision for future observations for Western U.S. extreme precipitation and flooding– Special Issue of J. Contemporary Water Resources Research and Education, Universities Council for Water Resources, Issue 153, pp. 16-32.
30

Backup slides
31

• Flood Preparedness
and Response
• Flood Planning
• Reservoir Coordinated
Operations
• Water Supply
Forecasting
• Monitoring
Climate Change
DWR Program
Applications of
Atmospheric Rivers
Network Data
Courtesy of Mike Anderson
- CA Dept. Water Resources
- CA State climatologist

Conceptual Observation Network and Forecast Lead Time of AR Development/Impacts
(courtesy of Dave Reynolds)
Recurving West Pacific Tropicals 5-7 days
Amplifying Jet Stream
G-IV
Profilers MJO 7-10 days
Ensemble MJO Fcst
Frontal wave stalls AR over CA - AROs
Tropical Tap?
UAVs
Landfall

Offshore Monitoring- Gap Filling Radar Demonstration in HMT
34

NEXRAD precipitation estimation errors and error sources quantified
Matrosov, S.Y., F.M. Ralph, P.J. Neiman, A.B. White, 2014: Quantitative assessment of operational weather radar
rainfall estimates over California’s Northern Sonoma County using HMT-West data. J. Hydrometeor, 15, 393–
410.

Sensor List
• 100 new low-mid altitude soil moisture observing sites
• 125 existing high-altitude sites with new snow-related data
• 100 new GPS-met observing sites
• 25 snow-level radars
• 25 wind profiling/ARO sites
• 14 C-band scanning radars
• 10 X-band scanning radars or mini CASA networks
36

37
Monitoring Atmospheric Conditions That Fuel Extreme Precipitation & Flood
New Snow and Streamflow Monitoring for Better Snow Melt Forecasts
Atmospheric River Observatories to Fill Largest Single Monitoring Gap
Offshore Monitoring to Extend Forecast Lead Times for Extreme Precipitation

Mission
Provide 21st Century water cycle science, technology and outreach to support effective policies and
practices that address the impacts of extreme weather and water events on the environment, people and
the economy of Western North America
Goal
Revolutionize the physical understanding, observations, weather predictions and climate projections of
extreme events in Western North America, including atmospheric rivers and the North American summer
monsoon as well as their impacts on floods, droughts, hydropower, ecosystems and the economy
Atmospheric
Rivers
(fall and winter)
Southwest
Monsoon
(summer & fall)
Great Plains Deep
Convection
(spring and summer)
Spring Front Range
Upslope
(rain/snow)
Center for Western Weather and Water Extremes Where: UCSD/Scripps Inst. Oceanography La Jolla, California When: Start - 2013 Who: Dr. F. M. Ralph (Director) Dr. Dan Cayan Dr. Mike Dettinger Dr. Ryan Spackman
Scripps Institution of Oceanography

CalWater 2 - Science White Paper

HMT-West innovations were key elements in NOAA’s rapid response to a flood risk crisis
• USACE was considering taking over operation of a dam in Washington State during a recent storm.
• Using the HMT ARO at the coast and NWS forecasts, USACE saw the back edge of the AR was coming ashore and thus heavy rain was about to end, so they did not take over operation from the local water agency.
• See recent journal article by White et al. (February 2012; Bulletin of the American Meteorological Society). Dept. of Commerce
Bronze Medal 2012

Courtesy of Larry Schick, US Army Corps of Engineers - Seattle
“During this current AR rain event, I have found the Westport ARO (for Wynoochee dam) and Spanaway ARO (for HH dam) very useful in short range forecast information which I needed to consult our water management people.
The question was whether to take over the dam and operate for flood control today. We were right on the threshold of taking over Wynoochee today for flood control, but had high confidence we didn't need to with the ARO info that the rain would taper off quickly -- and it did.
The Spanaway ARO is currently catching the brief heavy ran increase for HHD, but we remain confident it will move on as per forecast. Clearly the ARO info with radar, sat pix and precip trends gave us good confidence today. “
Reservoir Operation Decision - example

Background image: Integrated Water Vapor from the Global Forecast System, 30 hour forecast, Valid 0600 UTC 12 Feb
2 dropsonde transects by the Global Hawk drone across tropical tap region of an AR -37 sondes -16 h flight versus 24 h goal
42

profiler
• Coastal and marine weather prediction suffers from a relative sparseness of coastal and offshore observations.
• USWRP Report No. 2 noted that “the most serious gap in the current observing system for 1-5 day forecasts is the absence of wind profiles, especially over the northeast Pacific Ocean.”
Buoy-mounted wind profilers

Examples of - Surface Observing Systems
Precipitation gauges
Surface
meteorology
& snow depth Stream level Soil moisture
Precipitation disdrometers
Real-time data access
Rain
Snow
Surface-Met
Soil and Stream
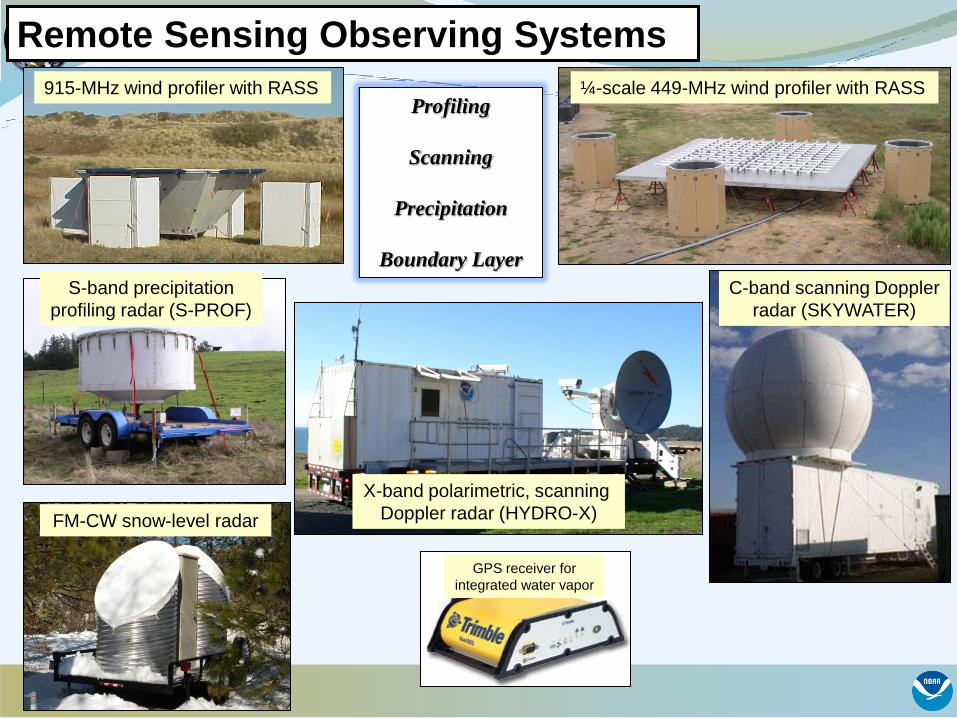
Remote Sensing Observing Systems
915-MHz wind profiler with RASS ¼-scale 449-MHz wind profiler with RASS
S-band precipitation
profiling radar (S-PROF)
FM-CW snow-level radar
X-band polarimetric, scanning
Doppler radar (HYDRO-X)
C-band scanning Doppler
radar (SKYWATER)
GPS receiver for
integrated water vapor
Profiling
Scanning
Precipitation
Boundary Layer

Scanning C-band radars (2 new)
Scanning X-band radar (1 new)
Atmos. River Observatory (1 new plus 1 from DWR)
Precipitation profiling radars (7 new plus 1 from NOAA)

Atmospheric Rivers, Floods and the Water Resources of California by Mike Dettinger, Marty Ralph, , Tapash Das, Paul Neiman, Dan Cayan
Water, 2011 (in Press)
25-35% of annual precipitation in the
Pacific Northwest fell in association with
atmospheric river events
35-45% of annual precipitation in California
fell in association with atmospheric river events
An average AR transports the
equivalent of 7.5 times the average discharge of the
Mississippi River, or ~10 M acre feet/day

4 Jan 2008, 1500 UTC
5 Jan 2008, 0300 UTC
4 Jan 2008, 2100 UTC
Time of max AR bulk flux at BBY: 1500 UTC 4 Jan
Time of max AR bulk flux at GLA: 0300 UTC 5 Jan
Time of max AR bulk flux at PPB: 2100 UTC 4 Jan
AR Propagation: ~12 m s-1.
½-day lead time for SoCal