Embed Size (px)
Citation preview
428 IEEE SENSORS JOURNAL, VOL. 2, NO. 5, OCTOBER 2002
A Vision-Based DSP Embedded Navigation SensorKiran K. Gunnam, Declan C. Hughes, John L. Junkins, and Nasser Kehtarnavaz, Senior Member, IEEE
Abstract—Spacecraft missions such as spacecraft dockingand formation flying require high-precision relative positionand attitude data. Although a global positioning system canprovide this capability near the earth, deep space missions requirethe use of alternative technologies. One such technology is thevision-based navigation (VISNAV) sensor system developed atTexas A&M University. VISNAV comprises an electro-opticalsensor combined with light sources or beacons. This patentedsensor has an analog detector in the focal plane with a rise timeof a few microseconds. Accuracies better than one part in 2000of the field of view have been obtained. This paper presents anew approach involving simultaneous activation of beacons withfrequency division multiplexing as part of the VISNAV sensorsystem. In addition, it discusses the synchronous demodulationprocess using digital heterodyning and decimating filter banks ona low-power fixed point digital signal processor, which improvesthe accuracy of the sensor measurements and the reliability of thesystem. This paper also presents an optimal and computationallyefficient six-degree-of-freedom estimation algorithm using anew measurement model based on the attitude representation ofmodified Rodrigues parameters.
Index Terms—Active beacons, decimating filter bank, digitalsignal processor (DSP), frequency division multiplexing (FDM),Gaussian least squares differential correction (GLSDC), modifiedRodrigues parameters (MRPs), noncontact optoelectronic sensor,positioning system, precision navigation, position sensitive diode(PSD) sensor, six-degrees-of-freedom (6DOF) estimation, space-craft docking, synchronous demodulation, vision-based navigation(VISNAV).
I. INTRODUCTION
SEVERAL research efforts have been carried out in the fieldof six-degrees-of-freedom (6DOF) position and attitude es-
timation for rendezvous and proximity operations. The vision-based navigation (VISNAV) sensor system developed at TexasA&M University [1] is aimed at achieving better accuracies in6DOF estimation using a simpler, yet more robust, approach. Ituses measurements from a position sensitive diode (PSD) sensor
Manuscript received May 24, 2002; revised August14, 2002. This work wassupported by Grant NCC5-448 from NASA Goddard Space Flight Center toTexas Engineering Experiment Station for the research entitled Vision-BasedNavigation for Spacecraft Formation Flying and partially by Texas Instrumentssponsored DSP Program at Texas A&M University, College Station. The asso-ciate editor coordinating the review of this paper and approving it for publicationwas Dr. Eugenii Katz.
K. K. Gunnam is with the Department of Electrical Engineering, TexasA&M University, College Station, TX 77840 USA (e-mail: [email protected]).
D. C. Hughes is with the NASA Commercial Space Center for Engi-neering, Texas A&M University, College Station, TX 77840 USA (e-mail:[email protected]).
J. L. Junkins is with the Department of Aerospace Engineering, Texas A&MUniversity, College Station, TX 77840 USA (e-mail: [email protected]).
N. Kehtarnavaz is with the Department of Electrical Engineering, Universityof Texas at Dallas, Richardson, TX 75083 USA (e-mail: [email protected]).
Digital Object Identifier 10.1109/JSEN.2002.806212
to calculate 6DOF estimates of the sensor location and orien-tation. The PSD sensor generates four currents whose imbal-ances are linearly proportional to the azimuth and elevation ofthe light source with respect to the sensor. The individual cur-rents, which depend on the intensity of the light, are kept nearlyconstant by using a feedback control of the light source outputpower. This is done to accommodate for variable received en-ergy due to range dependence and other factors. By having fouror more light sources (called beacons) in the target frame atknown positions, the 6DOF data associated with the sensor arecalculated. An electromagnetic signature is given to the beaconby modulating the beacon (an array of LEDs) at a distinct fre-quency to distinguish target energy from the ambient optical en-ergy such as sunlight. The beacons are operated at a single fre-quency in time division multiplexing (TDM) mode in the orig-inal VISNAV configuraton. Demodulation of the sensor currentsto recover the signals is done via analog circuitry in this config-uration.
In the new configuration of VISNAV, different targets are op-erated simultaneously at different frequencies for identificationpurposes as done in frequency division multiplexing (FDM).The advantage of using FDM is that it satisfies the implicit as-sumption of the 6DOF estimation that all the beacon measure-ments are taken at the same time. If the beacons are operatedin TDM and the rate of change of 6DOF data is high, the es-timates based on the measurements, even without consideringthe motion between successive measurements, will induce er-rors. These errors can be reduced by the FDM approach. In thecase of TDM, the lowpass filter after the demodulation needs tohave a passband of about 100Hz ( is the number of bea-cons, 100 Hz is the 6DOF data update rate), where as in FDM, itneeds to be only 100Hz, resulting in an factor improvementin the signal-to-noise power ratio (SNR) of the beacon currents.To achieve the same factor improvement in the SNR in theTDM mode, the peak power of the LED beacons has to be in-creased by so that it will consume the same average poweras in the FDM mode. However, this may not be a viable solu-tion since a large number of LEDs is required because of theincreased peak power requirements. Here, the beacon channelseparation and demodulation are done on a fixed point dig-ital signal processor (DSP) Texas Instruments TMS320C55x(C55x) [2] using digital down conversion, synchronous detec-tion, and multirate signal processing techniques. The demodu-lated sensor currents due to each beacon are communicated toa floating-point DSP Texas Instruments TMS320VC33 (VC33)[2] for the subsequent navigation solution by the use of colin-earity equations and a Gaussian least squares differential correc-tion (GLSDC) algorithm. There are several advantages in per-forming the demodulation in the digital domain. The new con-figuration of the VISNAV sensor system is easily reprogrammed
1530-437X/02$17.00 © 2002 IEEE
GUNNAM et al.: VISION-BASED DSP EMBEDDED NAVIGATION SENSOR 429
and insensitive to temperature variations and aging effects. It isalso easily scaled up to 16 beacons with slight modifications inthe software.
The experimental results show that a beacon’s line-of-sightvector can be determined with an accuracy of approximately onepart in 2000 of the sensor field of view (90cone) angle at a dis-tance of 30 m with an update rate of 100 Hz. Six-degree-of-freedom (6DOF) navigation accuracies of less than 2 mm intranslation estimates and less than 0.01in orientation estimatesat rendezvous, updated at 100 Hz, are routinely possible bysolving the colinearity equations for four or more beacons. Pro-cessing of these 6DOF estimates with a Kalman filter permitsestimation of the relative motion velocity and acceleration withheretofore unachievable accuracy. Autonomous rendezvous anddocking operations are thus enabled as a direct consequenceof precise, reliable, high bandwidth proximity navigation. TheVISNAV sensor system has several advantages such as smallsensor size, wide sensor field of view, no time-consuming imageprocessing, relatively simple electronics, and very small errorsin 6DOF data of the order of 2 mm in position estimates and0.01 in attitude estimates at rendezvous.
Among other competitive systems [3]–[8], a differentialglobal positioning system (GPS) is limited to mid-range accu-racies, lower bandwidth, and requires complex infrastructure.The sensor systems based on differential GPS are also limitedby geometric dilution of precision, multipath errors, receivererrors, etc. These sensor systems provide good 6DOF estimateswith position errors of the order of subcentimeters and attitudeerrors of the order of 1to 2 . Although by using carrier phasemeasurement of GPS, the errors due to multipath and otherfactors can be reduced, all the errors cannot be eliminatedand these GPS-based systems become complicated. Othersensing systems based on lasers, charge couple devices (CCDs)and high-speed cameras require complex image processingand target identification with associated occasional failures.These systems have typically slower update rates limited byframe rates and time-consuming image processing algorithms.Different applications of VISNAV such as formation flyingand aerial refueling are discussed in [9], [10], and moreinformation can be found at the VISNAV Lab website [11].The photographs of the sensor and active beacons of VISNAVare shown in Figs. 1 and 2, respectively. A 3.5” floppy disk isshown at the back to illustrate the compactness of the sensorand the beacons. Fig. 3 illustrates a spacecraft docking scenariousing the VISNAV sensor.
II. SENSORDESCRIPTION
The PSD is a single substrate photodiode capable of findingor locating a light beam within a defined sensing area. One classof PSDs is the area PSD that can measure the two-dimensionalbeam position. When photons reach the PSD sensor, electriccurrents are generated that flow through its four terminals, eachterminal being on one side of the rectangular PSD. The closerthe incident light is to a particular terminal, the larger the currentflowing through that terminal. Comparisons of these four cur-rents then determine the centroid location of the incident light
Fig. 1. VISNAV PSD and preamplifiers (a 3.5" floppy is at the back).
Fig. 2. Active beacons (of three different sizes).
Fig. 3. Spacecraft docking using the VISNAV sensor system. Active beaconsare fixed on one spacecraft while the PSD sensor is fixed on another spacecraft.Some beacons are placed near the docking point and some are placed wide apartto provide a wide range of field of view.
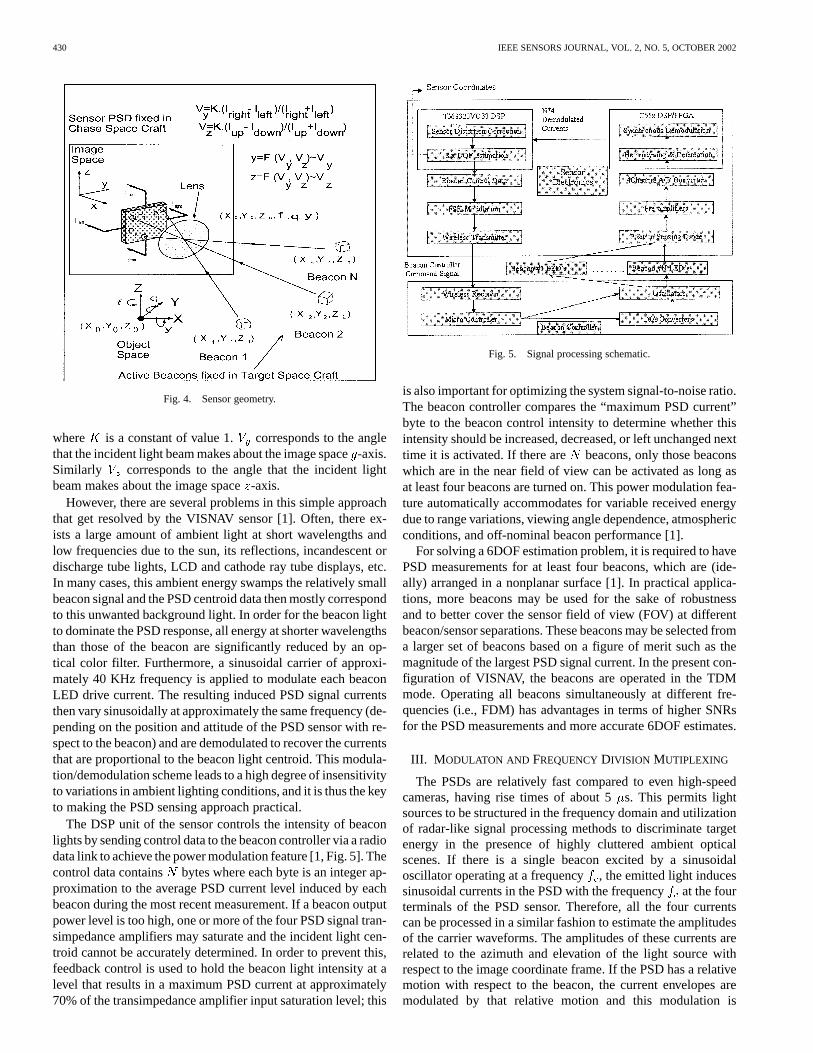
from the target light source (beacon). As indicated in Fig. 4, thefollowing unitless normalized voltages are defined:
(1)
and
(2)
430 IEEE SENSORS JOURNAL, VOL. 2, NO. 5, OCTOBER 2002
Fig. 4. Sensor geometry.
where is a constant of value 1. corresponds to the anglethat the incident light beam makes about the image space-axis.Similarly corresponds to the angle that the incident lightbeam makes about the image space-axis.
However, there are several problems in this simple approachthat get resolved by the VISNAV sensor [1]. Often, there ex-ists a large amount of ambient light at short wavelengths andlow frequencies due to the sun, its reflections, incandescent ordischarge tube lights, LCD and cathode ray tube displays, etc.In many cases, this ambient energy swamps the relatively smallbeacon signal and the PSD centroid data then mostly correspondto this unwanted background light. In order for the beacon lightto dominate the PSD response, all energy at shorter wavelengthsthan those of the beacon are significantly reduced by an op-tical color filter. Furthermore, a sinusoidal carrier of approxi-mately 40 KHz frequency is applied to modulate each beaconLED drive current. The resulting induced PSD signal currentsthen vary sinusoidally at approximately the same frequency (de-pending on the position and attitude of the PSD sensor with re-spect to the beacon) and are demodulated to recover the currentsthat are proportional to the beacon light centroid. This modula-tion/demodulation scheme leads to a high degree of insensitivityto variations in ambient lighting conditions, and it is thus the keyto making the PSD sensing approach practical.
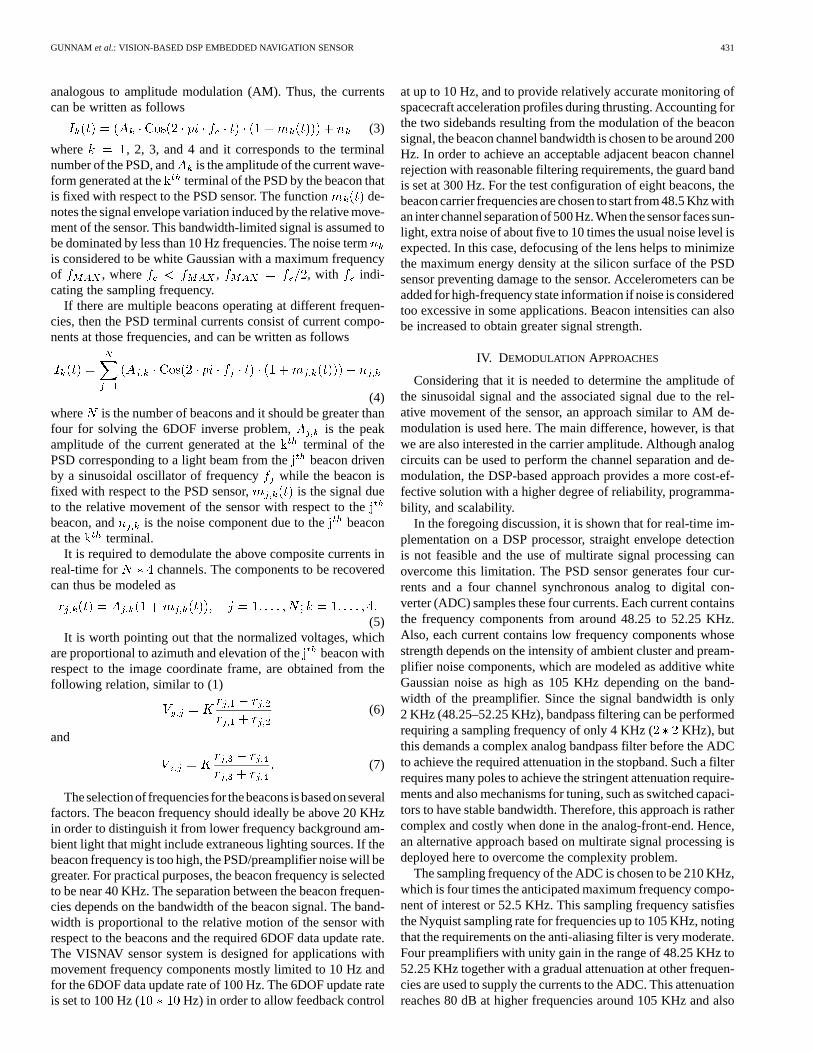
The DSP unit of the sensor controls the intensity of beaconlights by sending control data to the beacon controller via a radiodata link to achieve the power modulation feature [1, Fig. 5]. Thecontrol data contains bytes where each byte is an integer ap-proximation to the average PSD current level induced by eachbeacon during the most recent measurement. If a beacon outputpower level is too high, one or more of the four PSD signal tran-simpedance amplifiers may saturate and the incident light cen-troid cannot be accurately determined. In order to prevent this,feedback control is used to hold the beacon light intensity at alevel that results in a maximum PSD current at approximately70% of the transimpedance amplifier input saturation level; this
Fig. 5. Signal processing schematic.
is also important for optimizing the system signal-to-noise ratio.The beacon controller compares the “maximum PSD current”byte to the beacon control intensity to determine whether thisintensity should be increased, decreased, or left unchanged nexttime it is activated. If there are beacons, only those beaconswhich are in the near field of view can be activated as long asat least four beacons are turned on. This power modulation fea-ture automatically accommodates for variable received energydue to range variations, viewing angle dependence, atmosphericconditions, and off-nominal beacon performance [1].
For solving a 6DOF estimation problem, it is required to havePSD measurements for at least four beacons, which are (ide-ally) arranged in a nonplanar surface [1]. In practical applica-tions, more beacons may be used for the sake of robustnessand to better cover the sensor field of view (FOV) at differentbeacon/sensor separations. These beacons may be selected froma larger set of beacons based on a figure of merit such as themagnitude of the largest PSD signal current. In the present con-figuration of VISNAV, the beacons are operated in the TDMmode. Operating all beacons simultaneously at different fre-quencies (i.e., FDM) has advantages in terms of higher SNRsfor the PSD measurements and more accurate 6DOF estimates.
III. M ODULATON AND FREQUENCYDIVISION MUTIPLEXING
The PSDs are relatively fast compared to even high-speedcameras, having rise times of about 5s. This permits lightsources to be structured in the frequency domain and utilizationof radar-like signal processing methods to discriminate targetenergy in the presence of highly cluttered ambient opticalscenes. If there is a single beacon excited by a sinusoidaloscillator operating at a frequency, the emitted light inducessinusoidal currents in the PSD with the frequencyat the fourterminals of the PSD sensor. Therefore, all the four currentscan be processed in a similar fashion to estimate the amplitudesof the carrier waveforms. The amplitudes of these currents arerelated to the azimuth and elevation of the light source withrespect to the image coordinate frame. If the PSD has a relativemotion with respect to the beacon, the current envelopes aremodulated by that relative motion and this modulation is
GUNNAM et al.: VISION-BASED DSP EMBEDDED NAVIGATION SENSOR 431
analogous to amplitude modulation (AM). Thus, the currentscan be written as follows
(3)
where , 2, 3, and 4 and it corresponds to the terminalnumber of the PSD, and is the amplitude of the current wave-form generated at the terminal of the PSD by the beacon thatis fixed with respect to the PSD sensor. The function de-notes the signal envelope variation induced by the relative move-ment of the sensor. This bandwidth-limited signal is assumed tobe dominated by less than 10 Hz frequencies. The noise termis considered to be white Gaussian with a maximum frequencyof , where , , with indi-cating the sampling frequency.
If there are multiple beacons operating at different frequen-cies, then the PSD terminal currents consist of current compo-nents at those frequencies, and can be written as follows
(4)where is the number of beacons and it should be greater thanfour for solving the 6DOF inverse problem, is the peakamplitude of the current generated at the terminal of thePSD corresponding to a light beam from thebeacon drivenby a sinusoidal oscillator of frequency while the beacon isfixed with respect to the PSD sensor, is the signal dueto the relative movement of the sensor with respect to thebeacon, and is the noise component due to the beaconat the terminal.
It is required to demodulate the above composite currents inreal-time for channels. The components to be recoveredcan thus be modeled as
(5)It is worth pointing out that the normalized voltages, which
are proportional to azimuth and elevation of thebeacon withrespect to the image coordinate frame, are obtained from thefollowing relation, similar to (1)
(6)
and
(7)
Theselectionof frequencies for thebeacons isbasedonseveralfactors. The beacon frequency should ideally be above 20 KHzin order to distinguish it from lower frequency background am-bient light that might include extraneous lighting sources. If thebeacon frequency is too high, the PSD/preamplifier noise will begreater. For practical purposes, the beacon frequency is selectedto be near 40 KHz. The separation between the beacon frequen-cies depends on the bandwidth of the beacon signal. The band-width is proportional to the relative motion of the sensor withrespect to the beacons and the required 6DOF data update rate.The VISNAV sensor system is designed for applications withmovement frequency components mostly limited to 10 Hz andfor the 6DOF data update rate of 100 Hz. The 6DOF update rateis set to 100 Hz ( Hz) in order to allow feedback control
at up to 10 Hz, and to provide relatively accurate monitoring ofspacecraft acceleration profiles during thrusting. Accounting forthe two sidebands resulting from the modulation of the beaconsignal, the beacon channel bandwidth is chosen to be around 200Hz. In order to achieve an acceptable adjacent beacon channelrejection with reasonable filtering requirements, the guard bandis set at 300 Hz. For the test configuration of eight beacons, thebeacon carrier frequencies are chosen to start from 48.5 Khz withan inter channel separation of500Hz.When the sensor facessun-light, extra noise of about five to 10 times the usual noise level isexpected. In this case, defocusing of the lens helps to minimizethe maximum energy density at the silicon surface of the PSDsensor preventing damage to the sensor. Accelerometers can beadded for high-frequency state information if noise is consideredtoo excessive in some applications. Beacon intensities can alsobe increased to obtain greater signal strength.
IV. DEMODULATION APPROACHES
Considering that it is needed to determine the amplitude ofthe sinusoidal signal and the associated signal due to the rel-ative movement of the sensor, an approach similar to AM de-modulation is used here. The main difference, however, is thatwe are also interested in the carrier amplitude. Although analogcircuits can be used to perform the channel separation and de-modulation, the DSP-based approach provides a more cost-ef-fective solution with a higher degree of reliability, programma-bility, and scalability.
In the foregoing discussion, it is shown that for real-time im-plementation on a DSP processor, straight envelope detectionis not feasible and the use of multirate signal processing canovercome this limitation. The PSD sensor generates four cur-rents and a four channel synchronous analog to digital con-verter (ADC) samples these four currents. Each current containsthe frequency components from around 48.25 to 52.25 KHz.Also, each current contains low frequency components whosestrength depends on the intensity of ambient cluster and pream-plifier noise components, which are modeled as additive whiteGaussian noise as high as 105 KHz depending on the band-width of the preamplifier. Since the signal bandwidth is only2 KHz (48.25–52.25 KHz), bandpass filtering can be performedrequiring a sampling frequency of only 4 KHz ( KHz), butthis demands a complex analog bandpass filter before the ADCto achieve the required attenuation in the stopband. Such a filterrequires many poles to achieve the stringent attenuation require-ments and also mechanisms for tuning, such as switched capaci-tors to have stable bandwidth. Therefore, this approach is rathercomplex and costly when done in the analog-front-end. Hence,an alternative approach based on multirate signal processing isdeployed here to overcome the complexity problem.
The sampling frequency of the ADC is chosen to be 210 KHz,which is four times the anticipated maximum frequency compo-nent of interest or 52.5 KHz. This sampling frequency satisfiesthe Nyquist sampling rate for frequencies up to 105 KHz, notingthat the requirements on the anti-aliasing filter is very moderate.Four preamplifiers with unity gain in the range of 48.25 KHz to52.25 KHz together with a gradual attenuation at other frequen-cies are used to supply the currents to the ADC. This attenuationreaches 80 dB at higher frequencies around 105 KHz and also
432 IEEE SENSORS JOURNAL, VOL. 2, NO. 5, OCTOBER 2002
at lower frequencies near 0 Hz. The word length of the ADCis chosen to be 12 bits to obtain a signal-to-quantization-noiseratio (SQNR) of 72 dB so that the quantization noise does notdeteriorate the input SNR, which is around 50 dB.
Since all the four PSD currents are similar in terms of fre-quency components, the beacon channel separation and demod-ulation methods are common to all of them. Bandpass filteringfor the selection of the beacon channel and then envelope de-tection consisting of rectification and lowpass filtering are per-formed. Since the beacon carrier frequencies are separated by500 Hz, the bandpass filter is designed to have a unity gain pass-band from to Hz, a transition bandwidth of150 Hz from to and from to .The stopband attenuation is around 80 dB. Using the Remezformula [12], a finite impulse response (FIR) filter of the order3000 is required. There are four PSD currents and each currenthas eight separate components due to eight different beacons.Implementing 32 ( eight beacons four PSD currents) FIRfilters of order 3000 at a sampling frequency of 210 KHz is notpractical on current DSP processors. The number of operations(multiply and accumulate) and memory accesses per sample aredirectly proportional to the filter order. Therefore, simple en-velope detection in the digital domain at higher sampling fre-quencies for multiple channels is not realizable from a practicalstandpoint. Furthermore, it should be realized that such a filteris not realizable in the analog domain either since an imprac-tical number of poles are needed. Although the situation canbe improved slightly by increasing the separation between thebeacon carriers, this increases the maximum frequency of thesystem and the sampling frequency requirements. In addition,there exist bounds for the modulation process (at around 40 KHzand 100 KHz based on the sensor requirements) as described inSection III and one may want to deploy up to 24 beacons to im-prove the redundancy of the system.
Another alternative is to multiply the PSD sensor current witha synchronous carrier. This demodulates the components corre-sponding to the beacon from the higher frequency range (
to ) to a lower frequency range (0 to 100 Hz).With this approach, it is no longer required to do bandpass fil-tering to separate the beacon channels since multiplying thecomposite PSD signal with the required beacon carrier incorpo-rates this separation. This operation involves only one multipli-cation per sample (multiplication of sine carrier coefficient withthe sample) and three memory accesses per sample (reading ofsample, reading of sine coefficient from a circular buffer, andwriting the product into memory). Computationally, this is veryefficient as compared to the bandpass filtering approach. Notethat the local digital oscillator’s carrier must be in synchroniza-tion with the beacon carrier both in phase and frequency. Thebeacons are excited by stable crystal oscillators. Since the con-figuration of the beacons and the frequencies of the beacons areknown in advance, only phase synchronization has to be per-formed at the beginning of the system operation, assuming thatthere is no significant fading of the channel for an operatingrange of around 100 m between the transmitter and the receiver.After the synchronous multiplication, a lowpass filter of pass-band 0 to 100 Hz and a transition bandwidth of 100 to 500 Hzwith a stopband attenuation of 80 dB is utilized. To implement
this filter at the sampling frequency of 52.5 KHz, a FIR filter oforder of about 1942 is needed. However, implementing 32 FIRfilters of order 1942 at the sampling frequency of 52.5 KHz isnot practical. For the signal of interest from 0 to 100 Hz, theNyquist rate is only 200 Hz. By using the multirate signal pro-cessing techniques discussed in [12], this problem is resolvedby implementing a narrowband filter at higher frequencies via acombination of decimation and interpolation. Considering thatonly low-frequency components are needed, and there is noneed to restore the original sampling rate, such a filter can beachieved by just using decimation. The computational require-ments on the anti-aliasing or decimation filter are reduced bybreaking the decimation into stages [12]. The decimation is per-formed in steps of 4, 3, 4, and 4 achieving a decimation of 192and a final sampling frequency of 1093.75 Hz.
Since the PSD signal is a narrowband signal of only 2 KHzspanning from 48.25 KHz to 52.25 KHz, if we heterodyne thissignal with 52.5 KHz ( ), the PSD signal is down convertedto between 0.25 KHz and 4.25 KHz. Consequently, the beaconcarriers are down converted to the “beated beacon carriers” 0.5to 4 KHz with a channel separation of 500 Hz . These frequen-cies can be written as
(8)
Note that the Nyquist rate for the above signal is only8.5 KHz. Decimation is applied to remove the higher frequencycomponents and to reduce the sampling rate. The decimation isperformed in steps of 4 and 3 achieving a decimation of 12 andsampling frequency of 17 500 Hz, which is approximatelyfour times the maximum frequency of the down converted PSDsignal, 4.25 KHz. Hence, essentially this heterodyning anddecimation procedure transforms the PSD signal from a highersampling rate of 210 KHz to a lower sampling rate of 17.5 KHz.
Next, we proceed with the synchronous detection or envelopedetection on the composite signal. However, as explained previ-ously, synchronous detection is computationally more efficientas compared with the bandpass filtering and envelope detec-tion. For the synchronous detection, it is required to multiply thecomposite PSD signal with carriers s between 0.5 and 4 KHzwith an increment of 500 Hz instead of the carrierss between48.5 and 52 KHz with an increment of 500 Hz. Synchronousdetection requires one to know the value of the carrier sinusoidcorresponding to the composite signal. Although this can be cal-culated by using trigonometric functions, for real-time imple-mentation it is not practical. Instead, a full cycle of the sampledsinusoids at the least common multiple of sampling frequency,i.e., 17.5 KHz, and the frequency of the “beated beacon carrier” are stored. The number of sine values to store for the syn-chronous detection of a carrier at a sampling frequency , ifboth and are integers, is given by
lcm
For the synchronous detection after heterodyning for the car-riers , ; , the following total number ofentries is needed
lcm(9)
GUNNAM et al.: VISION-BASED DSP EMBEDDED NAVIGATION SENSOR 433
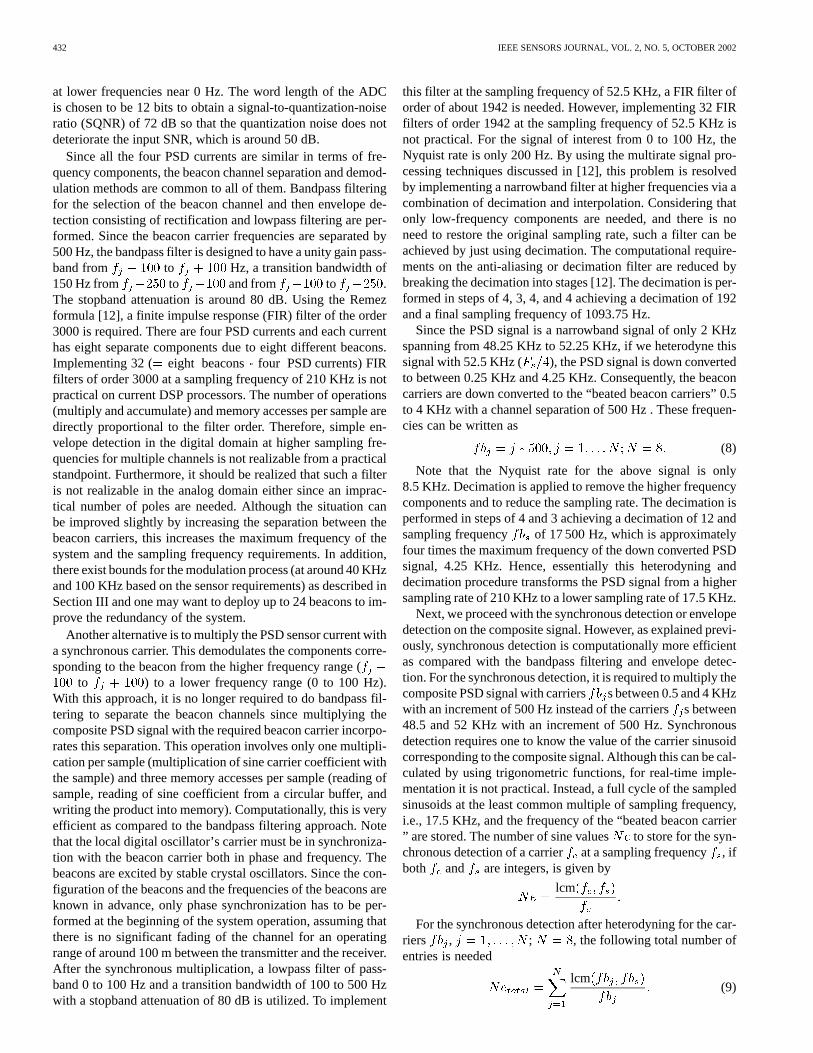
TABLE IDEMODULATION METHODS
From (8) and Hz, we get a value of 222 for. If the q-15 integer format representation [13] is used
to represent these values, 444 ( ) bytes of memory isneeded. This storage requirement is easily achieved using theon-chip DSP memory. On the other hand, the synchronous de-tection approach for the carriers, ; , ata sampling frequency of Hz requires
and 3252( ) bytes of memory for the q-15 in-teger format representation.
After the multiplication with different beat carriers to get dif-ferent channels, each channel current is lowpass filtered usingthe decimation technique. The output SNR for the demodulationsystem is derived easily by noting that the noise performance ofthe demodulation is mainly determined by the lowpass filter fol-lowing the demodulator. Heterodyning mixes the noise band intothe band of interest decreasing the SNR by a factor of 2. Table Iprovides a comparison of the computational requirements andtradeoffs for different demodulation schemes and shows thatheterodyning with synchronous detection is the best choice.
As previously explained, for the test configuration of 8beacons, the beacon carrier frequencies start from 48.5 KHz
with an inter channel separation of 500 Hz. In other words, thebeacon carriers are 48.5, 49.0, 49.5, 50.0, 50.5, 51.0, 51.5, and52.0 KHz. Since the sampling frequency is selected to be210 KHz, the beacon carriers can be written as
(10)
As a result, the PSD sensor current at theterminal can bewritten as
(11)
By heterodyning with a carrier of frequency equal to one fourthof the sampling frequency, i.e.,
the product signal can be written as (12), shown at the bottomof the page.
(12)
434 IEEE SENSORS JOURNAL, VOL. 2, NO. 5, OCTOBER 2002
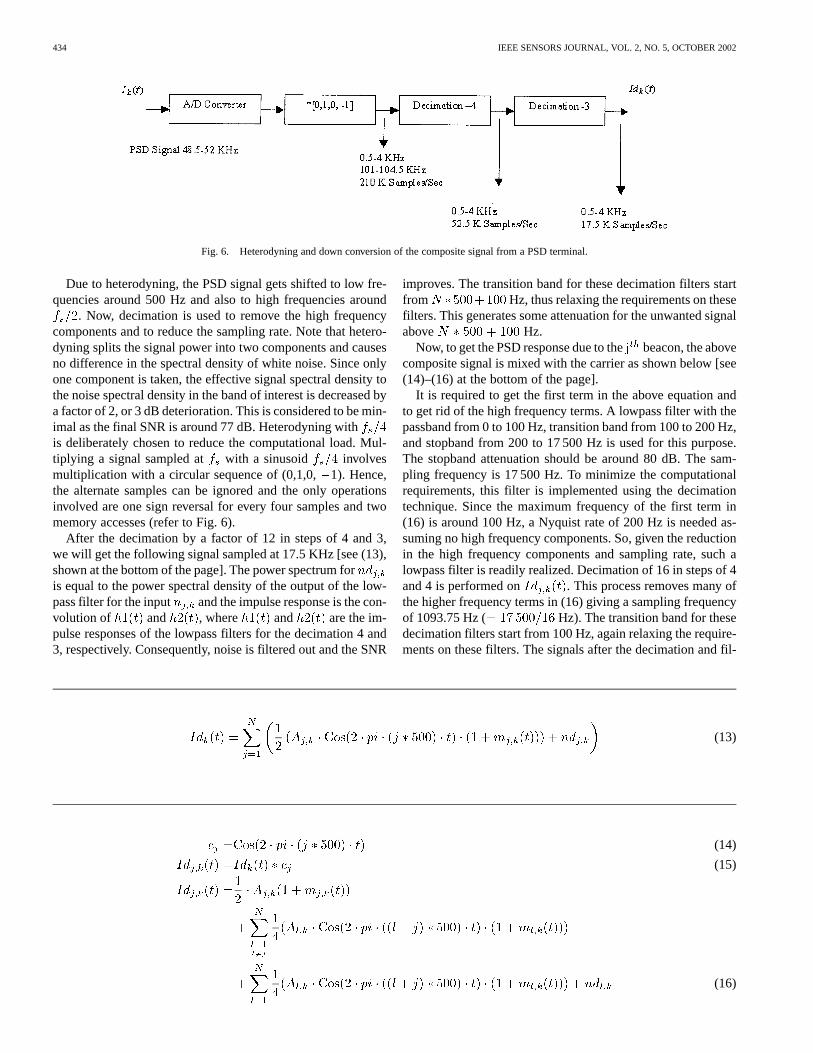
Fig. 6. Heterodyning and down conversion of the composite signal from a PSD terminal.
Due to heterodyning, the PSD signal gets shifted to low fre-quencies around 500 Hz and also to high frequencies around
. Now, decimation is used to remove the high frequencycomponents and to reduce the sampling rate. Note that hetero-dyning splits the signal power into two components and causesno difference in the spectral density of white noise. Since onlyone component is taken, the effective signal spectral density tothe noise spectral density in the band of interest is decreased bya factor of 2, or 3 dB deterioration. This is considered to be min-imal as the final SNR is around 77 dB. Heterodyning withis deliberately chosen to reduce the computational load. Mul-tiplying a signal sampled at with a sinusoid involvesmultiplication with a circular sequence of (0,1,0,1). Hence,the alternate samples can be ignored and the only operationsinvolved are one sign reversal for every four samples and twomemory accesses (refer to Fig. 6).
After the decimation by a factor of 12 in steps of 4 and 3,we will get the following signal sampled at 17.5 KHz [see (13),shown at the bottom of the page]. The power spectrum foris equal to the power spectral density of the output of the low-pass filter for the input and the impulse response is the con-volution of and , where and are the im-pulse responses of the lowpass filters for the decimation 4 and3, respectively. Consequently, noise is filtered out and the SNR
improves. The transition band for these decimation filters startfrom Hz, thus relaxing the requirements on thesefilters. This generates some attenuation for the unwanted signalabove Hz.
Now, to get the PSD response due to thebeacon, the abovecomposite signal is mixed with the carrier as shown below [see(14)–(16) at the bottom of the page].
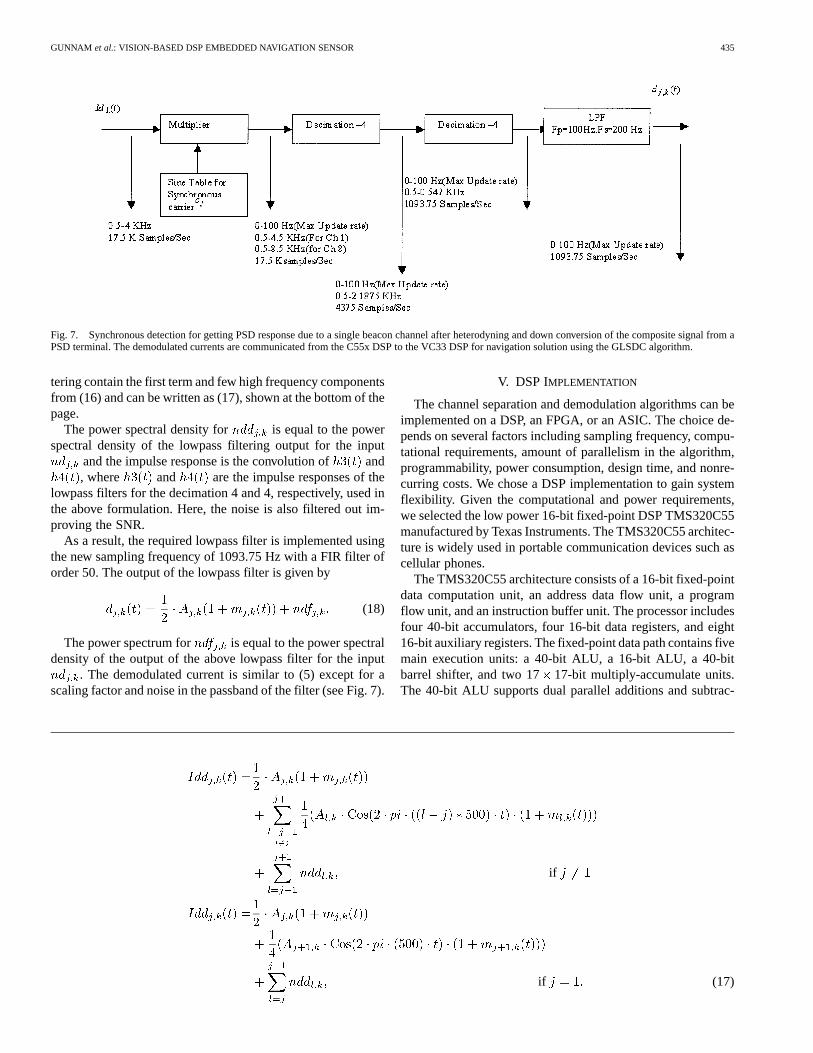
It is required to get the first term in the above equation andto get rid of the high frequency terms. A lowpass filter with thepassband from 0 to 100 Hz, transition band from 100 to 200 Hz,and stopband from 200 to 17 500 Hz is used for this purpose.The stopband attenuation should be around 80 dB. The sam-pling frequency is 17 500 Hz. To minimize the computationalrequirements, this filter is implemented using the decimationtechnique. Since the maximum frequency of the first term in(16) is around 100 Hz, a Nyquist rate of 200 Hz is needed as-suming no high frequency components. So, given the reductionin the high frequency components and sampling rate, such alowpass filter is readily realized. Decimation of 16 in steps of 4and 4 is performed on . This process removes many ofthe higher frequency terms in (16) giving a sampling frequencyof 1093.75 Hz ( Hz). The transition band for thesedecimation filters start from 100 Hz, again relaxing the require-ments on these filters. The signals after the decimation and fil-
(13)
(14)
(15)
(16)
GUNNAM et al.: VISION-BASED DSP EMBEDDED NAVIGATION SENSOR 435
Fig. 7. Synchronous detection for getting PSD response due to a single beacon channel after heterodyning and down conversion of the composite signal from aPSD terminal. The demodulated currents are communicated from the C55x DSP to the VC33 DSP for navigation solution using the GLSDC algorithm.
tering contain the first term and few high frequency componentsfrom (16) and can be written as (17), shown at the bottom of thepage.
The power spectral density for is equal to the powerspectral density of the lowpass filtering output for the input
and the impulse response is the convolution of and, where and are the impulse responses of the
lowpass filters for the decimation 4 and 4, respectively, used inthe above formulation. Here, the noise is also filtered out im-proving the SNR.
As a result, the required lowpass filter is implemented usingthe new sampling frequency of 1093.75 Hz with a FIR filter oforder 50. The output of the lowpass filter is given by
(18)
The power spectrum for is equal to the power spectraldensity of the output of the above lowpass filter for the input
. The demodulated current is similar to (5) except for ascaling factor and noise in the passband of the filter (see Fig. 7).
V. DSP IMPLEMENTATION
The channel separation and demodulation algorithms can beimplemented on a DSP, an FPGA, or an ASIC. The choice de-pends on several factors including sampling frequency, compu-tational requirements, amount of parallelism in the algorithm,programmability, power consumption, design time, and nonre-curring costs. We chose a DSP implementation to gain systemflexibility. Given the computational and power requirements,we selected the low power 16-bit fixed-point DSP TMS320C55manufactured by Texas Instruments. The TMS320C55 architec-ture is widely used in portable communication devices such ascellular phones.
The TMS320C55 architecture consists of a 16-bit fixed-pointdata computation unit, an address data flow unit, a programflow unit, and an instruction buffer unit. The processor includesfour 40-bit accumulators, four 16-bit data registers, and eight16-bit auxiliary registers. The fixed-point data path contains fivemain execution units: a 40-bit ALU, a 16-bit ALU, a 40-bitbarrel shifter, and two 17 17-bit multiply-accumulate units.The 40-bit ALU supports dual parallel additions and subtrac-
if
if (17)
436 IEEE SENSORS JOURNAL, VOL. 2, NO. 5, OCTOBER 2002
tions by treating 32-bit memory operands as packed 16-bit data.It also supports dual 16-bit maximum and minimum operations.The instructions are variable byte lengths ranging in size from8 bits to 48 bits for improved code density. The instruction setalso includes syntax that allows the programmer or compiler toschedule multiple instructions for parallel execution. The powerconsumption is as low as 0.05 mW per MIPS and supports 400MIPS at an operating clock of 200 MHz [2], [14].
In the VISNAV sensor system, a four-channel synchronousA/D converter operating at 210 KHz supplies the four currentsfrom the preamplifiers, which follow the PSD sensor. Thesesamples are transferred to the internal DSP memory using thedirect memory access (DMA) transfer mode of the DSP. The al-gorithms are programmed in the C55x assembly for the optimaluse of the DSP architecture. The method of heterodyning andsynchronous detection on a TMS320C55x takes around 20% ofthe CPU time for eight beacons. The DSP allows up to 16 bea-cons to be accommodated. A comparison with the other methodsis provided in Table I.
The TMS320C55 DSP communicates the demodulatedbeacon currents to a floating point DSP TMS320VC33 for asubsequent navigation solution. The TMS320VC33 supports75MIPS and 150 MFLOPS at an operating clock of 150 MHzand consumes 0.5 mW per MFLOP [2].
VI. SIX DOF ESTIMATION
The normalized voltages computed from the PSD imbalancecurrents using (6) and (7) due to the target are mapped tothe horizontal and vertical displacement ( ) estimates ofthat target beacon’s image with respect to the sensor frame (seeFig. 4). This mapping compensates primarily for lens distortionusing Chebyshev polynomials [1].
As indicated in Fig. 4, , are the normalized voltages; ,, are the known object space coordinates of the target light
source ( beacon); , , are the unknown object spacecoordinates of the sensor attached to the chase frame;is theunknown direction cosine matrix of the image space coordinateframe with respect to the object space coordinate frame;,are the lens calibration maps;is the focal length of the sensorlens and , are the ideal image spot centroid coordinates inthe image space coordinate frame corresponding to thetargetlight source.
A. System Equations
The sensor electronics, the ambient light sources, and the in-herent properties of the sensor produce noise in the PSD mea-surements. This noise is considered to be zero mean Gaussiannoise. The measurement model is given by
(19)
where denotes the state vector of the sensor, andis the position vector, is the orienta-
tion vector, which depends on the attitude parameters used, andis an ideal measurement model and is a function of
and
(20)
and is the Gaussian measurement noise with covariance
(21)
Using the GLSDC algorithm to determine the states, atti-tude and position, the best geometric solution in the least squaresense is obtained upon convergence through iterations [1]. Esti-mates for position and attitude are refined through iterations ofGLSDC as it minimizes the weighted sum of squares given by
(22)
where is the weighting matrix and
(23)
From the geometric colinearity equations, the ideal image cen-troid coordinates can be written as [1]
(24)
An alternate representation for the above equations can bewritten based on the unit line of sight vector as [9]
(25)
where
(26)
are the sensor frame unit vectors
(27)
are the object frame unit vectors, and
(28)
We have choices to make in the coordinate representation forthe directional cosine matrix in terms of different attitude rep-resentations such as Euler’s angles and modified Rodrigues pa-rameters (MRPs). MRPs are derived from the quaternions andyield better results in terms of linearity since they linearize likequarter-angles instead of half-angles for the quaternions, the in-terested reader is referred to [15] for more details.
The MRPs are defined as
(29)
GUNNAM et al.: VISION-BASED DSP EMBEDDED NAVIGATION SENSOR 437
where is the rotation axis; is the principalrotation angle. The 3 3 direction cosine matrix in terms ofMRPs is given by [15]
(30)
and
(31)
B. Measurement Models
We can now use the parameters in (24), or the normal-ized parameters in (26), as the parameters of the measurementmodel in (19). Here, these two models are referred to for conve-nience as MRP-B2 and MRP-B3, respectively. Sinceis con-stant, there is no need to consider this parameter and this willeliminate the redundancy in calculations. Most of the redun-dancy is eliminated due to the fact that now the measurementsensitivity matrix in (40) is 6 instead of 6 and thematrix in (22) is instead of .
The simulations have shown that the model MRP-B2 gener-ates less accurate results as the parameterprovides importantinformation when the sensor is very near the target, though itachieves computational savings of up to 20% as compared to themodel MRP-B3n. A new measurement model is thus presentedhere, referred to as MRP-B2n, which uses only two parameterswith normalization to get better convergence results. That is
(32)
which can be represented as follows:
(33)
where
(34)
This new model MRP-B2n achieves the same convergenceresults as the MRP-B3n while achieving computational savingsof up to 20% as compared to the MRP-B3n. The measurementsensitivity matrix for the beacon is obtained by partialdifferentiation of the measurement model with respect to thestate vector
(35)
(36)
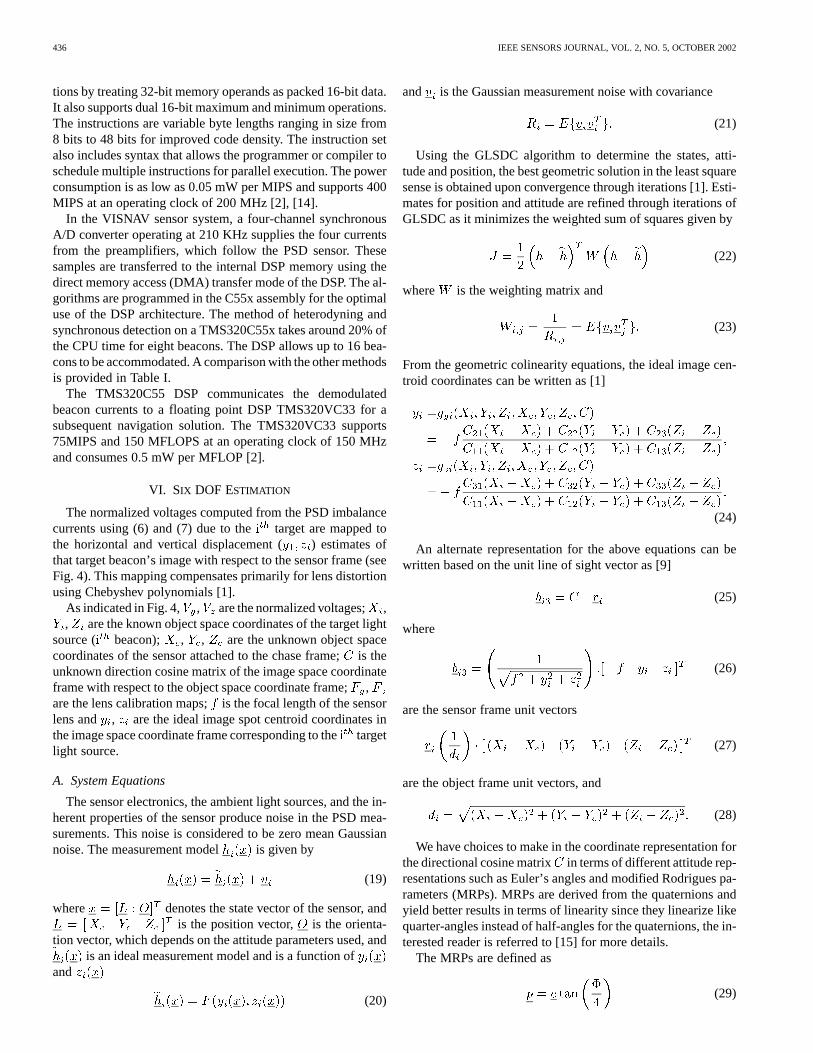
Fig. 8. Simulated flight trajectory.
where
(37)
The actual measurement matrix forbeacons using (15) is
(38)
The estimated ideal measurement matrix using estimated posi-tion and orientation in the colinearity (16) is thus
(39)
and the measurement sensitivity matrix is
(40)
C. GLSDC Algorithm
The initial state . If , then is guessed.Next iterate using the following procedure where is thecovariance and in (22) for the iteration at the
time step; in (22), in (38) and in(39) at the time step
(41)
Stop iterating when one of these conditions is met.
1) The states are no longer improved.2) The number of iterations reaches a specified limit.This version of GLSDC algorithm is robust when there are
four or more beacons measured except near certain geometricconditions that are rarely encountered. An extended Kalmanfilter can be applied to smooth out these 6DOF estimates and
438 IEEE SENSORS JOURNAL, VOL. 2, NO. 5, OCTOBER 2002
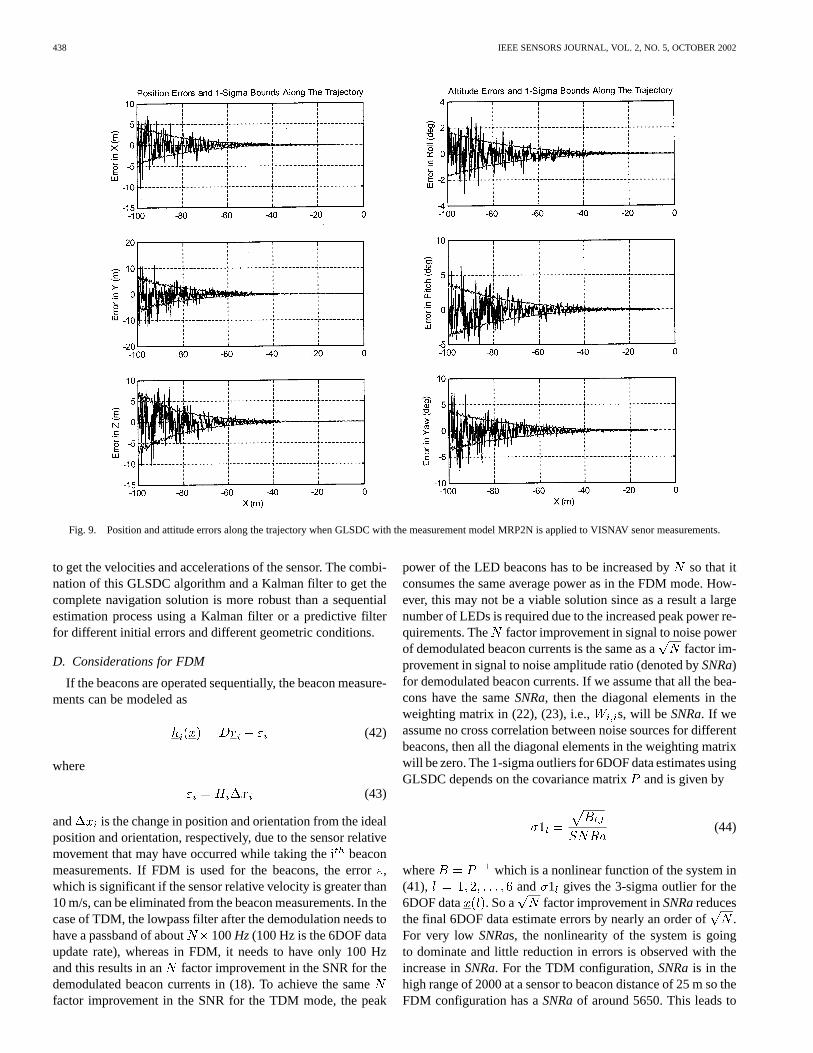
Fig. 9. Position and attitude errors along the trajectory when GLSDC with the measurement model MRP2N is applied to VISNAV senor measurements.
to get the velocities and accelerations of the sensor. The combi-nation of this GLSDC algorithm and a Kalman filter to get thecomplete navigation solution is more robust than a sequentialestimation process using a Kalman filter or a predictive filterfor different initial errors and different geometric conditions.
D. Considerations for FDM
If the beacons are operated sequentially, the beacon measure-ments can be modeled as
(42)
where
(43)
and is the change in position and orientation from the idealposition and orientation, respectively, due to the sensor relativemovement that may have occurred while taking thebeaconmeasurements. If FDM is used for the beacons, the error,which is significant if the sensor relative velocity is greater than10 m/s, can be eliminated from the beacon measurements. In thecase of TDM, the lowpass filter after the demodulation needs tohave a passband of about 100Hz (100 Hz is the 6DOF dataupdate rate), whereas in FDM, it needs to have only 100 Hzand this results in an factor improvement in the SNR for thedemodulated beacon currents in (18). To achieve the samefactor improvement in the SNR for the TDM mode, the peak
power of the LED beacons has to be increased byso that itconsumes the same average power as in the FDM mode. How-ever, this may not be a viable solution since as a result a largenumber of LEDs is required due to the increased peak power re-quirements. The factor improvement in signal to noise powerof demodulated beacon currents is the same as afactor im-provement in signal to noise amplitude ratio (denoted bySNRa)for demodulated beacon currents. If we assume that all the bea-cons have the sameSNRa, then the diagonal elements in theweighting matrix in (22), (23), i.e., s, will be SNRa. If weassume no cross correlation between noise sources for differentbeacons, then all the diagonal elements in the weighting matrixwill be zero. The 1-sigma outliers for 6DOF data estimates usingGLSDC depends on the covariance matrixand is given by
(44)
where which is a nonlinear function of the system in(41), and 1 gives the 3-sigma outlier for the6DOF data . So a factor improvement inSNRareducesthe final 6DOF data estimate errors by nearly an order of.For very low SNRas, the nonlinearity of the system is goingto dominate and little reduction in errors is observed with theincrease inSNRa. For the TDM configuration,SNRais in thehigh range of 2000 at a sensor to beacon distance of 25 m so theFDM configuration has aSNRaof around 5650. This leads to
GUNNAM et al.: VISION-BASED DSP EMBEDDED NAVIGATION SENSOR 439
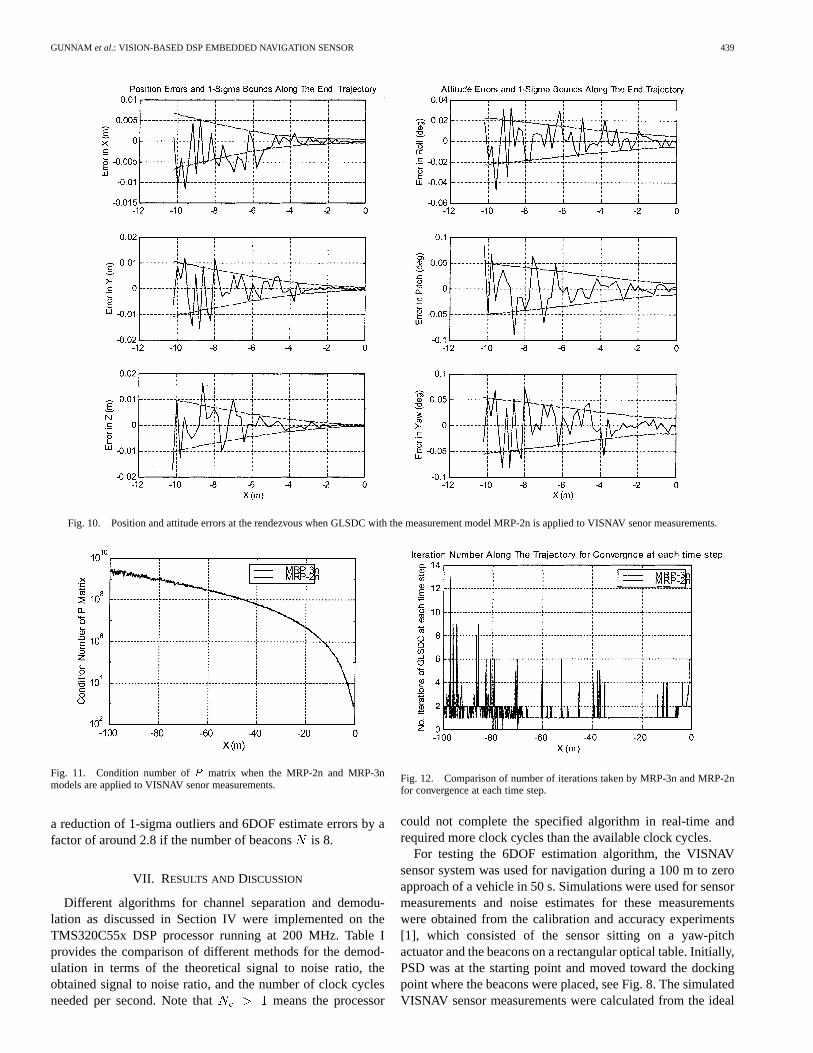
Fig. 10. Position and attitude errors at the rendezvous when GLSDC with the measurement model MRP-2n is applied to VISNAV senor measurements.
Fig. 11. Condition number ofP matrix when the MRP-2n and MRP-3nmodels are applied to VISNAV senor measurements.
a reduction of 1-sigma outliers and 6DOF estimate errors by afactor of around 2.8 if the number of beaconsis 8.
VII. RESULTS AND DISCUSSION
Different algorithms for channel separation and demodu-lation as discussed in Section IV were implemented on theTMS320C55x DSP processor running at 200 MHz. Table Iprovides the comparison of different methods for the demod-ulation in terms of the theoretical signal to noise ratio, theobtained signal to noise ratio, and the number of clock cyclesneeded per second. Note that means the processor
Fig. 12. Comparison of number of iterations taken by MRP-3n and MRP-2nfor convergence at each time step.
could not complete the specified algorithm in real-time andrequired more clock cycles than the available clock cycles.
For testing the 6DOF estimation algorithm, the VISNAVsensor system was used for navigation during a 100 m to zeroapproach of a vehicle in 50 s. Simulations were used for sensormeasurements and noise estimates for these measurementswere obtained from the calibration and accuracy experiments[1], which consisted of the sensor sitting on a yaw-pitchactuator and the beacons on a rectangular optical table. Initially,PSD was at the starting point and moved toward the dockingpoint where the beacons were placed, see Fig. 8. The simulatedVISNAV sensor measurements were calculated from the ideal
440 IEEE SENSORS JOURNAL, VOL. 2, NO. 5, OCTOBER 2002
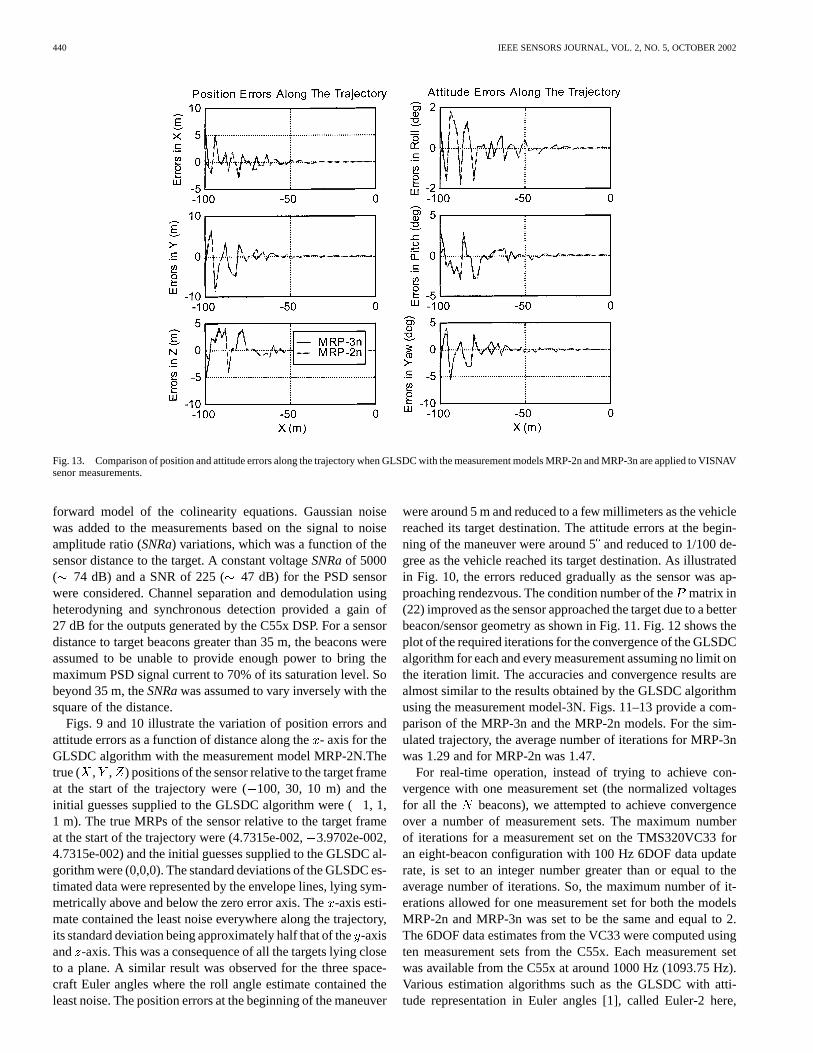
Fig. 13. Comparison of position and attitude errors along the trajectory when GLSDC with the measurement models MRP-2n and MRP-3n are applied to VISNAVsenor measurements.
forward model of the colinearity equations. Gaussian noisewas added to the measurements based on the signal to noiseamplitude ratio (SNRa) variations, which was a function of thesensor distance to the target. A constant voltageSNRaof 5000( 74 dB) and a SNR of 225 ( 47 dB) for the PSD sensorwere considered. Channel separation and demodulation usingheterodyning and synchronous detection provided a gain of27 dB for the outputs generated by the C55x DSP. For a sensordistance to target beacons greater than 35 m, the beacons wereassumed to be unable to provide enough power to bring themaximum PSD signal current to 70% of its saturation level. Sobeyond 35 m, theSNRawas assumed to vary inversely with thesquare of the distance.
Figs. 9 and 10 illustrate the variation of position errors andattitude errors as a function of distance along the- axis for theGLSDC algorithm with the measurement model MRP-2N.Thetrue ( , , ) positions of the sensor relative to the target frameat the start of the trajectory were (100, 30, 10 m) and theinitial guesses supplied to the GLSDC algorithm were (1, 1,1 m). The true MRPs of the sensor relative to the target frameat the start of the trajectory were (4.7315e-002,3.9702e-002,4.7315e-002) and the initial guesses supplied to the GLSDC al-gorithm were (0,0,0). The standard deviations of the GLSDC es-timated data were represented by the envelope lines, lying sym-metrically above and below the zero error axis. The-axis esti-mate contained the least noise everywhere along the trajectory,its standard deviation being approximately half that of the-axisand -axis. This was a consequence of all the targets lying closeto a plane. A similar result was observed for the three space-craft Euler angles where the roll angle estimate contained theleast noise. The position errors at the beginning of the maneuver
were around 5 m and reduced to a few millimeters as the vehiclereached its target destination. The attitude errors at the begin-ning of the maneuver were around 5and reduced to 1/100 de-gree as the vehicle reached its target destination. As illustratedin Fig. 10, the errors reduced gradually as the sensor was ap-proaching rendezvous. The condition number of thematrix in(22) improved as the sensor approached the target due to a betterbeacon/sensor geometry as shown in Fig. 11. Fig. 12 shows theplot of the required iterations for the convergence of the GLSDCalgorithm for each and every measurement assuming no limit onthe iteration limit. The accuracies and convergence results arealmost similar to the results obtained by the GLSDC algorithmusing the measurement model-3N. Figs. 11–13 provide a com-parison of the MRP-3n and the MRP-2n models. For the sim-ulated trajectory, the average number of iterations for MRP-3nwas 1.29 and for MRP-2n was 1.47.
For real-time operation, instead of trying to achieve con-vergence with one measurement set (the normalized voltagesfor all the beacons), we attempted to achieve convergenceover a number of measurement sets. The maximum numberof iterations for a measurement set on the TMS320VC33 foran eight-beacon configuration with 100 Hz 6DOF data updaterate, is set to an integer number greater than or equal to theaverage number of iterations. So, the maximum number of it-erations allowed for one measurement set for both the modelsMRP-2n and MRP-3n was set to be the same and equal to 2.The 6DOF data estimates from the VC33 were computed usingten measurement sets from the C55x. Each measurement setwas available from the C55x at around 1000 Hz (1093.75 Hz).Various estimation algorithms such as the GLSDC with atti-tude representation in Euler angles [1], called Euler-2 here,
GUNNAM et al.: VISION-BASED DSP EMBEDDED NAVIGATION SENSOR 441
TABLE II6DOF ESTIMATION
and in MRPs were implemented on the floating point DSPTMS320VC33 (VC33).
Table II provides the comparison of computational require-ments and the robustness for the GLSDC algorithms with dif-ferent measurement models. Here, MRP-3n was considered tobe the reference frame for the required number of floating pointoperations (flops). The number of flops required by Matlab forthis algorithm was equal to . The robustness measure is basedon the algorithm lock after applying different guesses for the ini-tial position and attitude estimates at the start of the navigation.The algorithm was implemented on the TMS320VC33 in op-timized assembly and the results are shown in Table II for thecase of eight beacon configuration.
VIII. C ONCLUSION
A new method for operating beacons and demodulating thebeacon currents for the VISNAV sensor system is introduced inthis paper. It is shown that target differentiation based on FDMyields higher signal to noise ratios for the sensor measurementsand the demodulation in the digital domain using multi-ratesignal processing techniques brings reliability and flexibility tothe sensor system. An optimal associated six degrees of freedomdata estimation algorithm using MRPs is presented which is ap-plied to the measurements from the VISNAV sensor to get thenavigation solution. This algorithm is robust when there are fouror more line of sight measurements except near certain geo-metric conditions that are rarely encountered. It is shown thatthis algorithm is computationally efficient and achieves betterresults than the algorithms that deploy Euler angles for attituderepresentation.
REFERENCES
[1] J. L. Junkins, D. C. Hughes, K. P. Wazni, and V. Pariyapong, “Vision-based navigation for rendezvous, docking, and proximity operations,”Proc. 22nd Annu. AAS Guidance Contr. Conf., AAS 99-021, Feb.1999.
[2] Information on Texas Instruments Digital Signal Processors (DSP) [On-line]. Available: http://dspvillage.ti.com/
[3] Information on Global Positiong System [Online]. Available:www.gpsworld.com
[4] R. Howard, T. Bryan, M. Book, and R. Dabney, “The video guidancesensor–A flight proven technology,”Proc. 22nd Annu. AAS GuidanceContr. Conf., AAS 99-025, Feb. 1999.
[5] P. Calhoun and R. Dabney, “A solution to the problem of determining therelative 6 DOF state for spacecraft automated rendezvous and docking,”in Proc. SPIE Space Guidance, Contr., Tracking II, Orlando, FL, Apr.17–18, 1995, pp. 175–184.
[6] S. D. Lindell and W. S. Cook, “Closed-loop autonomous rendezvous andcapture demonstration based on optical pattern recognition,”Proc. 22ndAnnual AAS Guidance Contr. Conf., AAS 99-027, Feb. 1999.
[7] M. Mokuno, I. Kawano, and T. Kasai, “Experimental results ofautonomous rendezvous docking on Japanese ETS-VII satellite,”Proc.22nd Annu. AAS Guidance Contr. Conf., AAS 99-022, Feb. 1999.
[8] J. L. Junkins, G. Ju, H. Kim, and T. Pollock, “Digistar: A low cost microstar tracker,”Proc. AIAA Space Technol. Conf. Exposition, Sept. 28–30,1999.
[9] R. Alonso, J.-Y. Du, D. Hughes, J. L. Junkins, and J. L. Crassidis, “Rel-ative navigation for formation flight of spacecraft,”Proc. Flight Me-chanics Symp., June 2001.
[10] J. Valasek, J. Kimmett, D. Hughes, K. Gunnam, and J. Junkins, “Visionbased sensor and navigation system for autonomous aerial refueling,”Proc. 1st AIAA Unmanned Aerosp. Vehicles, Syst., Technol., Oper. Conf.,AIAA-2002-3441, May 20–22, 2002.
[11] Vision Based Navigation System [Online]. Available: http://jungfrau.tamu.edu/~html/VisionLab/
[12] P. P. Vaidyanathan,Multirate Systems and Filter Banks. EnglewoodCliffs, NJ: Prentice-Hall, 1993.
[13] N. Kehtarnavaz and M. Keramat,DSP System Design: Using theTMS320C6000. Englewood Cliffs, NJ: Prentice-Hall, 2001.
[14] Review of DSP Processors [Online]. Available: http://www.bdti.com/procsum/tic55xx.htm
[15] J. L. Junkins,An Introduction to Optimal Estimation of Dynamical Sys-tems. Alphen Aan Den Rijn, The Netherlands: Sijthoff & Noordhoff,1987.
Kiran K. Gunnam was born in Peddada, India,in 1977. He received the B.Tech. degree anddiploma, both in electronics and communicationsengineering, from Jawaharlal Nehru TechnologicalUniversity College of Engineering, Kakinada, India,in 1999 and Andhra Polytechnic, Kakinada, in 1995,respectively. He is currently a graduate student withthe Department of Electrical Engineering, TexasA&M University, College Station. His graduatestudies and research from January 2000 to May2002 were funded and guided by Dr. Junkins and Dr.
Kehtarnavaz as the Co-Chairs of his thesis committee.He was a Graduate Research Assistant with Dr. Junkins in the Department
of Aerospace Engineering, Texas A&M University, for two years, and in theDepartment of Electrical Engineering with Dr.Kehtarnavaz for one semester,both times under the supervision and direction of Dr. Hughes. He is a Co-OpEngineer with the Itanium Processor Group, Intel Corporation, Santa Clara, CA.His research interests include signal processing and computer architecture.
Declan C. Hughesreceived the B.S. degree in elec-tronic engineering from University College, Dublin,Ireland, in 1985, and the M.S. and Ph.D. degrees inelectrical engineering from Rensselaer PolytechnicInstitute, Troy, NY, in 1992 and 1997, respectively.
He is currently a Research Engineer with the Com-mercial Space Center for Engineering (CSCE), TexasA&M University, College Station. He has been withTexas A&M since 1995 designing and developing toprototype stage noncontact position and orientationsensors. Recently, he has directed the development
of hardware and software for high-bandwidth and accuracy VISNAV guidancesensors that may be applied to many tasks including aircraft and spacecraft rel-ative navigation. He is also a co-inventor on a patent granted for one of thesesystems.
442 IEEE SENSORS JOURNAL, VOL. 2, NO. 5, OCTOBER 2002
John L. Junkins received the M.S. and PhD degreesfrom the University of California, Los Angeles, in1967 and 1969, respectively, and the B.A.E. degreefrom Auburn University, Auburn, AL, in 1965.
He is a Distinguished Professor of aerospaceengineering at Texas A&M University, CollegeStation. He holds the George Eppright EndowedChair Professorship. He is the Director of the Centerfor Mechanics and Control., and is also the foundingDirector of the NASA funded University Research,Education Technology Institute (URETI), a collabo-
ration of six Texas Universities focused on integrating research and educationin nanotechnology and autonomous intelligent systems. Prior to joining TexasA&M University in 1985, he held previous academic appointments at theUniversity of Virginia, Charlottesville (1970–1977), and at Virginia Tech,Blacksburg (1978–1985). He was also with McDonnell Douglas AstronauticsCompany (1965–1970) and NASA Marshall Space Flight Center (1962–1965).His technical interests include navigation, guidance, and control of spacecraftand aircraft. He has recently invented new vision sensors with applicationto robotics, virtual reality and manufacturing, as well as aerospace systems.His ideas have been implemented successfully in over a dozen aerospaceand industrial systems. He has directed six dozen graduate students andpostdoctoral researchers leading to four descendant generations of professorsand engineers in industry. He has over 350 publications, including threetextbooks in print, two in press, three edited texts, over 120 archival journalpublications, and several recent patents.
Dr. Junkins is a member of the National Academy of Engineering and theInternational Academy of Astronautics, and he is a Fellow of the American In-stitute of Aeronautics and Astronautics (AIAA) and the American Astronom-ical Society (AAS). He has received a dozen national and international honors,including the AIAA Mechanics and Control of Flight Award, the AIAA Pen-dray Aerospace Literature Award, and the International Astronautical Federa-tion Frank Malina Medal.
Nasser Kehtarnavaz(S’82–M’86–SM’92) receivedthe Ph.D. degree from Rice University, Houston, TX,in 1987.
He is currently a Professor of electrical engi-neering at the University of Texas, Dallas. Previously,he was a Professor of electrical engineering at TexasA&M University, College Station. His researchinterests include digital signal processing, imageprocessing, pattern recognition, and image analysis.He is currently serving as the Editor-in-Chief of theJournal of Real-Time Imaging.
Dr. Kehtarnavaz is an Associate Editor of IEEE TRANSACTIONS ONIMAGE
PROCESSING.

![Group #2 / Embedded Motion Control [5HC99] Embedded Visual Control 1 Group #5 / Embedded Visual Control Self-Balancing Robot Navigation Paul Padila Vivian](https://img.pdfslide.us/doc/110x75/56649e685503460f94b6469a/group-2-embedded-motion-control-5hc99-embedded-visual-control-1-group.jpg)