Embed Size (px)
Citation preview
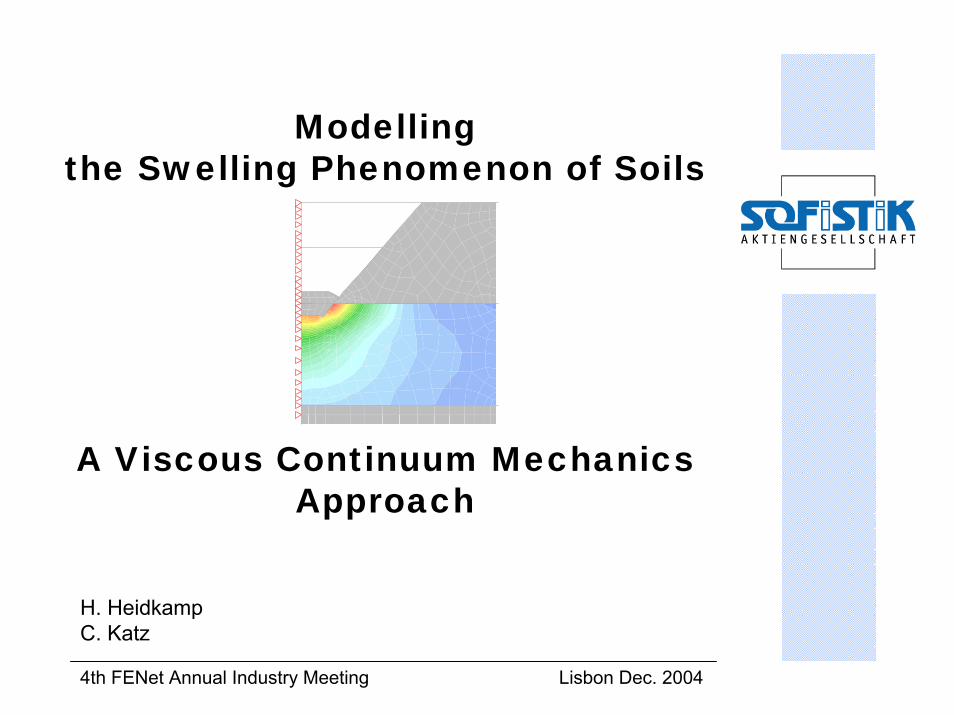
4th FENet Annual Industry Meeting Lisbon Dec. 2004
Modelling the Swelling Phenomenon of Soils
A Viscous Continuum MechanicsApproach
H. HeidkampC. Katz
4th FENet Annual Industry Meeting Lisbon Dec. 2004
Contents
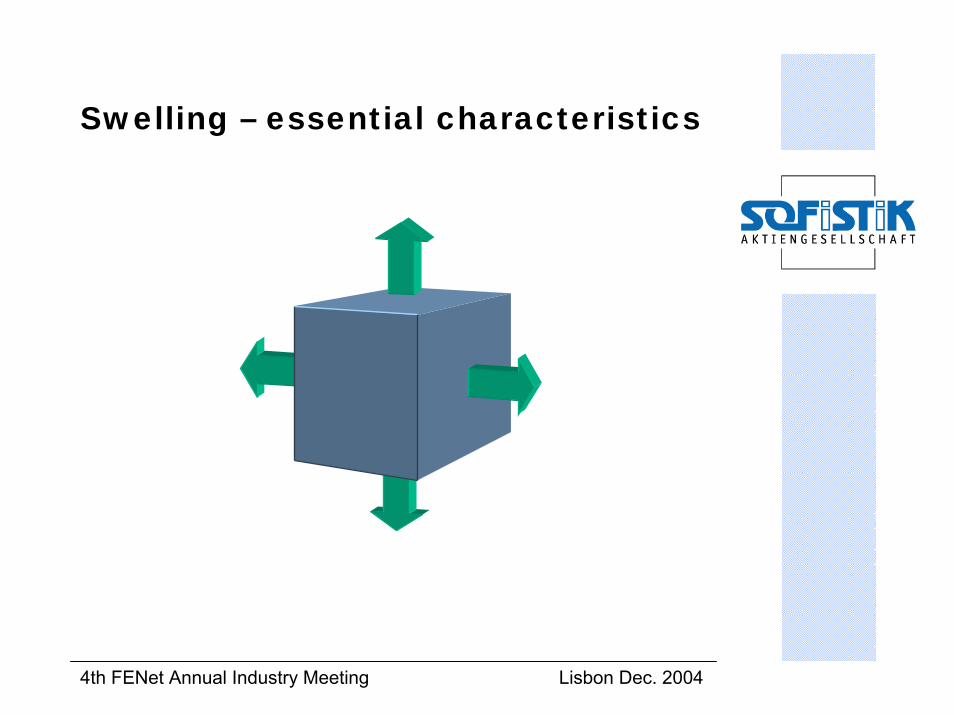
Swelling – essential characteristics
Constitutive modelling Final state relationTime-dependant extensionAlgorithmic aspects
Numerical studies
Conclusive remarks
4th FENet Annual Industry Meeting Lisbon Dec. 2004
Swelling – essential characteristics
4th FENet Annual Industry Meeting Lisbon Dec. 2004
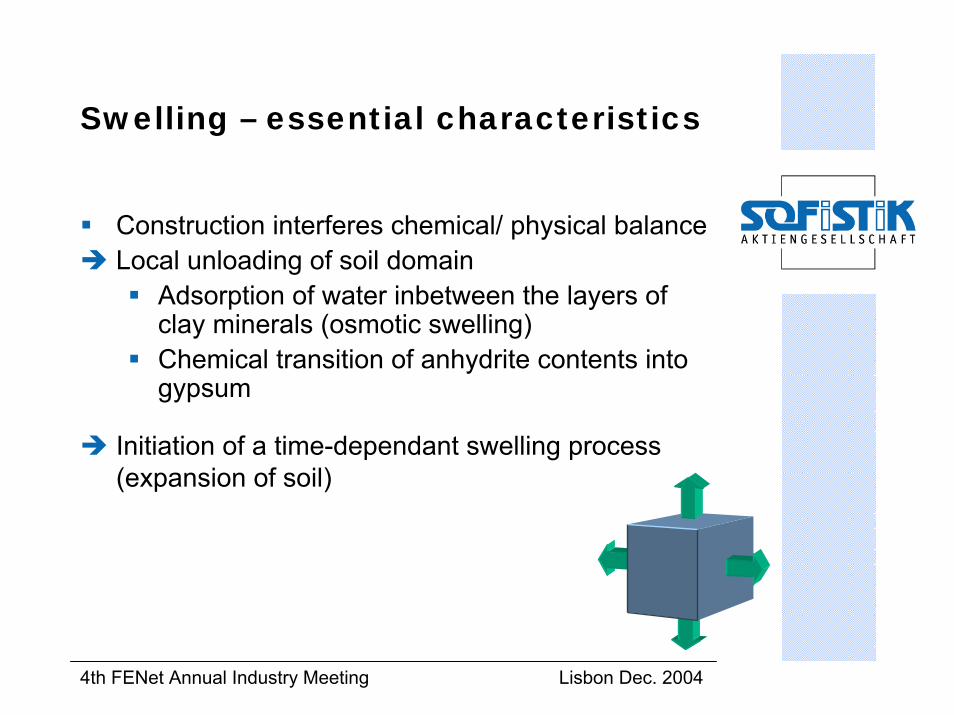
Swelling – essential characteristics
Construction interferes chemical/ physical balanceLocal unloading of soil domain
Adsorption of water inbetween the layers of clay minerals (osmotic swelling)Chemical transition of anhydrite contents into gypsum
Initiation of a time-dependant swelling process(expansion of soil)
4th FENet Annual Industry Meeting Lisbon Dec. 2004
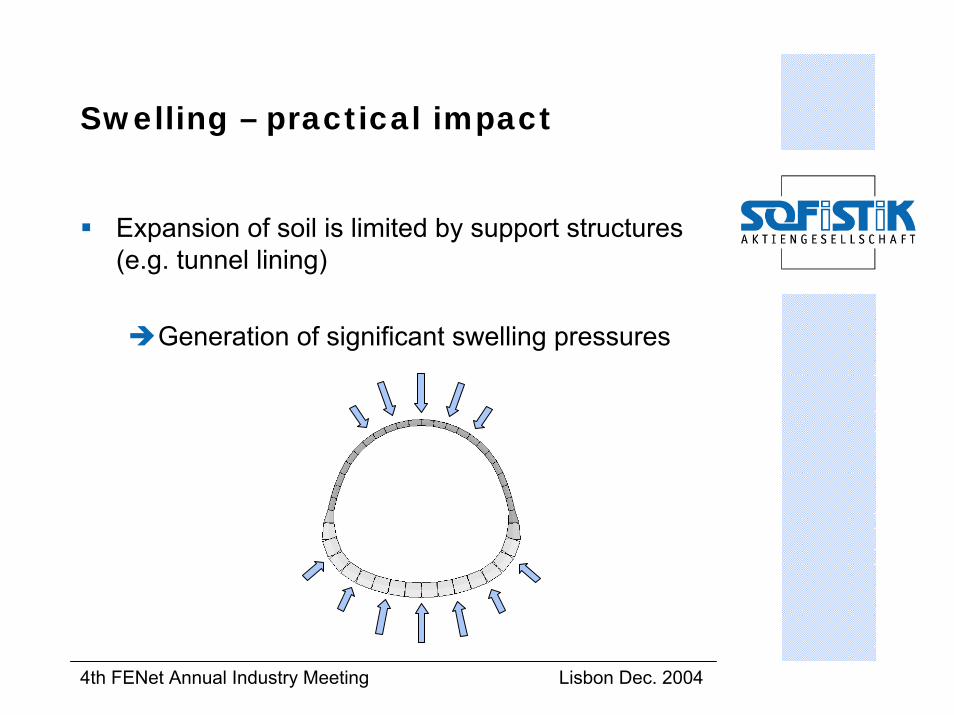
Swelling – practical impact
Expansion of soil is limited by support structures(e.g. tunnel lining)
Generation of significant swelling pressures
4th FENet Annual Industry Meeting Lisbon Dec. 2004
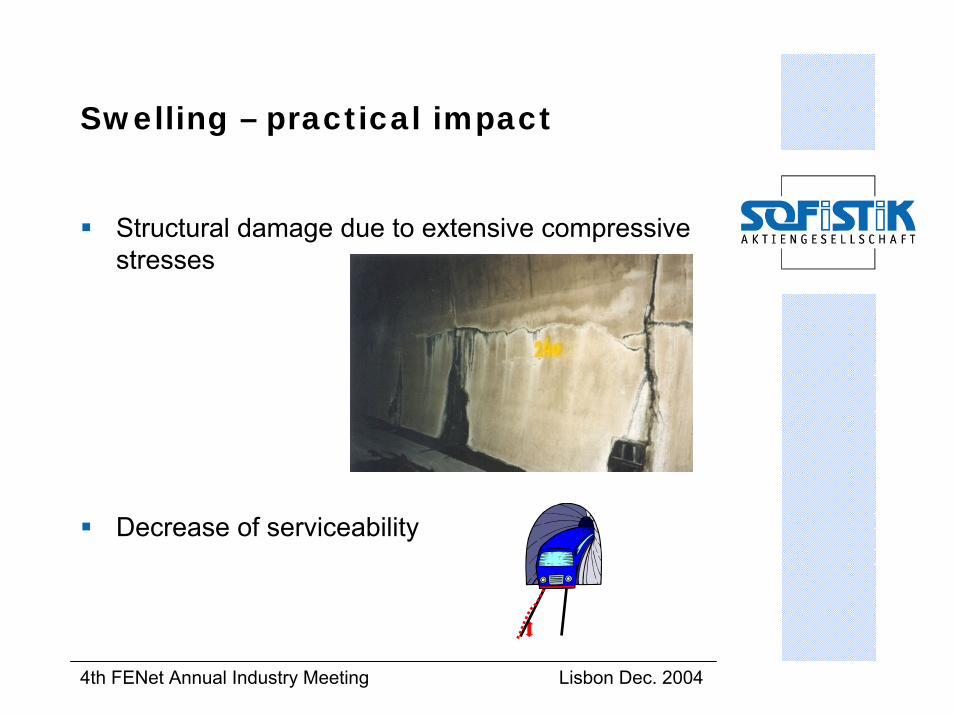
Swelling – practical impact
Structural damage due to extensive compressive stresses
Decrease of serviceability
4th FENet Annual Industry Meeting Lisbon Dec. 2004
Constitutive modelling
4th FENet Annual Industry Meeting Lisbon Dec. 2004
Constitutive modelling
Requirements from practice:
Estimation of the swelling strains/ stresses thatare to be expected
Few „basic“ parameters that can be calibrated from in-situ and laboratory measurements
Accounting for time effect → swelling strain evolution
3D
...
4th FENet Annual Industry Meeting Lisbon Dec. 2004
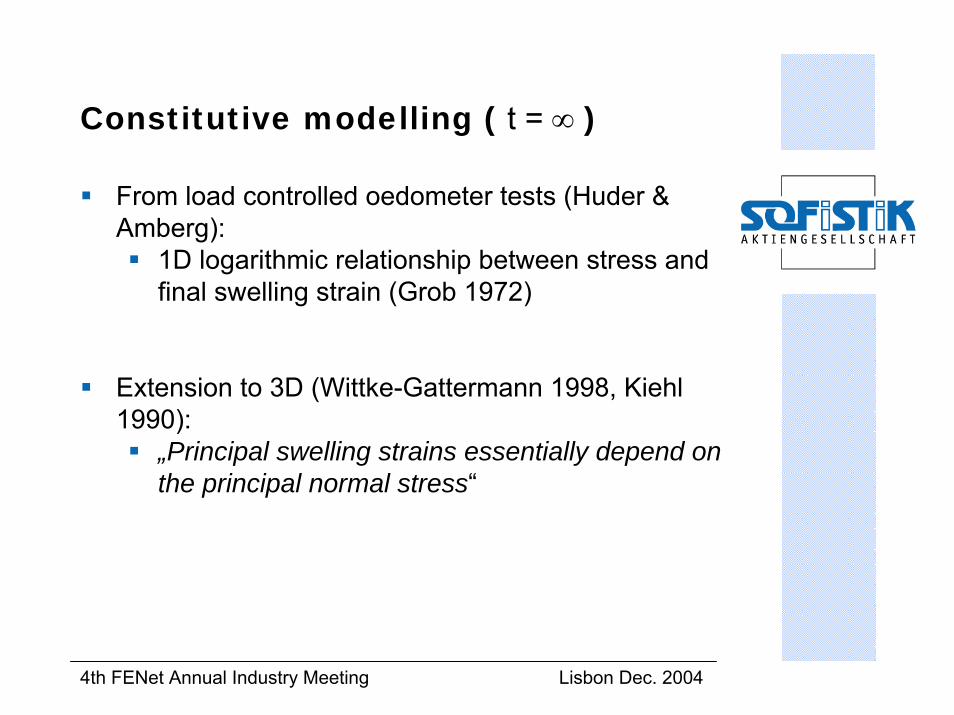
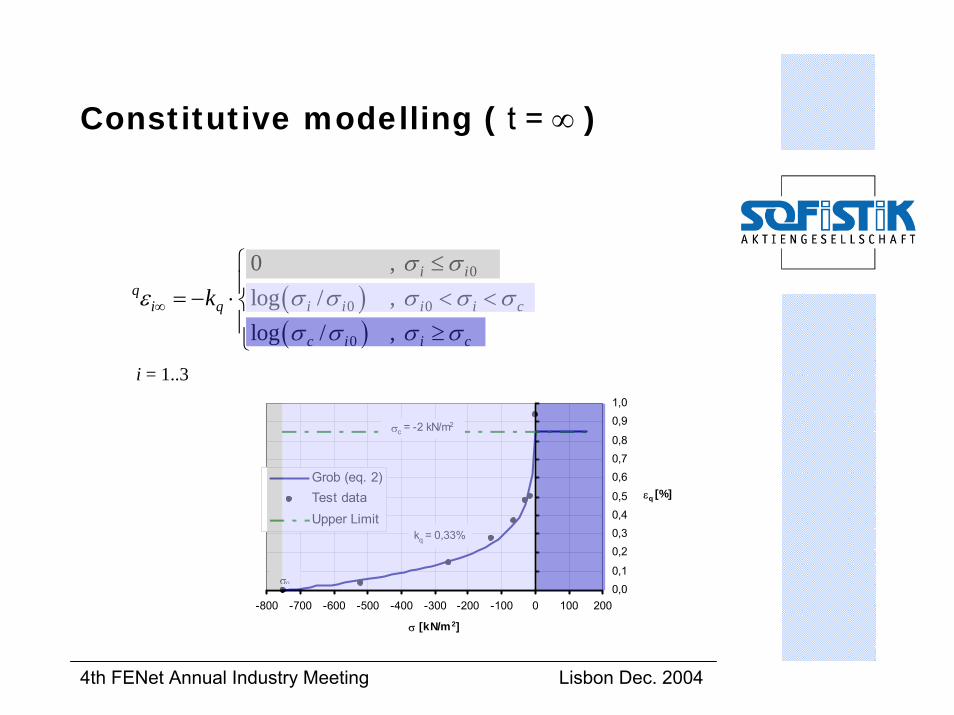
Constitutive modelling ( t = ∞ )
From load controlled oedometer tests (Huder & Amberg):
1D logarithmic relationship between stress and final swelling strain (Grob 1972)
Extension to 3D (Wittke-Gattermann 1998, Kiehl 1990):
„Principal swelling strains essentially depend onthe principal normal stress“
4th FENet Annual Industry Meeting Lisbon Dec. 2004
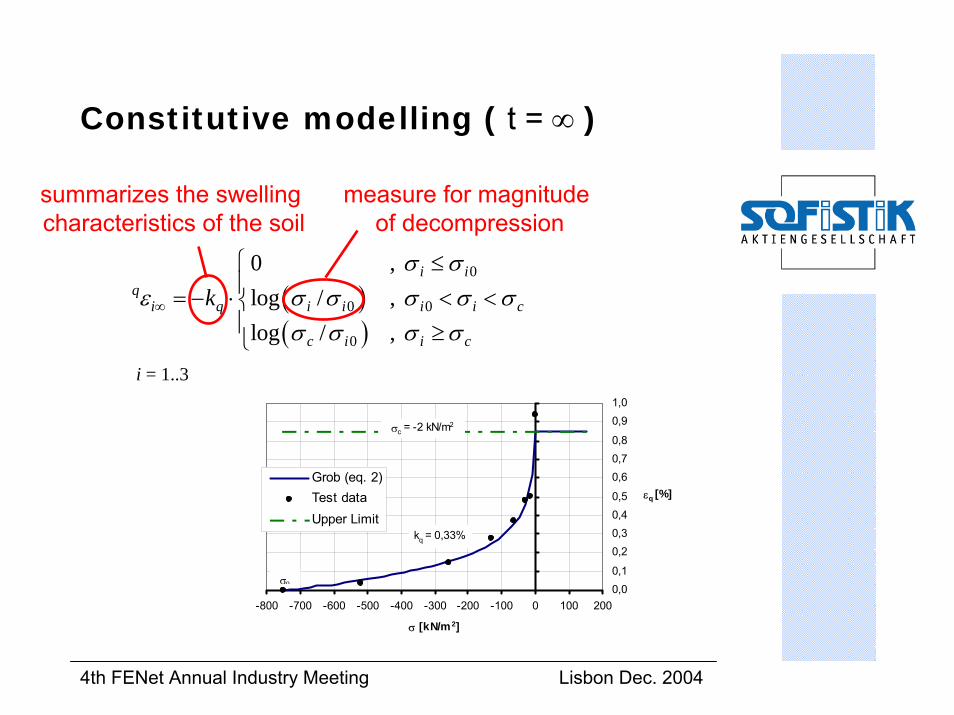
Constitutive modelling ( t = ∞ )
( )( )
0
0 0
0
0 ,log / ,log / ,
i iq
i q i i i i c
c i i c
kσ σ
ε σ σ σ σ σσ σ σ σ
∞
⎧ ≤⎪= − ⋅ < <⎨⎪ ≥⎩
0,00,1
0,20,30,40,5
0,60,70,8
0,91,0
-800 -700 -600 -500 -400 -300 -200 -100 0 100 200
σ [kN/m2]
εq [%]Grob (eq. 2)Test dataUpper Limit
σ0
kq = 0,33%
σc = -2 kN/m2
i = 1..3
measure for magnitude of decompression
summarizes the swelling characteristics of the soil
4th FENet Annual Industry Meeting Lisbon Dec. 2004
Constitutive modelling ( t = ∞ )
( )( )
0
0 0
0
0 ,log / ,log / ,
i iq
i q i i i i c
c i i c
kσ σ
ε σ σ σ σ σσ σ σ σ
∞
⎧ ≤⎪= − ⋅ < <⎨⎪ ≥⎩
0,00,1
0,20,30,40,5
0,60,70,8
0,91,0
-800 -700 -600 -500 -400 -300 -200 -100 0 100 200
σ [kN/m2]
εq [%]Grob (eq. 2)Test dataUpper Limit
σ0
kq = 0,33%
σc = -2 kN/m2
i = 1..3
4th FENet Annual Industry Meeting Lisbon Dec. 2004
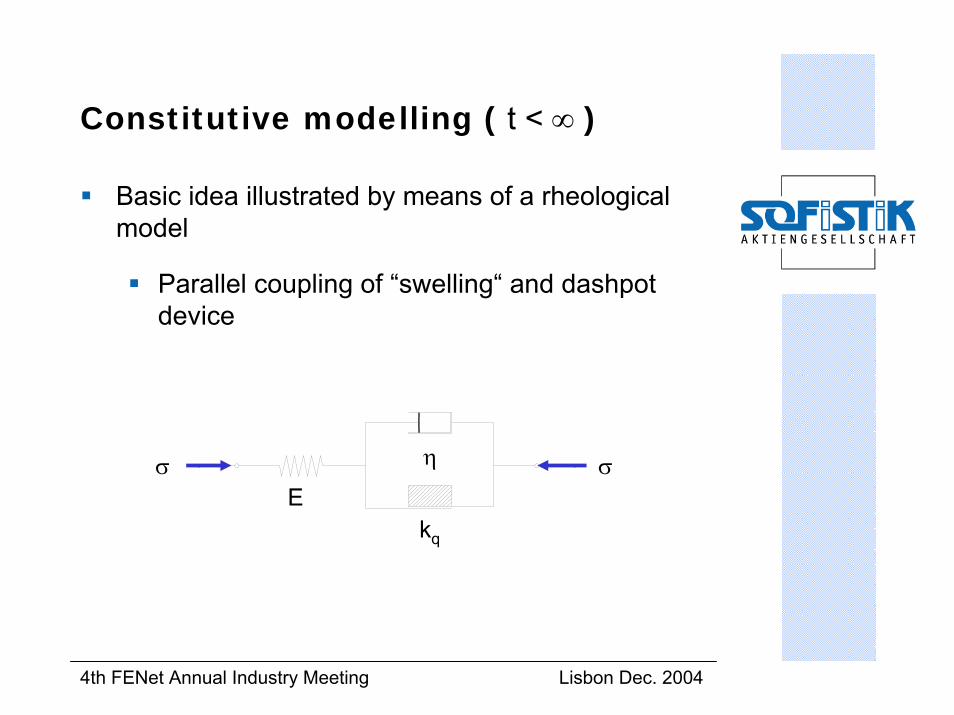
Constitutive modelling ( t < ∞ )
Basic idea illustrated by means of a rheological model
1
E
σ
η
y
σσ
kq
E
η σσ
Parallel coupling of “swelling“ and dashpotdevice
4th FENet Annual Industry Meeting Lisbon Dec. 2004
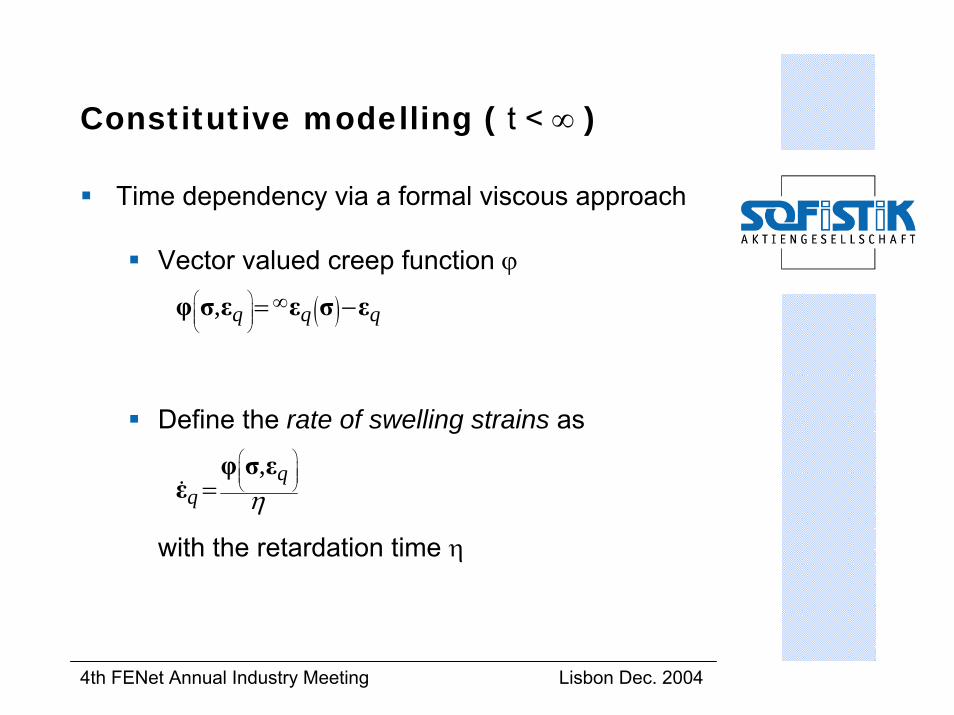
Constitutive modelling ( t < ∞ )
Time dependency via a formal viscous approach
( ), q q q⎛ ⎞⎜ ⎟⎜ ⎟⎝ ⎠
∞= −φ σ ε ε σ ε
Vector valued creep function ϕ
, qq η
⎛ ⎞⎜ ⎟⎜ ⎟⎝ ⎠=
φ σ εε&
Define the rate of swelling strains as
with the retardation time η
4th FENet Annual Industry Meeting Lisbon Dec. 2004
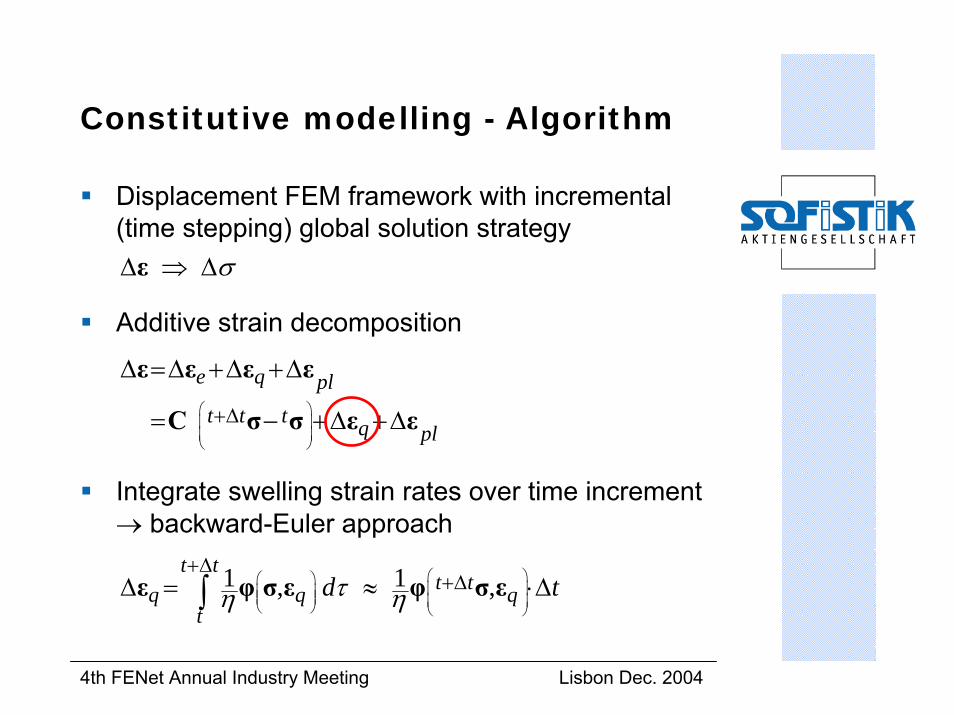
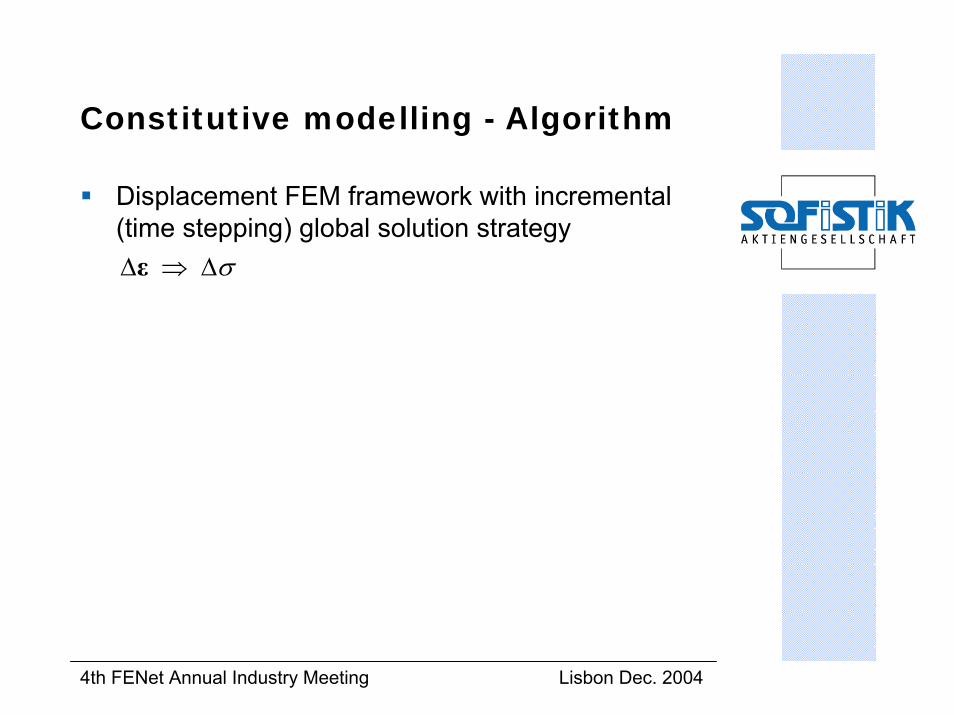
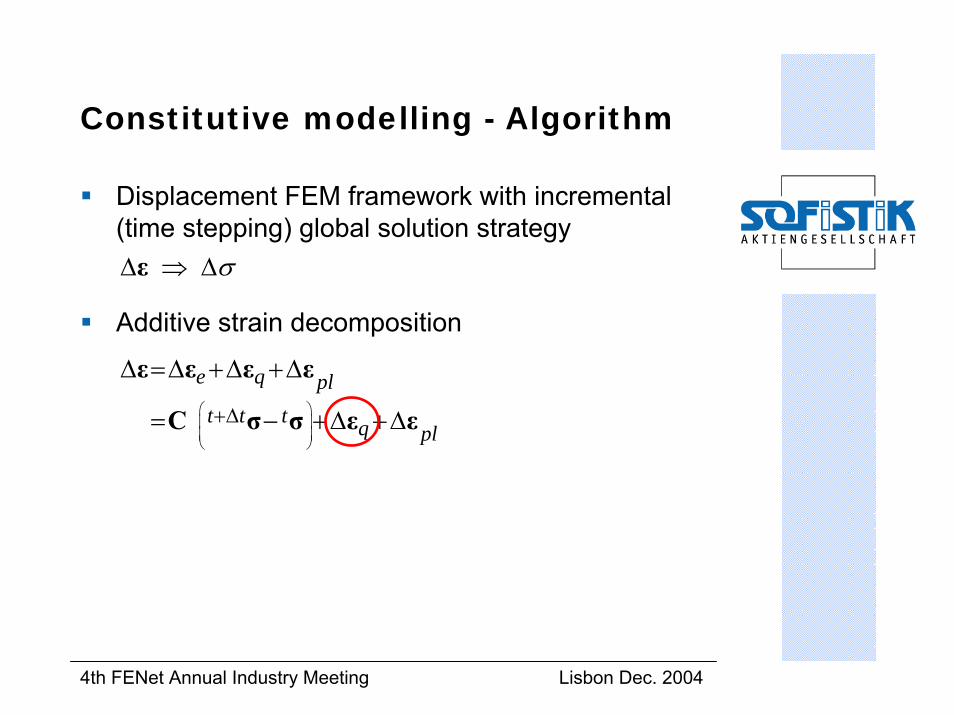
Constitutive modelling - Algorithm
Displacement FEM framework with incremental(time stepping) global solution strategy
σ∆ ⇒ ∆ε
e q plt t t q pl
⎛ ⎞⎜ ⎟⎜ ⎟⎝ ⎠
+∆
∆ =∆ +∆ +∆
= − +∆ +∆
ε ε ε ε
C σ σ ε ε
Additive strain decomposition
Integrate swelling strain rates over time increment → backward-Euler approach
1 1, ,t t
t tq q qt
d tτη η⎛ ⎞⎛ ⎞⎜ ⎟⎜ ⎟⎜ ⎟ ⎜ ⎟⎝ ⎠ ⎝ ⎠
+∆+∆∆ = ≈ ⋅∆∫ε φ σ ε φ σ ε
4th FENet Annual Industry Meeting Lisbon Dec. 2004
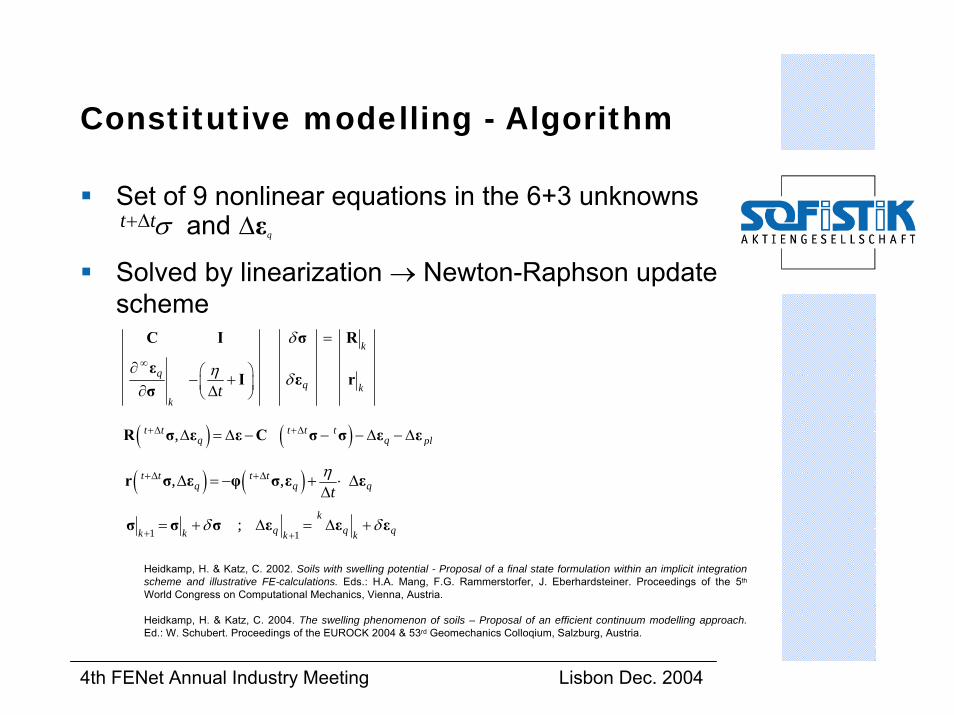
Constitutive modelling - Algorithm
Set of 9 nonlinear equations in the 6+3 unknowns
Solved by linearization → Newton-Raphson update scheme
q∆εt tσ+∆ and
k
qq k
kt
δ
η δ∞
⎛ ⎞⎜ ⎟⎝ ⎠
=
∂− +
∂ ∆
C I σ R
εI ε r
σ
( ) ( ),t t t t tq q pl
+∆ +∆∆ = ∆ − − − ∆ − ∆R σ ε ε C σ σ ε ε
1 1;
kq q qk k k k
δ δ+ += + ∆ = ∆ +σ σ σ ε ε ε
( ) ( ), ,t t t tq q qt
η+∆ +∆∆ = − + ⋅ ∆∆
r σ ε φ σ ε ε
Heidkamp, H. & Katz, C. 2002. Soils with swelling potential - Proposal of a final state formulation within an implicit integration scheme and illustrative FE-calculations. Eds.: H.A. Mang, F.G. Rammerstorfer, J. Eberhardsteiner. Proceedings of the 5th
World Congress on Computational Mechanics, Vienna, Austria.
Heidkamp, H. & Katz, C. 2004. The swelling phenomenon of soils – Proposal of an efficient continuum modelling approach.Ed.: W. Schubert. Proceedings of the EUROCK 2004 & 53rd Geomechanics Colloqium, Salzburg, Austria.
4th FENet Annual Industry Meeting Lisbon Dec. 2004
Numerical studies
4th FENet Annual Industry Meeting Lisbon Dec. 2004
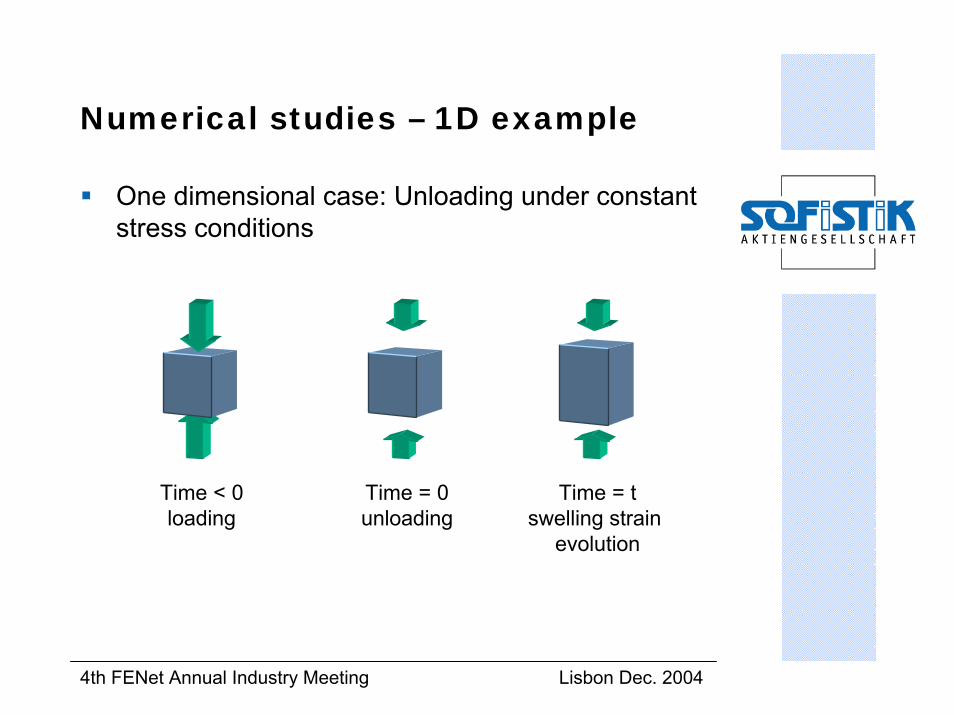
Numerical studies – 1D example
One dimensional case: Unloading under constant stress conditions
Time < 0loading
Time = 0unloading
Time = tswelling strain
evolution
4th FENet Annual Industry Meeting Lisbon Dec. 2004
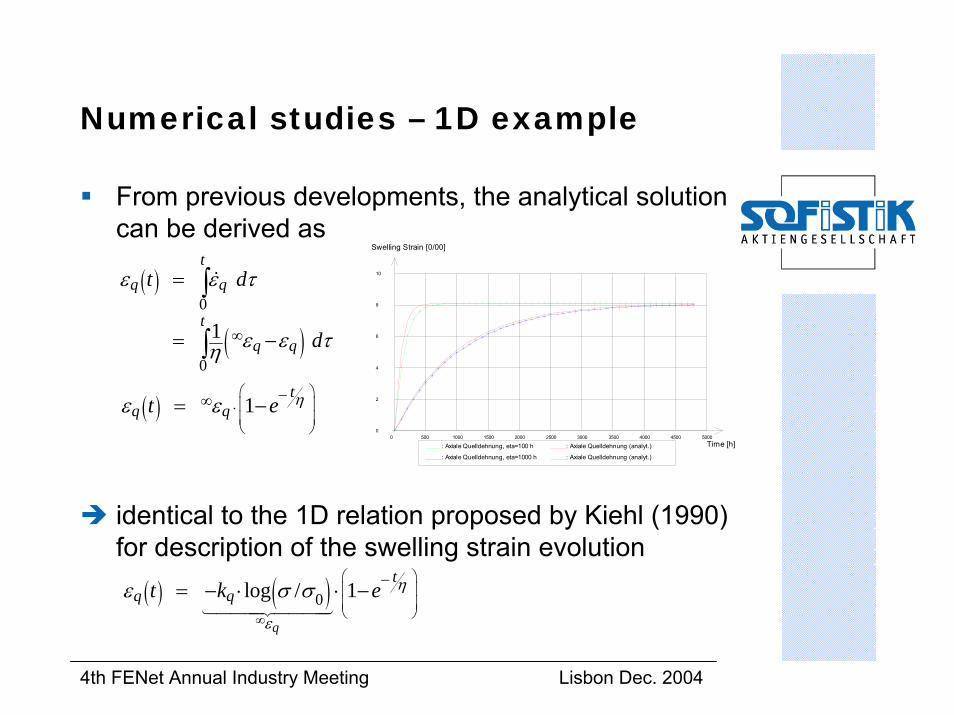
Numerical studies – 1D example
From previous developments, the analytical solution can be derived as
( )
( )0
0
1
tq q
tq q
t d
d
ε ε τ
ε ε τη∞
=
= −
∫
∫
&
( ) 1t
q qt e ηε ε⎛ ⎞⎜ ⎟⋅⎜ ⎟⎝ ⎠
−∞= −
: Axiale Quelldehnung, eta=100 h : Axiale Quelldehnung (analyt.)
: Axiale Quelldehnung, eta=1000 h : Axiale Quelldehnung (analyt.)
Time [h]0 500 1000 1500 2000 2500 3000 3500 4000 4500 5000
Swelling Strain [0/00]
0
2
4
6
8
10
( ) ( )0log / 1q
tq qt k e η
ε
ε σ σ∞
⎛ ⎞⎜ ⎟⎜ ⎟⎝ ⎠
−= − ⋅ ⋅ −14444244443
identical to the 1D relation proposed by Kiehl (1990) for description of the swelling strain evolution
4th FENet Annual Industry Meeting Lisbon Dec. 2004
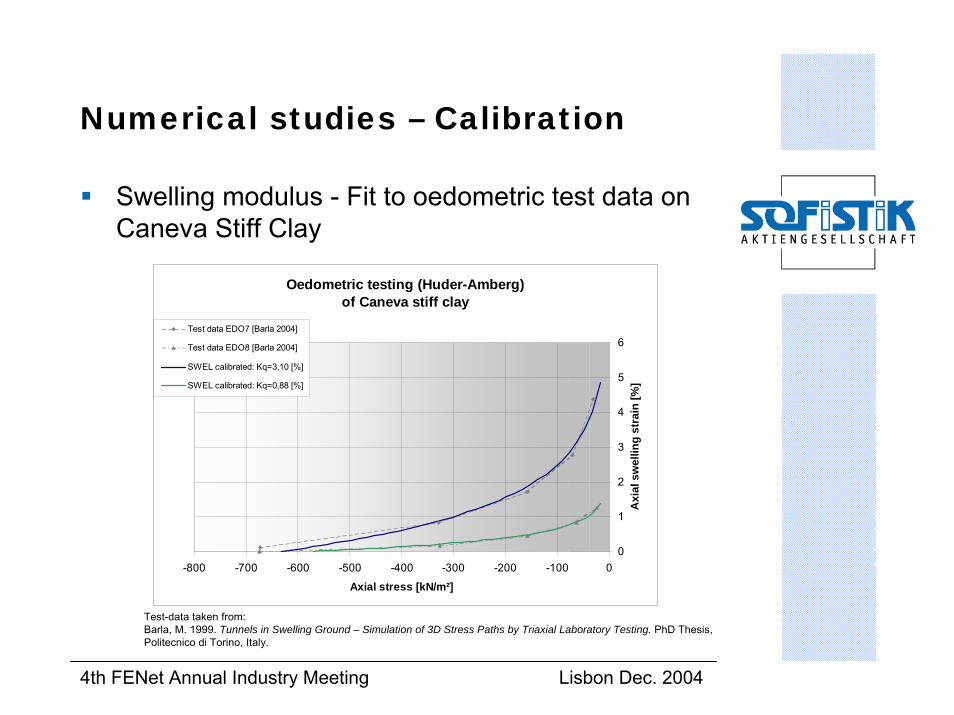
Numerical studies – Calibration
Swelling modulus - Fit to oedometric test data on Caneva Stiff Clay
Oedometric testing (Huder-Amberg)of Caneva stiff clay
0
1
2
3
4
5
6
-800 -700 -600 -500 -400 -300 -200 -100 0
Axial stress [kN/m²]
Axi
al s
wel
ling
stra
in [%
]
Test data EDO7 [Barla 2004]
Test data EDO8 [Barla 2004]
SWEL calibrated: Kq=3,10 [%]
SWEL calibrated: Kq=0,88 [%]
Test-data taken from:Barla, M. 1999. Tunnels in Swelling Ground – Simulation of 3D Stress Paths by Triaxial Laboratory Testing. PhD Thesis, Politecnico di Torino, Italy.
4th FENet Annual Industry Meeting Lisbon Dec. 2004
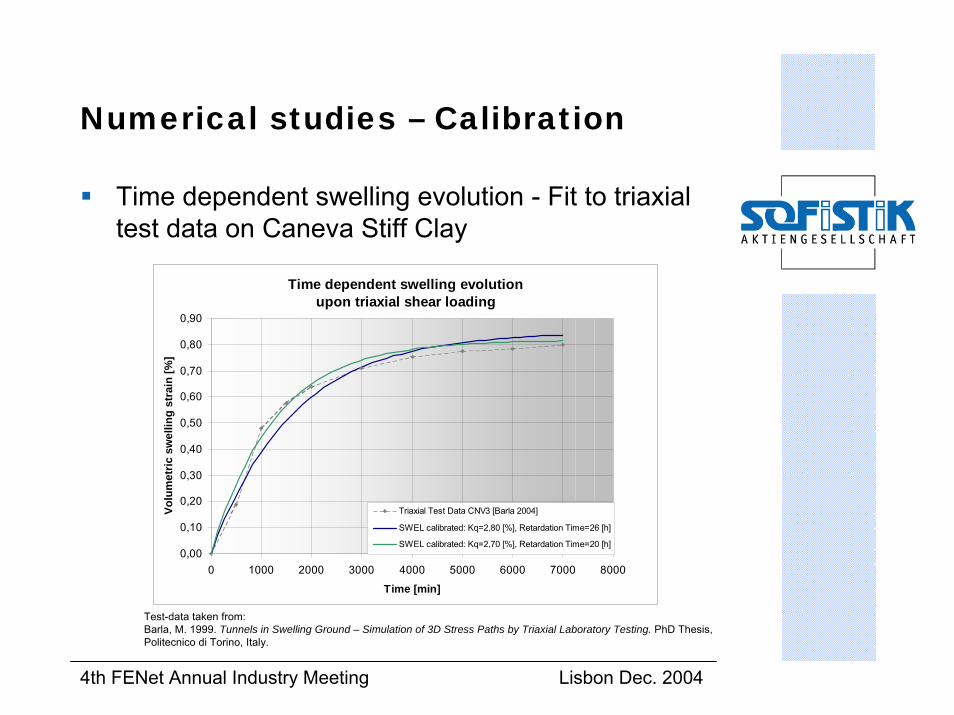
Numerical studies – Calibration
Time dependent swelling evolution - Fit to triaxial test data on Caneva Stiff Clay
Time dependent swelling evolution upon triaxial shear loading
0,00
0,10
0,20
0,30
0,40
0,50
0,60
0,70
0,80
0,90
0 1000 2000 3000 4000 5000 6000 7000 8000
Time [min]
Volu
met
ric s
wel
ling
stra
in [%
]
Triaxial Test Data CNV3 [Barla 2004]
SWEL calibrated: Kq=2,80 [%], Retardation Time=26 [h]
SWEL calibrated: Kq=2,70 [%], Retardation Time=20 [h]
Test-data taken from:Barla, M. 1999. Tunnels in Swelling Ground – Simulation of 3D Stress Paths by Triaxial Laboratory Testing. PhD Thesis, Politecnico di Torino, Italy.
4th FENet Annual Industry Meeting Lisbon Dec. 2004
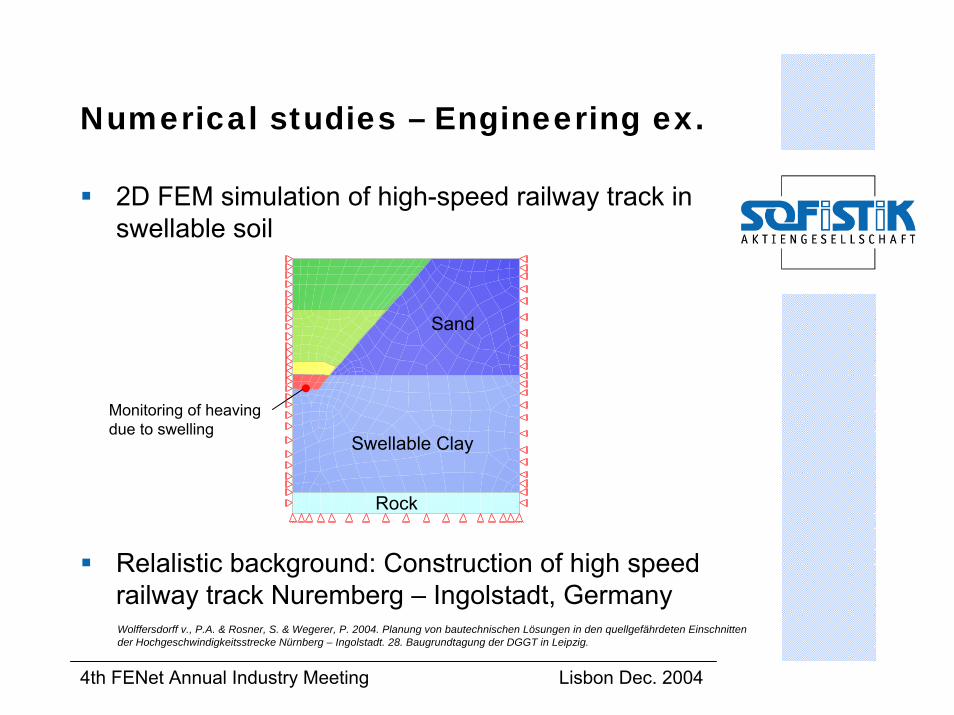
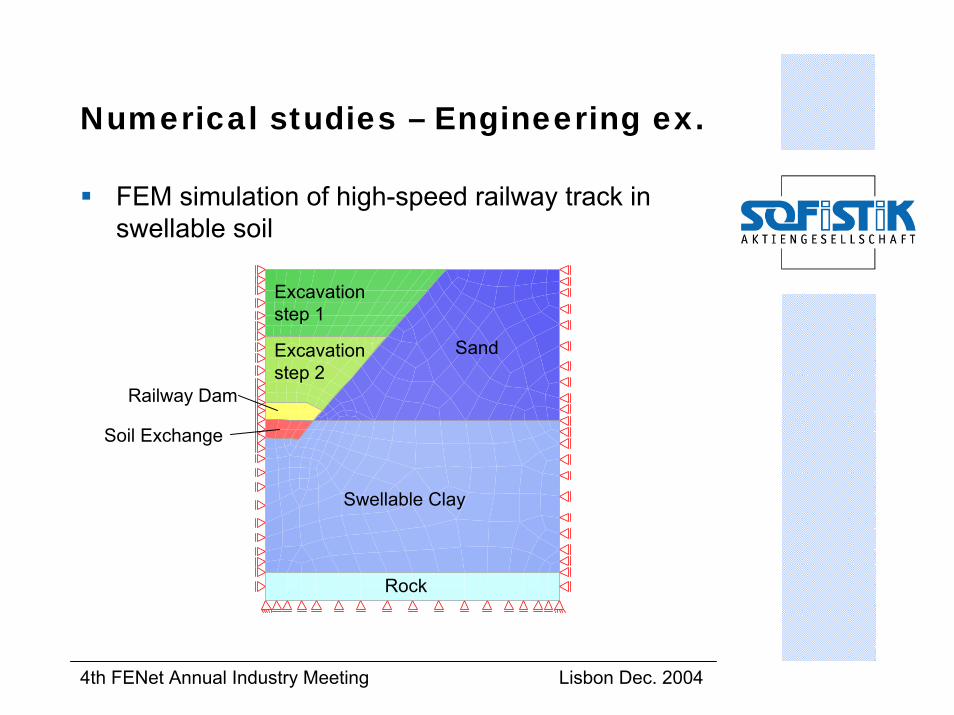
Numerical studies – Engineering ex.
2D FEM simulation of high-speed railway track in swellable soil
Swellable Clay
Sand
Rock
Monitoring of heaving due to swelling
Relalistic background: Construction of high speed railway track Nuremberg – Ingolstadt, GermanyWolffersdorff v., P.A. & Rosner, S. & Wegerer, P. 2004. Planung von bautechnischen Lösungen in den quellgefährdeten Einschnittender Hochgeschwindigkeitsstrecke Nürnberg – Ingolstadt. 28. Baugrundtagung der DGGT in Leipzig.
4th FENet Annual Industry Meeting Lisbon Dec. 2004
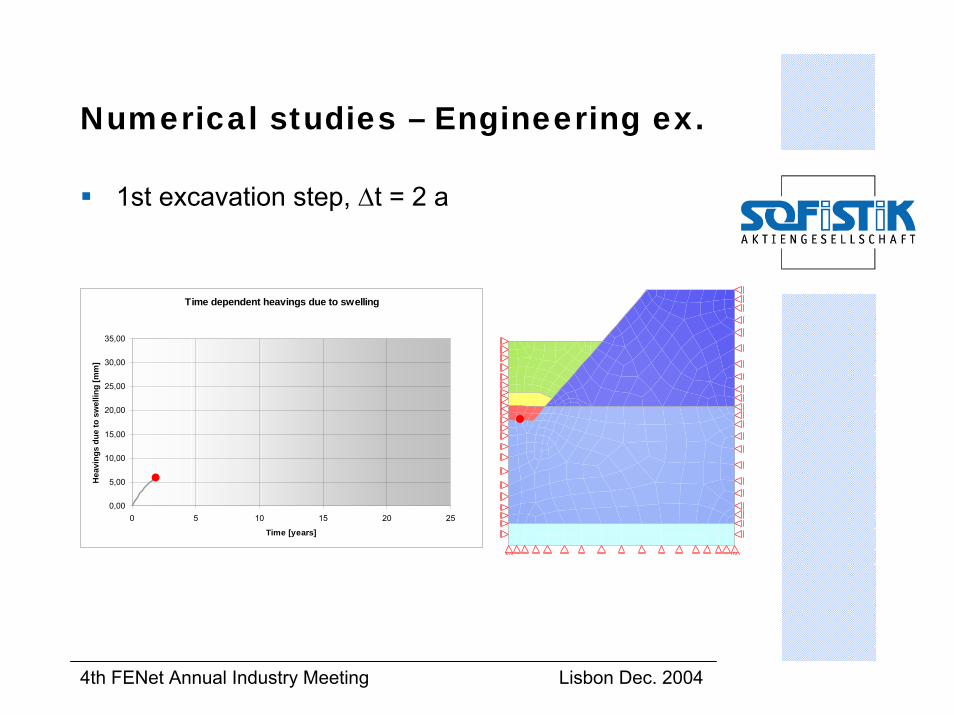
Numerical studies – Engineering ex.
1st excavation step, ∆t = 2 a
Time dependent heavings due to swelling
0,00
5,00
10,00
15,00
20,00
25,00
30,00
35,00
0 5 10 15 20 25
Time [years]
Hea
ving
s du
e to
sw
ellin
g [m
m]

4th FENet Annual Industry Meeting Lisbon Dec. 2004
Numerical studies – Engineering ex.
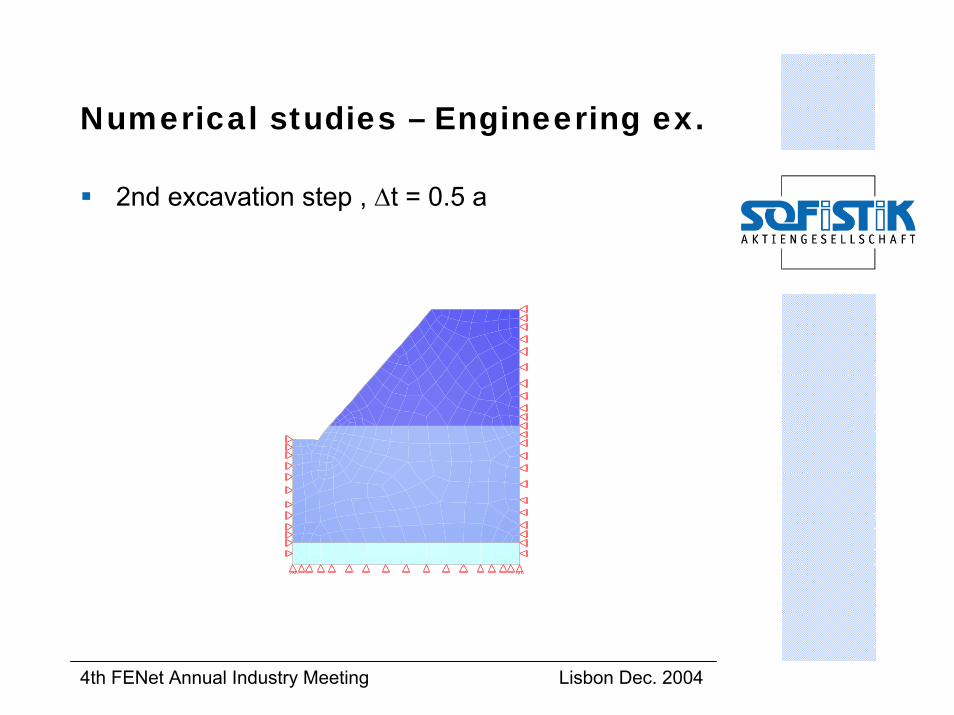
2nd excavation step , ∆t = 0.5 a
Time dependent heavings due to swelling
0,00
5,00
10,00
15,00
20,00
25,00
30,00
35,00
0 5 10 15 20 25
Time [years]
Hea
ving
s du
e to
sw
ellin
g [m
m]
Time dependent heavings due to swelling
0,00
5,00
10,00
15,00
20,00
25,00
30,00
35,00
0 5 10 15 20 25
Time [years]
Hea
ving
s du
e to
sw
ellin
g [m
m]

4th FENet Annual Industry Meeting Lisbon Dec. 2004
Numerical studies – Engineering ex.
Soil exchange, ∆t = 1 a
Time dependent heavings due to swelling
0,00
5,00
10,00
15,00
20,00
25,00
30,00
35,00
0 5 10 15 20 25
Time [years]
Hea
ving
s du
e to
sw
ellin
g [m
m]

4th FENet Annual Industry Meeting Lisbon Dec. 2004
Numerical studies – Engineering ex.
Installation of superstructure , ∆t = 0.5 a
Time dependent heavings due to swelling
0,00
5,00
10,00
15,00
20,00
25,00
30,00
35,00
0 5 10 15 20 25
Time [years]
Hea
ving
s du
e to
sw
ellin
g [m
m]
4th FENet Annual Industry Meeting Lisbon Dec. 2004
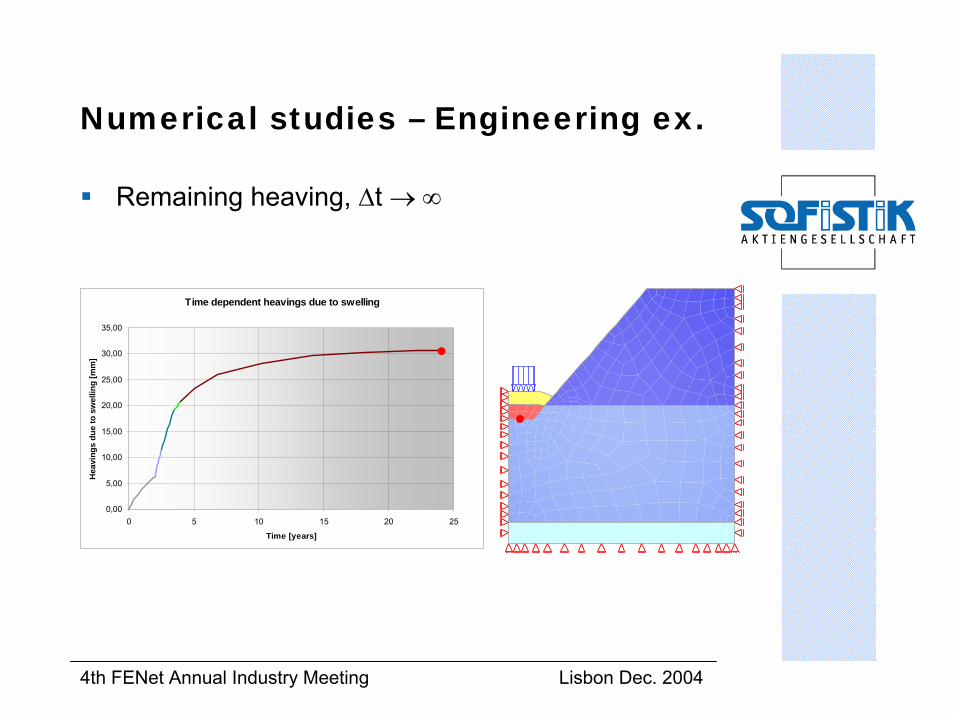
Numerical studies – Engineering ex.
Remaining heaving, ∆t → ∞
Time dependent heavings due to swelling
0,00
5,00
10,00
15,00
20,00
25,00
30,00
35,00
0 5 10 15 20 25
Time [years]
Hea
ving
s du
e to
sw
ellin
g [m
m]
4th FENet Annual Industry Meeting Lisbon Dec. 2004
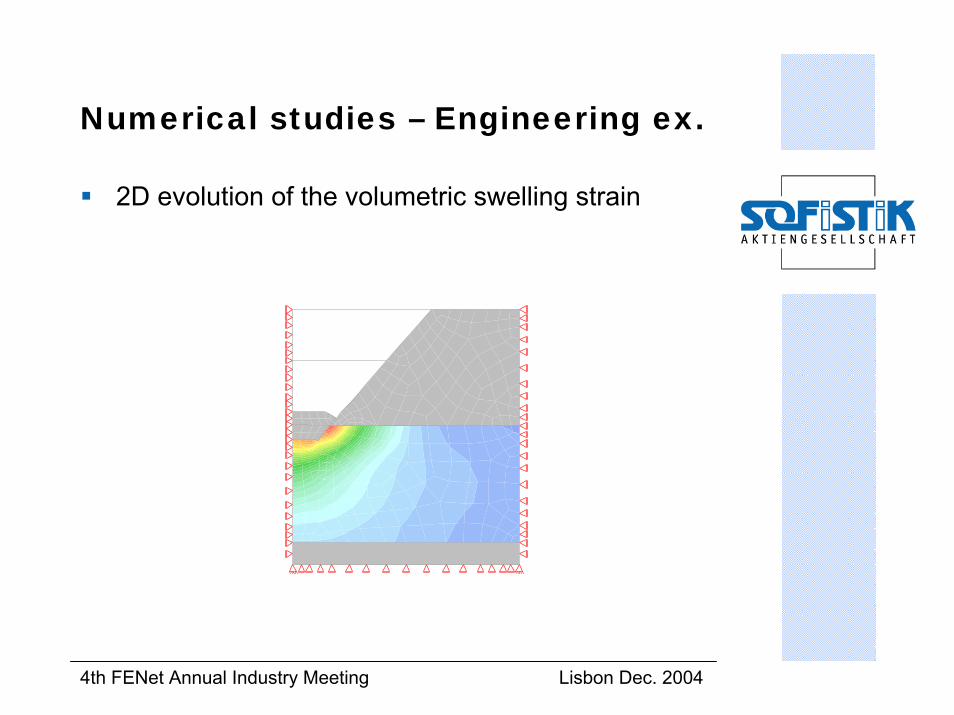
Numerical studies – Engineering ex.
2D evolution of the volumetric swelling strain
4th FENet Annual Industry Meeting Lisbon Dec. 2004
Conclusive remarks
4th FENet Annual Industry Meeting Lisbon Dec. 2004
Conclusive remarks
Engineering design: Importance of appropriate considerationof swelling phenomena
Based on a 3D extension of Grob‘s swelling law: Proposal of an implicit formulation within a viscous framework → accounting for time dependency
Two essential material parameters:→ kq representing the swelling potential→ η modelling the time evolution
Model can be calibrated according to test data → test data is, however, often significantly scattered → rises issue of safety assessment
Applicability to practical engineering problems

4th FENet Annual Industry Meeting Lisbon Dec. 2004
Thank you for your attention.Questions?
4th FENet Annual Industry Meeting Lisbon Dec. 2004
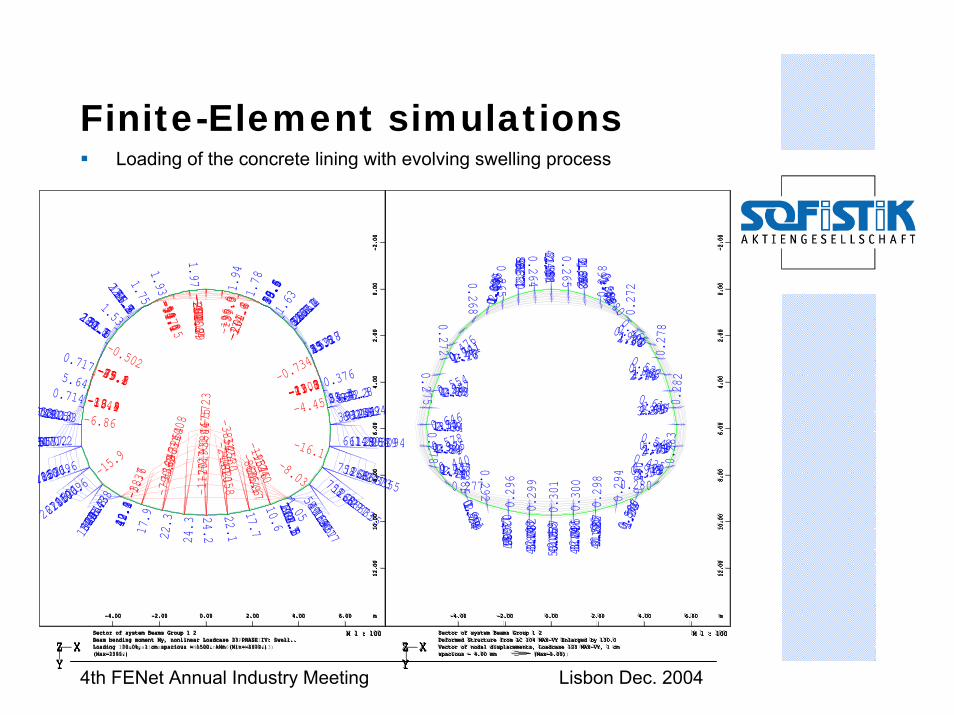
Finite-Element simulationsLoading of the concrete lining with evolving swelling process
M 1 : 100
XYZ
24.3
24.222.3
22.117.9
17.7
-16.1-15
.9
10.610.5
-8.03
-6.86-4.45
1.97
1.941.93 1.781.75
1.631.53
1.05
-0.734
0.717
0.714
0.641
-0.502
0.438
0.376
Sector of system Beams Group 1 2Beam bending moment My, nonlinear Loadcase 5 PHASE III: Innerlining, 1 cm spacious = 1500. kNm (Min=-16.1) (Max=24.3)
-4.00 -2.00 0.00 2.00 4.00 6.00 m
12.00
10.00
8.00
6.00
4.00
2.00
0.00
-2.00
M 1 : 100
XYZ
Sector of system Beams Group 1 2Deformed Structure from LC 104 MAX-VY Enlarged by 130.0
-4.00 -2.00 0.00 2.00 4.00 6.00 m
12.00
10.00
8.00
6.00
4.00
2.00
0.00
-2.00
0.301
0 .3 00
0 .299
0.298
0.296
0.2 940. 29 2 0.2900.2 86
0.283
0.282
0.278
0.278
0.275
0.2 72
0.272
0.268
0. 268
0.2 65
0.2 65
0. 26 4
Vector of nodal displacements, Loadcase 105 MAX-VY, 1 cmspacious = 4.00 mm (Max=0.301)
M 1 : 100
XYZ
-1177 -1058-7
90.3 758.8758.8
661.8
606.6
606.6
540.5
470.2
435.3
393.4
-364.7
220.3
114.7
-114.6 -96.6
55.0
-54.8 52.2
47.9
37.5
25.5
25.4
-21.1
16.0
-13.9-13.3
Sector of system Beams Group 1 2Beam bending moment My, nonlinear Loadcase 21 PHASE IV: Swell..Loading 10.0%, 1 cm spacious = 1500. kNm (Min=-1177.)(Max=758.8)
-4.00 -2.00 0.00 2.00 4.00 6.00 m
12.00
10.00
8.00
6.00
4.00
2.00
0.00
-2.00
M 1 : 100
XYZ
Sector of system Beams Group 1 2Deformed Structure from LC 104 MAX-VY Enlarged by 130.0
-4.00 -2.00 0.00 2.00 4.00 6.00 m
12.00
10.00
8.00
6.00
4.00
2.00
0.00
-2.00
1 .01
0 .865 0 .8 63
0.777
0.73
2
0 .7 25
0.6460.614
0.600
0.600
0.598
0.587
0.578
0.554
0.549
0.5220.4
76
0.465
0.4400.435
0.2800.277
Vector of nodal displacements, Loadcase 121 MAX-VY, 1 cmspacious = 4.00 mm (Max=1.01)
M 1 : 100
XYZ
-2019 -1821
-136
9
12681268
1129
1009
1009
890.4
807.2
705.8
682.9
-635.6
391.0
-202.9
171.5
-99.3-99.091.6
86.5
66.4
54.4
49.4
43.7
-37.1
29.1
-19.3-18.4
Sector of system Beams Group 1 2Beam bending moment My, nonlinear Loadcase 23 PHASE IV: Swell..Loading 20.0%, 1 cm spacious = 1500. kNm (Min=-2019.)(Max=1268.)
-4.00 -2.00 0.00 2.00 4.00 6.00 m
12.00
10.00
8.00
6.00
4.00
2.00
0.00
-2.00
M 1 : 100
XYZ
Sector of system Beams Group 1 2Deformed Structure from LC 104 MAX-VY Enlarged by 130.0
-4.00 -2.00 0.00 2.00 4.00 6.00 m
12.00
10.00
8.00
6.00
4.00
2.00
0.00
-2.00
1 .58
1 .55
1 .4 7
1.46
1 .33
1.3 2
1.25 1.22
1.111.05
0.975
0.927
0.919
0.86
5
0.863
0.8590.74
1
0.737 0.724
0.705
0.601 0.577
Vector of nodal displacements, Loadcase 123 MAX-VY, 1 cmspacious = 4.00 mm (Max=1.58)
M 1 : 100
XYZ
-2701 -2440
-184
7
16661666
1499
1321
1321
1164
1077
914.1
913.4
-860.9
530.8
-277.2
212.1
-137.9-137.5
122.2115.1
91.8
81.5
59.8
-49.4
42.2
40.6
-21.8-19.8
Sector of system Beams Group 1 2Beam bending moment My, nonlinear Loadcase 25 PHASE IV: Swell..Loading 30.0%, 1 cm spacious = 1500. kNm (Min=-2701.)(Max=1666.)
-4.00 -2.00 0.00 2.00 4.00 6.00 m
12.0
010
.00
8.00
6.00
4.00
2.00
0.00
-2.0
0
M 1 : 100
XYZ
Sector of system Beams Group 1 2Deformed Structure from LC 104 MAX-VY Enlarged by 130.0
-4.00 -2.00 0.00 2.00 4.00 6.00 m
12.0
010
.00
8.00
6.00
4.00
2.00
0.00
-2.0
0
2 .1 9
2 .0 8
2. 07
2 .0 7
1.78 1.75
1 .7 3
1.72
1.501.44
1.32
1.26
1.24
1.17
1.09
1.08
0.998
0.981
0.979
0.927
0.899 0.866
Vector of nodal displacements, Loadcase 125 MAX-VY, 1 cmspacious = 4.00 mm (Max=2.19)
M 1 : 100
XYZ
-380
4
-2631 -2530
22912291
2084
1819
1819
1595
513
1281
1244
-1240
749.5557.2
-401.7
268.2
-204.8174.5
164.0
135.9
89.2
-65.8
59.5-54.0
22.1
-21.7-16.1
Sector of system Beams Group 1 2Beam bending moment My, nonlinear Loadcase 29 PHASE IV: Swell..Loading 50.0%, 1 cm spacious = 1500. kNm (Min=-3804.)(Max=2291.)
-4.00 -2.00 0.00 2.00 4.00 6.00 m
12.0
010
.00
8.00
6.00
4.00
2.00
0.00
-2.0
0
M 1 : 100
XYZ
Sector of system Beams Group 1 2Deformed Structure from LC 104 MAX-VY Enlarged by 130.0
-4.00 -2.00 0.00 2.00 4.00 6.00 m
12.0
010
.00
8.00
6.00
4.00
2.00
0.00
-2.0
0
3 .23
3 .0 8
3.05
2 .89
2.65 2.60
2 .39
2.38
2.162.09
1.89
1.82
1.78
1.71
1.47
1.46
1.44 1.41
1.40
1.39 1.34
1.32
Vector of nodal displacements, Loadcase 129 MAX-VY, 1 cmspacious = 4.00 mm (Max=3.23)
M 1 : 100
XYZ
-467
5
-325
4 -3124
27732773
2539
2205
205
1927
55
1562
-1546
1498
912.1683.3
-506.4
304.5
-261.4220.0
207.1
174.2
117.8
75.4
-75.2
-72.1
-17.1-8.49
-1.37
Sector of system Beams Group 1 2Beam bending moment My, nonlinear Loadcase 33 PHASE IV: Swell..Loading 70.0%, 1 cm spacious = 1500. kNm (Min=-4675.)(Max=2773.)
-4.00 -2.00 0.00 2.00 4.00 6.00 m
12.0
010
.00
8.00
6.00
4.00
2.00
0.00
-2.0
0
M 1 : 100
XYZ
Sector of system Beams Group 1 2Deformed Structure from LC 104 MAX-VY Enlarged by 130.0
-4.00 -2.00 0.00 2.00 4.00 6.00 m
12.0
010
.00
8.00
6.00
4.00
2.00
0.00
-2.0
0
4 .05
3 .8 7
3.84
3 .58
3.34 3.28
2 .95
2.94
2.692.61
2.34
2.29
2.21
2.16
1.79
1.781.78
1.781.76
1.75
1.72
1.66
Vector of nodal displacements, Loadcase 133 MAX-VY, 1 cmspacious = 4.00 mm (Max=4.05)
M 1 : 100
XYZ
-5723
-4008 -3854
33553355
3094
2671
71
2317
3 -1937
1894
1800
1102822.8
-640.9 -334.6
327.5
280.7266.4
223.5
159.7
-97.1
93.5
-79.5
-38.6
5.64-4.00
Sector of system Beams Group 1 2Beam bending moment My, nonlinear Loadcase 39 PHASE IV: Swell..Loading 100.0%, 1 cm spacious = 1500. kNm (Min=-5723.)(Max=3355.)
-4.00 -2.00 0.00 2.00 4.00 6.00 m
12.0
010
.00
8.00
6.00
4.00
2.00
0.00
-2.0
0
M 1 : 100
XYZ
Sector of system Beams Group 1 2Deformed Structure from LC 104 MAX-VY Enlarged by 130.0
-4.00 -2.00 0.00 2.00 4.00 6.00 m
12.0
010
.00
8.00
6.00
4.00
2.00
0.00
-2.0
0
5 .05
4 .8 3
4.79
4 .46
4.1 7 4.11
3 .68
3.65
3.343.27
2.89
2.88
2.75
2.74
2.24
2.23
2.202.20
2.20
2.18
2.101.80
Vector of nodal displacements, Loadcase 139 MAX-VY, 1 cmspacious = 4.00 mm (Max=5.05)
4th FENet Annual Industry Meeting Lisbon Dec. 2004
Numerical studies – Engineering ex.
FEM simulation of high-speed railway track in swellable soil
Soil Exchange
Excavation step 1
Sand
Swellable Clay
Rock
Railway Dam
Excavation step 2
4th FENet Annual Industry Meeting Lisbon Dec. 2004
Constitutive modelling - Algorithm
Displacement FEM framework with incremental (time stepping) global solution strategy
σ∆ ⇒ ∆ε
4th FENet Annual Industry Meeting Lisbon Dec. 2004
Constitutive modelling - Algorithm
Displacement FEM framework with incremental(time stepping) global solution strategy
σ∆ ⇒ ∆ε
Additive strain decomposition
e q plt t t q pl
⎛ ⎞⎜ ⎟⎜ ⎟⎝ ⎠
+∆
∆ =∆ +∆ +∆
= − +∆ +∆
ε ε ε ε
C σ σ ε ε
4th FENet Annual Industry Meeting Lisbon Dec. 2004
Numerical studies
The proposed model was implemented into thegeotechnical finite element program TALPA thatwas used for subsequent numerical simulations
4th FENet Annual Industry Meeting Lisbon Dec. 2004
Numerical studies – Engineering ex.
2nd excavation step , ∆t = 0.5 a
4th FENet Annual Industry Meeting Lisbon Dec. 2004