Embed Size (px)
Citation preview
EM 12/17
A variety of indicators evaluated for two implementation methods for a Citizen’s Basic Income Malcolm Torry May 2017

A variety of indicators evaluated for two implementation methods
for a Citizen’s Basic Income*
Malcolm Torry
The Citizen’s Income Trust and the London School of Economics
Abstract
Debate about Citizen’s Basic Income – an unconditional and nonwithdrawable income
for every individual – is shifting in character. An earlier phase related to the proposal’s
desirability; then followed debate about its feasibility; and now attention is turning to
questions of implementation. A significant symptom of this new phase is the recent
consultation on implementation of a Citizen’s Basic Income held by the Institute of
Chartered Accountants in England and Wales. The consultation considered four
implementation methods. This working paper operationalises characteristics of two of
the implementation models in terms of changes that might be required in existing UK
tax and benefits systems, and evaluates the implementation methods in relation to a
wider variety of indicators than previous exercises of this kind: poverty and inequality
indices, tax rate rises required for revenue neutrality, household disposable income
gains and losses, households’ abilities to escape from means-testing, and marginal
deduction rates. The advent of EUROMOD G4.0+ and updated FRS data enables the
results to be more up to date as well as more comprehensive.
JEL: C80, H53, H55, I38, R20
Keywords: Citizen’s Basic Income, microsimulation model implementation
Corresponding author:
Malcolm Torry
* I am most grateful to Alari Paulus of the Institute for Social and Economic Research for considerable
assistance with this working paper. The results presented here are based on EUROMOD version G4.0+.
EUROMOD is maintained, developed and managed by the Institute for Social and Economic Research
(ISER) at the University of Essex, in collaboration with national teams from the EU member states. We
are indebted to the many people who have contributed to the development of EUROMOD. The process of
extending and updating EUROMOD is financially supported by the European Union Programme for
Employment and Social Innovation ’Easi’ (2014-2020). The UK Family Resources Survey data was made
available by the Department of Work and Pensions via the UK Data Archive. The results and their
interpretation are the authors’ responsibility. Opinions expressed in this paper are not necessarily those of
the Citizen’s Income Trust.
2
1. Introduction In the UK two designations have been common currency for an unconditional and nonwithdrawable income for every individual: Basic Income, and Citizen’s Income. (Sometimes ‘Universal’ has prefixed ‘Basic Income’.) The combination of the two, Citizen’s Basic Income, has been increasing in popularity. The new Scottish network has called itself the Citizen’s Basic Income Network Scotland, and the publisher of my most recent book (Torry, 2016d) asked for the same terminology. The trustees of the Citizen’s Income Trust have decided that the Trust will now refer to a ‘Citizen’s Basic Income’ and will call itself the Citizen’s Basic Income Trust. This paper follows this trend.
Debate about Citizen’s Basic Income is shifting in character. An earlier phase related to the proposal’s desirability; then followed debate about its feasibility; and now attention is turning to questions of implementation (Torry 2013; 2015b; 2016c). A significant symptom of this new phase is the recent consultation on implementation of a Citizen’s Basic Income held by the Institute of Chartered Accountants in England and Wales (Torry, 2016e). The consultation considered four implementation methods:
1. A Citizen’s Basic Income for every UK citizen, large enough to take every household off means-tested benefits (including Working Tax Credits, Child Tax Credits, and Universal Credit), and to ensure that no household with low earned income would suffer a financial loss at the point of implementation. The scheme would be implemented all in one go.
2. A Citizen’s Basic Income for every UK citizen, funded from within the current tax and benefits system. Current means-tested benefits would be left in place, and each household’s means-tested benefits would be recalculated to take into account household members’ Citizen’s Basic Incomes in the same way as earned income is taken into account. Again, implementation would be all in one go.
3. This scheme would start with an increase in Child Benefit. A Citizen’s Basic Income would then be paid to all 16 year olds, and they would be allowed to keep it as they grew older, with each new cohort of 16 year olds receiving the same Citizen’s Basic Income and being allowed to keep it.
4. Inviting volunteers among the pre-retired, between the age of 60 and the state pension age. (Torry, 2016: 6)
As a previous working paper (Torry, 2014) showed, a Citizen’s Basic Income scheme that abolished existing means-tested benefits, and that was funded purely by making adjustments to the current Income Tax system, would generate significant losses for low income households. A Citizen’s Basic Income scheme that both abolished existing means-tested benefits and avoided losses for low income households would need additional funding from outside the current tax and benefits systems. In the foreseeable future such additional funding is unlikely to be forthcoming. In the longer term a Citizen’s Basic Income large enough to enable current means-tested benefits to be abolished while not imposing losses on low income households might be a possibility, but its current infeasibility suggests that further research effort in this direction is unlikely to be immediately useful.
The fourth option, while interesting, is impossible to evaluate for poverty and inequality indices, household gains and losses, and net cost, because it is impossible to know which individuals or households would volunteer.
This leaves options 2 and 3 to evaluate. This working paper therefore operationalises the characteristics of these two implementation models in terms of the Citizen’s Basic Incomes payable and the changes that might be required in existing tax and benefits systems, and it

3
evaluates the implementation methods in relation to poverty and inequality indices, revenue neutrality, the numbers of households able to escape from means-tested benefits, and household disposable income gains and losses. The advent of EUROMOD G4.0+ and updated FRS data enables the results to be more up to date than those of previous working papers (Torry, 2014; 2015a; 2016a; 2016b).
An additional test is also applied in relation to a question that has become more insistent as the Citizen’s Basic Income debate has evolved, and that is the question of employment market behaviour. Would individuals be more or less likely to seek paid employment, or to seek additional earned income, if they were paid a Citizen’s Basic Income? Factors often discussed in this context are the marginal effective tax rate (METR: also called the marginal tax rate, the marginal withdrawal rate, or the marginal deduction rate): a measure of the extent to which an employed individual’s additional earned income fails to result in additional disposable income; and the participation tax rate (PTR): a measure of the extent to which an unemployed individual’s new earned income fails to result in additional disposable income. While a wide variety of factors will determine whether an individual seeks paid employment, or seeks additional earned income, if a substantial rise in earned income results in only a small rise in disposable income then further employment market engagement is less likely to be forthcoming. Because the marginal effective tax rate and the participation tax rate are factors that can be measured, and other factors cannot be, these particular indicators might sometimes be given more prominence than they deserve: but because they can be measured, and because they are likely to be at least of some significance, this paper defines and calculates a variety of different marginal effective tax rates and participation tax rates.
A Citizen’s Basic Income could be paid to an entire population, or, as long as it was still a genuine Citizen’s Basic Income, to a section of the population: usually to a particular age group. It might be objected that to pay an income to people in a particular age group would be to make the income conditional; and, indeed, that to pay Citizen’s Basic Incomes of different amounts to different age groups, as is generally envisaged, might also be regarded as not legitimate. However, there are two kinds of conditionality: 1. Those that we cannot affect and about which enquiry does not need to be made; and 2. Those that we can affect and about which enquiry does need to be made. An example of the first kind is someone’s age. We cannot change our age, and once a benefits system knows someone’s date of birth, it never again needs to enquire about their age. Examples of the second kind are household structure, employment status, earned income, and savings. We can affect all of these, and if a benefits system needs to know about them then enquiry has to be made. It is the latter kind of conditionality that generates administrative complexity, incentives and disincentives of various kinds, bureaucratic intrusion, and stigma. This is why the first kind of conditionality is permitted in a Citizen’s Basic Income scheme, and the second is not. (These issues will be discussed in conference papers to be presented at the June 2017 Federation for International Social Security Studies conference in Sigtuna, and at the September 2017 BIEN (Basic Income Earth Network) congress in Lisbon.)
There would clearly be a multitude of different ways of adjusting the current tax and benefits system on the implementation of a Citizen’s Basic Income, whether the new unconditional incomes were to be for an entire population, or for chosen age cohorts. The guiding principle that I shall employ is that as few changes as possible will be made, consistent with the other aims in view: revenue neutrality (Hirsch, 2015), and the avoidance of significant losses, particularly for low income households. I shall assume that raising Income Tax rates by more than 3 percentage points would be politically infeasible (Hirsch, 2015).

4
2. The ‘all at once’ scheme The Citizen’s Basic Income scheme to be tested is constructed as follows:
• Child Benefit is increased by £20 per week for each child.
• National Insurance Contributions (NICs) above the Upper Earnings Limit are raised from 2% to 12%, and the Primary Earnings Threshold is reduced to zero. This has the effect of making NICs payable on all earned income at 12%. (This seems to me to be an entirely legitimate change to make. The ethos of a flat rate benefit such as Citizen’s Basic Income is consistent with both progressive tax systems and with flat rate tax systems, but not with a regressive tax system (Atkinson, 1995).
• The Income Tax Personal Allowances are set at zero.
• Citizen’s Basic Income levels are set as follows: A Young Person’s Citizen’s Basic Income (YCBI), for people aged 16 to 24, is set at £50 per week; a Working Age Adult Citizen’s Basic Income (WACBI, or simply CBI), for people aged 25 to 64, is set at £61 per week;1 and a Citizen’s Pension, for everyone aged over 65, is set at £40 per week. The existing National Insurance Basic State Pension is left in place. (In this particular scheme the YCBI is not paid to someone still in full-time education, in recognition of the fact that their main carer is receiving Child Benefit on their behalf.)
• Income Tax rates are adjusted as required in order to achieve revenue neutrality. It might be suggested that it would be better either to retain Child Benefit as it is and pay a separate small Child Citizen’s Basic Income at the same rate for every child, or to abolish Child Benefit and to pay an equal Citizen’s Basic Income, and that to continue to pay Child Benefit at different rates for the first and for the second and subsequent children would compromise the principle that everyone of the same age should receive the same level of income. This might be true in theory, but in practice the situation is more complex. Every Citizen’s Basic Income scheme envisages that Child Citizen’s Basic Incomes will be paid to the main career, as is Child Benefit: so what is happening in practice is that children receive no Citizen’s Basic Incomes while their main carers receive varying amounts in relation to the number of children in their families. This means that to pay different amounts for the first and for the second and subsequent children would simply vary the already varying amounts paid to main carers of children, and that it would preserve sufficient of the unconditionality principle by ensuring that every main carer of the same number of children would receive the same total level of Citizen’s Basic Income, made up of their own Citizen’s Basic Incomes and those for their children. To enhance the level of Child Benefit is therefore legitimate in practice as well as conforming to our principle of making the smallest number of changes possible. (A similar approach is taken by Painter and Thoung, 2015.)
1 The calculation is as follows: Income Tax Personal Tax Allowance in 2015/16 was £11,000. Removing the allowance would mean additional Income Tax of 11,000 x 0.2 = £2,200 being paid. The Primary Earnings Threshold for National Insurance Contributions was £155 per week. Reducing the threshold to zero would mean additional National Insurance Contributions of 155 x 52 x 0.12 = £967.20. The total additional payment would be 2,200 + 967.20 = 3,167.20, which translates as £60.90 per week: so a Citizen’s Basic Income of £61 per week would more than compensate for the loss of the Income Tax Personal Allowance and the reduction of the Primary Earnings Threshold to zero.

5
Net cost, and household gains and losses As in previous working papers, I evaluate the effects of the Citizen’s Basic Income scheme on household disposable incomes rather than on individuals’ disposable incomes. There are good arguments for both approaches. It is individuals who receive income, so gain or loss is an individual experience; and within a household income is not necessarily equitably shared, so the amounts that individuals receive might be more relevant than the amount that the household receives. However, we can assume that in most cases income is pooled within households, at least to some extent, so if one member gains and another loses then the household might be better off, and that might be a more significant factor than that one member of the household has suffered a loss in disposable income. Because households are of different sizes, an absolute gain or loss is not particularly relevant. However, percentage gains and losses are relevant, so this is the measure that we use.
Table 1 summarises the results obtained from microsimulation of the scheme proposed here.2
2 The method is as follows: A new set of benefits is created in the UK country system in EUROMOD: a Citizen’s Pension (CP) for over 65 year olds, a Citizen’s Basic Income (CI) for adults aged between 25 and 64, and a young person’s Citizen’s Basic Income (CIY) for adults aged between 16 and 24. In the definitions of constants, levels are set for these Citizen’s Basic Incomes, and all Personal Tax Allowances are set at zero. So that the additional taxable income is taxed at the basic rate, and not at the higher rate, the first tax threshold is set at £43,000. The National Insurance Contribution (NIC) Primary Earnings Threshold is set to zero, and in the NIC calculation the NIC rate above the Upper Earnings Limit is set to 12% (to match the rate below the limit). Child Benefit rates are increased by £20 per week. As a transitional measure, and in the cause of an easy transition, the Young Person’s Citizen’s Basic Income is not paid to a young person still in full-time education, in recognition of the fact that their main carer is receiving Child Benefit on their behalf. The Citizen’s Basic Income total is added to the benefits total and also to the means applied to means-tested benefits. Simulations of the 2016 tax and benefits system and of the Citizen’s Basic Income scheme generate two lists of household disposable incomes for the entire Family Resource Survey sample. These then generate a list of gains (negative gains are losses), the gains are multiplied by the weighting figures supplied with the FRS survey results in order to scale up the survey sample to the entire population, and the total of the grossed up gains then gives the net cost of the scheme. To convert EUROMOD’s monthly figures to annual figures the total is multiplied by 12. A process of trial and error adjusts the Income Tax rates until the net cost falls below £2bn per annum. (For information on the household weights contained in the FRS data, see De Agostini, 2017: 50.) Household original incomes are then ordered, the bottom 20% are selected, the gains are calculated, and then the percentage gains. (It is the bottom 20% of the population of households, not the bottom 20% of the sample. The bottom 20% of the population is represented by 21.8% of the sample.) The percentage gains are then ordered and the households suffering losses of over 10% and of over 5% are selected. The weights attached to each of the relevant selected households are then added together to obtain the number of households in the whole population affected by such losses. The process is then repeated for all households.

6
Table 1: An evaluation of an illustrative Citizen’s Basic Income scheme with the working age adult Citizen’s Basic Income set at £61 per week.
Citizen’s Pension per week (existing state pensions remain in payment) £40
Working age adult Citizen’s Basic Income per week £61
Young adult Citizen’s Basic Income per week £50
(Child Benefit is increased by £20 per week) (£20)
Income Tax rate increase required for strict revenue neutrality 3 %
Income Tax, basic rate (on £0 – 43,000) 23 %
Income Tax, higher rate (on £43,000 – 150,000) 43 %
Income Tax, top rate (on £150,000 – ) 48 %
Proportion of households in the lowest original income3 quintile experiencing losses of over 10% at the point of implementation 1.6 %
Proportion of households in the lowest original income quintile experiencing losses of over 5% at the point of implementation 2.3 %
Proportion of all households experiencing losses of over 10% at the point of implementation 2.0 %
Proportion of all households experiencing losses of over 5% at the point of implementation 9.3 %
Net cost of scheme £1.96bn p.a.
We can conclude that the scheme would be strictly revenue neutral (that is, it could be funded from within the current income tax and benefits system); that the increase in Income Tax rate required would be feasible; and that the scheme would not impose significant numbers of significant losses on low income households. In theory there should be no losses for low income households because current means-tested benefits would still be in place and would be recalculated to take account of households’ Citizen’s Basic Incomes and changes in net incomes. Further research on the detail of the Family Resources Survey data would be required to discover the particular household circumstances that generate losses. Losses for
3 Households can be ordered either by disposable income or by original income. There are arguments for both approaches. To order by original income ensures that the same households remain in the lowest quintile throughout the exercise, whereas disposable incomes change once the Citizen’s Basic Income scheme is implemented, meaning that households shift between quintiles. However, it is disposable income rather than original income that more directly affects a household’s wellbeing, and other indices, such as inequality and poverty indices, generally relate to disposable income, so it is changes in disposable income that interest us. I have employed different approaches in different working papers. Here I choose to order households by original income. The EUROMOD SumStat function employs disposable income deciles, so in table 5 and figure 1 below the horizontal axis represents disposable income deciles rather than gross income deciles. For the purposes of this exercise households are ordered by household original income rather than by equivalised incomes.
7
higher income households will be due to increased Income Tax and National Insurance Contribution rates on higher earnings.
We can conclude that the scheme would be financially feasible.
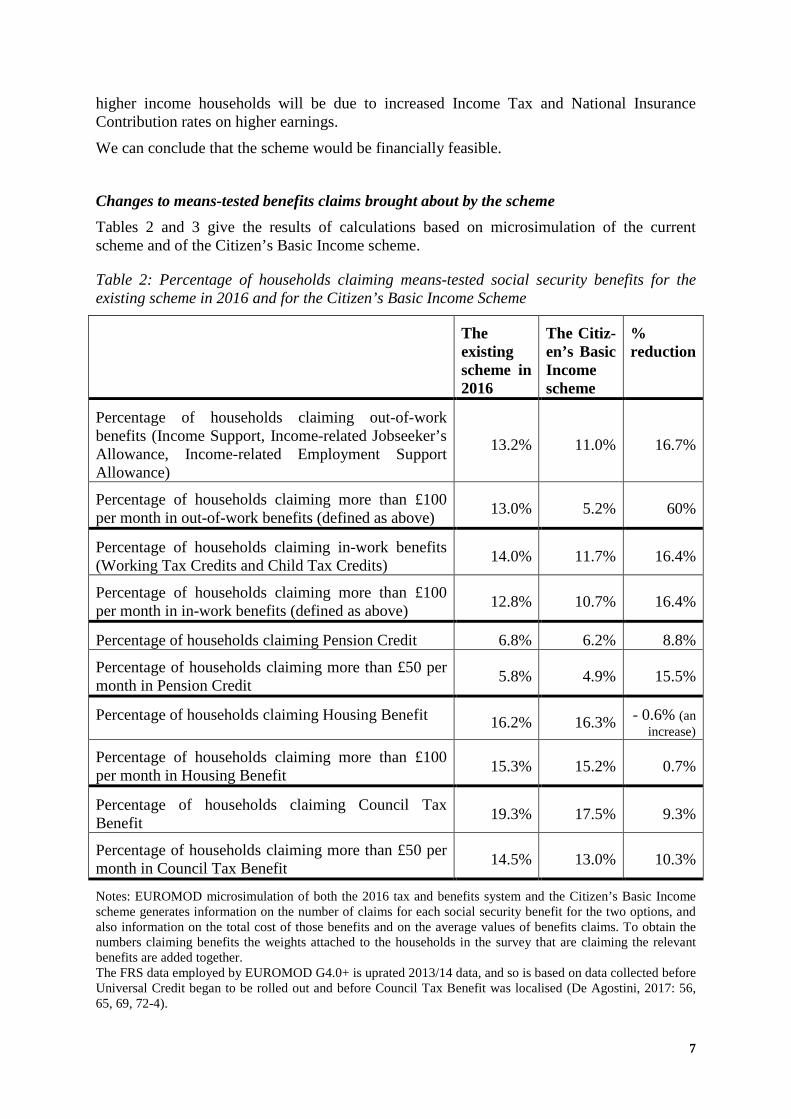
Changes to means-tested benefits claims brought about by the scheme Tables 2 and 3 give the results of calculations based on microsimulation of the current scheme and of the Citizen’s Basic Income scheme.
Table 2: Percentage of households claiming means-tested social security benefits for the existing scheme in 2016 and for the Citizen’s Basic Income Scheme
The existing scheme in 2016
The Citiz-en’s Basic Income scheme
% reduction
Percentage of households claiming out-of-work benefits (Income Support, Income-related Jobseeker’s Allowance, Income-related Employment Support Allowance)
13.2% 11.0% 16.7%
Percentage of households claiming more than £100 per month in out-of-work benefits (defined as above) 13.0% 5.2% 60%
Percentage of households claiming in-work benefits (Working Tax Credits and Child Tax Credits) 14.0% 11.7% 16.4%
Percentage of households claiming more than £100 per month in in-work benefits (defined as above) 12.8% 10.7% 16.4%
Percentage of households claiming Pension Credit 6.8% 6.2% 8.8%
Percentage of households claiming more than £50 per month in Pension Credit 5.8% 4.9% 15.5%
Percentage of households claiming Housing Benefit 16.2% 16.3% - 0.6% (an increase)
Percentage of households claiming more than £100 per month in Housing Benefit 15.3% 15.2% 0.7%
Percentage of households claiming Council Tax Benefit 19.3% 17.5% 9.3%
Percentage of households claiming more than £50 per month in Council Tax Benefit 14.5% 13.0% 10.3%
Notes: EUROMOD microsimulation of both the 2016 tax and benefits system and the Citizen’s Basic Income scheme generates information on the number of claims for each social security benefit for the two options, and also information on the total cost of those benefits and on the average values of benefits claims. To obtain the numbers claiming benefits the weights attached to the households in the survey that are claiming the relevant benefits are added together. The FRS data employed by EUROMOD G4.0+ is uprated 2013/14 data, and so is based on data collected before Universal Credit began to be rolled out and before Council Tax Benefit was localised (De Agostini, 2017: 56, 65, 69, 72-4).

8
Table 3: Percentage reductions in total costs of means-tested benefits, and percentage reductions in average value of household claims, on the implementation of the Citizen’s Basic Income scheme
Reduction in total cost
Reduction in average value of claim
Out-of-work benefits (Income Support, Income-related Jobseeker’s Allowance, Income-related Employment Support Allowance)
74.4% 65.6%
In-work benefits (Working Tax Credits and Child Tax Credits) (see note for table 2) 21.6% 6.3%
Pension Credit 35.5% 29.0%
Housing Benefit 3.3% -3.9% (an increase)
Council Tax Benefit (see note for table 2) 10.8% 1.8%
These results show that the Citizen’s Basic Income scheme:
• would reduce by 16.7% the number of households claiming the out-of-work benefits Income Support, Income-related Jobseekers’ Allowance, and Income-related Employment Support Allowance; would reduce the total cost of these benefits by 74.4%; would reduce by 65.6% the average amount of these benefits received by households claiming them; and would reduce by 60% the number of households receiving more than £100 per month in these benefits.
• would reduce by 16.4% the number of households claiming in-work benefits Working Tax Credits and Child Tax Credits; would reduce by 21.6% the total cost; would reduce by 6.3% the average amount of benefits received by households claiming them; and would reduce by 16.4% the number of households receiving more than £100 per month in these out-of-work benefits.
• would not alter by very much the number of claims for Housing Benefit, nor their average value, and so would not alter the total cost of Housing Benefit. This suggests that a Citizen’s Basic Income scheme of this type – i.e., that was strictly revenue neutral, and did not impose appreciable losses on low income households at the point of implementation – would not help to solve the problem of housing costs. A solution based on housing supply will need to be found.
• would reduce by more than one third the total cost of Pension Credit, and the average value of household claims would fall by more than a quarter. The number of claims for Pension Credit would fall by 8.8%, so the reduction in total cost is due mainly to the reduction in the average value of claims. (The current transition from Basic State Pension to a Single Tier State Pension will change this picture by removing most elderly households from Pension Credit. The slow transition from Basic State Pension to the Single Tier State Pension (STP), which will be paid at the level of income to which Pension Credit’s Guarantee Credit raises pensioner income for everyone with a complete National Insurance record, will substantially reduce the number of claims for Pension Credit. Once roll-out of the STP has been achieved, it will be relatively simple to abandon the National Insurance record conditionality and turn the STP into a Citizen’s Pension.)

9
(In 2013 Council Tax Benefit was still centrally regulated, and the uprating of the 2013 FRS data employed by EUROMOD G4.0+ continues to assume this situation. Under the Government’s localisation agenda, Council Tax Benefit’s replacement, Council Tax Support, is now locally regulated as well as locally administered. This means that every borough in the country can now invent its own regulations, and, in particular, its own taper rate. It will be far from easy to include Council Tax Support in future tax and benefits simulations. EUROMOD G4.0+ assumes that Council Tax Support is still regulated as it was in 2013 (De Agostini, 2017: 39).)
The poverty, inequality and redistributional effects of the Citizen’s Basic Income scheme The data employed in this section are generated by the SumStat application attached to EUROMOD G4.0+.
Table 4 shows the changes that the illustrative Citizen’s Basic Income scheme would bring about in relation to poverty and inequality.
Table 4: Changes in poverty and inequality indices brought about by the Citizen’s Basic Income scheme
The current tax and benefits scheme in 2016
The Citizen’s Basic Income scheme
Percentage change in the indices
Inequality Disposable income Gini coefficient 0.3038 0.2704 11.0%
Poverty headcount rates Total population in poverty 14.84% 11.80% 18.1% Children in poverty 15.72% 10.43% 33.7% Working age adults in poverty 14.69% 11.70% 20.4% Economically active working age adults in poverty 5.74% 4.34% 24.4%
Elderly people in poverty 14.26% 13.90% 2.52% Notes: Poverty is defined as household incomes below 60% of median household income (De Agostini, 2017: 67-9).
We can conclude that
• the Citizen’s Basic Income scheme would deliver a significant reduction in inequality;
• more significantly, child poverty would fall by a third, and working age poverty would also fall.
Table 5 and figure 1 show the aggregate redistribution that would occur if the Citizen’s Basic Income scheme were to be implemented.

10
Table 5: The redistributional effect of the illustrative Citizen’s Basic Income scheme
Disposable income decile 1 2 3 4 5 6 7 8 9 10
% increase in mean disposable income 20.1 8.4 6.6 5.7 6.4 3.5 2.7 0 -2.3 -5.9
For the purposes of this exercise households are ranked by total equivalised disposable incomes (De Agostini, 2017: 67).
Figure 1: The redistributional effect of the illustrative Citizen’s Basic Income scheme
The table and graph show that the scheme would achieve manageable and useful redistribution from rich to poor, with those households often described as the ‘squeezed middle’ benefiting from the transition as well as the poorest households.
Marginal effective tax rates The marginal effective tax rate measures the extent to which additional earned income does not result in additional disposable income. If y is the earned income before an increase, y’ is earned income after an increase, d is disposable income before the increase in earned income, and d’ is disposable income after the increase, then the marginal effective tax rate, METR, is given by (1-((d’-d)/(y’-y))) x 100. So if an additional £200 in earnings results in an additional £150 of disposable income, the marginal effective tax rate is 25%.
Until 2003 the Department for Work and Pensions published in printed form a set of graphs and tables that showed the marginal effective tax rates experienced by a range of household types across a wide range of earnings at £10 intervals (Department for Work and Pensions, 2003). The tables then went online for a couple of years before publication ceased. It would be enormously valuable to the research community for the calculation and publication of the tables to resume. This working paper is not the place for an attempt at such a major exercise. Instead, it offers sufficient information to enable us draw some tentative conclusions about possible employment market effects.
Here I shall take two different approaches:

11
Marginal effective tax rates, method 1 EUROMOD’s ‘MTR’ add-on calculates marginal effective tax rates (METRs) for all individuals who are earning an income. The add-on increases by 3% the earned income of each working age adult in the household in turn and calculates the increase in the household disposable income that this generates. If y is an individual’s original earned income, d the original household disposable income, and d’ the final household disposable income, then the METR is given by (1-((d’-d)/0.03y)) x 100. I follow Makovec and Tammik (2017: 21-2) in removing from the list of METRs generated for the FRS sample any METRs with values over 150% and any with negative values. The exercise is then repeated with earned income increased by 20%, where the METR is given by (1-((d’-d)/0.2y)) x 100.
This method assumes that in every household every individual adult has complete knowledge of the household’s financial resources, that all household members possess equal power in relation to household resources, and that each individual’s motivation is a function of household disposable income.
Marginal effective tax rates and participation tax rates, method 2 A second method increases the earned income of every individual 16 years old and above by £200 per month, and calculates the change in that individual’s disposable income. This method therefore generates results for individuals already in employment, and also for individuals not in employment. For someone not in employment who enters employment, the ratio between the change in disposable income and the new earned income is the Participation Tax Rate (PTR); and for someone already in employment, the ratio between the change in disposable income and the change in earned income is the Marginal Effective Tax Rate (METR). A high PTR represents an ‘unemployment trap’, and a high METR a ‘poverty trap’. In relation both to individuals initially in employment and to those not, a household’s benefits income is assumed to be received by the individual to which the payment is made rather than by the household as a whole; and the earnings of all adults in the household are increased at the same time (as opposed to method 1, which increases each earned income in turn). The calculation is the same for both the PTR and the METR: If d is the individual’s original disposable income and d’ is their final disposable income, then the PTR/METR is given by (1-((d’-d)/200)) x 100. £200 per month represents something between half a day a week and a day a week of additional employed hours at the National Living Wage, and so represents the kind of real world employment market decision with which many individuals might be faced.
This method does not assume equal knowledge or sharing of a household’s financial resources within the household, but it does assume that each individual’s motivation is a function of the payments that they receive. So if one member of a couple receives Working Tax Credits payments on behalf of the household, then they and not their partner will be assumed to be influenced by any decrease in that payment; and if the other member receives Child Benefit, then they and not their partner will be influenced by that.
The reality in relation to household members’ knowledge and sharing of household resources will generally lie somewhere between the two methods’ assumptions for each household, with I suspect very few households at either end of the spectrum.
A set of results for the current tax and benefits scheme and for the illustrative Citizen’s Basic Income scheme are given in tables 6 and 7.

12
Table 6a: Results for method 1: Average marginal effective tax rates and numbers of marginal effective tax rates at various levels for households containing gainfully employed working age adults, both for the current tax and benefits system and for the illustrative Citizen’s Basic Income scheme, when individuals’ earned incomes rise by 3%
Marginal effective tax rates Percentage of individuals experiencing these METRs with the current tax and benefits system
Percentage of individuals experiencing these METRs with the illustrative Citizen’s Basic Income scheme
Over 100% 0.26% 0.18%
Over 90% 2.93% 5.14%
Over 80% 3.90% 5.60%
Over 70% 10.96% 12.60%
Median METR 34.80% 37.57%
Mean METR 38.68% 45.18%
Table 6b: Results for method 1: Average marginal effective tax rates and numbers of marginal effective tax rates at various levels for households containing gainfully employed working age adults, both for the current tax and benefits system and for the illustrative Citizen’s Basic Income scheme, when individuals’ earned incomes rise by 20%
Marginal effective tax rates Percentage of individuals experiencing these METRs with the current tax and benefits system
Percentage of individuals experiencing these METRs with the illustrative Citizen’s Basic Income scheme
Over 100% 0.27% 0.21%
Over 90% 2.42% 4.26%
Over 80% 3.93% 5.27%
Over 70% 9.32% 11.63%
Median METR 35.56% 38.39%
Mean METR 39.10% 45.62%
Method 1 studies only households in which at least one adult has earned income. As we have already seen, some households containing gainfully employed individuals will escape from Working Tax Credits (although not necessarily from Housing Benefit), but others will experience raised Income Tax rates, and some will experience higher National Insurance Contributions. While there will be fewer households on extremely high METRs, the number with METRs over 70% will rise by approximately 2%, and similarly for METRs over 80% and over 90%. Average METRs rise by approximately 6.5%, and the medians by approximately 3%. The picture looks much the same whether earned incomes rise by 3% or by 20%.

13
Table 7a: Results for method 2: Proportions of initially waged individuals over the age of 16 experiencing various marginal effective tax rates, both for the current tax and benefits system and for the illustrative Citizen’s Basic Income scheme, when all adults’ earned incomes are raised by £200 per month4
Marginal Effective Tax Rates Percentage of individuals experiencing these METRs with the current tax and benefits system
Percentage of individuals experiencing these METRs with the illustrative Citizen’s Basic Income scheme
Over 100% 34.46% 3.58%
Over 90% 35.83% 4.75%
Over 80% 37.22% 5.19%
Over 70% 38.51% 8.23%
Median METR 9.30% 37.56% Note: Averages have not been calculated because method 2 generates substantial numbers of negative and high positive results.
Table 7b: Results for method 2: Proportions of initially unwaged individuals over the age of 16 experiencing various participation tax rates, both for the current tax and benefits system and for the illustrative Citizen’s Basic Income scheme, when all adults’ earned incomes are raised by £200 per month
Participation Tax Rates Percentage of individuals experiencing these PTRs with the current tax and benefits system
Percentage of individuals experiencing these PTRs with the illustrative Citizen’s Basic Income scheme
Over 100% 23.63% 7.30%
Over 90% 25.81% 8.01%
Over 80% 35.15% 9.79%
Over 70% 39.16% 1.83%
Median PTR 19.74% 35.00% Note: Averages have not been calculated because method 2 generates substantial numbers of negative and high positive results.
4 Method 2 is as follows: An additional calculation is added to the National Minimum Wage function (yem) in EUROMOD that adds £200 per month to the earned income of every individual over sixteen years of age. (The NMW parts of the policy are switched off.) The effect is to add £200 to the original income of every individual over the age of sixteen. EUROMOD is run to generate disposable income lists both before and after the change in earned income, for both the current tax and benefits system and for the illustrative Citizen’s Basic Income scheme. METRs/PTRs are then calculated, and for all of the individuals experiencing METRs/PTRs within the required range the weights provided in the FRS data are added together to give the total number of over 16s experiencing that range of METRs. These figures are then compared with the total number of over 16s in the population as represented by the total of the weights for every over 16 in the FRS data.
14
Method 2 captures the effect of increases in earned income for both themselves and their partner on the payments made to the individual in the household who receives benefits payments ( - in-work benefits payments in the case of METRs, and out-of-work benefits payments in the case of PTRs). As we can see from the tables, substantial numbers of individuals experience high individual METRs and PTRs when their own and their partners’ earned incomes rise by £200 per month. This we would expect. What is particularly interesting about this table is not that high METRs and PTRs exist for the current system, but that the problem is significantly reduced in the context of a Citizen’s Basic Income scheme.
The low medians for the current system result from positive Income Tax Personal Allowances (so that low earnings are not taxed) and from an individual’s additional earnings reducing benefits payments made to another household member and not payments made to themselves. In the context of a Citizen’s Basic Income scheme, all earnings are taxed, raising the medians.
A feasible and useful scheme Citizen’s Basic Income scheme Because the only changes required in order to implement this scheme would be
• payment of the Citizen’s Basic Incomes for every individual above the age of 16, calculated purely in relation to the age of each individual (with perhaps a transitional arrangement for individuals between their 16th and 19th birthdays and still in full-time education),
• increases in the rates of Child Benefit,
• changes to Income Tax and National Insurance Contribution rates and thresholds, and
• easy to achieve recalculations in existing means-tested benefits claims, the entire scheme could be implemented very quickly.
This simple scheme would offer improved poverty and inequality indicators; it would provide additional employment market incentives to the extent that changes in both earned income and benefits payments made to the individual influence employment market behaviour; it would remove large numbers of households from a variety of means-tested benefits; it would reduce means-tested benefit claim values, and the total costs of means-tested benefits; it would avoid significant numbers of losses at the point of implementation; and it would require almost no additional public expenditure.
This simple illustrative scheme could be both feasible and useful.
3. A gradual roll-out, one age cohort at a time The second of the implementation methods discussed by the ICAEW at its consultation envisages the Citizen’s Basic Income being rolled out one age cohort at a time: a suggestion now also being made by the OECD (OECD, 2017: 8). First of all Child Benefit could be enhanced. The second stage could be a Citizen’s Basic Income paid to everyone aged 16, 17 and 18. Then every new cohort of 16 year olds could receive a Citizen’s Basic Income. (We shall test this third stage when 21 year olds are receiving Citizen’s Basic Incomes.)
Alongside the results that we have already achieved for a scheme that would cover the entire population, results for the first seven years of a gradual roll-out will offer some confidence

15
that a Citizen’s Basic Income scheme could be successfully rolled out and would have beneficial outcomes.
Stages of the gradual roll-out Stage 1: Child Benefit would be increased by £20 for every child, the increase being paid for by raising National Insurance Contributions above the Upper Earnings Limit to 12% and by raising Income Tax rates to the extent required for revenue neutrality, understood here as a net cost for the scheme between -£2bn and +£2bn per annum.
Stage 2: All of the characteristics of stage 1 would be retained, except that Child Benefit would be equalised at £40.70 for every child in order to achieve a smoother transition at age 16 for all children and their families. A Citizen’s Basic Income of £45 per week5 would be paid to everyone aged 16, 17 and 18. This would be paid for by reducing their Income Tax Personal Allowance to zero (by applying a Basic Rate (BR) tax code) and by restricting Child Benefit to under 16s. If necessary the Income Tax Basic Rate would be adjusted to ensure revenue neutrality.
Stage 3: Citizen’s Basic Incomes would be paid to further one year cohorts by the simple expedient of allowing everyone who already had one to keep it and paying Citizen’s Basic Incomes to everyone aged 16 and setting their Income Tax Personal Allowances to zero. Whereas the first three one year age cohorts of 16, 17 and 18 year olds would have to receive their new Citizen’s Basic Incomes at the same time in order to enable Child Benefit to be restricted to under 16s, subsequent one year cohorts could be added one year at a time. This stage will be tested after three years have been added, that is, when Citizen’s Basic Incomes are being paid to 21 year olds.
Results will be given for all three stages, and results already obtained for the complete Citizen’s Basic Income scheme above will be repeated for comparison.
5 The Income Tax Personal Allowance is £11,000 per annum. At a Basic Rate of 21% this is worth £44.42 a week, suggesting a Citizen’s Basic Income of £45 per week.

16
Net cost and losses at the point of implementation for the stages of the roll-out and for the complete scheme
Table 8a: An evaluation of the three-stage roll-out and the complete Citizen’s Basic Income scheme
Stage 1 Stage 2 Stage 3 Complete scheme
Citizen’s Pension per week (existing state pensions remain in payment) n/a n/a n/a £40
Working age adult Citizen’s Basic Income per week n/a n/a n/a £61
Young adult Citizen’s Basic Income per week n/a £45 £45 £50
Child Benefit increased. Figures are given for first and for second and subsequent children
£40.70 / £33.70
£40.70 / £40.70
£40.70 / £40.70
£40.70 / £33.70
Income Tax rate increase relative to current rates required for strict revenue neutrality
1% 1% 1% 3%
Income Tax, basic rate 21% 21% 21% 23%
Income Tax, higher rate 41% 41% 41% 43%
Income Tax, top rate 46% 46% 46% 48% Notes: In relation to the gradual roll-out, the young adult’s Citizen’s Basic Income is paid to everyone of the relevant age, and Child Benefit is restricted to under 16s. In relation to the complete scheme, a different approach was taken: the Young Person’s Citizen’s Basic Income was not paid to anyone still in full time education because their carer was already receiving the enhanced Child Benefit on their behalf. A phased transition from the second to the first option might be the most appropriate approach. For Child Benefit payable as part of the complete scheme to be equalised at £40.70 per week for every child would require additional funds. There are 11,617,166 children under 16. This figure multiplied by £7 per week for 52 weeks would require £4.2bn p.a.. However, this addition would only be required for second and subsequent children, suggesting a figure of about half that. An alternative approach would be to return to differentiated Child Benefit payments later in the roll-out. The additions to Income Tax rates are relative to current rates. No additions would be required for stages 2 or 3 in order to achieve revenue neutrality. During the early stages of the gradual roll-out the threshold above which the higher rate of Income Tax is paid can be left where it is at £32,000. As the roll-out progresses it will need to be raised to £43,000 to ensure that the basic rate is paid on the same amount of earned income as in the current tax system.
17
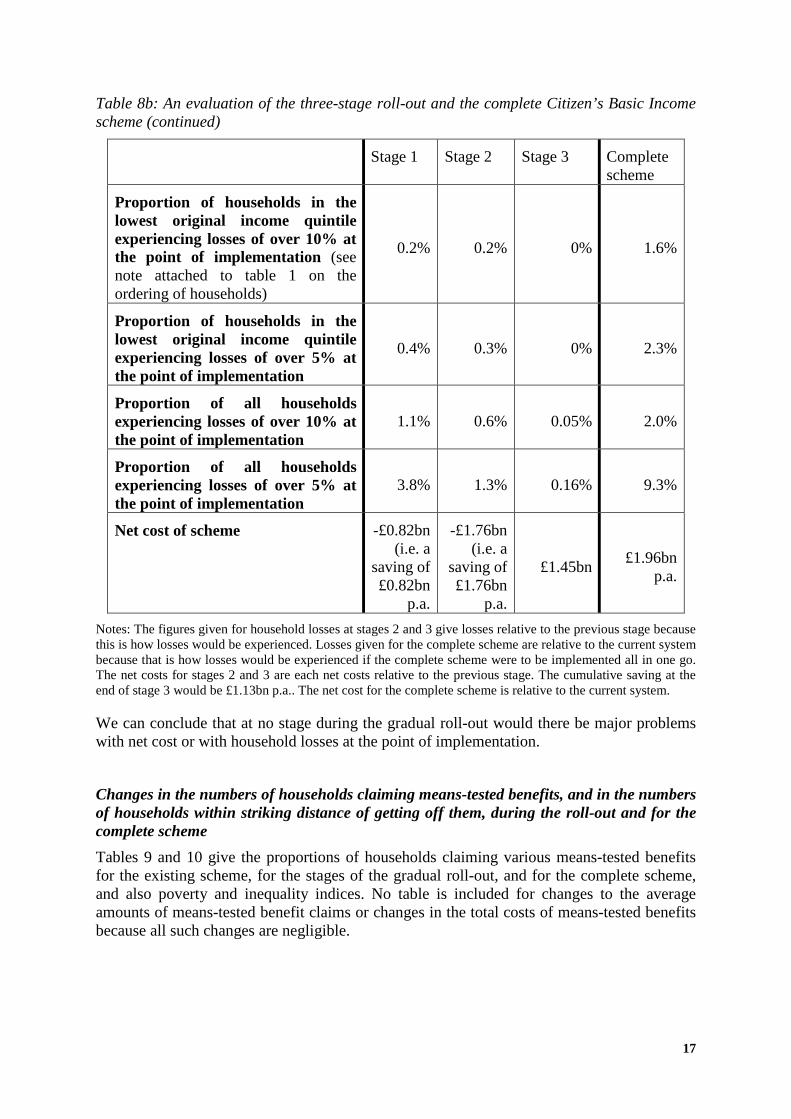
Table 8b: An evaluation of the three-stage roll-out and the complete Citizen’s Basic Income scheme (continued)
Stage 1 Stage 2 Stage 3 Complete scheme
Proportion of households in the lowest original income quintile experiencing losses of over 10% at the point of implementation (see note attached to table 1 on the ordering of households)
0.2% 0.2% 0% 1.6%
Proportion of households in the lowest original income quintile experiencing losses of over 5% at the point of implementation
0.4% 0.3% 0% 2.3%
Proportion of all households experiencing losses of over 10% at the point of implementation
1.1% 0.6% 0.05% 2.0%
Proportion of all households experiencing losses of over 5% at the point of implementation
3.8% 1.3% 0.16% 9.3%
Net cost of scheme -£0.82bn (i.e. a
saving of £0.82bn
p.a.
-£1.76bn (i.e. a
saving of £1.76bn
p.a.
£1.45bn £1.96bn p.a.
Notes: The figures given for household losses at stages 2 and 3 give losses relative to the previous stage because this is how losses would be experienced. Losses given for the complete scheme are relative to the current system because that is how losses would be experienced if the complete scheme were to be implemented all in one go. The net costs for stages 2 and 3 are each net costs relative to the previous stage. The cumulative saving at the end of stage 3 would be £1.13bn p.a.. The net cost for the complete scheme is relative to the current system.
We can conclude that at no stage during the gradual roll-out would there be major problems with net cost or with household losses at the point of implementation.
Changes in the numbers of households claiming means-tested benefits, and in the numbers of households within striking distance of getting off them, during the roll-out and for the complete scheme Tables 9 and 10 give the proportions of households claiming various means-tested benefits for the existing scheme, for the stages of the gradual roll-out, and for the complete scheme, and also poverty and inequality indices. No table is included for changes to the average amounts of means-tested benefit claims or changes in the total costs of means-tested benefits because all such changes are negligible.

18
Table 9: Percentages of households claiming means-tested social security benefits for the existing scheme in 2016, during the gradual roll-out, and for the complete scheme
Current system
Stage 1 Stage 2 Stage 3 Complete scheme
Percentage of households claiming out-of-work benefits (Income Support, Income-related Jobseeker’s Allowance, Income-related Employment Support Allowance)
13.2% 13.2% 13.2% 13.1% 11.0%
Percentage of households claiming more than £100 per month in out-of-work benefits (defined as above)
13.0% 13.0% 12.5% 11.7% 5.2%
Percentage of households claiming in-work benefits (Working Tax Credits and Child Tax Credits)
14.0% 14.0% 13.8% 13.8% 11.7%
Percentage of households claiming more than £100 per month in in-work benefits (defined as above)
12.8% 12.8% 12.6% 12.6% 10.7%
Percentage of households claiming Pension Credit 6.8% 6.8% 6.8% 6.8% 6.2%
Percentage of households claiming more than £50 per month in Pension Credit
5.8% 5.8% 5.8% 5.8% 4.9%
Percentage of households claiming Housing Benefit 16.2% 16.2% 16.2% 16.2% 16.3%
Percentage of households claiming more than £100 per month in Housing Benefit
15.3% 15.3% 15.2% 15.2% 15.2%
Percentage of households claiming Council Tax Benefit 19.3% 19.3% 19.2% 19.2% 17.5%
Percentage of households claiming more than £50 per month in Council Tax Benefit
14.5% 14.5% 14.5% 14.5% 13.0%
Notes: See notes attached to table 2 for information about the Universal Credit roll-out and the localisation of Council Tax Benefit.
The numbers of means-tested benefits claimants, and the number within striking distance of coming off them, are moving slowly downwards in the direction of the results discovered for the complete scheme. There is every reason to expect these downward trends to continue throughout the roll-out.
Reductions in total costs of benefits and in average value of claim will be small by the end of the third stage so these have not been calculated.

19
Poverty and inequality indices for the roll-out and the complete scheme
Table 10: Poverty and inequality indices for the stages of the roll-out and for the complete scheme.
Current system Stage 1 Stage 2 Stage 3
The complete scheme
Inequality Disposable income Gini coefficient 0.3038 0.3038 0.283 0.2818 0.2704
Poverty headcount rates Total population in poverty 14.84% 13.99% 14.11% 13.98% 11.80% Children in poverty 15.72% 12.44% 12.40% 12.34% 10.43% Working age adults in poverty 14.69% 14.24% 14.41% 14.13% 11.70% Economically active working age adults in poverty 5.74% 5.49% 5.55% 5.38% 4.34%
Elderly people in poverty 14.26% 15.08% 15.26% 15.54% 13.90% Notes: Poverty is defined as household incomes below 60% of median household income (De Agostini, 2017: 67-9).
Stage 1 leaves inequality where it is, whereas stages 1 and 2 start a gradual reduction towards the significantly lower level reached by the complete scheme.
Similarly, poverty levels fall in the direction of the lower levels achieved by the complete scheme. The one anomaly is the figures for elderly poverty. The small increase in measured poverty delivered by EUROMOD’s SumStat tool at stage 1 will be partly a result of the 1% increase in Income Tax rates, as that is the only factor that could affect elderly individuals. A study of microsimulation results shows that no elderly person’s disposable income falls by more than 1.7%, and all losses over 1% are experienced by individuals with disposable incomes of over £3,000 per month, so losses related to the change in the Income Tax rates cannot be the only reason for the increase in this poverty index. At stages 2 and 3 there are no new factors that could affect elderly individuals’ incomes. It would appear that the way in which SumStat chooses poverty lines is part of the reason for the apparent increase in elderly poverty. The complete scheme, as we have already recognised, would deliver significant reductions in all of the poverty indices.
Redistribution during the roll-out We have already reported above, in figure 1, on the redistribution achieved by the complete scheme. We now report on redistributions achieved during the gradual roll-out.
Table 11: Redistribution achieved by stage 1 relative to the current tax and benefits system
Disposable income decile 1 2 3 4 5 6 7 8 9 10
% increase in mean disposable income 2.9 3.6 3.3 5.0 4.3 3.3 2.0 0.4 -0.6 -4.5

20
Figure 2: Redistribution achieved by stage 1 relative to the current tax and benefits system
Table 12: The cumulative distribution achieved by the time stage 3 of the roll-out is reached, relative to the current tax and benefits system
Disposable income decile 1 2 3 4 5 6 7 8 9 10
% increase in mean disposable income 4.0 4.3 3.6 6.2 4.8 4.8 3.1 1.6 0.0 -6.0
Figure 3: The cumulative distribution achieved by the time stage 3 of the roll-out is reached, relative to the current tax and benefits system
For comparison, I repeat here the redistribution achieved by the complete scheme:

21
Table 13: The redistributional effect of the illustrative Citizen’s Basic Income scheme
Disposable income decile 1 2 3 4 5 6 7 8 9 10
% increase in mean disposable income 20.1 8.4 6.6 5.7 6.4 3.5 2.7 0 -2.3 -5.9
Figure 4: The redistribution achieved by the complete scheme
As we can see from these graphs, much of the redistributional work is done by the enhancement of Child Benefit levels. Stages 2 and 3 achieve only minor changes, but changes would continue to accumulate during the roll-out as Citizen’s Basic Incomes were paid to the entire age range. The mean loss for the highest decile should be manageable, particularly if a gradual roll-out is implemented.
Marginal effective tax rates during the roll-out and for the complete scheme See above for the two methods employed to calculate marginal effective tax rates. The following tables and graphs give METRs for each stage of the gradual roll-out and for the complete scheme.

22
Table 14a: Results for method 1: Average marginal effective tax rates and numbers of marginal effective tax rates at various levels for households containing gainfully employed working age adults, for the current tax and benefits system, for the three stages of the gradual roll-out, and for the complete Citizen’s Basic Income scheme, when individuals’ earned incomes rise by 3%
METRs Percentage of individuals experiencing these METRs
The current tax and benefits system
Stage 1 Stage 2 Stage 3 Complete Citizen’s Basic Income scheme
Over 100% 0.26% 0.21% 0.19% 0.19% 0.18%
Over 90% 2.93% 3.23% 3.06% 3.02% 5.14%
Over 80% 3.90% 4.33% 4.57% 4.53% 5.60%
Over 70% 10.96% 12.39% 12.96% 12.96% 12.60%
Median METR 34.80% 36.14% 36.11% 36.14% 37.57%
Mean METR 38.68% 41.18% 41.36% 41.72% 45.18%
Table 14b: Results for method 1: Average marginal effective tax rates and numbers of marginal effective tax rates at various levels for households containing gainfully employed working age adults, for the current tax and benefits system, for the three stages of the gradual roll-out, and for the complete Citizen’s Basic Income scheme, when individuals’ earned incomes rise by 20%
METRs Percentage of individuals experiencing these METRs
The current tax and benefits system
Stage1 Stage 2 Stage 3 Complete Citizen’s Basic Income scheme
Over 100% 0.27% 0.22% 0.23% 0.26% 0.21%
Over 90% 2.42% 2.52% 2.39% 2.38% 4.26%
Over 80% 3.93% 4.38% 4.75% 4.71% 5.27%
Over 70% 9.32% 10.82% 11.68% 11.66% 11.63%
Median METR 35.56% 36.95% 36.95% 36.95% 38.39%
Mean METR 39.10% 41.98% 42.19% 42.51% 45.62%
With method 2: As before, the METR researched is the METR experienced by an individual in relation to all of the payments that they personally receive (including benefits amounts that they receive on behalf of their households) when they and any other working age adults in the household increase their earned incomes by £200 per month.

23
Table 15a: Results for method 2: Marginal effective tax rates relating to initially waged individuals at the three stages of the roll-out and for the complete scheme
Percentage of individuals experiencing these METRs
Marginal eff-ective tax rates
Current system
Stage 1 Stage 2 Stage 3 Complete scheme
Over 100% 34.46% 4.48% 4.37% 4.37% 3.58%
Over 90% 35.83% 5.52% 5.37% 5.37% 4.75%
Over 80% 37.22% 6.23% 6.06% 6.54% 5.19%
Over 70% 38.51% 8.93% 8.99% 9.45% 8.23%
Median METR 9.3% 34.99% 34.90% 35.03% 37.56%
Table 15b: Results for method 2: Participation tax rates relating to initially unwaged individuals at the three stages of the roll-out and for the complete scheme
Percentage of individuals experiencing these PTRs
Participation tax rates
Current system
Stage 1 Stage 2 Stage 3 Complete scheme
Over 100% 23.63% 6.25% 6.46% 6.67% 7.30%
Over 90% 25.81% 6.95% 6.91% 7.13% 8.01%
Over 80% 35.15% 14.41% 13.87% 12.85% 9.79%
Over 70% 39.16% 15.91% 15.33% 14.34% 11.83%
Median PTR 19.74% 21.00% 21.00% 21.00% 35.00%
As with redistribution, the major change occurs when Child Benefit levels are enhanced; but useful reductions in METRs continue to occur as the roll-out progresses: so either by enhancing Child Benefit, or by paying a Citizen’s Basic Income, we could remove a large part of problem constituted by the disposable income loss experienced by the benefits claimant in the household when they and other working age adults (whether or not previously employed) add £200 per month to earned income. A slightly different result emerges in relation to PTRs. Here, the number of very high PTRs rises slightly, whereas the number of high PTRs falls.
In relation to method 1, for household METRs experienced by households with working age adults in employment, we would expect the kinds of rises in METRs that we see, because rates of Income Tax are raised slightly, and although we know that a significant number of households would escape from in-work means-tested benefits such as Working Tax Credits, either with the complete Citizen’s Basic Income scheme, or with the gradual roll-out, we also know that there would be little change in relation to Housing Benefit claims, and probably little change in relation to Council Tax Benefit claims. Only a housing-led solution to the problem of rapidly rising housing costs will solve this problem. We also know that a substantial number of households would escape from out-of-work means-tested benefits, but not from Housing Benefit, but we shall need to wait for the new EUROMOD MTR that will encompass non-earning households in order to get a better picture of how household PTRs as

24
well as METRs would react to the complete Citizen’s Basic Income scheme and to a gradual roll-out.
What we can say is that method 1 delivers no significant surprises, but that method 2 does deliver something of a significant surprise. The individual METRs that individuals who experience benefits payments as their individual incomes suffer when they and other working age adults in their households increase their employment incomes is clearly a serious problem for the current benefits system. The problem largely disappears in the context of a Citizen’s Basic Income scheme, and also at the first stage of the gradual roll-out.
The reality for most households will lie between a) the individual to whom benefits payments are paid counting those payments as their own individual income, and b) all members of the household counting benefits payments as household income. The fact that there would be little change in METRs and PTRs at the b) end of the spectrum, and substantial change at the a) end, suggests that both the complete Citizen’s Basic Income scheme and the first stage of the gradual roll-out would have significant positive effects on employment market incentives.
4. Conclusion This working paper has evaluated a Citizen’s Basic Income scheme in the UK implemented all in one go, and has also evaluated three stages of a gradual roll-out of a similar scheme.
In order for the gradual roll-out to reach the complete scheme, a Citizen’s Pension would need to be implemented (and at the same time Income Tax Personal Allowances for those over state retirement age would be reduced to zero); Citizen’s Basic Incomes would need to be paid to every new cohort of sixteen year olds until every working age adult between the ages of 22 and state retirement age had a Citizen’s Basic Income; the National Insurance Contributions Primary Earnings Threshold would need to be slowly reduced to zero; the threshold above which higher rate Income Tax is paid would need to be raised, and Income Tax rates would need to be slowly raised to 3 percentage points above current levels. (No 16 year old would receive an Income Tax Personal Allowance, so by the time every working age adult had a Citizen’s Basic Income, all Income Tax Personal Allowances would have been set to zero.)
The evaluations contained in this working paper suggest that it would be administratively and financially feasible to implement a Citizen’s Basic Income in either of the two ways envisaged, and that whichever route was chosen, useful effects in terms of poverty reduction, inequality reduction, marginal effective tax rate reductions (in relation to the individual’s experience, but not necessarily the household’s), and escape from means-testing, could be confidently predicted. In relation to the complete scheme, and in relation to each of the stages of the gradual roll-out, redistribution from rich to poor can be predicted, with manageable reductions for the better off, and significant average percentage increases for those in the lowest disposable income deciles. Whether in relation to the implementation of the complete scheme, or in relation to each of the stages of the gradual roll-out, the number of household losses at the point of implementation would be insignificant for households in the lowest original income quintile, and relatively insignificant for all households.
Now that the Citizen’s Basic Income debate is increasingly interested in feasibility and implementation, it would be useful for more microsimulation research of this kind to be undertaken on a wide variety of illustrative schemes; and it would also be useful for ‘typical household’ research of the kind that used to inform the Department for Work and Pensions Tax Benefit Model Tables to be carried out (Department for Work and Pensions, 2003). Lists of marginal effective tax rates for a wide variety of household types across wide earnings
25
ranges, using both of the methods employed above, for the current tax and benefits system and for a variety of illustrative Citizen’s Basic Income schemes, would make an important contribution to a debate that both needs and seeks this kind of analysis.
References Atkinson, A.B. (1995) Public Economics in Action: The Basic Income / Flat Tax Proposal, Clarendon Press, Oxford.
De Agostini, Paola (2017) EUROMOD Country Report United Kingdom 2013-2016, Colchester: Institute for Social and Economic Research, February 2017, https://www.euromod.ac.uk/sites/default/files/country-reports/year7/Y7_CR_UK_Final.pdf
Department for Work and Pensions (2003) Tax Benefit Model Tables April 2003, London: Department for Work and Pensions Information Centre, Information and Analysis Directorate.
Hirsch, Donald (2015) Could a “Citizen’s Income” work? York: Joseph Rowntree Foundation, 4th March 2015, pp. 25–28. www.jrf.org.uk/publications/could-citizens-income-work
Makovec, Mattia and Miko Tammik (2017) Baseline results from the EU28 EUROMOD: 2011-2016, EUROMOD Working Paper EM17/14, Colchester: Institute for Social and Economic Research, University of Essex, www.iser.essex.ac.uk/research/publications/working-papers/euromod/em6-17 OECD (2017) Basic Income as a Policy Option: Can it add up? Paris: OECD, www.oecd.org/employment/emp/Basic-Income-Policy-Option-2017.pdf
Painter, Anthony and Chris Thoung, (2015) Report: Creative Citizen, Creative State – The principled and pragmatic case for a Universal Basic Income, London: Royal Society of Arts, https://www.thersa.org/discover/publications-and-articles/reports/basic-income. (A review of of the report can be found in Citizen’s Income Newsletter, issue 2 for 2016, London: Citizen’s Income Trust, 2016, pp. 20–21, http://citizensincome.org/research-analysis/the-royal-society-of-arts-report-on-citizens-income/ .)
Torry, Malcolm (2013) Money for Everyone: Why we need a Citizen’s Income, Bristol: Policy Press.
(2014) Research note: A feasible way to implement a Citizen’s Income, EUROMOD Working Paper EM17/14, Colchester: Institute for Social and Economic Research, University of Essex, www.iser.essex.ac.uk/research/publications/working-papers/euromod/em17-14
(2015a) Two feasible ways to implement a revenue neutral Citizen’s Income scheme, EUROMOD Working Paper EM6/15, Colchester: Institute for Social and Economic Research, University of Essex, www.iser.essex.ac.uk/research/publications/working-papers/euromod/em6-15
(2015b) 101 Reasons for a Citizen’s Income: Arguments for giving everyone some money, Bristol: Policy Press, 2015
(2016a) An evaluation of a strictly revenue neutral Citizen’s Income scheme, EUROMOD Working Paper EM5/16, Colchester: Institute for Social and Economic Research, University of Essex, https://www.iser.essex.ac.uk/research/publications/working-papers/euromod/em5-16

26
(2016b) Citizen’s Income schemes: an amendment, and a pilot project - addendum to EUROMOD Working Paper EM5/16, EUROMOD Working Paper EM5/16a, Colchester: Institute for Social and Economic Research, University of Essex, https://www.iser.essex.ac.uk/research/publications/working-papers/euromod/em5-16a
(2016c) The Feasibility of Citizen’s Income, New York: Palgrave Macmillan
(2016d) Citizen’s Basic Income: A Christian social policy, London: Darton, Longman and Todd
(2016e) How might we implement a Citizen’s Income, London: ICAEW, www.icaew.com/-/media/corporate/files/technical/sustainability/outside-insights/citizens-income-web---final.ashx?la=en; for a report on the consultation, see http://citizensincome.org/news/icaew-report-on-implementing-citizens-income/.