Embed Size (px)
Citation preview
A VARIATIONAL APPROACH TO NON-NEWTONIAN FLOW IN
ANGULAR PORES: AN APPLICATION TO ENHANCED OIL
RECOVERY
NITHIN KAVOORI
Department of Mechanical Engineering
APPROVED:
Vinod Kumar, Ph.D., Chair
Ramana Chintalapalle, Ph.D.
Leticia Velazquez, Ph.D.
Patricia Witherspoon, Ph.D.
Dean of the Graduate School

Copyright
by
Nithin Kavoori
2010
A VARIATIONAL APPROACH TO NON-NEWTONIAN FLOW IN ANGULAR
PORES: AN APPLICATION TO ENHANCED OIL RECOVERY
by
NITHIN KAVOORI, B.S.
THESIS
Presented to the Faculty of the Graduate School of
The University of Texas at El Paso
in Partial Fulfillment
of the Requirements
for the Degree of
MASTER OF SCIENCE
Department of Mechanical Engineering
THE UNIVERSITY OF TEXAS AT EL PASO
December 2010

iv
Acknowledgements
I would like to thank Dr. Vinod Kumar, director of the Multiphysics Multiscale Computational
modeling lab, for giving me the opportunity to perform this research and for the assistance he provided
throughout my graduate studies. Dr. Kumar was always available to provide insight and advice for this
project. He has been there for me as a good friend who was with me most of the time while I was
working on the project. He has taken the effort to understand my problems and support me, and to bring
the best in me. I would also like to thank my other committee members, Dr. Ramana chintalapalle and
Dr. Leticia Velazquez for their assistance during the writing of this thesis.
I extend my gratitude to Dr. Chris Harris, MA, DPHIL (Oxon) the participating member of the
project. Any amount of gratitude expressed to him will remain insufficient.
Several other people in the department deserve recognition. I would like to thank Fan Chen and
Kiran Kumar, my fellow co-workers at the laboratory for their invaluable assistance throughout the
length of the project.
Finally, I would like to thank my family for their support during my graduate studies, especially
my parents, who have made my education a high priority from the beginning. Without them, I would not
be where I am today.
This thesis was submitted to the supervising committee on December 2010.
v
Abstract
With an alarming rise in carbon dioxide (CO2) emission from anthropogenic sources, CO2
sequestration has become an attractive choice to mitigate the emission. Some popular storage media for
CO2 are oil reservoirs, deep coal-bed, deep oceanic-beds. These have been used for the long term CO2
storage. Due to special lowering viscosity and surface tension property of CO2, it has been widely used
for enhanced oil recovery. The sites for CO2 sequestration or enhanced oil recovery mostly consist of
porous rocks. In this thesis work, I focus on understanding the flow through porous at pore-level using
variational approach.
Variational approach is a method to approximate analytical expressions for computing flow
conductance through various cross section pores. Variational method approach is a skillful technique
enabling us to account for the physical processes developed at the pore scale. Here, I focus on triangular
and circular cross section pores because theoretical expressions for these two geometries are possible.
The variational approach allows an extension at the fluid to fluid interface concerning simple free-slip or
no-slip boundary conditions that can minimize the computational efforts. The approach also allows us to
study non-Newtonian fluid flows.
In this thesis, I developed a single-phase flow conductance model for the triangular and circular
cross-section of a pore and validated variational results against theoretical and empirical formulations
for both Newtonian and non-Newtonian flows. I observe that variational formulations gives very
accurate results, provides an alternative to, if available, theoretical solutions and hence can be extended
to study real life applications.
vi
Table of Contents
Acknowledgements ................................................................................................. iv
Abstract .................................................................................................................... v
Table of Contents .................................................................................................... vi
List of Figures ...................................................................................................... viii
Chapter 1: Introduction ............................................................................................ 1
Chapter 2: Literature review .................................................................................... 8
Chapter 3: Methodology and Procedure ................................................................ 21
3.1 Introduction ............................................................................................. 21
3.2 Navier- Stokes equations ........................................................................ 21
Mass Continuity Equation ................................................................... 23
Momentum Equation ........................................................................... 23
3.3 Flow through porous media .................................................................... 25
3.5 Variational Method ................................................................................. 27
3.6 Newtonian Flow ...................................................................................... 29
3.7 Non- Newtonian Flow ............................................................................ 31
Case 1: ................................................................................................. 32
Case 2: ................................................................................................. 32
Variational Approach for Non- Newtonian Flow: ............................... 33
3.9 Summary ................................................................................................. 34
Chapter 4: Results and Discussions ....................................................................... 36
4.1 Introduction ............................................................................................. 36
4.2 Newtonian Flow in Straight triangular duct ........................................... 36
4.3 Newtonian Flow in Circular duct ........................................................... 38
4.4 Non-Newtonian Flow in Circular duct ................................................... 39
Chapter 5: Conclusions and Future work .............................................................. 41
5.1 Conclusions............................................................................................. 41
5.2 Future Work ............................................................................................ 41

vii
BIBLIOGRAPHY 43
Appendix ................................................................................................................ 46
Curriculum vita ...................................................................................................... 52
viii
List of Figures
Figure 1.1 Breakdown of sources of CO2 emissions in the U.S. in 2006. .................................................. 2 Figure 3.1 (a) Porous rock sample (sandstone). (b) Micro-CT image of the cross section. (c) 3-Dmodel
to represent the rock model. (d) Pore network construction. (Images source:Numerical Rocks) ............ 25
Figure 3.2 Two phase description ............................................................................................................. 28 Figure 4.1 Velocity profile through triangular duct (isosceles triangle) for various aspect ratios. .......... 37
Figure 4.2 Ratio of to for a range of values of around the equilateral triangle value . . 37 Figure 4.3 Velocity profile through circular cross- section as computed from the variational principles.
................................................................................................................................................................... 38
Figure 4.4 Comparison of error in flux (in %) with one parameter and two parameter, where a is the
radius and is the outer radius. ............................................................................................................... 39 Figure 4.5 Comparison of solutions from exact and variational method for a Non-Newtonian case in a
circular duct. Here „w‟ is non- dimensionalized with .............................................................. 39 Figure 4.6 Error in flux (in %) for Non-Newtonian flow in a circular duct. ............................................ 40
Figure 4.7 Velocity profile through circular cross- section as computed from the variational principles
when µ is not a constant (Non-Newtonian fluid). ..................................................................................... 40
1
Chapter 1: Introduction
Global warming is a well identified phenomenon for the rise in the average temperature
of the planet. Greenhouse gases are the main contributors to the increase in the average
temperature. Amongst all the greenhouse gases carbon dioxide (CO2) is the most common and
principal agent of causing the global warming effect. CO2 is one of the critical greenhouse gases
and hence one of main source for global warming (Keeling & Whorf, 1998; Metz, Davidson,
Coninck, Loos, & Meyer, 2005). Its enormous emission into the atmosphere results in a series of
global problems such as warming of the climate. The state of Texas emits more CO2 than any
other state in the U.S (Brenstein, 2008). A large fraction of emissions are from industrial usage
such as transportations and power-plants. A large CO2 presence in atmosphere as a result of
excessive coal-burning for example can cause acid rain and hence deforestation (Metz,
Davidson, Coninck, Loos, & Meyer, 2005). It is believed that the unprecedented amount of
human CO2 emission is directly responsible for the alarming increase in ice-cap melting,
dangerous hurricanes, and unpredictable changes in climatic patterns, resulting in drought and
flooding. The state of Texas has vast coal resources which constitute one of the largest sources
of generating power in the Gulf coastal region. The U.S. also has a large reserve of coal which
would help the nation to reducing its dependence on foreign fossil fuel (Petroleum, june 2007).
CO2 emissions have been on an upward trend in the early years of the 21st century. Fossil
fuels are the dominant form of energy utilized in the world (86%) and account for about 75% of
2
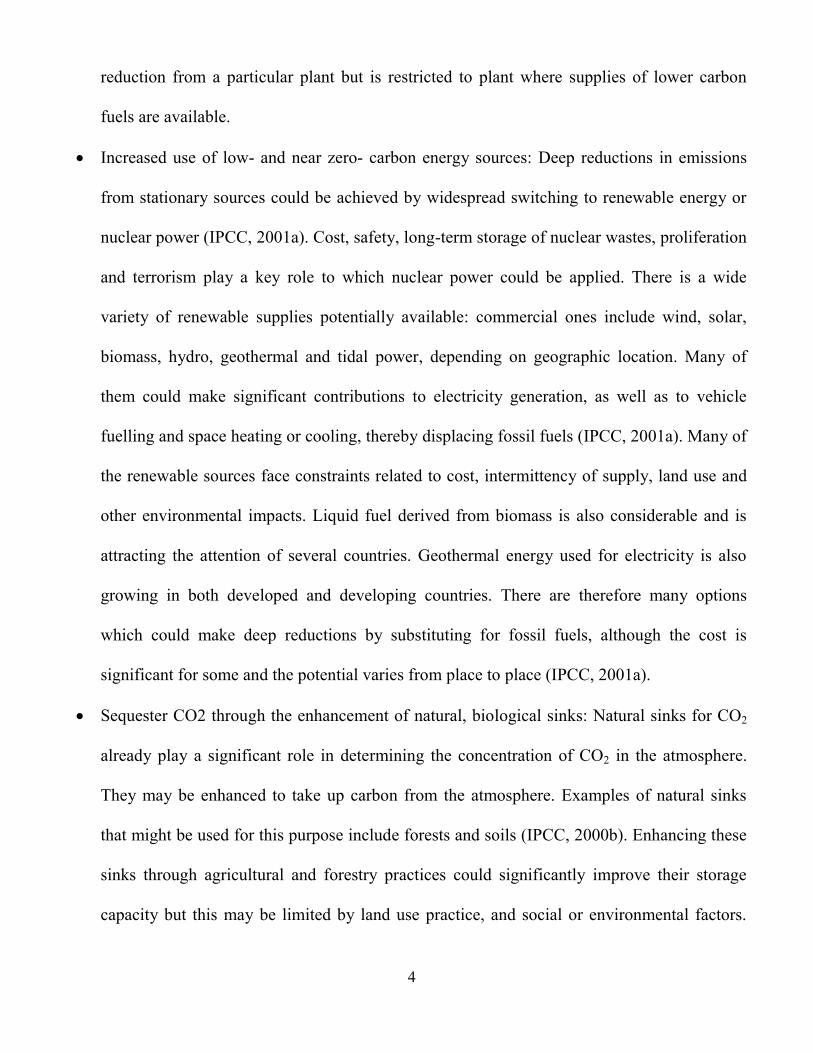
current anthropogenic CO2 emissions (houghton, et al., 2001c). Keeping in account of the recent
trends in CO2 emissions, it is absolutely necessary in control CO2 emissions to the atmosphere.
The figure below shows the breakdown of sources of CO2 emissions in the U.S. in 2006.
Figure 1.1 Breakdown of sources of CO2 emissions in the U.S. in 2006.
Source: epa.gov
The International Panel for Climate Change (IPCC) has made an effort to identify future
GHG emission pathways. Using several assumptions, the IPCC built a set of scenarios of what
might happen to emissions up to the year 2100. Six groups of scenarios were published (IPCC,
2000a): the „SRES scenarios‟. SRES is nothing but Special Report on Emissions scenario. None
of these assume any specific climate policy initiatives; in other words, they are base cases which

3
can be used for considering the effects of mitigation options. An illustrative scenario was chosen
for each of the groups. The six groups were organized into four “families” covering a wide
range of key “future” characteristics such as demographic change, economic development, and
technological change (IPCC, 2000a). However, “The possibility that any single emissions path
will occur as described in scenarios is highly uncertain” (IPCC, 2000a).
Given the role played by fossil fuels in supplying energy to modern society, and the long
periods of time involved in changing energy systems (Marchetti and Nakicenovic, 1979), the
continued use of fossil fuels is arguably a good base-case scenario. Most of these scenarios yield
future emissions which are significantly higher than today‟s levels. In 2100, these scenarios
show, on average, between 50% and 250% as much annual CO2 emissions as current rates.
Adding together all of the CO2 emissions projected for the 21st century, the cumulative totals lie
in the range of 3,480 to 8,050 GtCO2 (950 to 2,200 GtCO2) depending on the selected scenario
(IPCC, 2001e).Furthermore, let‟s look into the options we have to mitigate the climate change.
Improve energy efficiency: Reduction in fossil fuel consumption can be achieved by
improving the efficiency of energy conversion, transport and end-use, including enhancing
less energy-intensive economic activities. Energy conversion efficiencies need to be
increased in the production of electricity.
Switch to less carbon intensive fossil fuels: Switching from high-carbon to low-carbon fuels
can be cost effective today where suitable supplies of natural gas are available. With the
introduction of the combined production of heat, cooling and electric power, the reduction in
emissions would be even greater. This would make a substantial contribution to emissions
4
reduction from a particular plant but is restricted to plant where supplies of lower carbon
fuels are available.
Increased use of low- and near zero- carbon energy sources: Deep reductions in emissions
from stationary sources could be achieved by widespread switching to renewable energy or
nuclear power (IPCC, 2001a). Cost, safety, long-term storage of nuclear wastes, proliferation
and terrorism play a key role to which nuclear power could be applied. There is a wide
variety of renewable supplies potentially available: commercial ones include wind, solar,
biomass, hydro, geothermal and tidal power, depending on geographic location. Many of
them could make significant contributions to electricity generation, as well as to vehicle
fuelling and space heating or cooling, thereby displacing fossil fuels (IPCC, 2001a). Many of
the renewable sources face constraints related to cost, intermittency of supply, land use and
other environmental impacts. Liquid fuel derived from biomass is also considerable and is
attracting the attention of several countries. Geothermal energy used for electricity is also
growing in both developed and developing countries. There are therefore many options
which could make deep reductions by substituting for fossil fuels, although the cost is
significant for some and the potential varies from place to place (IPCC, 2001a).
Sequester CO2 through the enhancement of natural, biological sinks: Natural sinks for CO2
already play a significant role in determining the concentration of CO2 in the atmosphere.
They may be enhanced to take up carbon from the atmosphere. Examples of natural sinks
that might be used for this purpose include forests and soils (IPCC, 2000b). Enhancing these
sinks through agricultural and forestry practices could significantly improve their storage
capacity but this may be limited by land use practice, and social or environmental factors.
5
Carbon stored biologically already includes large quantities of emitted CO2 but storage may
not be permanent.
The Third Assessment Report by IPCC found that the option for reducing emissions with
most potential in the short term (up to 2020) was energy efficiency improvement while the near-
term potential for CO2 capture and storage was considered modest. Nevertheless, faced with the
longer-term climate challenge and in view of the growing interest in this option, it has become
important to analyze the potential of this technology in more depth.
As a result of the 2002 IPCC workshop on CO2 capture and storage (IPCC, 2002), it is
now recognized that the amount of CO2 emissions which could potentially be captured and
stored may be higher than the value given in the Third Assessment Report. Indeed, the
emissions reduction may be very significant compared with the values quoted above for the
period after 2020. Global climate change has been an important concern due to the buildup of
CO2 (up to two-thirds of the total effect on climate change) and other greenhouse gases into the
Earth‟s atmosphere. There are two main channels through which CO2 can be removed from the
atmosphere.
1. Direct sequestration and
2. Indirect sequestration.
Direct capture and sequestration involves capturing CO2 at a source before it can be
emitted to the atmosphere and sequestering it. An example is the capture of CO2 from power
plants and storing it in the underground reservoirs or in the deep ocean. The ocean already
contains an estimated 40,000 GtC (billion tonnes of carbon) compared with 750 GtC in the
atmosphere and 2,200 GtC in the terrestrial biosphere (Herzog, Caldeira, & Adams, 2005). The
6
most efficient concept would use specialized equipment to capture CO2 at large stationary
sources like factories or power plants and then inject the CO2 into secure storage zones deep
underground (geologic sequestration) or into the deep ocean.
Indirect sequestration, also known as terrestrial sequestration, does not require the CO2 to
be concentrated into a stream prior to removing it from the atmosphere. With indirect
sequestration practices, CO2 can be sequestered “indirectly” by transferring it to the marine or
terrestrial biosphere. The practices uses land management practices that boost the ability of
natural CO2 sinks like plants and soils to remove carbon as CO2 from the atmosphere, regardless
of its source. Opportunities for indirect sequestration can be found in forests, grasslands,
wetlands, and croplands. Indirect sequestration techniques are expected to provide less
permanent carbon storage than when compared to direct sequestration, in the order of decades or
at most centuries. This is because of the relatively rapid turnover time of the systems.
The subsequent material of this thesis is divided into the following chapters.
In chapter 2, we provide a literature review on what is carbon capture and storage, CO2
sequestration, the current status of the technology and what are the various types of
sequestration technologies available now?, like geological sequestration, CO2 storage in oil and
gas reservoirs, sequestration in saline formations and underground coal gasification.
In chapter 3, we talk about what pore and porous media is. We discuss about the flow
through the porous media given by the Darcy‟s equation. We explain the differences and
difficulties encountered when modeling flow through a porous media when the fluid is Non-
Newtonian. We then explain the methodology starting with the Navier-Stokes equation, the laws
7
of conservation of mass and continuity, the conditions assumed and the variational method used
in our work.
In chapter 4, we put forward the results with single phase flow in a straight triangular
duct and a single phase flow in circular duct and single phase flow in a circular duct when the
fluid is a Non-Newtonian fluid. We calculate the empirical flow conductance and the flow
conductance when variational method is used and validate the results with each other in every
case. The velocity profiles for each of the cases are also given.
In chapter 5, we discuss the summary, conclusions of our thesis and the future
recommendations and direction of the research.
8
Chapter 2: Literature review
Fossil fuels such as petroleum, natural gas, and coal, supply most of the energy around
the globe. They currently account to over 85% of the world‟s energy needs and will remain in
abundant supply well into the 21st century (Herzog H. J., 1999). The high standards of living and
the luxuries currently enjoyed by the industrialized world are due to the role played by fossil
fuels. In spite all the goodies from fossil fuels, their future is not safe because of the economic
and environmental threat they possess towards climate change. From those energy sources, coal
is a compact stratified mass of metamorphosed plant that has, in part, undergone arrested decay
to different extents of completeness. It originates from the arrested decay of the remains of trees,
bushes, ferns, mosses, vines, and other forms of plant life that flourished in huge swamps and
bogs millions of years ago during prolonged periods of humid, tropical climate, and abundant
rainfall (Hendricks & al, 1945, 1984). It is the most abundant, cheaper, and the largest source of
energy for the generation of electricity worldwide, however it is as well as one of the largest
worldwide anthropogenic sources of CO2 emissions. The emissions of NOx, SO2, unburned
hydrocarbons, and particulates have been controlled by extracting energy from fossil fuels in an
environmentally friendly way. Efforts to mitigate the greenhouse gas problem have traditionally
focused on avoiding the production of CO2 by reducing fossil fuel use (typically referred to as
“CO2 abatement”) (Nordhaus, 1992). One alternative to CO2 abatement would be to capture CO2
emissions and sequester them in carbon reservoirs such as deep aquifers, deep oceans, or
minerals (Lackner, Wendt, Butt, Joyce, & Sharp, 1995) (Herzog & Drake, 1996) (Hoffert,
2002).To sequester the CO2 is to prevent it from entering to the atmosphere. CO2 Sequestration
9
proposes to stabilize the CO2 concentration emitted to the atmosphere by relocating it by some
special techniques.
One of the ways to reduce CO2 emission to atmosphere is to sequester CO2 and inject it
underground in coal-bed enhancing the residual methane production (White, Straeisar, Granite,
Hoffman, & Pennline, 2003; Liu & Smirnov, 2007; Dooley, Dahowski, Davidson, Bachu,
Gupta, & Gale, 2004). CO2 capture and storage involves capturing the CO2 arising from the
combustion of fossil fuels, as in power generation, or from the preparation of fossil fuels, as in
natural-gas processing. It can also be applied to the combustion of biomass-based fuels and in
certain industrial processes, such as the production of hydrogen, ammonia, iron and steel, or
cement. Capturing CO2 involves separating the CO2 from some other gases. The CO2 must then
be transported to a storage site where it will be stored away from the atmosphere for a very long
time (Metz, Davidson, Swart, & pan, 2001a). In order to have a significant effect on atmospheric
concentrations of CO2, storage reservoirs would have to be large relative to annual emissions.
Carbon capture and storage as a whole can be explained as follows
Sources of CO2 and technologies for capturing CO2;
Transport of CO2 from capture to storage;
CO2 storage options;
Geographical potential of the technology;
Possibility of re-using captured CO2 in industrial applications;
Costs and energy efficiency of capturing and storing CO2 in comparison with other
large-scale mitigation options;
10
Implications of large-scale introduction, the environmental impact, as well as risks
and risk management during capture, transport and storage;
Permanence and safety of CO2 storage, including methods of monitoring CO2
storage;
Barriers to the implementation of storage, and the modeling of CO2 capture and
storage in energy and climate models;
Implications for national and international emission inventories, legal aspects and
technology transfer.
Large scale industries and power plants are the primary sources for capture and
separation. CO2 capture is necessary in order to produce a stream of high pressure CO2 which is
readily transported to a storage site. Even low concentrated CO2 streams can be transported,
with costs and other economic reasons in mind, a high concentrated CO2 at high pressure is
desired. Hence, it is important to produce a nearly pure CO2 stream for transport and storage.
There are quite a few applications that separate CO2 in large industrial plants including natural
gas treatment plants and ammonia production facilities which are already in operation today.
One of the current technologies includes the removal of CO2 to purify other industrial gas
streams. Typically the separated CO2 is emitted to the atmosphere. Depending on the power
plant application or the process involved there are three main technologies employed to capture
CO2 generated from the burning of fossil fuels which include coal, oil, natural gas, biomass, or
mixture of any of these fuels.
Geological storage of CO2 has as an objective to remove the CO2 from the combustion
by-products and accumulate it at a stable geological reservoir other than the atmosphere. In this
11
type of sequestration, CO2 may be transformed into other compounds that are more stable, such
transformation is due to the interaction of CO2 with other minerals found in the geologic
reservoir. However, geologically sequestered CO2 may leak from the underground reservoir but,
as long as the leakage rate is minimized, large amounts of CO2 can be sequestered without
representing a potential threat to the ecosystem surrounding the reservoir.
To remove the CO2, the processes taking place rely on two types of separation:
Absorption is a process by which the compound whose removal is desired is incorporated
to the mass of the absorbing agent. It is the process in which atoms, molecules, or ions
enter some bulk phase- can be gas, liquid or solid material.
Adsorption is a process by which the compound is only attached to the surface of the
solid or liquid agent. It is the process in which there is an attraction of atoms or molecules
from an adjacent gas or liquid to an exposed solid surface.
Geological storage of CO2 includes oil and gas reservoirs, un-mineable coal seams, and
deep saline reservoirs. These are structures that have stored crude oil, natural gas, brine and
CO2 over millions of years. Many power plants and other large emitters of CO2 are located near
geologic formations that are amenable to CO2 storage. Further, in many cases, injection of CO2
into a geologic formation can enhance the recovery of hydrocarbons, providing value-added
byproducts that can offset the cost of CO2 capture and sequestration. For the purpose of
research, the geological processes attractive to study are the Oil and Gas Reservoirs, Saline
Formations and Underground Coal Gasification. In some cases, production from an oil or
natural gas reservoir can be enhanced by pumping CO2 gas into the reservoir to push out the
product. This is called enhanced oil recovery. The United States is the world leader in enhanced
12
oil recovery technology, using about 32 million tons of CO2 per year for this purpose (U.S
Department of Energy). In an enhanced oil recovery application, the integrity of the CO2 that
remains in the reservoir is well-understood and very high, as long as the original pressure of the
reservoir is not exceeded.
Sequestration of CO2 in deep saline formations does not produce value-added by-
products, but it has other advantages. First, the estimated carbon storage capacity of saline
formations in the United States is large, making them a viable long-term solution. It has been
estimated that deep saline formations in the United States could potentially store up to 500
billion tons of CO2 (U.S Department of Energy). Second, most existing large CO2 point sources
are within easy access to a saline formation injection point and, therefore, sequestration in saline
formations is compatible with a strategy of transforming large portions of the existing U.S.
energy and industrial assets to near-zero carbon emissions via low-cost carbon sequestration
retrofits. Assuring the environmental acceptability and safety of CO2 storage in saline
formations is a key component of this program element. Determining that CO2 will not escape
from formations and either migrate up to the earth‟s surface or contaminate drinking water
supplies is a key aspect of sequestration research. Although much work is needed to better
understand and characterize sequestration of CO2 in deep saline formations, a significant
baseline of information and experience exists. For example, as part of enhanced oil recovery
operations, the oil industry routinely injects brines from the recovered oil into saline reservoirs,
and the U.S. Environmental Protection Agency (EPA) has permitted some hazardous waste
disposal sites that inject liquid wastes into deep saline formations.
13
Underground Coal Gasification is a process in which the coal is gasified in the un-mined
coal seams by drilling deep underground wells and executing the combustion and gasification
reactions in there. By doing that, the quantities of commercial gas produced could be utilized as
a source of power generation and as chemical feedstock. The UCG system is a more
environment-friendly process, meaning that the emissions of sulfur, nitrous oxides, and mercury
are more controlled than in the regular system. In addition, this method can represent an increase
of the coal resources, due to the fact that deep coal seams that were not mineable before can now
be exploited. Moreover, by using this technique, once a cavity is formed, CO2 could be pumped
back which would represent an innovative idea for CO2 storage.
UCG basically consists of various parts. First, a well has to be drilled into the coal seam.
Once the seam is reached, air or oxygen is injected. On the other side, another well is drilled to
position a pipe through which the gases produced in the process are to be extracted. The coal
then is burned from the first well. The reaction between coal, oxygen, and water generates CO2,
CH4, CO, H2, N2, and other gases. Once the coal is totally consumed, they restart the whole
process again. By doing this process over and over, cavities are formed underground, which
could represent a good site to test the CO2 sequestration process. According to the data
presented in the articles, the UCG technique has been tested in different countries since the
1930s when it was recognized as a viable method of coal power-generation. Different trials have
been run in China, U.S, Russia (and former Soviet Union), Australia, and Europe. Nowadays,
China has the biggest UCG program running with 16 trials developed since the late 1980‟s.
However, Australia, with the Chinchilla Project, has run the largest UCG project. In regards to
the coal composition, it must consist of a total ash content of less than 60% and the seam has to

14
be continuous with minimum discontinuities. From the environmental perspective, it is
recommended that aquifers are not located nearby to avoid any type of water contamination. As
seen the UCG is a well-researched process and has been around for some decades, but it has not
been commercialized in large scale. However, the CO2 sequestration from this process is
relatively new and in the process of developing. At the present moment, a set of protocols have
not been developed yet and, the ones that have been developed, have not received a widespread
acceptance due to the doubtful arguments such protocols generate.
Talking about the general process of CO2 sequestration, there are some basic steps to
follow in order to achieve the CO2 storage. First, CO2 would have to be separated from the other
gases, with a minimum of 95% CO2 purity. This could be achieved by using the Selexol or
Rectisol processes. It is important to point out that if oxygen is used to separate the CO2,
separation is easy, but oxygen is expensive. Once it is separated, the CO2 can be stored, and
storing it requires more advanced techniques that, nowadays, are still in development.
According to the articles mentioned, in order to understand the operational concerns of the CO2
storage more technical knowledge is needed which is why an accelerated research program is
needed to provide new innovative ways of storing CO2 with a high rate of success. Of course,
there are many constraints about the “how” of the CO2 sequestration process. Some of them are:
Temperature and Pressure constraints, Geo-mechanical response, Ground –water displacement
risk, Geochemical Response, and CO2 fate.
Some key points about Underground Coal Gasification are as follows:

15
To avoid leakage volume flow, the CO2 sealing pressure of the cap rock should be
considered as a basic constraint in designing and implementing CO2 storage injection
such that the cap rock will never be broken through by the injected CO2.
The leakage of CO2 through cap rock by molecular diffusion is negligible during the
short-term injection stage.
Investigations should focus on the cap rock property changes due to the mineralogical
reactions caused by the diffused CO2 in the long-term containment.
According to studies, the storage capacity for a given reservoir shows that once the
reservoir pressure reaches a certain high level, a continuous increase in pressure alone is
not effective in enhancing the storage capacity
The Underground Coal Gasification process represents an effective way of coal power-
generation. This process eliminates conventional coal mining. By doing so, the operating costs,
surface damage, and mine safety concerns are greatly improved. Also, it increases the coal
resources of the country due to the increase of minable deep seams with this process. It is an
environment friendly process if done it correctly because no coal is transported to the surface,
the ash stays underground, some of the gas contaminants are not produced, more energy for
mining is saved, and it could lead to the generation of a well develop protocol for CO2
sequestration. CO2 sequestration is crucial for making fossil fuel use sustainable over the long
term. It represents a realistic method of preventing CO2 to be emitted to the atmosphere.
Geological sequestration in saline aquifers may develop to enlarge the volume of CO2
being stored. It is important to mention again, that the CO2 sequestration process following the
UCG technique is relatively new and more research and information needs to be performed in

16
order to attain a well-founded base to develop a standard protocol satisfying all the constraints
and requirements previously presented.
For all sequestration techniques, there is no accurate method to measure how much CO2
can be stored and what consequences it will bring in the long run. Once sequestration is put into
action, research is needed to help determine which methods are the most secure and effective
techniques to prevent the CO2 to reach the atmosphere. The three technologies will be discussed
in the following section.
There are different types of CO2 capture systems: post combustion, pre-combustion and
oxyfuel combustion. The important factors that decide on selecting the capture system are:
The concentration of CO2 in the gas stream
The pressure of the gas stream
The fuel type (solid or gas).
Post-combustion capture of CO2 in power plants is economically feasible under specific
conditions. This means that the technology is well understood and is applied in selected
commercial applications. In this system, CO2 is separated from the flue gases produced by the
combustion of the primary fuel in air. The percentage of CO2 captured is typically 3 to 15
percent by volume. They use a liquid solvent to capture the CO2. Monoethanolamine (MEA) is
the typically employed organic solvent in today‟s coal power plant or a natural gas combined
cycle (NGCC) power plant.
Pre-combustion capture is widely applied in fertilizer manufacturing and in hydrogen
production. Although the initial fuel conversion steps of pre-combustion are more elaborate and
costly, the higher concentrations of CO2 in the gas stream and the higher pressure make the
17
separation easier. These systems process the primary fuel in a reactor with steam and air or
oxygen to produce a mixture consisting mainly of carbon monoxide and hydrogen (synthesis
gas). A second reactor known as a shift reactor is employed to react with the carbon monoxide
with steam to produce hydrogen along with CO2. The resulting mixture is then separated to
produce different streams of hydrogen and CO2. Once the CO2 is stored, the hydrogen is a
carbon free energy carrier that can be combusted to generate power and/or heat. The CO2
produced in the shift reactor is typically of the order 15 to 60 percent by volume. Thus this
process is more feasible even though the initial fuel conversion methods are more elaborate and
more expensive than in a post combustion process. This process is used in power plants that
employ integrated gasification combined cycle (IGCC) technology.
Oxyfuel combustion systems use oxygen instead of air for the combustion of the primary
fuel in order to produce a flue gas which is mainly water vapor and CO2. The result is a flue gas
with high concentrations of CO2. The amount of CO2 is typically greater than 80% by volume.
The gas stream is then cooled and compressed to remove the water vapor. This results in high
CO2 concentrations in the gas streams and therefore, in easier separation of CO2 and in increased
energy requirements in the separation of oxygen from air. Oxy fuel combustion is still in the
demonstration phase.
There has been a lot of research going on this topic. There are several projects
undergoing to enhance methane production by sequestering CO2 underground. Bromhal and his
group at NETL studied the various issues associated with the CO2 sequestration such as effects
of sorption in coal-beds, cross-over from capillary figuring, spatial avalanches, and transient
analysis for measure permeability (Ferer, Bromhal, & Smith, 2004) (Bromhal, Sams, Jikich,

18
Ertekin, & Smith, 2005) (Ferer, Bromhal, & Smith, 2002) (Ferer, Bromhal, & Smith, 2003).
Melnichenko et al. and his group at ORNL used small angle neutron scattering (SANS) to
understand the pore-size specific details into the mechanisms of CO2 sorption in coals and to
characterize the density and volume of the sorbed CO2, factors that are key to determining the
efficacy of potential sequestration reservoirs (Melnichenko, Radlinski, Mastalerz, Cheng, &
Rupp, 2009; Melnichenko, Wignall, D.R., & Frielinghaus, 2006; Melnichenko, Wignall, D.R.,
& Frienlinghaus, 2004; Radlinski, et al., 2009). A feasibility of CO2 sequestration in deep
unminerable coalseams is presented in the report by Advanced Resources International (ARI), a
Department of Energy contractor, by performing detailed reservoir studies of two enhanced
coalbed methane recovery field projects in the San Juan basin (Dooley, Dahowski, Davidson,
Bachu, Gupta, & Gale, 2004; Smith & Reeves, 2002; Reeves, 2003). Pore network modeling of
a variety of transport processes in porous media originally cast great insight into the dynamics of
supercritical CO2 fluid or gaseous form, oil and water in reservoir pore spaces (Fatt, 1996; Ferer,
Bromhal, & Smith, 2003; Pan, Dalla, Franzosi, & Miller, 2007; Oleinikova & Brovchenko,
2008) and have seen resurgence in recent years. Examples of such processes for which the
details of the pore structure have a key impact are two-phase (Patzek, 2001; Knackstedt,
Sheppard, & Sahimi, 2001; Bravo, Araujo, & Lago, 2007; Stevenson, Bromhal, Ferer, Wilder,
& Smith, 2004) and three-phase (Piri & Blunt, 2005) flows, leading to relative permeability
relationships for input into reservoir simulators, non-Newtonian displacement processes (Lopez,
Valvatne, & Blunt, 2003; Stevensona, Ferer, Bromhal, Gump, Wilder, & Smith, 2006), such as
in polymer floods, and reactive transport (Dadvar & Sahimi, 2003; Thullner & Baveye, 2008), in
which chemical reactions occur at fluid-fluid and/or fluid-solid interfaces. An example of such
19
reactive transport is the conversion of sequestered carbon dioxide into carbonate (Li, Peters, &
Celia, 2006).
SRI International is an independent nonprofit research and development institute has been
awarded a $4.5M Department of Energy (DoE) project to evaluate the technical and economic
viability of carbon dioxide capture using an ammonium carbonate-ammonium bicarbonate (AC-
ABC) process at gasification plants, including integrated gasification combined cycle (IGCC)
power plants. This new project is one of several projects at SRI aimed at finding cost-effective
ways to recover carbon dioxide from power plants so it can be sequestered. Qatar shell,
collaborating with the department of earth science and engineering, Imperial College, London
have been widely involved in the various aspects of capturing and sequestering CO2. A few of
their research papers have been reviewed. The Energy Technologies Institute (ETI) has
launched a review of potential sites for storing carbon dioxide offshore. The United Kingdom
CO2 Storage Appraisal Project (UKSAP), costing more than £3.5 million, will help answer the
question of exactly how much storage capacity the UK has, enabling a better evaluation of the
extent and roll out of the country‟s carbon capture and storage (CCS) market. As we now
understand, carbon capture is a time consuming procedure. Energy efficiency and an increased
use of renewable energy sources still remain the best solutions for a short term. At the current
moment, the various elements of carbon capture and storage of CO2 have been well
demonstrated but bringing down the costs still remains a challenge. According to the European
commission, “CCS will only be deployed if the cost per tonne of CO2 avoided is lower than the
carbon price”.
20
In our work, we develop a single phase flow conductance model for various shapes which
include generalized triangular and circular geometries. We develop the model for a Newtonian
fluid and Non- Newtonian fluid. The differences between a Newtonian and a Non- Newtonian
fluid are explained in the following section. We then validate the results against analytical and
the empirical solutions. Using the variational method we consider two test functions to
approximate the velocity. The flow considered is continuous inside the pore geometry that
satisfies the no-slip boundary conditions. We work on deriving the formula for conductance
model for the triangular and the circular cross section pore duct in Non- Newtonian flows. The
derivation process has been described in chapter 3 which gives a detailed explanation on the
methodology and procedure used.

21
Chapter 3: Methodology and Procedure
3.1 INTRODUCTION
Fluid flow in circular and non-circular pipes is a common phenomenon. For example the
water flow in pipes is very common at homes. Examples of fluid flow are flow of river, flow of
air over an airplane etc. In the case of CO2 sequestration, the CO2 to be stored is in supercritical
state which is a liquid. The liquefied CO2 is injected into the oil fields. Here the CO2 flows
through the porous rock and is stored for the long term usage. Description about a pore and
porous media is discussed in the later section. Navier-Stokes equations are the generalized
equations that describe the motion of a fluid. The derivation of the Navier-Stokes equations is
discussed in the following section. We also explain why these equations are insufficient for
describing the motion of flow in our case. We then explain the variational method and its
advantages and how it is employed in our case.
3.2 NAVIER- STOKES EQUATIONS
The Navier-stokes equations describe the motion of a fluid. These equations are derived
from the Newton‟s second law of fluid motion assuming that the fluid stresses are the sum of the
viscous stresses and the pressure. A solution to the Navier-stokes equation gives us the velocity
of the fluid at a given point in space and time. The equations such as mass continuity are derived
from the laws of conservation of mass, momentum and energy.
The flow of fluid is governed by the conservation principles of mass, energy and linear
and angular momentum. These equations describe how the mass, energy and momentum of a
fluid change with respect to time and position. The continuity equation is a differential equation
22
which describes the transport of some kind of conserved quantity. This can be done using the
Reynolds transport theorem; an integral relation stating sum of changes of an intensive
property(L) over a control volume should be equal to what is lost or gained on the boundaries of
the volume and also what is created by sources inside the control volume. This is defined by the
following integral equation:
∫
∫
∫
(3.1)
Here
= flow velocity
L= intensive property
Q = sources in the fluid
Ω = control volume
= bounding surface
When divergence theorem is applied on the above surface integral it changes to a volume
integral
∫
∫
∫
(3.2)
Now upon applying Leibniz‟s rule to the integral, we obtain
∫
(3.3)
The integral should be zero for any control volume if and only if

23
(3.4)
Mass Continuity Equation
The general form of the mass continuity equation can be obtained from the above
equation taking L as density and putting Q as zero since there are no sources of mass. The mass
continuity equation can thus be defined as follows
(3.5)
Where = density of the fluid
= flow velocity
In an incompressible fluid, since is constant.
( ∇. v ) = 0 (3.6)
Momentum Equation
The Navier-stokes momentum equation can be described as
(3.7)
Here, substitute equation (3.6) into equation (3.7),
We get,
(3.8)
Where P is pressure.
Since density is constant, using eqn (3.6), we get
(3.9)
24
The equation (3.9) can be expanded in X, Y, Z directions as:
X- Component:
(
*
(
) (3.10)
Y- Component:
(
*
(
) (3.11)
Z- Component:
(
*
(
) (3.12)
Where
= flow velocity in X direction
= flow velocity in Y direction
= flow velocity in Z direction
The flow is assumed to be fully developed and only in Z direction which gives us the
following conditions:
(3.13)
Applying these conditions in equation (3.12), we arrive at
(
*
(
)
(3.14)
25
(
) (3.15)
Defining pressure drop per unit length,
= G
We get
(3.16)
3.3 FLOW THROUGH POROUS MEDIA
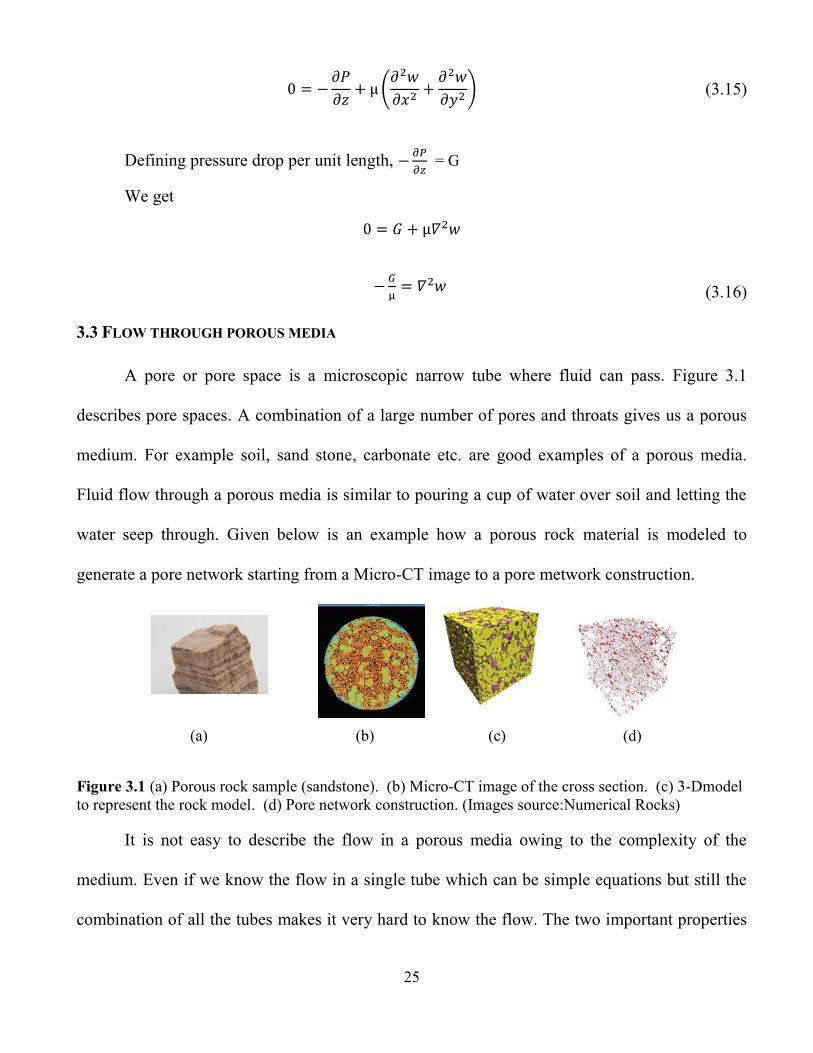
A pore or pore space is a microscopic narrow tube where fluid can pass. Figure 3.1
describes pore spaces. A combination of a large number of pores and throats gives us a porous
medium. For example soil, sand stone, carbonate etc. are good examples of a porous media.
Fluid flow through a porous media is similar to pouring a cup of water over soil and letting the
water seep through. Given below is an example how a porous rock material is modeled to
generate a pore network starting from a Micro-CT image to a pore metwork construction.
Figure 3.1 (a) Porous rock sample (sandstone). (b) Micro-CT image of the cross section. (c) 3-Dmodel
to represent the rock model. (d) Pore network construction. (Images source:Numerical Rocks)
It is not easy to describe the flow in a porous media owing to the complexity of the
medium. Even if we know the flow in a single tube which can be simple equations but still the
combination of all the tubes makes it very hard to know the flow. The two important properties
(a) (b) (c) (d)
26
describing the characteristics of a porous medium are porosity and the permeability. The
porosity is defined as the ratio of pore volume over the matrix volume. Pore volume is the total
volume of the pore spaces while the matrix volume is the total volume including the pore
spaces. Very often the porosity of the medium is assumed constant for the whole medium.
Permeability is the ability of the fluid to flow through the medium. Also often called absolute
permeability, it only depends on the geometry of the medium. Another important quantity is the
dynamic viscosity which characterizes the fluid flow in pore space. At microscopic level there is
an interchange of momentum in collisions between the molecules which cause the friction
forces. The viscosity of the fluid is nothing but the strength of the frictional forces.
The fluid flow in a porous medium is given by the Darcy equation.
(3.17)
Where U = Flow rate,
K = permeability,
= viscosity,
= pressure gradient,
= density of the fluid,
= acceleration due to the gravitational forces.
This equation has been very popular but it gets complicated and the number crunching
becomes huge when applied to a network of pores of different shapes. The variational method
presented in the following section provides a method of finding approximate solutions to the
variables. When compared to the traditional slip/ no-slip methods, the formulational and
computational efforts of variational approach would be much less. These variational techniques
appear to provide powerful means of finding approximate solutions over domains of known
27
simple shapes with predetermined boundary conditions. This methodology will now be used for
a variety of one and two dimensional problems.
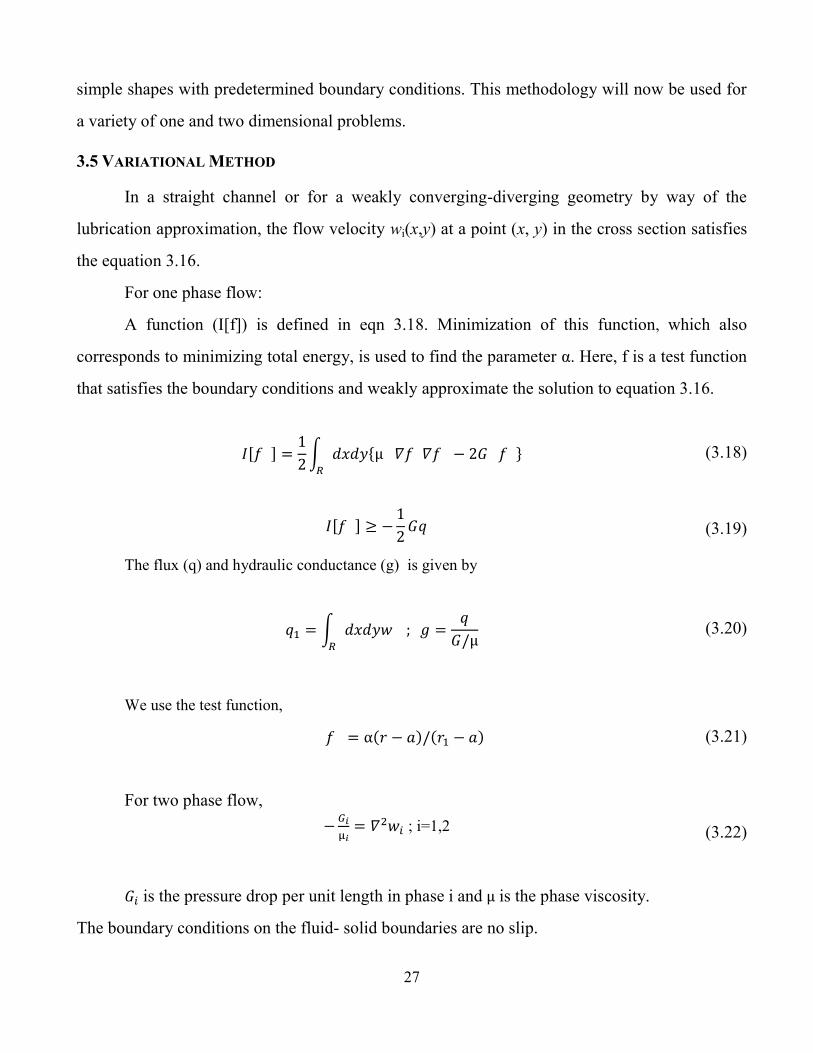
3.5 VARIATIONAL METHOD
In a straight channel or for a weakly converging-diverging geometry by way of the
lubrication approximation, the flow velocity wi(x,y) at a point (x, y) in the cross section satisfies
the equation 3.16.
For one phase flow:
A function (I[f]) is defined in eqn 3.18. Minimization of this function, which also
corresponds to minimizing total energy, is used to find the parameter α. Here, f is a test function
that satisfies the boundary conditions and weakly approximate the solution to equation 3.16.
[ ]
∫
(3.18)
[ ]
(3.19)
The flux (q) and hydraulic conductance (g) is given by
∫
(3.20)
We use the test function,
(3.21)
For two phase flow,
; i=1,2 (3.22)
is the pressure drop per unit length in phase i and is the phase viscosity.
The boundary conditions on the fluid- solid boundaries are no slip.
28
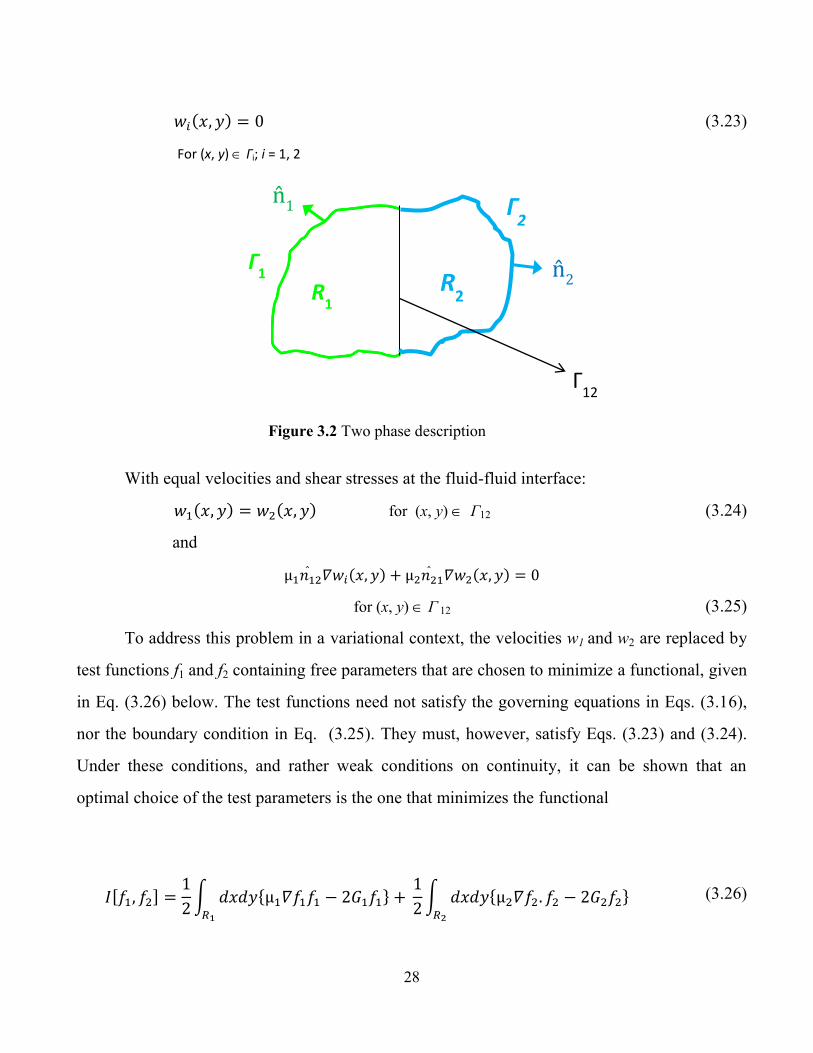
For (x, y) Γi; i = 1, 2
(3.23)
Figure 3.2 Two phase description
With equal velocities and shear stresses at the fluid-fluid interface:
for (x, y) Γ12 (3.24)
and
for (x, y) Γ 12 (3.25)
To address this problem in a variational context, the velocities w1 and w2 are replaced by
test functions f1 and f2 containing free parameters that are chosen to minimize a functional, given
in Eq. (3.26) below. The test functions need not satisfy the governing equations in Eqs. (3.16),
nor the boundary condition in Eq. (3.25). They must, however, satisfy Eqs. (3.23) and (3.24).
Under these conditions, and rather weak conditions on continuity, it can be shown that an
optimal choice of the test parameters is the one that minimizes the functional
[ ]
∫
∫
(3.26)
Γ1
R1
R2
Γ2
Γ12
n 2
n 1
29
The choice is optimal because it minimizes the viscous dissipation in the system within
the constraints of the actual functional forms deployed for f1 and f2 : the absolute minimum in
the dissipation is obtained when fi = wi. We have,
[ ]
(3.27)
where the phase fluxes are given by
Equality in Eq. (3.27) holds if and only if fi = wi.
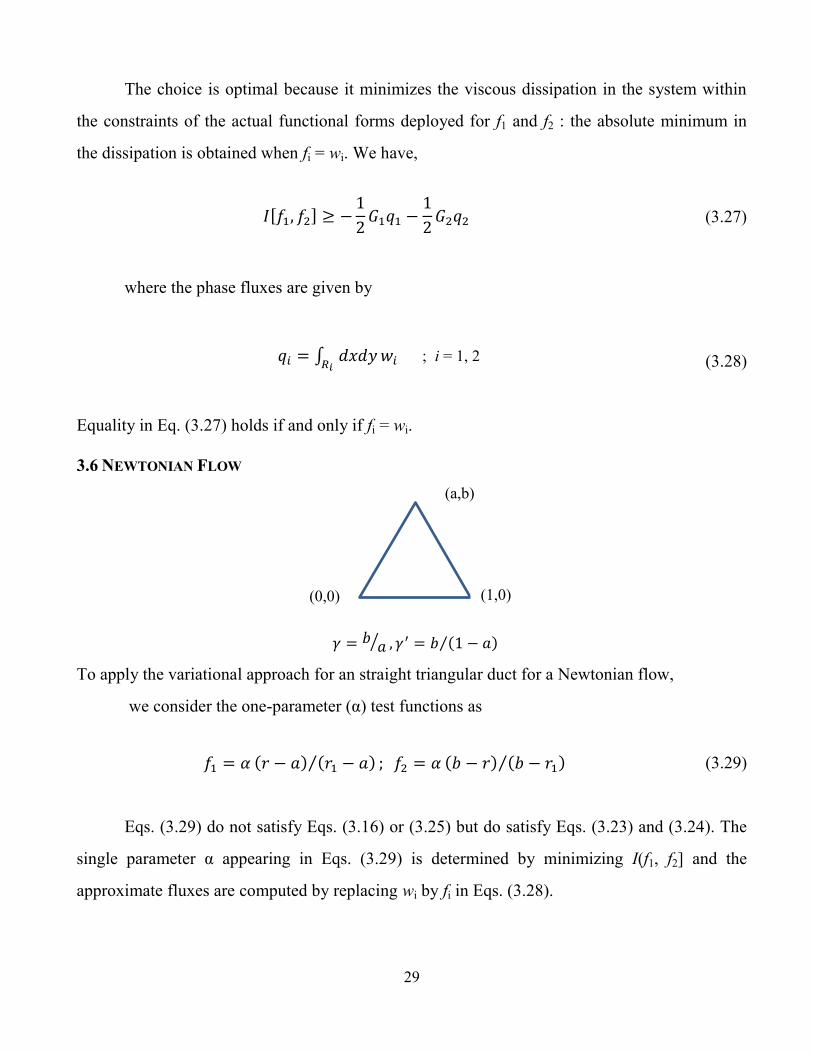
3.6 NEWTONIAN FLOW
⁄ ⁄
To apply the variational approach for an straight triangular duct for a Newtonian flow,
we consider the one-parameter (α) test functions as
Eqs. (3.29) do not satisfy Eqs. (3.16) or (3.25) but do satisfy Eqs. (3.23) and (3.24). The
single parameter α appearing in Eqs. (3.29) is determined by minimizing I(f1, f2] and the
approximate fluxes are computed by replacing wi by fi in Eqs. (3.28).
∫
; i = 1, 2
(3.28)
⁄ ⁄
(3.29)
(0,0) (1,0)
(a,b)
30
To validate, we consider the simple test function, f. Test function is given in the equation
3.30 and satisfies the boundary condition in eqn 3.23 as
(3.30)
Where = b/a, , and .
We consider an isosceles triangle cross section as we know the empirical results for this
geometry.
For an isosceles triangle, we get a=1/2 and .
After performing variational analysis for this case, we compute the formula for the
hydraulic conductance, g, which is given by
(3.31)
From the lubrication theory, the empirical formula for the hydraulic conductances given
by
( √ ) (3.32)
To validate we have considered a simple test function for f. one parameter (α) test
function, that satisfies the boundary condition in equation 3.23, is given in the eqn 3.33 as
(3.33)
And the two parameters (α, β) test function is given in eqn 3.34 as
31
[ ] (3.34)
Where , a < r < 1.
By solving the eqns 3.16 for circular cross-section , we calculated for the exact solution as
*
( ⁄ ) ( ⁄ )+ (3.35)
3.7 NON- NEWTONIAN FLOW
In the following case, we apply the variational method for a Non-Newtonian fluid. A
Non-Newtonian fluid is a fluid whose viscosity (µ) is not independent of shear rate or shear rate
history. For example, surfactant addition in CO2 flooding for enhanced oil recovery, polymer
solutions, blood, shampoo, ketchup, paint etc. The relation between shear stress and shear rate is
different and can be time dependent. Hence a constant coefficient of viscosity cannot be defined.
For a Non Newtonian fluid, the viscosity is not constant. To solve for this case we use the
power law for modeling viscosity. Power law is simple and one of the widely used Non-
Newtonian viscosity model that describes the flow for a Non-Newtonian fluid. For Non-
Newtonian flow, the Stokes equations (eqn 3.16) can be written as
(|
|*
(3.36)
(
)
, where C is the integrating constant (3.37)
Substituting the eqn (3.36) in the eqn (3.37) and solving, we get
(
(
*)
(3.38)
describes the velocity profile with w on the x- axis and the radius(r)on the y- axis.
Here we have 2 cases.

32
Case 1:
If dw/dr <0, we have
Applying this condition and assuming the necessary constants, we have
No- slip assumption at the wall (i.e. ) results in
Case 2:
If
Taking n= 0.5,
Substituting
in the power law we have,
Assuming the necessary constants and solving, we have
|
|
(3.39)
∫ ∫ (
) (
)
(3.41)
(
)
(3.40)
(
) ( (
*)
(3.42)
|
|
(
(
*)
(
(
*)
(3.43)
(
*
(3.44)
33
For the exact solution,
At the boundary,
At the interface the velocities are equal.
Applying this condition,
Assuming a= 0.1, and solving for ,
We get = 0.419
Variational Approach for Non- Newtonian Flow:
We consider a simple one parameter test function, f:
(3.50)
(
*
(
)
(3.45)
∫
(3.46)
(
) (
)
(3.47)
(3.48)
(
) ( (
*)
(
+ (
)
(3.49)
34
Integrating,
We now have the power law as,
∫ ∫
√| |
(3.55)
Considering taking n=0.5, we solve for c by minimizing eqn 3.55,
*
+
When a=0.1, c= 0.07
When a/r2 = 0.1, c= 0.7
We then plot the exact solution. The results are shown in the next chapter to follow.
3.9 SUMMARY
Experiments are being conducted to prevent the CO2 from entering the atmosphere. In the
endless quest for coming up with solutions from preventing global warming, CO2 sequestration
has been foreseen as a viable solution. The approach in our case is to understand the trapping
mechanism of carbon dioxide in pore networks of permeable rocks. It has been determined that
(3.51)
|
|
| |
(3.52)
( )
(3.53)
√| |
(3.54)
35
such approach would be ideal due to the complexity of the physics, migration and chemical
alterations of CO2 trapping meaning that CO2 sequestration would be feasible at a pore scale. In
order to approximate analytical expressions for pore network multiphase hydraulic conductances
with a complex variety of shapes for input into the pore network models, a variational approach
method was utilized. Using the variational approach method is a skillful technique that enables
us to account for the physical processes developed at the pore scale. It allows an extension at the
fluid to fluid interface concerning simple free-slip or no-slip boundary conditions. Such
extensions help us by minimizing the computational effort. Results from this work will provide
mechanical engineers with important data to enhance the further studies on pore scale network
modeling to sequester carbon dioxide.
36
Chapter 4: Results and Discussions
4.1 INTRODUCTION
In the following section, the results generated by Variational method mentioned in the
previous chapter are shown. The velocity profiles of different shapes i.e. triangular and circular
shapes are shown for Newtonian fluids. Using different aspect ratios for triangular pores
velocity profiles are produced. The ratio of computed and empirical hydraulic conductance is
shown for an equilateral triangular pore. Error in flux is calculated using one and two parameters
in the test function for a circular pore, using the computed and the empirical results the error is
calculated. The velocity profile of Non-Newtonian flow through circular pore is shown in
section 4.4 and also the error in flux are presented using Variational vs exact method.
4.2 NEWTONIAN FLOW IN STRAIGHT TRIANGULAR DUCT
The velocity profile for various aspect ratios is shown in the figure 4.1 and the ratio of
computed and empirical hydraulic conductance is plotted in figure 4.2. For a range of shapes
around an equilateral triangle, for which the two formulae coincide, the values are equal to the
analytical result.
37
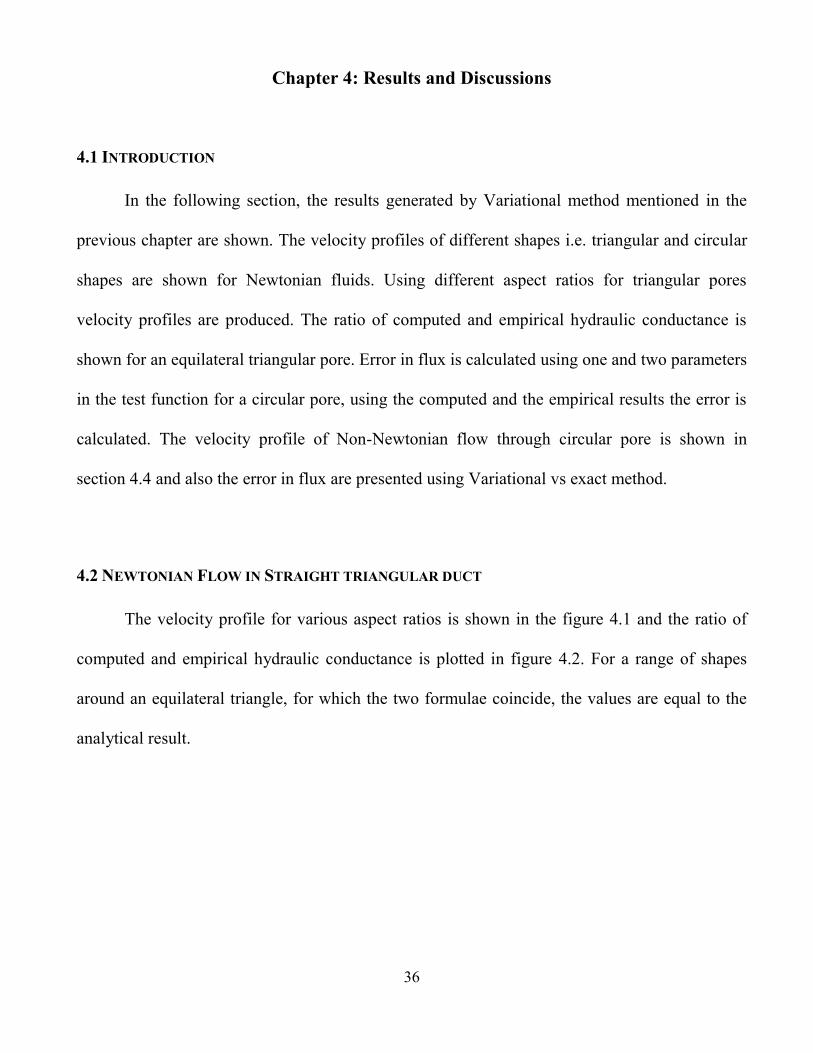
Figure 4.1 Velocity profile through triangular duct (isosceles triangle) for various aspect ratios.
Following is the graph showing a ratio of to for a range of values. We observe the
variational solution is exact at = √ .
Figure 4.2 Ratio of to for a range of values of around the equilateral triangle value √ .
1.73
β
g/gemp

38
4.3 NEWTONIAN FLOW IN CIRCULAR DUCT
In this section. We present results from variational analysis for single phase Newtonian
flow through circular ducts. Analytical solution is available for the circular ducts, so this case
provides a reliable verification and validation test case for the variational approach.
Velocity profile through the annulus section as predicted by the variational formulation
and relative error in flux is shown in the figure 4.3. It has been observed that even for the very
thin core (e.g. =0.2), the variational approach with both the one parameter (<5% error) and
the two parameters (<2% error) gives a very accurate prediction for the flux through the pore.
Figure 4.3 Velocity profile through circular cross- section as computed from the variational principles.
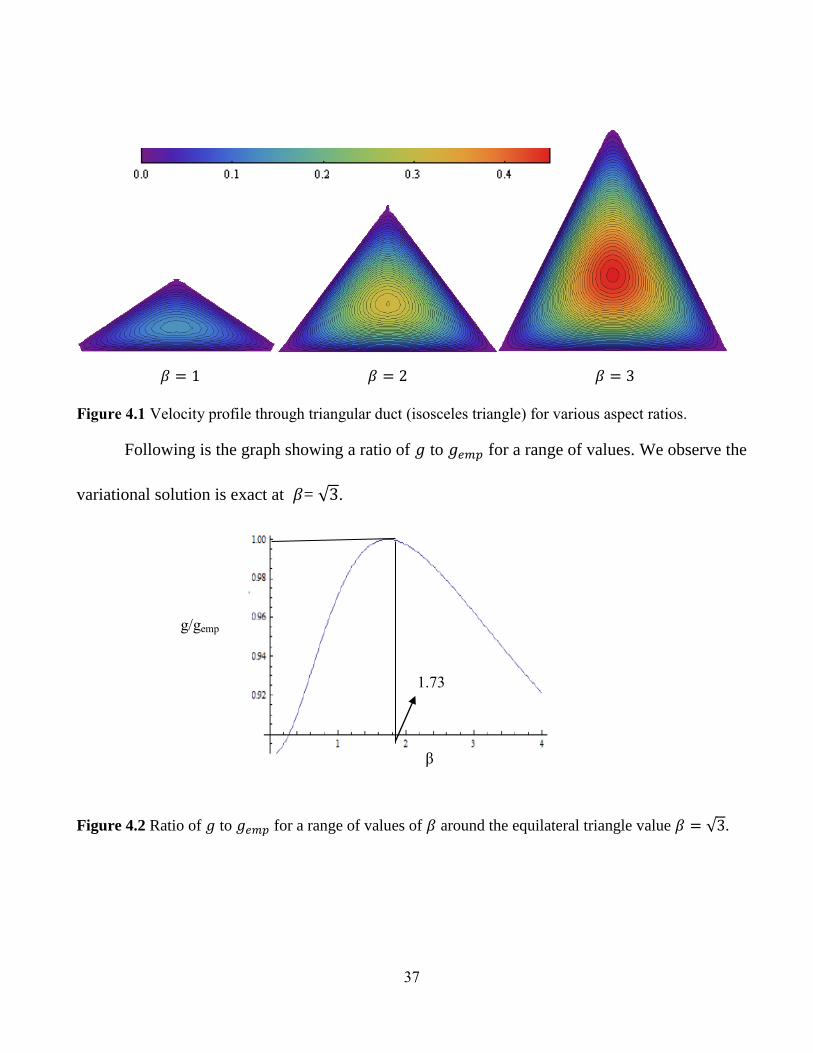
The figure 4.4 is the graph showing the comparison of error in flux (in %) with one
parameter and two parameter, where a is the inner radius of the core and is the outer radius.
39
Figure 4.4 Comparison of error in flux (in %) with one parameter and two parameter, where a is the
radius and is the outer radius.
4.4 NON-NEWTONIAN FLOW IN CIRCULAR DUCT
In the previous two cases, we assumed the viscosity to be constant. In other words, the
fluid considered is a Newtonian fluid. In this case the fluid is considered to be Non- Newtonian
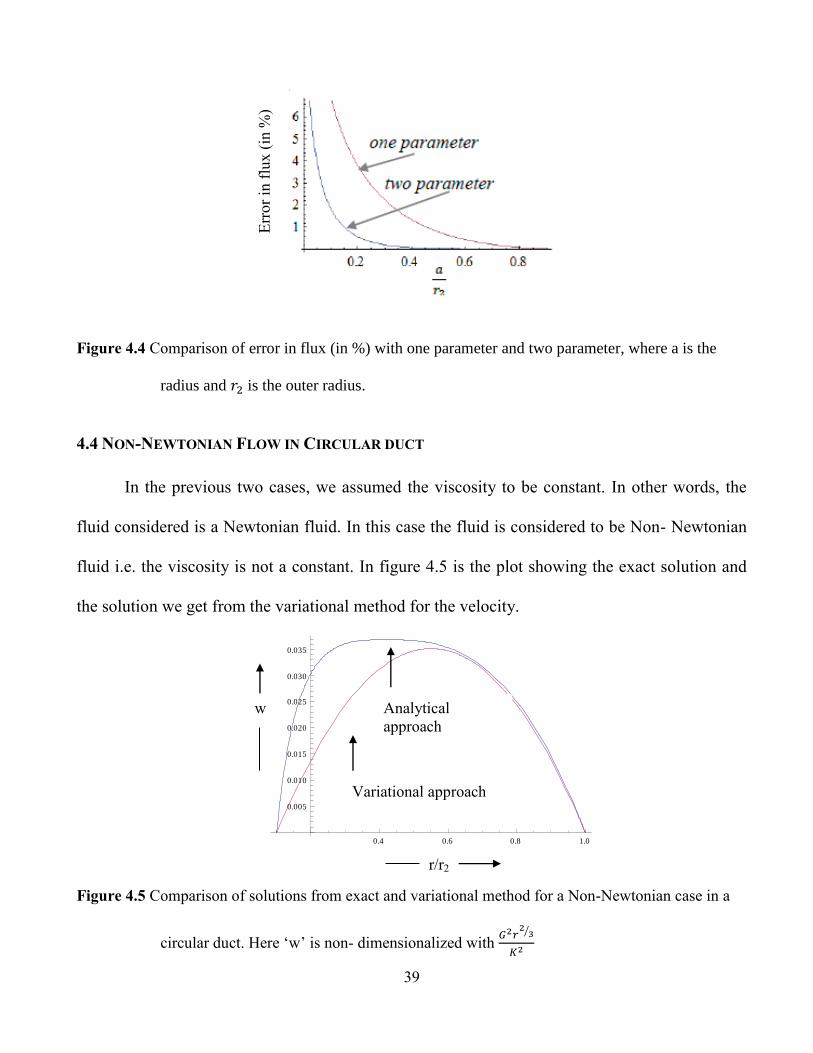
fluid i.e. the viscosity is not a constant. In figure 4.5 is the plot showing the exact solution and
the solution we get from the variational method for the velocity.
Figure 4.5 Comparison of solutions from exact and variational method for a Non-Newtonian case in a
circular duct. Here „w‟ is non- dimensionalized with
⁄
0.4 0.6 0.8 1.0
0.005
0.010
0.015
0.020
0.025
0.030
0.035
r/r2
w Analytical
approach
Variational approach
E
rror
in f
lux (
in %
)
40
The blue curve represents the exact solution while the red curve represents the solution
from variational method. In figure 4.6, we plot the relative error in flux (in percentage). The
results are in good agreement for larger a/r2 ratio. We believe that better approximation for test
functions (i.e., 2-parameter or 3- parameter test functions) can improve the results.
Figure 4.6 Error in flux (in %) for Non-Newtonian flow in a circular duct.
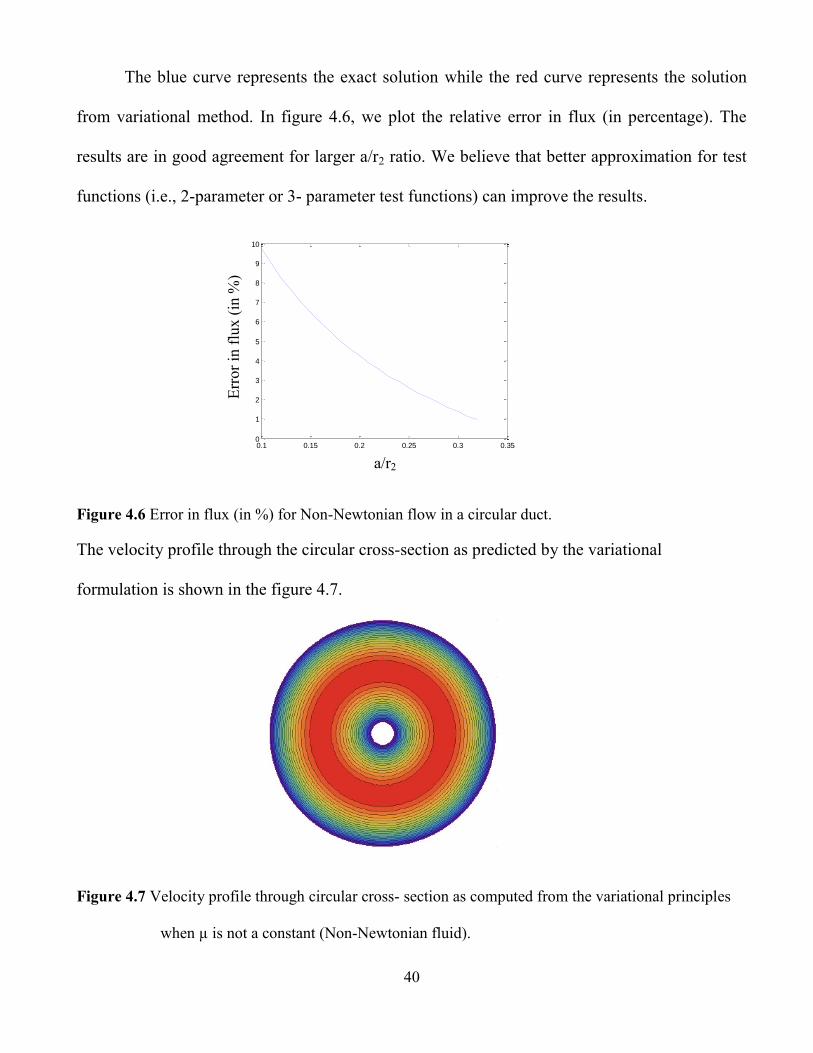
The velocity profile through the circular cross-section as predicted by the variational
formulation is shown in the figure 4.7.
Figure 4.7 Velocity profile through circular cross- section as computed from the variational principles
when µ is not a constant (Non-Newtonian fluid).
0.1 0.15 0.2 0.25 0.3 0.350
1
2
3
4
5
6
7
8
9
10 E
rror
in f
lux (
in %
)
a/r2
41
Chapter 5: Conclusions and Future work
In this chapter, we present the summary and conclusions of the research and
recommendations for the future direction of the research. In this thesis, we have employed by
developing a new methodology for fluid flow in pores. The variational method used give us very
good results when approximating the analytic expressions for calculating the conductance of
pore elements for input into pore network models.
5.1 CONCLUSIONS
In this thesis, we have presented a new methodology based on variational method for
studying the fluid flow through porous medium at pore scale. We found that variational method
gives us very good results when approximating the analytic expressions for calculating the
conductance of pore elements for input into pore network models. In conclusion, variational
methods seem a promising way of obtaining approximate analytical expressions for hydraulic
conductance of pore elements for input into pore network models. The methods promise better
approximations for hydraulic conductance of pore throats partitioned among two or more phases
than the traditional free-slip/no-slip approach. For very thin core (e.g., a/r= 0.2), variational
approach with both one parameter (<5% error) and two parameters (<2% error) gives very
accurate prediction for the flux through the pore. Additionally, variational method can be
extended to irregular geometries and non-Newtonian flows.
5.2 FUTURE WORK
Further analysis and validation of the variational technique for two-phase and three-phase fluid
configurations in pore network models of porous media, including benchmarking against

42
numerical solutions, will be carried out as part of future project. This work needs to be extended
in capabilities for providing input into the description of pore-scale processes necessary for
upscaling to reservoir scale. The conductance model developed here shall be applied to a pore-
scale representation that is obtained from thin section images, micro-CT scanning and
simulations of depositional processes and is mapped onto a framework of links and nodes.
43
BIBLIOGRAPHY
Bravo, M., Araujo, M., & Lago, M. (2007). Pore network modeling of two-phase flow in a liquid-
(disconnected) gas system. Physica A: Statistical Mechanics and its Applications , 375 (1), 1-17.
Brenstein, S. (2008). "Texas No. 1 producer of greenhouse gases". Associated press.
Bromhal, G., Sams, W., Jikich, S., Ertekin, T., & Smith, D. (2005). Simulation of CO2 sequestration in
coal beds: The effects of sorption isotherms. Chemical Geology , 217, 201-211.
(2003). CO2 emissions from fuel combustion,1971-2001. paris: OECD/IEA.
Dadvar, M., & Sahimi, M. (2003). Pore Network Model of Deactivation of Immobilized Glucose
Isomerase in Packed-Bed Reactors III: Multiscale Modeling. Chemical Engineering Science , 58, 4935-
4951.
Dooley, J., Dahowski, R., Davidson, C., Bachu, S., Gupta, N., & Gale, J. (2004). A CO2-storage supply
curve for North America and its implications for the deployment of carbon dioxide capture and storage
system.
EERC DD2 3542.Al.
Fatt, I. (1996). The network model of porous media I. capillary pressure characteristics. AIME
Petroleum Transactions , Vol. 207 pp.144.
Ferer, M., Bromhal, G., & Smith, D. (2002). Physica A , 311, 5-22.
Ferer, M., Bromhal, G., & Smith, D. (2003). Physica , A 319, 11-35.
Ferer, M., Bromhal, G., & Smith, D. (2004). Physica , A 334, 22-38.
Ferer, M., Bromhal, G., & Smith, D. H. (2007). Crossover from capillary fingering to compact invasion.
Advances in Water Resources , 30, 284–299.
Helland, J., & Skjaeveland, S. (2006). Three-phase mixed-wet capillary pressure curves from a bundle
of triangular tubes model. J. Petroleum Science and Engineering , 52, 100-130.
Herzog, H. J. (1999). The economics of CO2 separation and capture.
Herzog, H. J., & Drake, E. M. (1996). Carbon dioxide recovery and disposal from large energy systems.
Herzog, H. J., Caldeira, K., & Adams, E. (2005). Carbon Sequestration via direct sequestraion.
Hoffert, M. I. (2002). Advanced technology paths to global climate stability: energy for a greehouse
planret.
houghton, J., Ding, Y., Griggs, D., Noguer, M., van der linden, P., Dai, X., et al. (2001c). climate
change 2001: the scientific basis. cambridge university press.
Huang, Z., Shi, C., Xu, J., Kilic, S., R.M., E., & Beckman, E. (2000). Enhancement of the viscosity of
carbon dioxide using styrene/fluor copolymers. Macromolecules , 33 (15), 5437-5442.
IPCC. (2000). IPCC Report.
Keeling, C., & Whorf, T. (1998). Atmospheric CO2 records from sites in the sio air sampling network.
Oak Ridge: Oak Ridge National Lab.
Knackstedt, M., Sheppard, A., & Sahimi, M. (2001). Pore Network Modeling of Two-Phase Flow in
Porous Rock: The Effect of Correlated Heterogeneity. Advances in Water Resources , 24, 257-278.
Kumar, V. (2005). Advanced Computational Techniques for Incompressible/Compressible Fluid-
Structure Interactions.
Lackner, K. S., Wendt, C. H., Butt, D. P., Joyce, E. L., & Sharp, D. H. (1995). Carbon Dioxide disposal
in carbonate minerals.
Li, L., Peters, C., & Celia, M. (2006). Upscaling geochemical reaction rates using pore-network
modeling. Advances in Water Resources , 29, 1351-1370.
44
Liu, G., & Smirnov, A. (2007). Numerical modeling of CO2 sequestration in coal-beds variable
saturation on COMSOL. Excerpt from the proceedings of the COMSOL conference. Boston.
Lopez, X., Valvatne, P., & Blunt, M. (2003). Predictive network modeling of single-phase non-
Newtonian flow in porous media. J. Colloid Interface Sci. , 264 (1) 256-265.
Melnichenko, Y., Radlinski, A., Mastalerz, M., Cheng, G., & Rupp, J. (2009). Characterization of the
CO2 fluid absorption in coal as a function pressure using neutron scattering techniques (SANS and
USANS). 77, 69-79.
Melnichenko, Y., Wignall, G., D.R., C., & Frielinghaus, H. (2006). Absorption of supercritical CO2 in
aerogels as studied by small-angle neutron scattering and neutron transmission techniques. 124.
Melnichenko, Y., Wignall, G., D.R., C., & Frielinghaus, H. (2006). Absorption of supercritical CO2 in
aerogels as studied by small-angle neutron scattering and neutron transmission techniques. 124.
Melnichenko, Y., Wignall, G., D.R., C., & Frienlinghaus, H. (2004). Density fluctuations near the
liquid-gas critical point of a confined fluid. 69 (057102).
Metz, B., Davidson, O., Coninck, H., Loos, M., & Meyer, L. (2005). Carbon Dioxide Capture and
Storage. Cambridge University Press.
Metz, B., Davidson, O., Swart, R., & pan, J. (2001a). the third assessment report of the
intergovernmental panel on climate change. cambridge university press.
Nordhaus, W. D. (1992). An optimal transition path for controlling greenhouse gases.
Oleinikova, A., & Brovchenko, I. (2008). Critical desorption of LJ fluids near weakly attractive walls.
123.
Pan, C., Dalla, E., Franzosi, D., & Miller, C. (2007). Pore-scale simulation of entrapped non-aqueous
phase liquid dissolution. Advances in Water Resources , 30 (3), 623-640.
Patzek, T. (2001). Verification of a complete pore network simulator of drainage and imbibition. SPE
Journal , Vol. 6 No.2, pp.144-56.
Pentland, C. H., al-mansoori, s., Iglauer, S., Bijelic, B., & Blunt, M. J. (n.d.). Measurement of Non-
Wetting Phase Trapping in Sand packs.
Petroleum, B. (june 2007). "BP Statistical review of the world energy june2007".
Piri, M., & Blunt, M. (2005). Three-dimensional mixed-wet random pore-scale network modeling of
two- and three-phase flow in porous media I. Model description. Phys. Rev. , E 71, 026301.
Radlinski, A., Busbridge, T., Gray, E., Blach, T., Cheng, G., Melnichenko, Y., et al. (2009). Dynamic
Micromapping of CO2 Sorption in Coal. American Chemical Society , 25, 2385-2389.
Reeves, S. (2003). Assessment of CO2 sequestration and ECBM potential of U.S. coalbeds. DOE.
Roberts, J. (1985). Grain consolidation and electrical condctivity in porous media.
Siriwardane, H., Haljasmaa, I., McLendon, R., Irdi, G., Soong, Y., & Bromhal, G. (2009). Influence of
carbon dioxide on coal permeability determined by pressure transient methods. International Journal of
Coal Geology , 77, 109-118.
Smith, L., & Reeves, S. (2002). Scoping equilibrium geochemical modeling to evaluate the potential for
precipitate formation when sequestering CO2 in San Juan Basin Coals. Technical Report.
Stein, K., Tezduyar, T., Kumar, V., Sathe, S., Benney, R., Thornburg, E., et al. (2003). Aerodynamic
Interactions Between Parachute Canopies. 70 (1).
Stevenson, K., Bromhal, G., Ferer, M., Wilder, J., & Smith, D. (2004). Miscible, vertical network model
2-D simulations of two-phase 'ow displacements in porous media. Physica , A 343, 317-334.
Stevensona, K., Ferer, M., Bromhal, G., Gump, J., Wilder, J., & Smith, D. (2006). 2-D network model
simulations of miscible two-phase flow displacements in porous media: Effects of heterogeneity and
viscosity. Physica , A367, 7-24.
Thullner, M., & Baveye, P. (2008). Computational pore network modeling of the influence of biofilm
permeability on bioclogging in porous media. Biotechnology and Bioengineering , 99, 1337-1351.

45
White, C., Straeisar, B., Granite, E., Hoffman, J., & Pennline, H. (2003). Separation and capture of CO2
from large stationary sources and sequestration in geological formations. Journal of Air & Waste
Management Association , 53(6), 645-715.
Wolf, R. A., Kumar, V., Toffoletto, F. R., Erickson, G. M., Savoie, A. M., Chen, C. X., et al. (2006).
Estimating local plasma sheet PV^5/3 from single-spacecraft measurements. 111 (A12218).

46
Appendix
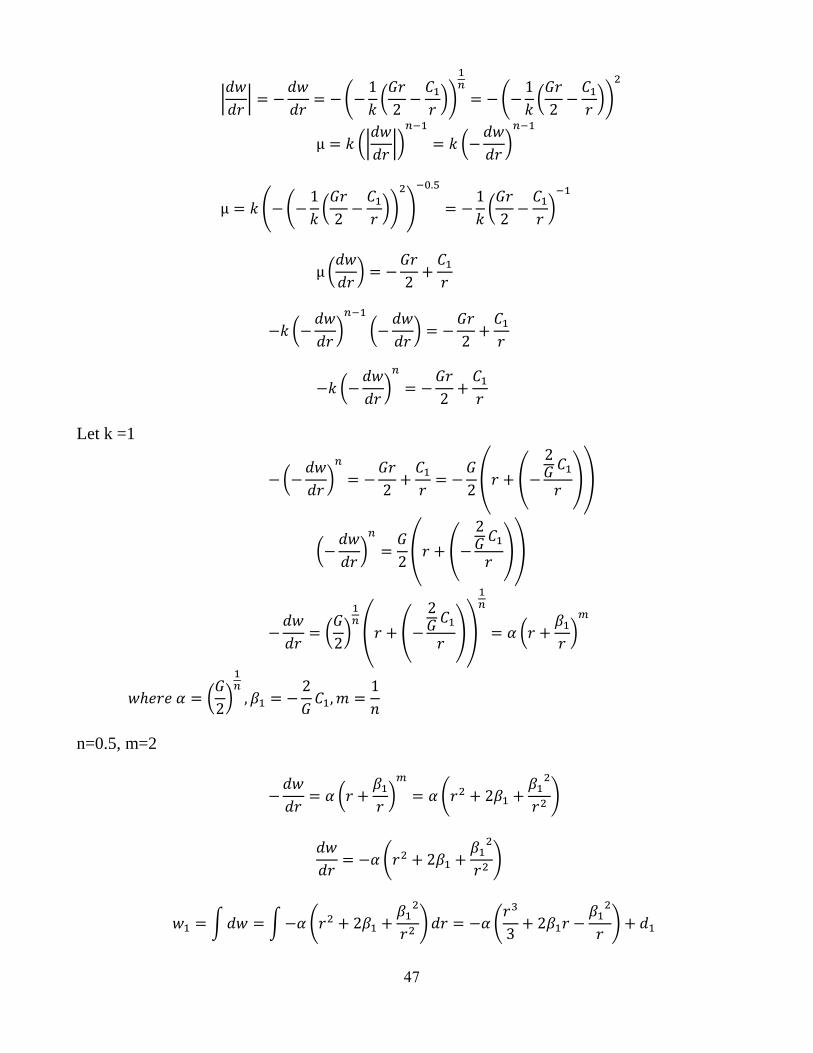
Derivation for the exact and variational solution for a Non-Newtonian flow.
Power law:
(|
|*
Stokes equation,
(
*
Substituting power law in the stokes eqn,
We get
(|
|*
(|
|*
(
*
Upon solving,
(|
|*
(
*
(
(
*)
Defining n = 0.5,
(
(
*)
(
(
*)
(|
|*
((
(
*)
+
((
(
*)
+
describes the velocity profile with w on the x- axis and the radius(r)on the y- axis.
Here we have 3 cases. Case 1:
If
< 0,
47
|
|
(
(
*)
(
(
*)
(|
|*
(
*
( (
(
*)
+
(
*
(
*
(
*
(
*
(
*
Let k =1
(
*
( (
),
(
*
( (
),
(
*
( (
),
(
*
(
*
n=0.5, m=2
(
*
(
)
(
)
∫ ∫ (
) (
)
48
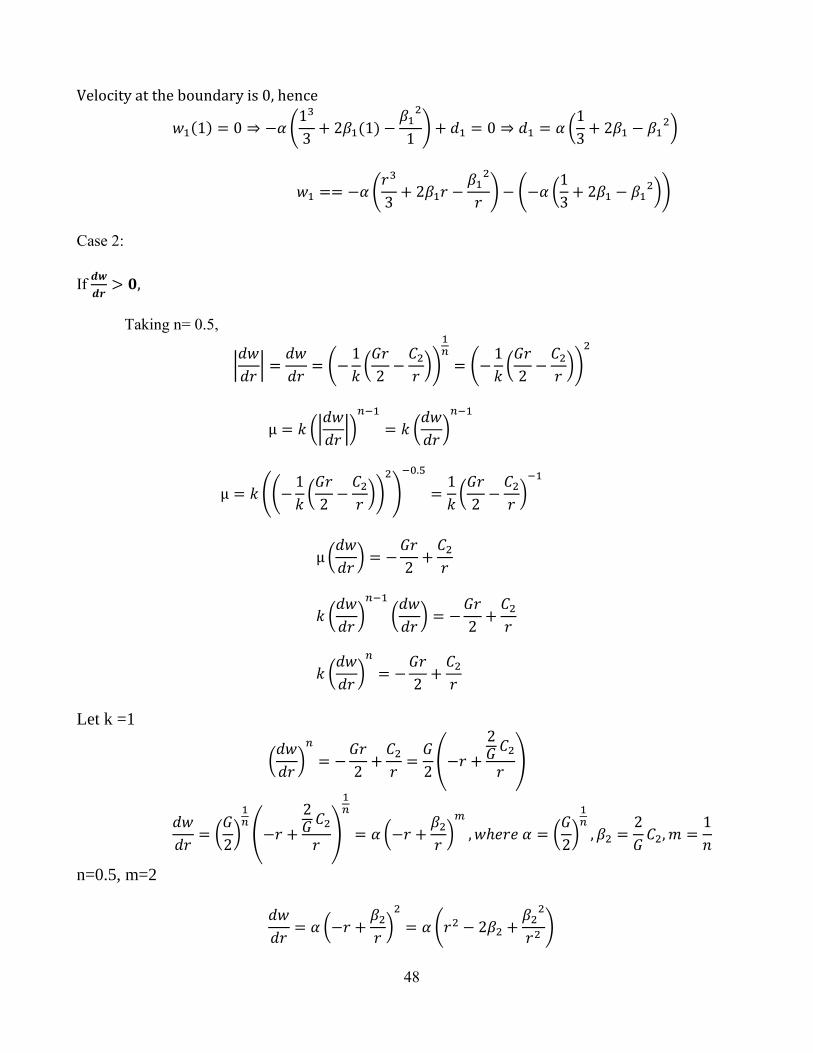
Velocity at the boundary is 0, hence
(
) (
*
(
) ( (
*)
Case 2:
If
Taking n= 0.5,
|
|
(
(
*)
(
(
*)
(|
|*
(
*
((
(
*)
+
(
*
(
*
(
*
(
*
(
*
Let k =1
(
*
(
)
(
*
(
)
(
*
(
*
n=0.5, m=2
(
*
(
)
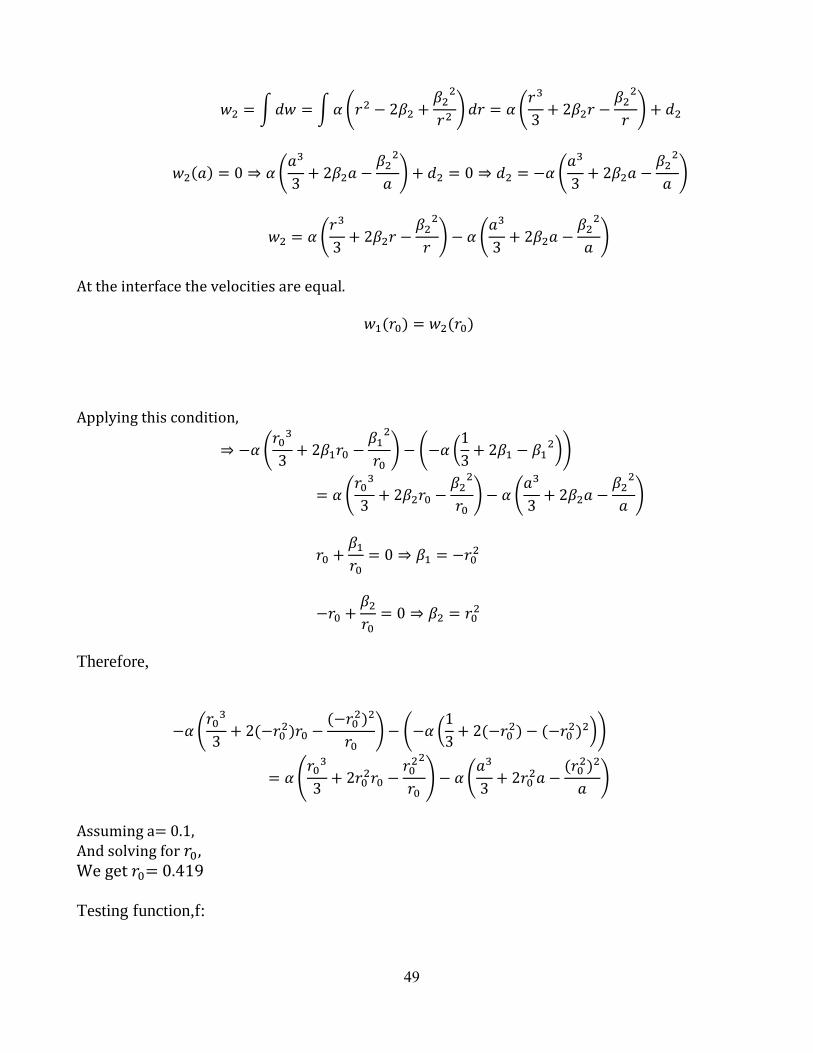
49
∫ ∫ (
) (
)
(
) (
)
(
) (
)
At the interface the velocities are equal.
Applying this condition,
(
) ( (
*)
(
) (
)
Therefore,
(
) ( (
*)
(
+ (
)
Assuming a= 0.1, And solving for , We get = 0.419
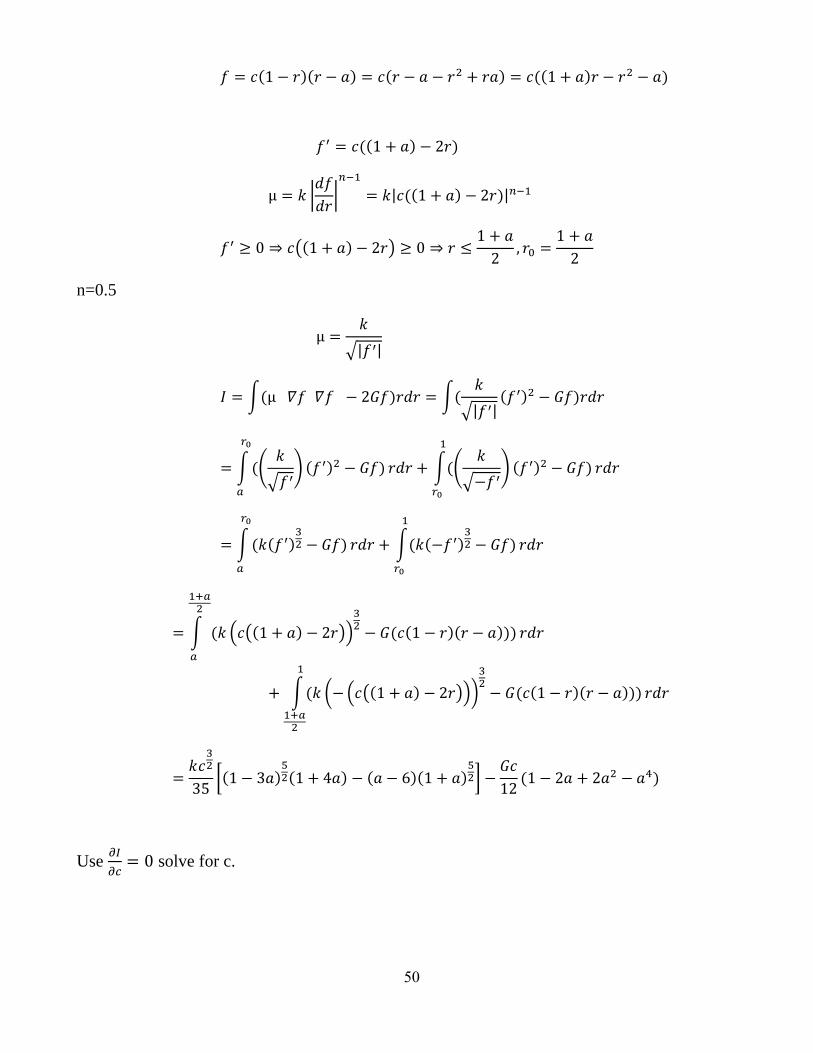
Testing function,f:
50
|
|
| |
( )
n=0.5
√| |
∫ ∫
√| |
∫ (
√ )
∫ (
√ )
∫
∫
∫ ( ( ))
∫ ( ( ( ))*
[
]
Use
solve for c.

51
*
+
When a=.1, c= 0.07
52
Curriculum vita
Nithin kavoori was born on April 5, 1985 in Hyderabad,India. He is the eldest child of Rajendra
prasad kavoori and Jyothi kavoori. He came to the United States of America to attend University
of Texas at El Paso for his Masters in 2009. He completed his high school education in Vignan
Jr. College, Hyderabad, India in 2002 and was awarded a bachelor‟s of science (Mechanical
engineering) by Osmania University in 2006. While at the master‟s program Nihtin kavoori has
worked as a graduate research assistant.
Permanent address: 1707 Nstanton St, Apt 4,
El Paso, Tx- 79902.
This thesis/dissertation was typed by Nithin Kavoori.