Embed Size (px)
Citation preview

Thesis for the degree of Doctor of Philosophy, Östersund 2015
A VALUE CO-CREATION PERSPECTIVE
ON CUSTOMER-BASED BRAND EQUITY MODELLING
FOR TOURISM DESTINATIONS – A CASE FROM SWEDEN
Tatiana Chekalina
Supervisors: Professor Matthias Fuchs Ek. Dr Maria Lexhagen
Faculty of Human Sciences Mid Sweden University, SE‐831 25 Östersund, Sweden
ISSN 1652‐893X, Mid Sweden University Doctoral Thesis 220
ISBN 978‐91‐88025‐21‐0
Akademisk avhandling som med tillstånd av Mittuniversitetet i Östersund framläggs till offentlig granskning för avläggande av filosofie doktorsexamen i turismvetenskap onsdagen den 13 maj, 2015, klockan 13.15 i sal F229, Mittuniversitetet Östersund. Seminariet kommer att hållas på engelska. A VALUE CO-CREATION PERSPECTIVE ON CUSTOMER-BASED BRAND EQUITY MODELLING FOR TOURISM DESTINATIONS – A CASE FROM SWEDEN Tatiana Chekalina © Tatiana Chekalina, 2015 Department of Tourism Studies and Geography, Faculty of Human Sciences Mid Sweden University, SE‐831 25 Östersund Sweden Telephone: +46 (0)771‐975 000 Printed by Mid Sweden University, Sundsvall, Sweden, 2015
i
A VALUE CO-CREATION PERSPECTIVE ON CUSTOMER-BASED BRAND EQUITY MODELLING FOR TOURISM DESTINATIONS – A CASE FROM SWEDEN Tatiana Chekalina Department of Tourism Studies and Geography Mid Sweden University, SE‐831 25 Östersund, Sweden ISSN 1652‐893X, Mid Sweden University Doctoral Thesis 220; ISBN 978‐91‐88025‐21‐0
ABSTRACT
Tourism destinations all over the world increasingly embrace marketing and branding practices traditionally utilized by businesses. However, the literature on customer‐based brand equity modelling and measurement for tourism destinations lacks the conceptual understanding of the complex relationships between tourists and the destination brand.
Therefore, the thesis at hand addresses the existing gap in tourism literature and aims at contributing to the development of the customer‐based brand equity concept in a tourism destination setting (CBDBE) by taking into account the value‐co‐creation approach. The components of the proposed model consist of the customers’ evaluation of the destination promise in terms of transforming functional, intangible and social destination resources into tourists’ value‐in‐use. Furthermore, the positive relationship between visitors’ perception of the destination and value‐for‐money discloses the input of tourists’ own resources into the process of value‐co‐creation. Moreover, destination brand awareness affects the evaluation of the destination promise, which, in turn, determines tourists’ behavioural intentions towards the destination.
By implementing web‐based customer surveys and using a linear structural equation modelling approach, the proposed model is empirically validated for the leading Swedish mountain destination Åre. First, the model is repeatedly tested with data regarding the winter seasons 2009/10 and 2012/13. Second, the proposed CBDBE model has been operationalized and tested also for the summer season. Findings from face‐to‐face interviews conducted in Åre during summer 2012 uncovered the relationships between destination resources offered in Åre, tourists’ own resources and destination value‐in‐use and, thus, served as the empirical
ii

fundament for the development of a destination‐specific scale to measure value‐in‐use. Subsequently, the proposed CBDBE model has been successfully tested with web‐based survey data collected after the summer season 2012, both for the total sample and separately for the main a priori tourist segments, including hiking, mountain biking and village tourists.
Results show the significant contribution of destination value‐in‐use defined as perceived benefits from a destination stay, which, in turn, strongly affect customers’ destination loyalty. In contrast, the relationship between value‐for‐money and destination loyalty is less strong and even non‐significant for the two customer segments hiking and mountain biking tourists. Importantly, as part of the CBDBE model operationalization, the thesis highlights the need to better understand destination‐specific consumption patterns across various tourism segments by destination managers.
Therefore, results demonstrate that by monitoring unique destination and tourist‐specific experience dimensions, destination management can influence and better manage both the value‐in‐use for customers and customer loyalty. Thus, the proposed CBDBE model provides destination managers with a tool, which enables evaluation and upgrade of destination marketing strategy and, finally, assist in discovering promising innovation potentials for highly experiential tourism products.
Keywords: destination branding, customer‐based brand equity, value co‐creation, value‐in‐use, Åre, linear structural equation modelling
iii

ACKNOWLEDGEMENTS
I would like to express my gratitude to all who provided essential support, assistance and expertise during my work on this doctoral thesis. First of all, I would like to thank my supervisor Professor Matthias Fuchs, for all
his time, knowledge, encouragement, support and patience. I will always be grateful for him giving me this unique opportunity to come to Östersund and embark upon my new academic career in the exciting field of destination marketing. I would also wish to express sincere thanks to my co‐supervisor Maria Lexhagen
for her expertise and efforts in building up my scientific skills, for help in planning my time wisely and for dealing with the inevitable obstacles and frustrations on the way to completing this thesis. I would also like to thank Bo Svensson, who was my co‐supervisor for the licentiate thesis on the first stage of this research work. I also highly appreciate the feedback received from the opponent at the final
licentiate seminar, Dr. Johan Jansson (Umeå School of Business), the opponent at the licentiate disputation, Professor Tore Strandvik (Hanken School of Economics, Finland), and the opponent at the final doctoral seminar, Professor Martin Johanson (Mid Sweden University), and all the advice I received from both Professor Rick Perdue and Professor William Gartner at the doctoral schools in Limassol, Cyprus and Rovaniemi, Finland. I would also like to express my special gratitude to Professor Yvonne von Friedrichs (Mid Sweden University) and Professor Raija Komppula (University of Eastern Finland) who not only gave valuable practical advice, but have been a great source of inspiration for this thesis since the beginning of this research. The work reported in this thesis was partly financed by the CBIT research project
(EU Structural Fund objective 2 project no. 39736). Furthermore, the research work continued in close collaboration with the project “Engineering the Knowledge Destination through Customer‐based Competence Development” financed by the Knowledge Foundation (KK‐stiftelsen). I would like to thank the members of the CBIT and “Knowledge destination” project teams in Åre and, in particular, Åre Destination AB, Skistar AB Åre, Holiday Club Åre, Copperhill Mountain Lodge Åre and Tott Hotell Åre. I would like to especially acknowledge Niclas Sjögren Berg, Lars‐Börje Eriksson, Anna Wersén, Hans Ericson, Pernilla Gravenfors, Peter Nilsson, Elisabeth Hallbäck, Helena Lindahl and Ulrika Eriksson for their excellent cooperation, help with data collection and essential feedback during the long hours of project meetings.
iv
My work on this doctoral thesis has provided me with a unique opportunity of experiencing two amazing working and social environments within the Faculty of Human Sciences. Thank you, my dear friends and colleagues at the Department of Tourism Studies and Geography and at the Department of Business, Economics and Law. Here in Östersund, I found Anna Sörensson, my very best friend here in Sweden.
Thank you, Anna, for your support, understanding, and great insights about life here in Jämtland. Finally, I would like to thank my family and friends in Kaliningrad, and my dear
husband Gennady for all their love, understanding and support. Tatiana Chekalina Östersund – Upplands Väsby, March 2015
v

TABLE OF CONTENTS
ABSTRACT ....................................................................................................................... II
ACKNOWLEDGEMENTS ............................................................................................ IV
1. INTRODUCTION ...................................................................................................... 1
1.1. BACKGROUND AND PROBLEM AREA ........................................................................ 1 1.2. RESEARCH GOALS ................................................................................................... 4 1.3. RESEARCH METHOD ................................................................................................ 5 1.4. PROJECT COLLABORATION AS A MEETING POINT FOR THEORY AND PRACTICE ........ 8 1.5. STRUCTURE OF THE MONOGRAPH ............................................................................ 9
2. VALUE CO‐CREATION PERSPECTIVE AS THE FOUNDATIONAL PREMISE OF NEW SERVICE MARKETING LOGIC .............................................. 11
2.1. FROM MARKETING OF SERVICES TO SERVICE AS A MARKETING LOGIC .................. 11 2.1.1. Service marketing as a research field ........................................................... 14 2.1.2. Customer and consumption in focus ............................................................. 16 2.1.3. Service as a marketing logic ......................................................................... 19 2.1.4. Service as a value co-creation process ......................................................... 21 2.1.5. Value co-creation as an experience ............................................................. 24 2.1.6. Value-co-creation within the network of relationships ................................. 25
2.2. THE CO-CREATION PERSPECTIVE FOR TOURISM DESTINATIONS ............................. 28
3. CUSTOMER‐BASED BRAND EQUITY MODEL: A LITERATURE REVIEW .............................................................................................. 32
3.1. CUSTOMER-BASED BRAND EQUITY MODEL IN LIGHT OF THE CONTEMPORARY
MARKETING DEVELOPMENT .............................................................................................. 32 3.1.1. Evolution of the brand concept ..................................................................... 32 3.1.2. The concept of the customer-based brand equity (CBBE) ............................ 35
3.2. CBBE MODEL FOR TOURISM DESTINATION ........................................................... 39 3.2.1. CBBE concept in a tourism destination context ........................................... 40 3.2.2. Destination brand salience ........................................................................... 42 3.2.3. Destination brand performance and imagery............................................... 47 3.2.4. Judgments and feelings ................................................................................ 50 3.2.5. Destination brand resonance ....................................................................... 53 3.2.6. Understanding the hierarchy of CBBE model dimensions for tourism destination .................................................................................................................... 57
vi

vii
4. CONCEPTUAL FRAMEWORK ............................................................................. 60
4.1. DESTINATION PROMISE .............................................................................................. 60 4.2. THE CBDBE MODEL DIMENSIONS .............................................................................. 62 4.3. PROPOSED CAUSAL RELATIONSHIPS BETWEEN THE CBDBE MODEL DIMENSIONS ...... 68
5. WINTER MOUNTAIN DESTINATION CASE ................................................. 71
5.1. PILOT WINTER STUDY ................................................................................................. 71 5.1.1. Operationalization of the CBDBE model constructs .......................................... 71 5.1.2. Data collection and preparation .................................................................. 72 5.1.3. Pilot study results and model development .................................................. 80
5.2. WINTER STUDY REPLICATION RESULTS ...................................................................... 85
6. SUMMER MOUNTAIN DESTINATION CASE ............................................... 91
6.1. UNDERSTANDING THE VALUE-IN-USE OF A MULTI-SEGMENT DESTINATION ............... 91 6.1.1. Qualitative study research design ...................................................................... 92 6.1.2. Qualitative study findings ................................................................................... 92
6.2. VALIDATING THE CBDBE MODEL FOR A SUMMER MOUNTAIN DESTINATION ........... 122 6.2.1. Revision of the CBDBE model measurement instrument for a summer mountain destination case .......................................................................................................... 122 6.2.2. Data collection and preparation ................................................................ 123 6.2.3. Measurement model testing ........................................................................ 129 6.2.4. Path analysis results ................................................................................... 133 6.2.5. Developing and testing segment-specific CBDBE models ............................... 134 6.2.6. Post-hoc examination of the mediating role of destination satisfaction in the CBDBE model ............................................................................................................ 151
7. CONCLUSIONS AND FUTURE RESEARCH .................................................. 157
7.1. SUMMARY OF RESEARCH FINDINGS ..................................................................... 157 7.2. THEORETICAL IMPLICATIONS .............................................................................. 161 7.3. MANAGERIAL IMPLICATIONS .............................................................................. 164 7.4. LIMITATIONS AND FUTURE RESEARCH................................................................. 168
8. REFERENCES ......................................................................................................... 173
APPENDIX 1. SURVEY INSTRUMENT .................................................................... 190
APPENDIX 2. CORRELATION MATRIX (PILOT WINTER STUDY) ................ 199

1. INTRODUCTION
1.1. Background and problem area Tourism destinations all over the world, including countries, regions, cities and
even small self‐contained locations and resorts, increasingly embrace marketing and branding practices traditionally utilised by business firms (Blain, Levy, & Ritchie, 2005). Accordingly, Destination Management Organisations (DMOs) on all geographical levels invest substantial amounts into the design of logos, the development of slogans, the publication of brochures, the creation of sophisticated destination web portals, the organisation of events and the implementation of a variety of other marketing and branding efforts. Thus, similar to corporations, tourism destinations make an effort to develop and strengthen their destination brands. Tourism destinations, particularly, implement these branding activities aiming to differentiate themselves within an increasingly competitive and globalized tourism market, to convey a unique value proposition of the destination and, in the end, to attract new visitors and to facilitate repeated visitation, readiness to pay a premium price and positive word‐of‐mouth (Blain et al., 2005; Pike, 2005).
Since destination1 branding was introduced in the early 2000s, it has become the “hottest topic” in the field of destination marketing research (Morgan, Pritchard, & Pride, 2004). More recently, destination brand equity measurement and tracking has become one of the main research streams in the field of destination branding (Pike, 2009). However, from a theoretical point of view, the concept of brand equity, which is a measure of the power of the brand and the link between marketing efforts and future destination performance, remains insufficiently elaborated for the tourism destination context (Gartner, 2009; Pike, Murdy, & Lings, 2011).
The general marketing field has accumulated a substantial body of literature on ‘brand equity’ (e.g., Aaker, 1991, 1996; Keller, 1993; Berry, 2000). However, as Christodoulides and de Chernatony (2010) emphasize, the literature on brand equity remains “largely fragmented and inconclusive” (p. 44), lacks an agreed definition and offers a confusing variety of measurement methodologies, while the only consensus is that “brand equity denotes the added value endowed by the brand to the product” (ibid., p. 45).
More precisely, the two main perspectives on the concept are defined by the financial brand equity and the customer‐based brand equity (Christodoulides & de
1 The terms “tourism destination” and “destination” are used interchangeably in the text.
1

Chernatony, 2010). The financial brand equity (e.g., Simon & Sullivan 1993; Haigh, 1999) signifies the financial value of a brand as a separate asset, which can be sold on a market or registered on a balance sheet. However, according to Christodoulides and de Chernatony (2010), financial brand equity, basically, is the outcome of consumers’ attachment to the brand and other brand‐related responses in customers’ minds, including associations and beliefs consumers have about the brand (ibid., p. 46). Therefore, the consumers’ response to a brand name represents the customer‐based band equity (CBBE).
Tourism research recognizes that financial brand equity evaluation is hardly applicable to destinations (Gartner, 2009). On the contrary, the constantly growing body of destination brand equity literature exemplifies the use of customer‐based approaches. Particularly, the majority of tourism destination brand equity studies (i.e., Bianchi, Pike, & Ling, 2014; Boo, Busser, & Baloglu, 2009; Chen & Myagmarsuren, 2010; Ferns & Walls, 2012; Gartner & Konecnik Ruzzier, 2011; Horng, Liu, Chou, & Tsai, 2012; Im, Kim, Elliot, & Han, 2012; Kim, Han, Holland, & Byon, 2009; Kladou & Kehagias, 2014; Konecnik & Gartner, 2007; Pike, Bianchi, Kerr, & Patti, 2010) adopt Aaker’s (1991, 1996) and Keller’s (1993) conceptualization of CBBE, which, according to Christodoulides and de Chernatony (2010) derives from the field of cognitive psychology and focuses on multi‐dimensional memory structures, such as awareness, image, quality, value and loyalty. Similarly, Evangelista and Dioko (2011) and Garcia, Gómez and Molina (2012) employ alternative multidimensional CBBE models proposed by Lassar, Mittal and Sharma (1995) and Berry (2000), respectively.
Therefore, tourism destination research has adopted brand equity measurement approaches, which, particularly, employ a holistic view of the brand, focus on the development of reliable, valid, parsimonious and theoretically sound measurement constructs, can easily be implemented with simple “pen and paper” instruments, and demonstrate high managerial usefulness as a diagnostic tool capable of identifying the areas for improvement of how the brand is perceived by customers (Christodoulides & de Chernatony, 2010). However, so far tourism destination brand equity studies mainly attempt to directly transfer conceptualization and measurement approaches that have been developed and tested for product brands, especially consumer packaged goods (Christodoulides & de Chernatony, 2010), and apply them in a tourism destination context without sufficient theoretical consideration of dimensionality of model constructs and causal linkages between the model dimensions in relation to the characteristics of tourism as a service industry.
In fact, authors emphasize that the complexity and multidimensionality of tourism destinations compared to goods and services substantially complicate the measurement of CBBE in the tourism destination context (e.g., Boo et al., 2009;
2

Pike, 2009; Gartner, 2009). Consequently, in the absence of a customer‐based brand equity theory adapted specifically to the peculiarities of tourism destinations, the tourism literature exhibits a lack of agreement on the composition of CBBE model dimensions, model structure and utilised scales, respectively.
Furthermore, Christodoulides and de Chernatony (2010) suggest that in order to enhance the diagnostic capacity of the model as a tool for successful brand development, the selection of CBBE model constructs should align with the brand category (i.e., product type) and incorporate industry‐specific dimensions that drive brand value. More specifically, the focus of brand equity research is about “understanding customer value within a particular situational context and level of co‐producing value”, thus, revealing the role the brand plays in the overall product experience (ibid., p. 61). Particularly, as demonstrated by de Chernatony, Harris and Christodoulides (2004) and Christodoulides, de Chernatony, Furrer and Abimbola (2006), the task of identifying the industry‐specific dimensions is particularly critical in the context of service brands, including tourism industries.
Therefore, by directly transferring the product‐based CBBE model without conceptual refinements and the further development of destination‐specific dimensions, there is a risk for tourism destination research to draw the focus away from the core essence of the destination brand and its value and, as a result, lose the managerial relevancy of the model.
Moreover, rapid digitalization of major areas of consumption and, especially, the growing impact of social media on tourists’ behaviour before, during and after vacation is changing the power position of tourists (Buhalis & Law, 2008). Particularly, tourists increasingly rely on various communication messages disseminated by other tourists when they search for information about the destination, when they make decisions and choose among competing destinations and when they plan their vacation before and during the trip. Furthermore, tourists become the main influential source of information about the destination, not only for their family and close friends, but for the wider audience as well, as they actively use various online platforms, such as Facebook, Twitter or Tripadvisor to share their anticipations before the trip, experiences during the trip, and post‐trip feedback (Xiang & Gretzel, 2010). Therefore, understanding the mechanisms behind the formation of attitudes which tourists develop towards destination brands has become a managerial task of ultimate importance (Callarisa, Garcia, Cardiff, & Roshchina, 2012; Davis, Piven, & Breazeale, 2014; Gensler, Völcker, Liu‐Thompkins, & Wiertz, 2013; Hudson, Roth, Madden, & Hudson, 2015; Jung, Kim, & Kim, 2014; Laroche, Habibi, & Richard, 2012).
Thus, tourism destination branding research, which primarily utilises marketing models developed for consumer goods, could largely benefit from the contemporary service‐oriented marketing perspective (Li & Petrick, 2008;
3

Grönroos, 2000, 2009; Vargo & Lusch, 2004a, 2008a). Li and Petrick (2008), particularly, argue that despite tourism is viewed as a service‐driven industry and the nature of tourism products favours the adoption of service marketing strategies, the goods‐centric approach dominated the tourism and destination marketing literature and practice for years. Therefore, the efforts to integrate recent marketing thoughts in tourism marketing research and its primary related topics remain an acute issue. “Branding and positioning” is one such topic, which, according to Li and Petrick (2008), should be revisited in light of the new service paradigm: “How do we effectively build service brands when the distinction between demand and supply, customers and providers, gets increasingly blurred?” (ibid., p. 241).
1.2. Research goals The main research question of this thesis has, therefore, been formulated as
follows: How can we take account of both the complex and multidimensional nature of
tourism destinations and the highly heterogeneous consumption patterns among various tourist segments when developing a reliable, valid, parsimonious, theoretically sound and managerially relevant measurement instrument for the tourism destination CBBE model? Hence, this research study aims at contributing to the further development of
the CBBE concept in a tourism destination context by bridging the gap between destination brand equity evaluation and the true nature of tourism consumption. Particularly, it is proposed to take into account the value‐co‐creation approach recently developed by service marketing scholars (Grönroos, 2000, 2009; Vargo & Lusch, 2004a, 2008a), in order to adjust the CBBE model for tourism destination settings.
More precisely, it is proposed that the core component of the revised CBBE model for tourism destinations is about customers’ evaluation of the destination promise in terms of the transformation of destination resources into value‐in‐use for the tourist. This approach is particularly consistent with Gnoth’s (2007) conceptualization of the destination brand viewed as a representation of the functional, emotional and symbolic values of the destination, as well as the benefits, which tourists are promised to receive as the result of service consumption. The study specifically suggests the integration of value‐in‐use of tourism destination visitation into the CBBE model construct.
The study particularly aims at understanding the mechanisms of interactions between tourists and the destination brand, the formation of destination brand
4

loyalty and the enhancement of the diagnostic capacity of the customer‐based brand equity model for tourism destinations. Therefore, the study focuses on revealing the causal relationships within the destination promise construct as the inner core of the brand equity pyramid, including customer’s perception of destination resources, value‐in‐use and value‐for‐money.
Finally, it is proposed that destination brand awareness influences the evaluation of the destination promise, which, in turn, affects the behavioural intentions and the actual behaviour of tourists towards the destination.
1.3. Research method Both marketing research and tourism studies develop the discussion on
research philosophy and the choice of appropriate methods within the paradigmatic framework viewing positivism and constructionism as the two extremes of a continuum (e.g., Hanson & Grimmer, 2007; Franke & Mazanez, 2006; Jennings, 2009).
The positivistic research paradigm is adopted by social sciences from the natural sciences and is consistent with August Comte’s philosophical views (Blumberg, Cooper, & Schindler, 2008). The key principles behind the positivism tradition are the realist ontology (i.e., the assumption that the world, or in our case the social world, exists externally and is viewed objectively), and the objectivist epistemology (i.e., ‘the researcher is independent, taking the role of an objective analyst’, Blumberg et al., 2008, p. 20). In accordance with the positivistic tradition, it is assumed that the social world is observed by collecting objective, often quantitative facts and consists of rather simple elements embedded in a deterministic framework to which it can be reduced (Blumberg et al., 2008).
On the contrary, Hanson and Grimmer (2007) describe constructionism as the research philosophy opposite to “hard positivism”, characterised by the relativist ontology and rejecting objectivist epistemology. “The purpose of good constructionist research is a decent understanding of an individual viewpoint that may yield lessons for others” (ibid., 2007, p. 59). The authors describe the style of constructionist research as qualitative, primarily focused on understanding and interpretation. Blumberg et al. (2008) label this research paradigm as ‘interpretivism’ and particularly highlight that interpretivists question the notion of generalization, which is one of the key concepts for positivists along with reliability, validity and statistical significance (Blumberg et al., 2008; Hanson & Grimmer, 2007).
Therefore, the criticism directed towards these two extreme approaches (e.g., Yeganeh & Su, 2005) resulted in search for the middle‐way. Particularly, Hanson and Grimmer (2007) describe a “softer” version of positivism (also denoted as post‐positivism), which differs from the “hard” positivism in its epistemological
5

assumptions. Particularly, post‐positivists acknowledge, that the methods utilised for uncovering the world produce probabilistic insights and that “the viewpoint of the observer must be borne in mind at all times in describing any part of the world” (ibid., 2007, p. 59).
This thesis follows the post‐positivistic methodology, which constitutes the basis of social scientific empirical research, including both general marketing and tourism marketing studies. More precisely, the identification of prior theoretical assumptions is the basis for the formulation of hypotheses (i.e., the causal relationships between multi‐dimensionally measured model constructs), which are, in turn, operationalized on the level of measurement items and subsequently tested by using appropriate multivariate (i.e., quantitative) methods (Hair, Black, Babin, & Anderson, 2010).
Therefore, the central research method employed in this thesis belongs to the type of research studies typically used to empirically test hypotheses regarding the valid measurement of model constructs and the testing of hypothesized causal relationships between these model constructs (Steenkamp & Baumgartner, 2000). Accordingly, the research consists of four major methodological stages:
1. Literature review and modification of the existing theoretical model for tourism destination brand equity from a value co‐creation perspective
2. Development of destination‐specific measurement scales (Churchill, 1979) 3. Validation of the proposed measurement model, i.e. empirically testing
construct reliability, indicator (i.e., item) reliability, and discriminant validity using confirmatory factor analysis (Brown, 2006)
4. Testing the significance of the hypothesized causal relations between the constructs of the proposed CBBE model for tourism destination using a linear structural equation modelling (SEM) approach (Byrne, 2001).
Figure 1.1 illustrates the research design and process of data collection. Furthermore, the thesis presents the results of the proposed CBBE model
validation for both winter and summer tourism seasons at the Swedish mountain resort of Åre. Åre is the leading ski tourism destination in Sweden, which actively expands on the international market and promotes summer season activities with a focus on hiking, mountain biking and the year‐round use of tourism facilities located in the Åre village.
First, the pilot winter web‐based survey conducted in 2010 aims at the empirical validation of the proposed CBBE model for tourism destinations with data collected from international tourists who visited Åre in the season 2009/2010. The additional survey with the new sample, containing both domestic and international tourist data from the winter season of 2012/2013, pursues the goal of repeatedly demonstrating the reliability and empirical robustness of the proposed model.
6

Winter study (ski tourism destination)
Conceptual framework development
Literature review
Qualitative study of summer season vacation
benefits (2012)
Scale development for summer study
Data collection for summer study (2012)
Model testing for summer season (SEM)
Summer study (multi‐segment destination)
Scale development for pilot winter study
Repeat model testing for winter season (SEM)
Data collection for pilot winter study (2010)
Model testing for winter season (SEM)
Scale refinement for repeat winter study
Data collection for repeat winter study (2013)
Figure 1.1. Summary of research design and data collection process
Second, the summer season study further serves the purpose of the repeat
model testing in the context of a multi‐segment destination. The summer case integrates the qualitative pre‐study conducted in July 2012 with the focus on understanding of the process of value‐co‐creation experienced by various tourism segments Åre attracts in the summer season, and developing destination‐specific and segment‐specific scales of value‐in‐use as a construct of the CBBE model for
7

tourism destinations. Finally, the web‐based survey conducted after the summer season 2012 tests the model for the total sample and separately for the main summer season tourism segments in Åre, including hiking, mountain biking and village tourism.
1.4. Project collaboration as a meeting point for theory and practice
The pilot winter study was a part of the EU‐financed project “Customer‐based innovation in tourism”, which was implemented between 2008 and 2011 in collaboration between ETOUR and the key private actors responsible for the development of Åre, the leading mountain tourism destinations in Sweden.
Project partners from Åre supplied the researchers with various survey data describing different aspects of customer behaviour. Thus, the initial efforts in the project were to understand and to explore this data, and to relate it to the on‐going research in management, marketing and tourism studies. This preparatory and explorative stage of the project implementation revealed that much of the provided real‐world customer‐based data can be easily related to the customer‐based equity model in the tourism destination context (e.g., quality, satisfaction, loyalty). Therefore, the data can be utilised for developing the destination brand performance models in order to measure the marketing effectiveness on the destination level and to predict future performance of the destination as the brand.
However, tourism literature so far has not provided a satisfactory integrated approach for measuring destination brand performance, which could be directly implemented in a destination management context. Therefore, this topic remains a research gap for tourism marketing and branding.
Private partners in Åre fully supported the task of developing the CBBE model as a managerially relevant tool for measuring destination brand performance, and the project team incorporated this effort into CBIT project activities. The collaboration between private stakeholders in Åre and the research team at ETOUR provided substantial synergetic benefits on different stages of task implementation, including the development of the survey instrument, collection of data and interpretation of results.
At the same time, the project goals went far beyond the CBBE model verification. In particular, the project aimed at creating customer‐based knowledge needed to support innovation and development processes in Åre. One of the main interests of the destination managers is to learn more about international winter tourists, which constitute a new market for the traditional winter product. Therefore, the destination management is not only interested in how international tourists perceive the destination’s offer, but also requests knowledge about the
8

socio‐demographic profile of tourists and about their actual behaviour during the destination stay in Åre.
As the next step of collaboration between Åre stakeholders and ETOUR, the indicators of the empirically confirmed CBBE model were fully integrated into the Destination Management Information System (DMIS‐Åre), prototypically developed and implemented within the follow up project “Engineering the Knowledge Destination through Customer‐based Competence Development” financed by the Knowledge Foundation. Specifically, the aim of the project was to apply a Business Intelligence approach (Larose, 2005) for developing the DMIS‐Åre as a tool enhancing the knowledge creation and organizational learning at tourism destinations. Hence, the customer perception and experience indicators developed within the CBBE model frameworks, along with customer behaviour indicators and economic performance indicators (e.g. prices, bookings, occupancy rate etc.) constitute the structure of customer-based knowledge integrated into DMIS-Åre (Fuchs, Chekalina, Höpken, & Lexhagen, 2015; Fuchs, Höpken, & Lexhagen, 2014) .
Therefore, the stakeholders in Åre effectively supported the development of brand performance indicators for the summer season and the repeat testing of the refined set of winter season indicators in the course of this thesis can be considered as an important contribution for the implementation of the DMIS-Åre project. Finally, the winter and summer surveys data served as an input for pilot testing DMIS-Åre by destination stakeholders (Höpken, Fuchs, Keil, & Lexhagen, 2011). 1.5. Structure of the monograph
The introduction section of the monograph (Chapter 1) introduces the theoretical and practical gaps that serve as the basis to formulate the study goals.
Chapter 2 discusses the broader theoretical context of the study presented in this thesis. Furthermore, the chapter introduces the notion of value‐co‐creation as the central theoretical concept for this thesis. Finally, the chapter illustrates the application of the value‐co‐creation concept to the tourism destination phenomenon.
Chapter 3 presents a review of the CBBE literature. First, the CBBE concept is reviewed in light of the service marketing paradigm. Second, the research efforts to adapt the CBBE model to a tourism destination context are discussed.
The theoretical framework is established in Chapter 4. Particularly, the model dimensions of the proposed theoretical CBBE model for tourism destinations are defined and the set of literature‐based hypotheses is presented.
Chapter 5 presents the results of the revised CBBE model testing in the context of a winter mountain destination, including the pilot study research design and data analysis results, as well as the results from a replication study.
9

Chapter 6 presents the effort to develop the destination‐specific measurement scale for the value‐in‐use dimension of the CBBE model in the context of a summer mountain destination. Furthermore, the CBBE model is empirically validated for key tourists segments.
Finally, theoretical and managerial implications of the study results, research limitations, as well as proposals for future research are discussed in Chapter 7.
10

2. VALUE CO-CREATION PERSPECTIVE AS THE FOUNDATIONAL PREMISE OF NEW SERVICE MARKETING LOGIC
The purpose of this chapter is two‐fold. First, the section offers a retrospective on the evolution of marketing science in light of a paradigm shift from the goods‐centric marketing to the new service logic of marketing. Most importantly, this section sets up a broad context for the theoretical development of the customer‐based brand equity model (CBBE) for tourism destinations within the premises of the contemporary service marketing paradigm. Second, the section introduces the key concepts of contemporary service marketing, which are most important for CBBE model building in a tourism destination context. These concepts, particularly, include resources, relationships, experience, value co‐creation and value‐in‐use. Finally, the section illustrates how the respective theoretical notions are integrated in the tourism research literature.
2.1. From marketing of services to service as a marketing logic
Decades ago the notion of services emerged as the label for the residual group of economic activities, which could neither be classified as agriculture nor manufacturing. Since then the share of the service sector in GDP and employment in developed western countries has grown enormously, while services became the dominating economic activity of the post‐industrial era (Grönroos, 2000; Chesbrough & Spohrer, 2006).
This paragraph briefly illustrates the development of the service marketing as a distinct research field (Table 2.1), which emerged on the premises that service as an activity is a phenomenon, which should be contrasted to physical goods. However, the interest of service marketing researchers in the customer and especially in the complex service consumption process gradually opened the ground for the marketing paradigm shift, when service is no longer viewed as an activity or a unit of exchange2; rather, service becomes a new logic within the contemporary marketing paradigm.
2 Henceforth the term “service” is used in a singular form if viewed as a process, in contrast to “services” in a plural form viewed as an activity or a unit of exchange (Vargo and Lusch, 2008b).
11

Table 2.1. Evolvement of the service marketing paradigm
Service marketing development stages
Emerging research areas
Establishment of service marketing as a research field
1950‐70s ‐ first doctoral dissertations and articles on the theme of services (McDowel, 1953; Rathmell, 1966; Johnson, 1969; Gummesson, 1976; Eiglier, Langeard, Lovelock, Bateson, & Young, 1977; Thomas, 1978; Grönroos, 1979); ‐ “goods vs. services debate” (Shostack, 1977)
1980‐85 ‐ service classification framework (Lovelock, 1983) ; ‐ intangibility, heterogeneity, inseparability and perishability (IHIP) characteristics of services as units of output (Zeithaml, Parasuraman, & Berry, 1985) ‐ “Gap model of service quality” (Parasuraman, Zeithaml, & Berry, 1985) ‐ service encounter as a dyadic interaction between a service provider and a customer (Solomon, Surprenant, Czepiel, & Gutman, 1985)
1986‐90s ‐ service quality (SERVQUAL) multiple‐item scale (Parasuraman, Zeithaml, & Berry, 1988) and measurement of customers’ perceptions of service quality (Babakus & Boller, 1992; Bolton & Drew, 1991ab; Brown & Swartz, 1989; Carman, 1990; Cronin & Taylor, 1992; Parasuraman, Berry, & Zeithaml, 1991); ‐ service satisfaction (Bitner, 1990; Bitner, Booms, & Tetreault, 1990; Crosby, Evans, & Cowles, 1990; Oliva, Oliver, & MacMillan, 1992); ‐ customer‐employee interaction at the service encounters research (e.g., Bitner, 1990, 1992; Goodwin, 1990; Kelley, Donnelly, & Skinner, 1990; Berry & Parasuraman, 1991); ‐ service design (Shostack, 1984, 1987; Kingman‐Brundage, 1991; Scheuing & Johnson, 1989); ‐ role of ICT in service process (Quinn, Doorley, & Paquette, 1990)
12

Table 2.1. (continues)
Service marketing development stages
Emerging research areas
Opening the “black box of consumption”
1980s‐ ‐ Nordic school of marketing, interactive marketing function, customer as a “resource” and an active participant in service production process, (Grönroos, 1981, 1982, 1983; Grönroos & Gummesson, 1985); ‐ relationship marketing and focus on customer retention (Berry, 1983; Grönroos, 1990, 2000; Christopher, Payne, & Ballantyne, 1991; Gummesson, 2002, 2008; Baron, Conway, & Warnaby, 2010; Gummesson, Lusch, & Vargo, 2010); ‐ internal marketing and role of employees (George, 1990; Berry & Parasuraman, 1991; Grönroos, 1990; Gummesson, 1987; Bowen & Lawler, 1992) ‐ customer experience and experiential marketing (Holbrook & Hirschman, 1982; Schmitt, 1999; Gupta & Vajic, 2000); ‐ customer value (Zeithaml, 1988; Woodruff, 1997); ‐ value‐co‐creation (Sheth & Parvatiyar, 1995; Prahalad & Ramaswamy, 2004)
Service paradigm shift in marketing
2004 ‐ ‐ service‐dominant logic (Vargo & Lusch, 2004a, 2008a); ‐ service logic of marketing (Grönroos, 2008); ‐ value‐in‐use (Vargo & Lusch, 2004a, 2008a; Vargo et al., 2008; Grönroos, 2008); ‐ value co‐creation as a service process (Vargo, 2009; Moeller, 2010); ‐ value co‐creation as an experience (Helkkula & Kelleher, 2010; Palmer, 2010); ‐ value relationship network (Grönroos, 2006, 2008; Baron & Harris, 2010; Lusch et al., 2010)
13

2.1.1. Service marketing as a research field The evolvement of the “service” discussion gradually transformed both the
marketing practice and research. The periodization of the service marketing development proposed by Fisk, Brown and Bitner (1993) is a helpful tool for portraying the field from a historical perspective. The authors, particularly, employed an evolutionary metaphor in order to identify three stages of the service marketing literature development, namely “Crawling Out” (1953‐79), “Scurrying About” (1980‐85), and “Walking Erect” (after 1986).
In the period 1950‐70s the first doctoral dissertations and articles on the theme of services emerged (McDowel, 1953; Rathmell, 1966; Johnson, 1969; Gummesson, 1976; Eiglier et al., 1977; Thomas, 1978; Grönroos, 1979). These first early service studies accompanied by voices from the industry (Shostack, 1977) launched a “goods vs. services debate”. More precisely, the early service marketing researchers and practitioners argued that services cannot be treated as a particular case of goods and that marketing strategies developed for goods are inappropriate for services. Therefore, early service marketing scholars directed their efforts towards justifying the legitimacy of service marketing as a distinct research field, and argued for a need to develop a conceptual framework for service marketing (Berry & Parasuraman, 1993; Fisk et al., 1993).
In the period 1980‐85 the topics of service quality and service encounters were introduced as specific areas for service marketing. A number of highly influential articles published during this period established a solid foundation for the further development of service marketing as a field (e.g., Lovelock, 1983; Parasuraman et al., 1985; Zeithhaml et al., 1985; Grönroos, 1981, 1983; Grönroos & Gummesson, 1985; Solomon et al., 1985). Simultaneously, the institutionalization of service marketing began when the American Marketing Association recognized the field and held a series of research events (Berry & Parasuraman, 1993; Fisk et al., 1993).
Lovelock (1983) emphasized the need to distinguish between various service branches depending on (1) the nature of the service act (i.e., whether a person or a thing is a service recipient and whether the performed action is tangible or intangible); (2) the type of the relationship (i.e., continuous or discrete transaction, with or without formal membership); (3) the degree of service customization and the extent to which a customer contact personnel exercise judgement in meeting individual customer needs; (4) the extent to which supply is constrained and demand fluctuates over time; and, finally, (5) the method of service delivery, including availability of service outlets and the nature of interaction between customers and the service organisation. Accordingly, various types of services emerged, which in turn require different marketing strategies (Lovelock, 1983).
While Lovelock (1983) provided a framework for classification of various service branches, Zeithaml et al. (1985), based on the analysis of the marketing literature,
14

formulated four unique characteristics of services as units of output. These characteristics, which intend to distinguish services from goods, include intangibility, heterogeneity (i.e., non‐standardization), inseparability of production and consumption and perishability (i.e., services cannot be inventoried) and are widely referred to as IHIP (ibid., p. 34).
However, the IHIP characteristics later received much criticism (Grönroos, 2000; Lovelock & Gummesson, 2004; Vargo & Lusch, 2004a). Probably, one of the most obvious targets for critique is the intangibility characteristic, since there are numerous examples of tangibility in services, previously exemplified by Lovelock (1983). Therefore, as argued by Grönroos (2000), the initial four characteristics (i.e., IHIP) should be regarded with some sort of caution as “more or less common” (ibid., p. 47), rather than absolute, since in some cases, a clear distinction between goods and services is problematic (for instance, the retail sector, or the provision of services by manufacturers as part of a package). After 1986 the field experienced an explosive growth in numbers of books,
journal publications, conferences and proceedings, while the empirical and theoretical rigour in the content of publications increased tremendously. Service marketing continued its development as a cross‐interdisciplinary field by integrating inputs from management, human resources, operations and social psychology (Berry & Parasuraman, 1993; Fisk et al., 1993).
The “Gap model of service quality” (Parasuraman et al., 1985) served as a major conceptual framework for a vast body of service quality research, which indeed has become a trademark of service marketing as a research field. According to Fisk et al. (1993), service quality studies developed as two interrelated subfields, including the measurement of customers’ perceptions of service quality (Babakus & Boller, 1992; Bolton & Drew, 1991ab; Brown & Swartz, 1989; Carman, 1990; Cronin & Taylor, 1992; Parasuraman et al., 1991), which grew from the SERVQUAL multiple‐item scale proposed by Parasuraman et al. (1988), and service satisfaction studies (Bitner, 1990; Bitner et al., 1990; Crosby et al., 1990; Oliva et al., 1992).
The other major area of service marketing research focuses on the service encounters. Fisk et al. (1993) identify several areas of interest within service encounters research, including the management of the customer and employee interaction at the service encounter, the customers’ evaluation of this interaction, customers’ involvement in service encounters, as well as the customers’ role in service production and delivery, and, finally, the role of tangibles and the physical environment in the customers’ evaluation of encounters (e.g., Bitner, 1990. 1992; Goodwin, 1990; Kelley et al., 1990; Berry & Parasuraman, 1991).
Finally, service design became the third important stream of service marketing research (Fisk et al., 1993). The area, which was strongly influenced by the
15

development of the total quality management (TQM) approach, covered such topics as service design seen through the customer’s eyes (Shostack, 1984, 1987; Kingman‐Brundage, 1991), marketing impact and the role of service operations and process design (Baum, 1990; Scheuing & Johnson, 1989), as well as the role of information and communication technologies (ICT) in the service process (Quinn et al., 1990).
2.1.2. Customer and consumption in focus Interestingly, the service marketing field, which evolved as the result of the
inapplicability of existing goods‐based marketing models to the service phenomenon, started its development within the premises of the mainstream goods‐based marketing paradigm. As illustrated above, services were regarded as activities and, therefore, as argued by Grönroos (2006) in particular, the role of the marketer was still limited to engaging the customer into transaction and pursuing the customer to buy. Put differently, the goods‐based logic of the mainstream was not interested in the purpose of consumption and, therefore, was “not penetrating the consumption process” (ibid., p. 328).
However, since the service marketing emerged in the 1970s as a new field of research, scholars turned their eyes to the customer and focused their efforts on opening the “black box of consumption” (Grönroos, 2006). The emerging Nordic School of marketing (e.g., Grönroos, 1981, 1982, 1983; Grönroos & Gummesson, 1985) focused on interactions between service firms and service consumers and emphasized the role of the customer in the process of service production. More specifically, as proposed by Grönroos (1982), both traditional marketing activities, such as advertising, promotion and management of buyer‐seller interactions during the simultaneous process of service production and consumption constitute the total marketing function. The latter component introduced as an interactive marketing function aims at managing the resources involved in the buyer‐seller interactions (Grönroos, 1982, p. 349). Furthermore, as indicated by Eiglier and Langeard (1976), three main categories of resources are involved in buyer‐seller interactions, namely, contact personnel, physical environment and, finally, consumers themselves. Therefore, the interactive service marketing approach views a consumer as an active participant of the service production process and as a “resource”, influencing the outcome of service provision (Grönroos, 1982).
Hence, the Nordic School of service marketing (Grönroos, 1981, 1983, 1990; Grönroos & Gummesson, 1985) enabled scholars to view marketing as more than a traditional business function focused on such areas as advertising and marketing research. Rather, facilitation and management of interactions became the focal points for service marketing (Grönroos, 2006).
16

Furthermore, the rapid growth of service marketing in the 1980s‐90s accompanied by the advancement of the B2B marketing research gave rise to a new marketing field, namely relationship marketing (Berry, 1983; Grönroos, 1990, 2000; Christopher et al., 1991; Gummesson, 2002, 2008; Baron et al., 2010; Gummesson et al., 2010) with focus on customer retention. Fisk et al. (1993) identified a number of service marketing topics within the relationship marketing area of research, namely, trust and relationship‐commitment related to customer satisfaction and loyalty (Crosby & Stephens, 1987; Crosby, Evans, & Cowels, 1990), service recovery strategies (Berry & Parasuraman, 1991; Hart, Sasser, & Heskett, 1990), service guarantees (Hart, 1988), and long‐term customer value (Reichheld & Sasser, 1990). Hence, as specified by Grönroos (2009), “a relationship has developed when a customer perceives that a mutual way of thinking exists between customer and supplier or service provider” (p. 36). Moreover, the concept of relationship goes far beyond customers’ buying behaviour and firms’ communication strategies and is manifested by attitude and devotion (Grönroos, 2009).
Similarly, the interest of service marketing researchers in the personnel of service companies and their role in service provision stipulated the development of the internal marketing area of research (George, 1990; Berry & Parasuraman, 1991; Grönroos, 1990; Gummesson, 1987; Bowen & Lawler, 1992). The foundational premise of internal marketing stresses that satisfied employees will lead to satisfied customers (Fisk et al., 1993).
Similarly, the service marketing and specifically the focus on service encounters gave rise to the topic of customer experience (Fisk et al., 1993). Marketing and management researchers addressed the issue of customer experience already in the 1950s (e.g., Abbott, 1955; Alderson, 1957), while the roots of the experiential approach can be traced as far back as to the works of Alfred Marshall and Adam Smith (Holbrook, 2006). Particularly, Abbott (1955) proposed a utilitarian process‐based view upon customers’ experience and identified “satisfying experiences” as the desired outcome from the consumption of goods and services.
The discussion on customer experience gained new momentum in the 1980s, when Holbrook and Hirschman (1982) introduced a phenomenological perspective towards customer experience, which the authors expressed through the “Three Fs” of fantasies, feelings and fun. The experiential approach in marketing and management increased during the last two decades, when researchers drifted away from the utilitarian towards the more hedonic aspects of consumption (Palmer, 2010; Schmitt, 1999; Gupta & Vajic, 2000). Other researchers argued that a broadened view on the experience phenomenon is required and, therefore, proposed the notion of ‘total customer experience’, thus, covering all types of contacts between the consumer and the organisation, as well as consumer’s holistic experience (e.g., Harris, Harris, & Baron, 2003). However, Palmer (2010) suggests
17

that such broad definitions of experience remain circular and, at the same time, they do not contradict Abbot’s definition of experience viewed as an outcome of product consumption processes and customers’ perception of the transformation of products into value.
Thus, contemporary marketing adopts a widened view of the consumption process with consumption being an integral part of marketing models (Grönroos, 2000, 2006). Most importantly, the customers’ perspective on value gradually becomes one of the central marketing concepts, which emphasises customers’ outcome of the consumption process (Sanchez‐Fernandez & Iniesta‐Bonillo, 2007).
Hence, from the customers’ perspective, a difference between received benefits and sacrifice, including monetary price paid and non‐monetary costs invested, such as time, effort etc., constitutes the notion of the perceived value, as suggested by Zeithaml (1988). The benefit component of perceived value includes tangible attributes of a product, extrinsic product‐related intangible attributes, such as brand name, price etc., perceived quality, i.e. “consumer’s judgment about the superiority or excellence of a product” (ibid., p. 5), as well as other relevant abstractions, such as emotional payoff or highly valued states of being (Zeithaml, 1988).
Furthermore, Woodruff’s (1997) customer value framework similarly focuses on goals and purposes of consumption. Specifically, the model illustrates customer value as a “means‐end” process, when customers utilise specific attributes and attribute performances as inputs to obtain desired situational “consequence experiences”, which in turn result in achieving the goals and purposes desired by a customer (p. 142).
Most importantly, by focusing on the customer, consumption processes and customer value, marketing theory questioned the process of value creation (Sheth & Parvatiyar, 1995). Particularly, traditional marketing focuses on exchange transactions between buyers and sellers and views the value as the outcome of the production process. Hence, the value for customers is embedded in products and exchanged for money. However, relationship marketing emphasizes the process of value co‐creation in the course of cooperative interactions between the customer and the service provider or the supplier of physical products (Sheth & Parvatiyar, 1995; Prahalad & Ramaswamy, 2004; Grönroos, 2007).
Therefore, the development of the service marketing and relationship marketing, which was especially boosted by the growth of new ICT, paved the road for the shift in the marketing paradigm, which today focuses on the value‐co‐creation process and views a service as a fundamental marketing logic (Gummesson et al., 2010).
18

2.1.3. Service as a marketing logic Vargo and Lusch (2004a) brought the debate on the paradigm shift in marketing
to the wide international arena. The authors argued that service as a concept was neglected by the classic economic theory. Furthermore, according to Vargo and Lusch (2004b), differentiation between goods and services is “inaccurate and reflect[s] a view of exchange that is driven by the manufacturer’s perspective” (ibid., p. 325). The proposed alternative approach is a service‐dominant logic (i.e., S‐D logic). Vargo and Lusch (2004a) initially formulated 8 foundational premises of the S‐D logic, which they later revised after rigorous international research discussions and debates. The modified list of foundational premises of the S‐D logic (Vargo & Lusch, 2008a) includes the following statements:
FP1. Service is the fundamental basis of exchange; FP2. Indirect exchange masks the fundamental basis of exchange (i.e., when a
service is not provided directly, rather “through complex combinations of goods, money, and institutions” (ibid., p. 7);
FP3. Goods are a distribution mechanism for service provision; FP4. Operant resources are the fundamental source of competitive advantage; FP5. All economics are service economics; FP6. The customer is always a co‐creator of value; FP7. The enterprise cannot deliver value, but only offer value propositions; FP8. A service‐centred view is inherently customer oriented and relational; FP9. All social and economic actors are resource integrators; FP10. Value is always uniquely and phenomenologically determined by the
beneficiary (ibid., p. 7). Accordingly, Vargo and Lusch (2008b) define service “as the application of
specialized competences (operant resources – knowledge and skills), through deeds, processes, and performances for the benefit of another entity or the entity itself” (ibid., p. 26). Furthermore, as proposed by Grönroos (2008), the notion of value‐in‐use becomes the backbone of the service logic of contemporary marketing.
Vargo and Lusch (2004a) distinguish between value‐in‐use and value‐in‐exchange, which is captured by price and serves as an intermediary concept in the value creation process. While value‐in‐exchange is embedded in the product which is exchanged, value‐in‐use is created when a product, a good or a service, is actually used (ibid, 2004a). Therefore, value for a customer is created as a result of the interaction between a firm and a customer through the total experience of all elements, including a firm’s resources, such as physical objects (e.g., goods), information, interactions with employees, systems, infrastructures, as well as other customers. In many cases, these elements cannot be directly controlled by a firm (Vargo & Lusch, 2004a; Grönroos, 2006, 2008).
19

However, Vargo (2009) argues that value is not a discrete production‐consumption event as it is conceptualized within the goods‐dominant logic; rather, it emerges and unfolds over time. Similarly, according to Grönroos (2000), “value is perceived by customers in their internal processes and in interactions with suppliers or service providers when consuming or making use of services, goods, information, personal contacts, recovery and other elements of ongoing relationships” (ibid., p. 140). He specifies, that not only benefits and sacrifices of a particular episode of purchase or service encounter constitute customer perceived value. Rather, the value perceived by the customer is to a great extent defined by the benefits and sacrifices of a total process of customer‐provider/supplier relationships.
More precisely, value‐in‐use discloses the purpose and the benefit of resource integration for the customer. The combination of resources used as an input for value creation is always unique. Therefore, value is unique, experiential, contextually interpreted and determined only by the beneficiary. According to Vargo and Lusch (2008a), in the end, all economic and social actors, including individuals, families, firms, as well as societies and nations, interact in order to improve their own state of being. Hence, value is defined as an improvement of the beneficiary’s well‐being and its ability to fit in its environment (Vargo & Lusch 2004a, 2006; Vargo et al., 2008).
However, Grönroos (2008) argues that the notion of value‐in‐use is insufficiently conceptualized within the S‐D logic premises. Thus, the author proposed a ’service logic’ as an alternative to the “SD‐logic”, and formulated a list of service logic propositions (Grönroos, 2008). While there are many similarities between Grönroos’s (2008) and Vargo and Lusch’s (2004a, 2008a) approaches, the differences primarily concern the role of goods in the process of value co‐creation, as well as the role assigned to the service provider.
While Vargo and Lusch (2004a) consider goods as “distribution mechanisms for service provision” (ibid., 8‐9), Grönroos (2006) argues that goods are resources, which function together with other resources, such as people, systems, infrastructure and information, and interact with the customer in the process of service provision. Furthermore, Grönroos (2008) criticizes Vargo and Lusch (2008a), who argue that a firm cannot independently deliver value to a customer, but can only offer a value proposition. More specifically, according to Vargo and Lusch (2008a) a firm can offer its “applied resources for value creation and collaboratively (interactively) create value following acceptance of value propositions” (ibid., p. 7). Grönroos (2008), however, emphasizes that the role of the service provider does more than just make a value proposition, and is, thus, more strongly involved in the process of value fulfilment:
20

The firm cannot create value for customers. Its role is, first of all, to serve as value facilitator. By providing customers with value‐facilitating goods and services as input resources into customers’ self‐service value‐generating processes, the firm is indirectly involved in the customers’ value creation (ibid., p. 310).
However, despite a number of conceptual disagreements, the focus of both the
S‐D logic advocated by Vargo and Lusch (2004a, 2008a) and the service logic developed by Grönroos (2008) is on the interactive, mutual and reciprocal process of value co‐creation rather than on the exchange of units of output (Vargo, 2009).
2.1.4. Service as a value co-creation process Both a customer and a firm are resource integrators, providers and
beneficiaries. The parties provide inputs for each other’s value‐creating activities. Grönroos (2000) describes a relationship between service provider and the customer as a mutual commitment, which emerges in the process of interaction (i.e., exchange of goods, services, information, as well as all other contacts) and communication, which is an integral part of any interaction, but also occurs as a separate, planned activity, such as advertising, direct mail, etc. (ibid., p. 33‐34).
For instance, a customer integrates inputs provided by a firm (i.e., a service provided directly or through a physical good) with inputs provided by other entities, including privately and publically available resources (i.e., personal resources, as well as resources provided by family, friends, the government, etc.). A customer benefits by creating its own resources, such as knowledge and skills, which he or she can apply and exchange in the market to obtain other desired services. Customers, to a great extent, contribute to the value‐creating process of a firm indirectly through money paid, which give rights to future services provided to a firm by suppliers, employees and other stakeholders (Vargo, 2009).
Moeller (2010) employs the interactive perspective of the S‐D logic in order to develop a conceptual framework of the service process and to revisit the criticised IHIP‐based definition of services. Particularly, Moeller (2010) argues that the scientific community has not elaborated new characteristics of services, to replace the criticized IHIP‐based definition. The author investigates each of the IHIP characteristics and proposes that they are still valid and useful if the service is viewed as a process rather as a single entity.
Figure 2.1 shows Moeller’s (2010) service provision model, which specifies three sequential stages of service provision, namely, facilities, transformation and usage (i.e., FTU framework), as well as distinguishes between customers’ and providers’ resources. Service is, therefore, defined as an offering, which “includes a transformation of customer resources” (ibid., p. 361).
21

Provider’s resources include tangible, intangible and human assets, such as machines, persons, know‐how etc. “Facilities” comprise all providers’ resources, where availability is the foundation of value creation. However, the potential of the provider’s resources to be of value perishes if there is no customer demand and, consequently, no customers’ resources available for integration. Therefore, perishability concerns the potential capacity of the facilities to provide service. Customers’ resources can be a customer as a person, as well as physical or immaterial objects owned by the customer (Moeller, 2010).
By nature, customers’ resources are heterogeneous. Inseparability as a service characteristic is also connected to customers’ resources, which must be present during the stage of transformation. This inseparability has implications for the provider’s capacity to deliver a service. However, these implications are different for different types of customers’ resources. Particularly, capacity constraints are higher if a customer must directly participate in the process of resource transformation.
By contrast, intangibility as a service characteristic refers to the service offering (Moeller, 2010). According to Moeller (2010), service is offered as an intangible future performance. Hence, a service provider’s promise to transform customers’ resources is intangible in nature.
“Usage” is the outcome of the service provision. At this final stage the customer has the option to create value out of the transformation of resources. However, the heterogeneity of customers’ resources often causes heterogeneity of the outcomes of a service provision process, which emphasizes the particular importance of market segmentation (Moeller, 2010).
This interactive mutual approach of value co‐creation employed by Moeller (2010) is similar to Parasuraman’s (2002) conceptualization of service quality. The author considers that both a company and a customer contribute to service quality and benefit from service quality. From the company’s perspective the input includes labour, equipment, technology and other resources, while outputs are sales, profits, market shares and other benefits. Customers contribute to service quality by allocating their time, effort, emotional energy and other resources and receive benefits in terms of service performance, satisfaction etc.
22

Customers’ demand
Customers’ resources (heterogeneous)
Service offering
(intangible)
USAGE
TRANSFORMATION Customer’s resources must be present during transformation
process (inseparability)
Provider’s resourcesHave potential to be of value (perishable)
FACILITIES Have capacity to provide service
(perishable)
Figure 2.1. The process of service provision. Source: adapted from Moeller (2010)
23

However, Vargo, (2009) argues that customers can also directly provide services to a firm. For instance, customers can enhance the brand of a firm by adding meaning to a brand or by establishing loyalty. Cova and Dalli (2009) introduced the concept of working consumers, which perform immaterial work independently of the producer’s objectives and strategy. Working consumers, which pursue personal purposes, such as satisfaction, pleasure or social recognition, add cultural and affective elements (e.g., symbolic meanings, knowledge and emotions) to market offerings as a gift to other consumers and to the market in general.
2.1.5. Value co-creation as an experience The conceptual relationship between value and experience is particularly
addressed by Holbrook (1999, 2006), who defines the customer value as “an interactive relativistic preference experience” (ibid., p. 715), and therefore, emphasises an interaction between an object (e.g., a product) and a customer, which entails “subjective hierarchical preferences based on an individual’s situation‐specific comparisons of one object with another” (ibid., p. 715). Thus, the value for a customer is created, when products perform services, which in turn provide relevant value‐creating experiences (Holbrook, 1999).
However, Helkkula and Kelleher (2010) revealed that the relationship between experience and value does not represent a linear value chain. Rather, it represents a complex circular and dynamic process of experiencing and perceiving value, which is influenced by both previous and current, as well as future imaginary consumption experiences. More precisely, the ongoing customer experience of a service influences customer perceived value, which, in turn, influences cumulative customer service experience (ibid., p. 48). Additionally, the customer value creation process – on an individual level – can intertwine with the value creation process of other customers; therefore, the role of wider customer‐to‐customer relationships is stressed (Helkkula & Kelleher, 2010).
Therefore, the notion of value‐in‐use is similarly embedded in the customer experience concept. More precisely, Palmer (2010) argues that both hedonistic motivators and “hygiene” factors comprise customer experience. Particularly, the conceptual framework for the construct of customer experience proposed by Palmer (2010) represents a sequential process of customers’ attitude formation based on perception and affective interpretation of a diverse range of raw stimuli at the service encounter. These raw stimuli, therefore, are conceptualized as overlapping high order constructs, including tangible and process quality, brand relationships and interpersonal relationships between a customer and the service provider’s employees. Palmer (2010) particularly emphasizes the importance of non‐functional expectations communicated through brands. Furthermore, the
24

author considers emotions as a source of information to evaluate stimuli and their contribution to the experience formation process.
However, Palmer (2010) addresses a number of obstacles, which hamper the operationalization of a customer experience and the use of quantitative measurement approaches. These problems, particularly, concern the complexity of context‐specific variables, as well as the non‐linearity and complexity of customer experiences, including the uncertainty regarding optimal experience levels (Fuchs & Weiermair, 2003). At the same time, Palmer (2010) acknowledges the possibility to operationalize the customer experience concept in consistency with the notion of value‐in‐use (Vargo & Lusch, 2004a).
To sum up, the notion of value‐in‐use is the result of resource transformation and the outcome component of customer experience. More precisely, value for customer (i.e., value‐in‐use), on the one hand, is highly individual and subjective (Vargo & Lusch, 2008a). On the other hand, value is defined and communicated by a firm (e.g., a tourism destination) through the brand (e.g., Gnoth, 2007) and collectively perceived by the whole consumer community (Helkkula & Kelleher, 2010).
2.1.6. Value-co-creation within the network of relationships Vargo (2009) emphasizes the need to understand the whole value‐creation
configuration in order to enable effective customer‐relationship management. Accordingly, a provider‐customer dyad is only a part of a larger value‐creation network of relationships. Thus, Lusch, Vargo and Tanniru (2010) define a value network as “a spontaneously sensing and responding spatial and temporal structure of largely loosely coupled value proposing social and economic actors” (ibid., p. 20). The actors within the network, including a customer, customer’s network, a firm, its suppliers and other customers, interact through institutions and technology. The purpose of interaction is to co‐produce service offerings, to exchange service offerings and to co‐create value (Lusch et al., 2010).
The described network approach is in line with Grönroos’ (2006) conceptualization of the customer value as the total experience of elements, which constitute the chains of processes, interactions and outcomes. Baron and Harris (2010) developed the idea that interaction between a customer and a given firm is only one of many interactions, which constitute customers’ consumption experience. The authors introduce the notion of the experience domain, which they define as “a field of knowledge, activity and discourse that stimulates consumers to engage in purposeful interactions with a network of organizations and consumer communities in the course of experiences that are collectively understood” (ibid., p. 520). A firm, therefore, should understand the value creation process from a customers’ perspective and identify which interactions impact
25

consumer’s well‐being within an experience domain. A firm, which understands the network of consumer interactions and its place in this network, can act respectively to support consumers’ practices enhancing consumers’ value and to deal with those interactions inhibiting the value for consumers. Grönroos (2006, 2009) also emphasizes that a firm has to understand the whole
value‐creating process and integrate this knowledge into its marketing efforts. This knowledge enables a firm to make an extended offering, which acknowledges the interaction between resources provided by a firm and resources already available to a customer. However, Grönroos (2008) emphasizes that a firm is responsible for both the value proposition and the facilitation of value fulfilment. Therefore, the value proposition, as a promise of future value aimed at customers’ purchase decision, is only one aspect of a firm’s marketing activities. In order to facilitate the value fulfilment (i.e., keeping a promise) a firm has to design and manage the customers’ usage process. Direct involvements in customers’ interactions with many elements, which constitute the consumption, enables active marketing efforts during the value‐creating process and allows the firm to properly respond to customers’ expectations, adjust these expectations when necessary, and, finally, support the value creation for the customer. This interactive marketing process, which the Nordic School of marketing research labels as “interactive marketing”, impacts customers’ perception of a firm’s contribution to customers’ value creation and, therefore, is supposed to have an effect on the future purchasing behaviour and creation of customers’ loyalty.
* * * To sum up, the evolution of service marketing is closely linked to an
increased emphasis on the customer and consumption process. This shift in focus of marketing brought forward two inter‐related concepts, namely, experience and value. Therefore, the interactive process of consumption experience and value creation constitutes the foundational premises of this thesis.
This thesis particularly adopts a broadened two‐fold view on the experience phenomenon understood as both the process and the desired outcome of consumption. Most importantly, the notion of experience goes beyond the utilitarian purpose of consumption and emphasises other aspects, including hedonic, symbolic and social benefits. Furthermore, the process of customer experience covers all types of contacts related to consumption, including contacts with the firm and its suppliers, other customers, customer’s family and friends, mass‐media and other possibly related social and economic actors (Abbot, 1955; Holbrook & Hirschman, 1982; Harris et al., 2003; Mossberg, 2007; Palmer, 2010).
The customer experience concept and the notion of value, which discloses customer’s judgement about the product and its benefits (Zeithaml, 1988),
26

interrelate in a dynamic and circular way (Helkkula & Kelleher, 2010). The customer simultaneously experiences and perceives value (Holbrook, 1999). In turn, customer’s value perception influences the individually cumulated customer experience (Helkkula & Kelleher, 2010).
Therefore, value creation becomes the central issue of service marketing. Most importantly, suppliers and service providers cannot create value for customers, rather, the provider (i.e., firm) and the customer co‐create value in the course of the service process (Vargo & Lusch, 2004a, 2008a; Grönroos, 2008). Furthermore, the firm’s tangible, intangible and human resources (e.g., goods, information, physical environment, contact personnel, other customers etc.) together with the customer’s own resources serve as input to the service process and, thus, influence the outcome of service provision (Grönroos, 1982; Moeller, 2010). Hence, service as a value co‐creation process constitutes the integration and transformation of firm’s and customer’s resources, as well as the “usage” of the service process outcome by the customer (Moeller, 2010).
Notably, value is created only and if the customer made use of the service provision outcome. Hence, value‐in‐use is the term describing the purpose and the benefit of resource integration and transformation for the customer and reflects the improvement of the customer’s state of being (Vargo & Lusch, 2004a, 2008a; Vargo et al., 2008; Grönroos, 2008).
Furthermore, the value co‐creation is more than merely a service provision process. Particularly, the customer experience formation mirrors each sequential step of customer‐provider interactions and dynamically shapes the complex configuration of attitudes, perceptions, emotions and affective interpretations (Palmer, 2010). Importantly, experience formation directly interlinks with the modification of customer’s state of being and, therefore, constitutes the service process outcome, i.e., value‐in‐use (Vargo & Lusch, 2004a, 2008a; Vargo et al., 2008; Grönroos, 2008).
The mutual commitment, attitude and devotion, which evolve in the course of customer‐provider interactions, depict the relationship phenomenon (Grönroos, 2009). Relationships constitute yet another outcome of the service provision process and create the foundation for extending customer‐provider interactions beyond a single purchase/consumption event. Hence, service providers have the capacity to execute managerial actions aimed at establishing and supporting relationships, which, in turn, facilitate value creation activities and enhance consumers’ value (Grönroos, 2009).
Finally, from the customers’ prospective, a dyadic provider‐customer relationship is only a fragment of a larger value creation network, as a customer’s well‐being depends on resource inputs from various providers and even other customers (Lusch et al., 2010). Thus, understanding the total value network
27

becomes an important managerial task for a service provider (Grönroos, 2006, 2008; Baron & Harris, 2010). The following section, therefore, uses the example of tourism destination phenomenon to illustrate the value co‐creation process with an emphasis on customer experience created within a complex relationship network.
2.2. The co-creation perspective for tourism destinations Recent developments in the service marketing literature create a wide range of
implications for tourism destination management and research. Since relationships between tourists and destinations develop in time and space, the understanding of these relationships enriches the core concepts of tourism research and enables their transfer into both destination marketing and management practices.
Tourism, traditionally, belongs to service industries, together with banking and retailing. Moreover, it is widely recognized that tourism has become the world’s largest service industry (see, for example, Clancy, 1998; Cracolici & Nijkamp, 2009). Debbage and Daniels (1998) argue that the “tourist industry as a mode of production is enormous, highly commodified, and structured in ways that are fairly similar to other sectors of the economy” (ibid., p. 18). The definition of tourism from the supply‐side perspective proposed by Smith (1988) is as follows:
Tourism is the aggregate of all businesses that directly provide goods or services to facilitate business, pleasure, and leisure activities away from the home environment (ibid., p. 183).
The definition reflects the heterogeneous and customer‐centric nature of
tourism as an economic sector and a product. This approach is further developed in Debbage and Daniels (1998):
Tourism is no single product but, rather, a wide range of products and services that interact to provide an opportunity to fulfil a tourist experience that comprise both tangible parts (e.g. hotel, restaurant, or air carrier) and intangible parts (e.g. sunset, scenery, mood) (ibid., p. 23).
Furthermore, Smith (1998) and Debbage and Daniels (1998) substantiate the
amalgamation of different economic activities under the umbrella of the tourism sector by pointing at a number of evidences. First of all, functional interlinks exist between industries providing service and manufacturing goods for tourists. Furthermore, these connections continue to develop and frequently take the shape
28

of collaborations aimed at the preparation of tourism packages and the organization of regionally‐based marketing campaigns.
The other issue requiring clarification is the identification; which economic activities actually constitute tourism. According to Kotler, Bowen and Makens (2006), “the two main industries that comprise the activities we call tourism are the hospitality and travel industries” (ibid., p. 11). However Smith (1998) addresses this issue by referring to the Tourism Satellite Account (TSA), which is the statistical instrument for the analysis of the economic importance of tourism supplementing the National Statistical System (NSS). As Smith (1998) illustrates, both tourism and non‐tourism industries contribute to tourists’ consumption, while tourism industries also supply non‐tourists (i.e., residents). Therefore, a TSA developed by the World Tourism Organization (UN WTO), is designed in order to address the difficulties of quantifying economic ties and outputs of the multifaceted tourism industry. According to the methodological framework for TSA (first developed in 2000
and significantly revised in 2008) tourism industries include the accommodation, food and beverage serving industry, transport (railway, road, water, air) and rental of transport equipment, travel agencies and other reservation services, the cultural industry, the sports and recreational industry, retail‐trade of country‐specific tourism characteristic goods and other country‐specific tourism characteristic industries (UN, 2008). These industries, which “typically produce tourism characteristic products” (ibid., p. 26), belong to the group of consumption products together with tourism connected products and non‐tourism related consumption products (ibid., p. 36). However, interestingly enough, the recent version of the TSA methodology framework also distinguishes between non‐consumption products, including consumer durable goods and valuables of high unit value purchased on trips, and other non‐consumption products, comprising gross fixed capital formation of the tourism industries (i.e., land, landing rights, trademark rights etc.).
In order to address the complexity of tourism as an economic sector, the tourism marketing literature introduced the concept of tourism destination viewed as a market place where tourism demand and supply finally meet (Murphy, 1985; Goodall & Ashworth, 1988; Buhalis, 2000). Murphy, Pritchard and Smith (2000) define a tourism destination “as an amalgam of individual products and experience opportunities that combine to form a total experience of the area visited” (ibid., p. 44). The author refers to the five‐level model of the generic tourism product proposed by Smith (1994). The physical plant (i.e., resort hotel, conditions of physical environment, tourism infrastructure etc.) is the core of any tourism product, while service, hospitality, traveller’s freedom of choice and
29

physical, intellectual and emotional involvement of travellers in travel services are the outer circles of Smith’s (1994) model.
Similarly, Cracolici and Nijkamp (2009) employ a resource‐based view towards the destination considering tourist areas “as the ‘supplier’ of spatial tourist services with distinct attractiveness features (or attributes), which have to be managed effectively and efficiently, while the demander is the tourist‐consumer who wishes to enjoy a holiday experience at least equal to – or even better than – his/her past holidays” (ibid., p. 337). The authors define tourist satisfaction as the tourist’s feeling of well‐being in relation to the holiday destination, including the total leisure experience, escape and relaxation for the mind, pleasurable unique experiences, physical well‐being etc. The ability of a tourist area to satisfy tourists’ needs relatively better than other destinations is a recognized measure to assess the relative attractiveness of competing destinations (Cracolici and Nijkamp, 2009).
Tourism literature increasingly addresses the co‐creative nature of a destination experience. Fuchs (2004) proposes and empirically tests an efficiency model for tourism service processes, which is based on Parasuraman’s (2002) model of synergistic service productivity. Accordingly, destination efficiency depends on the combination of tourists’ and destination’s resources and determines benefits for both tourists and the destination. Moreover, an increase of resources from one actor reduces the required input from another actor. Particularly, if the destination’s input of resources increases, a smaller input of tourists’ resources is needed. Additionally, this relationship is moderated by the destination’s ability to properly allocate the available destination’s resources. Finally, the benefits received by tourists (i.e., service performance, satisfaction etc.) as a result of destination visitation directly convert into benefits for the destination in terms of increased sales, higher occupancy rates, market share, profits etc. (Fuchs, 2004)
The value co‐creation perspective towards conceptualization of the tourist experience is widely discussed by the Nordic School of tourism marketing. Larsen (2007) conceptualizes the tourist experience as a highly complex and purely individual psychological process by defining it as “a past personal travel‐related event strong enough to have entered long‐term memory” (ibid., p. 15). Other researchers, however, argue that destinations can actively design and to a great extent control tourist experiences (Mossberg, 2007; Ek, Larsen, Hornskov, & Mansfeldt, 2008).
While experiences exist in consumers’ minds, destinations and tourists co‐create places where the tourist experience may occur. Destinations create “experiencescapes” through substantive and communicative staging of the available elements of the physical environment devoted to tourism consumption. Thereby, tourists are guided on how to assemble, use and interpret these elements and their total experience. Similarly, tourists co‐create “experiencescapes” by direct
30

participation and allocation of their own resources, including time, money, efforts and skills (Mossberg, 2007; Arnould, Price, & Tierney, 1998; Fuchs, 2004; Gnoth, 2007; Pettersson & Getz, 2009). Thus, destinations co‐create experiences of individual tourists by communicative staging of destinations, which is represented by a unique proposition of the functional, emotional and symbolic value of the visitation (i.e., the brand) (Gnoth, 2007). In turn, tourists choose between available products and services. By utilizing a destination’s products, services and other tangible and intangible resources, tourists experience the destination and evaluate whether their experience was valuable (i.e., value in use) (Vargo & Lusch, 2004a; Moeller, 2010). Therefore, destination managers have to regularly monitor both, the resources devoted to tourism consumption and the value‐in‐use of the destination for tourists. Moreover, the link between resources and value‐in‐use has to be clearly communicated through the brand (Gnoth, 2007; Vargo & Lusch, 2004a).
31

3. CUSTOMER-BASED BRAND EQUITY MODEL: A LITERATURE REVIEW
This chapter presents a review of the literature on the topic of customer‐based brand equity (CBBE). First, the concept of brand and the CBBE model as the measure of the power of the brand are examined in light of the contemporary marketing perspective with particular focus on value‐co‐creation. Second, the state‐of‐the‐art on CBBE model development and validation in a tourism destination context is presented.
3.1. Customer-based brand equity model in light of the contemporary marketing development
This section examines the phenomenon of customer‐based brand equity (CBBE) based on the premises of the value‐co‐creation perspective described in the previous section.
3.1.1. Evolution of the brand concept A brand is one of the core marketing concepts. Until recently the following
definition of a brand dominated both the general and the tourism marketing literature:
A brand is a name, term, sign, symbol, or design, or a combination of these, intended to identify the goods or services of one seller or group of sellers and to differentiate them from those of competitors (Kotler, 2000, p. 229).
Variations of this definition existed for decades (see, for example, Kotler, 1984;
Armstrong & Kotler, 2007; Kotler & Keller, 2006). However, Grönroos (2000) argued that this definition introduces the brand concept only from the one‐way perspective of the marketer and excludes the consumption process and the customer. Furthermore, he argues that the concept of brand building is misleading, as it implies the possibility for marketers to create the brand. “If anybody builds a brand, it is the customer. The role of the marketer is to create frames for the development of a brand in the minds of customers, by providing an appropriate physical product, service process and supportive communication using various means of planned marketing communication” (ibid., p. 287). This specific understanding of brand and branding is first introduced within the service‐oriented customer relationship perspective in marketing and management developed by Grönroos (2000).
Recently, however, also the mainstream marketing literature has partly accommodated the service and customer relationship approach. As a result,
32

revised definitions of the brand concept emerged. Keller (2008) argues that there is more in a brand than just a name or a logo. With the reference to business practitioners, he claims the brand is also “something that has actually created a certain amount of awareness, reputation, prominence, and so on in the marketplace” (ibid., p. 2). Accordingly, Kotler and Keller (2009) nowadays define a brand more broadly as an offering from a known source. An offering is defined as a physical representation of the value proposition, i.e., “a set of benefits that [companies] offer to customers to satisfy their needs”. An offering can, thus, be constituted by “a combination of products, services, information, and experiences” (ibid., p. 53). Armstrong and Kotler (2009) are more precise:
Brands are more than just names and symbols. They are a key element in the company’s relationships with consumers. Brands represent consumers’ perceptions and feelings about a product and its performance – everything that the product or service means to consumers. In the final analysis, brands exist in the heads of consumers (ibid., p. 242).
The reason behind this revision of the brand concept is the change in
perspective from the goods‐centric approach towards the customer‐centric approach, which – as previously shown ‐ is in particular developed within the “service marketing paradigm” (Zeithaml et al., 1985; Grönroos, 2000; Lovelock, 2000; Gummesson, 2002; Vargo & Lusch, 2004a, 2008a). According to Grönroos (2000), this new marketing perspective focuses on the relationships with customers, who “do not look for goods or services per se; [rather] they look for solutions that serve their own value‐generating processes” (ibid., p. 4). Therefore, the value co‐creation perspective is central in the new marketing paradigm, which implies that value is created interactively and that the “customer is always a co‐creator of value” (Vargo & Lusch, 2008a, p. 7).
The branding literature gradually changed its view of the brand from being the recognizable logo for manufactured goods to rather becoming a powerful entity, which stands on its own and interacts with a customer and a firm, as well as other economic, social and cultural actors. Merz, He and Vargo (2009), particularly, employ the service‐dominant logic perspective in order to outline the evolution of the brand concept. Thus, the authors identify four stages of branding literature development depending on how the brand value is created, including (1) brand as identifier, (2) brand as functional and symbolic image, (3) relationship‐focused brand era and, finally, (4) the stakeholder‐focus brand era. Indeed, in the course of the branding literature development the role of the customer changed from being considered as an operand resource and, thus, being targeted and considered as passive recipient, to becoming an operant resource and, therefore, an active co‐creator of brand value. Moreover, the nature of the brand has been reconsidered as
33

well, from being an operand resource to becoming an operant resource. Therefore, the brand became alienated from what is actually branded (Merz et al., 2009).
The relationship‐focused brand literature (Aaker, 1991, 1996; Keller, 1993; de Chernatony, 1999; Berry, 2000) is based on the premise that the brand value is co‐created within dyadic relationships between a firm and its customers, while employees (i.e., internal customers) are considered as operant resources and important co‐creators of brand value. The stakeholder‐focus brand era, which is the latest stage of the branding literature development, is, however, based on the premise, that “the brand value co‐creation process is a continuous, social, and highly dynamic and interactive process between the firm, the brand, and all stakeholders” (Merz et al., 2009, p. 331).
Similarly, the customer‐centric conceptualization of the brand proposed by Grönroos (2000, 2009) emphasizes the brand relationship between a customer and a firm, as well as other stakeholders. Lindberg‐Repo and Grönroos (2004) define the brand relationship as a two‐way process of interaction, which affects customers’ relationship perception and experience. All kinds of contacts between a customer and a brand contribute to the formation of a differentiating image of “what is branded” in the mind of a customer, including a branded good, a service or a solution, which is a combination of goods, service, information etc.
More precisely, Grönroos (2000) distinguishes between four types of brand contacts, which form the brand relationships, comprising planned communication messages, product messages, service messages and unplanned communication messages. Communication between a customer and a brand develops over time as a flow of iterative and repetitive acts, episodes and contacts (Lindberg‐Repo & Grönroos, 2004). Planned communication messages include advertising, events, sales promotion and other activities directly launched by a marketer, while a range of unplanned communication messages embraces word of mouth communication, interaction on the Internet, information in TV news programmes, etc. Finally, product and service messages include packaging and usage of physical goods, access to information, interaction with employees at a service counter, the payment process, etc.
34

3.1.2. The concept of the customer-based brand equity (CBBE) The contemporary service‐oriented marketing perspective enables the
understanding of the customer‐based brand equity (CBBE) as the customers’ evaluation of the different stages of brand value co‐creation, as well as the depth of developed customer‐brand relationships (Aaker, 1996; Keller, 1993, 2008; Grönroos, 2000, 2009; Merz et al., 2009).
Brand equity is typically considered as the measure of the power of the brand, which provides the assessment of the past marketing efforts’ effectiveness, evaluates the success of brand positioning, and predicts the future brand performance (Aaker, 1991, 1996; Keller, 1993, 2003). From a general perspective, it is traditionally defined in terms of the differentiation effect, which the customers’ knowledge of the brand name has on customers’ response to a product or a service (Keller, 1993; Lassar et al., 1995). De Chernatony and McDonald (2003) specify brand equity as the overall utility that customers place in a brand compared to its competitors. Furthermore, Grönroos (2000) indicates that, from the service marketing perspective, the brand equity is the outcome of continuously developing brand relationships.
Aaker (1991, 1996) and Keller (1993) advocate the multidimensional conceptualization of customer‐based brand equity (CBBE). Particularly, Aaker (1996) defines brand equity as a set of assets and liabilities, including brand name awareness, brand loyalty, perceived quality and brand associations, which are “linked to a brand’s name and symbol that adds to (or subtracts from) the value provided by a product or service to a firm and/or that firm’s customers” (ibid., 7‐8).
Today, the CBBE model is a well‐established marketing concept (Aaker, 1991, 1996; Keller, 1993, 2008). Keller (2008, 2009) extends the CBBE model in order to also address the consumer knowledge structure behind the brand development and to reflect the relationship building process between customers and the brand. Specifically, the model reflects the CBBE pyramid (i.e. hierarchy) consisting of six brand building blocks corresponding to four stages of brand development (Figure 3.1).
The first stage of the brand‐customer relationship development relates to the establishment of the brand identity, which, according to Grönroos (2000, 2009), represents the brand image a firm wants a customer to develop. Keller (2009) identifies that the brand identity corresponds to the brand salience block of the CBBE model and has brand awareness as the branding objective. However, a potential customer is subjected to various communication messages, including those planned by a service provider, and those which a firm cannot control, such as information from friends and relatives, other customers, mass‐media, etc. (Grönroos, 2000).
35

Resonance
RELATIONSHIPS
RESPONSE
BRAND MEANING
Brand salience
BRAND IDENTITY
Feelings
Imagery
Performance
Judgements
Brand building blocks
Figure 3.1. Hierarchical model of brand development and CBBE formation.
Source: adapted from Keller (2008, 2009)
Aaker (1996) distinguishes between six levels of brand awareness. Brand
recognition is the consumer’s ability to recognize the name of the brand when the brand name is mentioned. Brand recall is the ability to independently bring to mind the brand name if asked to name brands in a product category. Top‐of‐mind awareness occurs if the brand name is mentioned first in a recall task. Brand dominance is a situation when only one brand name is recalled. Brand knowledge is what a customer knows about the brand. Finally, brand opinion is the highest
36

level of awareness, when a customer has a very individual opinion about the brand.
The second stage is defined as the creation of brand meaning. This stage corresponds to two building blocks of the model, namely performance, which is the product as it is, and imagery representing intangible aspects of the brand. Imagery and performance together constitute the “brand associations” dimension of the CBBE model, which refers to the customers’ ability to identify and to evaluate the attributes and benefits of the brand (Aaker, 1996; Keller, 2008).
Within the contemporary marketing service perspective (Grönroos, 2000, 2009; Vargo & Lusch, 2004a, 2008a) the attributes and the benefits promised by the brand are introduced through the notion of value‐co‐creation. Particularly, at the stage of brand meaning creation the brand awareness gradually transforms into the customers’ evaluation of the offering from a brand, which Moeller (2010) defines as a provider’s promise to transform customers’ resources by integrating them with the provider’s resources in order to satisfy customers’ needs and, thereby, to improve their state of being.
In Keller’s (1993) conceptualization of the brand and CBBE model, the tangible and intangible resources offered by the brand represent the brand attributes, including product‐related attributes, which are category‐specific characteristics of the product performance or service function, and non‐product related attributes. Non‐product‐related attributes include price information, packaging or other visual information, as well as user imagery and usage imagery, including customers’ associations of a typical brand user and consumption contexts. Furthermore, the attributes of the user and usage imagery can generate attributes of brand personality, such as “youthful”, “gentle” etc., which reflect emotions or feelings evoked by the brand.
The benefits component of Keller’s (1993, 2008) CBBE model encloses “the personal value consumers attach to the product or service attributes – that is, what consumers think the product or service can do for them” (Keller, 1993, p. 4). Brand benefits correspond to three hierarchical levels, including functional, experiential and symbolic benefits. Functional and experiential benefits are linked to product/service attributes. More precisely, functional benefits satisfy basic needs of consumers connected with problem removal or avoidance, respectively. By contrast, experiential benefits relate to feelings evoked by the use of the product or service and satisfy such needs as sensory pleasure, cognitive stimulation, etc. Finally, symbolic benefits relate primarily to non‐product related brand attributes. These are rather abstract advantages, such as social approval or personal expression achieved by using the brand.
Therefore, Keller’s definition of brand benefits complies with the notion of value‐in‐use, which is created when a product, a good or a service, is actually utilised (Vargo & Lusch, 2004a; Grönroos, 2008). Particularly, the brand benefits on the attribute level correspond to various resources, which a firm provides to a
37
customer, including physical objects (e.g. goods), information, interactions with employees, systems, infrastructures, as well as other customers (Grönroos, 2006, 2008). In turn, experiential as well as symbolic benefits are the outcomes of integration and transformation of customers’ and provider’s resources (Vargo & Lusch, 2004a; Grönroos, 2006, 2008; Moeller, 2010).
Brand response is the third stage of the brand development process (Keller, 2008). This stage is aimed at receiving positive reactions to the brand and also consists of two blocks: judgements and feelings. Overall brand evaluations based on customers’ beliefs about brand attributes and benefits constitute brand attitudes, which form the basis of customers’ behaviour towards the brand (Keller, 1993). According to Aaker (1996), loyalty is a core dimension of the brand equity. Hence, predecessor dimensions of the brand equity model can be evaluated based on their ability to influence the formation of customer loyalty in terms of willingness to pay a premium price, repurchase, recommend to others etc. Finally, resonance is the brand building block placed on the top of the CBBE pyramid. This block corresponds to the final and fourth stage of brand development, labelled as “relationships”, which aims primarily at the establishment of intense and active loyalty (Keller, 2008, 2009).
Together, the brand response and brand relationship stages of the brand development correspond to Oliver’s (1997, 1999) customer loyalty conceptualization, which encompasses four consecutive stages of loyalty development including cognitive, affective, conative and action loyalty. Cognitive loyalty refers to customers’ assessment of brand attributes based on received information or personal experience, when a customer concludes that a given brand performs better than its alternatives (product superiority). The affective loyalty stage occurs if satisfying usage occasions cumulate and create pleasurable fulfilment. At this stage, when a customer likes the brand, the bond is already stronger than during the cognitive stage, when a customer is still open to counterarguments and switches to other brands easily. Finally, conative loyalty is the stage of customers’ commitment to repurchase. However, at this stage commitment exists only in the form of behavioural intention, which can remain unaccomplished. Action loyalty is the customers’ action state of inertial re‐buying even if there are obstacles to overcome. It is the highest degree of loyalty, which, however, is also vulnerable if the customer is repeatedly dissatisfied or obstacles to buy are too high.
Although the CBBE model for goods and services is extensively elaborated on a theoretical base, further empirical development of model operationalization and harmonization of survey‐based brand metrics remain an acute issue, even for the general marketing field focusing on consumer goods. Studies in this area brought forth a broad range of competing CBBE models and instruments for measurement. However, the boundaries between dimensions of CBBE models are often vague,
38

and overlaps in measuring different constructs may be observed (Lehman, Keller, & Farley, 2008).
Lehman et al. (2008) addressed this issue by suggesting a parsimonious set of survey‐based brand metrics and by examining relationships between them in order to deduce a measurement instrument valid for any product or service being sold on any geographical market. The same authors further established a set of brand performance metrics by thoroughly examining several different research models and findings. More precisely, they extracted 27 dimensions of brand performance attempting to balance parsimony and completeness. The resulting set of brand performance measurement consisted of 84 items. Based on pilot study results the authors slightly modified the measurement scales and examined the underlying factor structure of selected brand performance measures.
Lehman et al.’s (2008) study identified six brand performance factors: comprehension (i.e. presence, awareness and knowledge: “how much the brand is seen and thought of”); comparative advantage (i.e. difference, esteem, performance, advantage and acceptability: “how favourable regarded and well differentiated the branded product is?”); interpersonal relations (i.e. caring, prestige, service and innovation: “interpersonal and social aspects”); history (i.e. heritage and nostalgia: “past brand‐related events, episodes and emotions”); preference (i.e. bonding, loyalty, intention, value for money, overall attitude, extension potential: “consumer attitudes toward the brand and its purchase”); and attachment (i.e. persistence and activity: “how strongly consumers connect to and interact with the brand”) (ibid., p. 49). Finally, the empirical analysis of structural relationships between the validated factors allowed for discovering four stages of brand performance, namely (1) awareness (i.e., brand comprehension), (2) image and associations (i.e. represented by comparative advantage, interpersonal relations, and history specified as three individual constructs), (3) preference and (4) attachment (Lehman et al., 2008). Thus, Lehman et al. (2008) empirically confirm Keller’s (2008) theoretical conceptualization of the CBBE model. 3.2. CBBE model for tourism destination
This section provides an extensive review of the existing tourism marketing literature on customer‐based brand equity modelling in a tourism destination context. Furthermore, this section compares prior findings in tourism literature and identifies the gaps in the CBBE model conceptualization for tourism destinations.
39

3.2.1. CBBE concept in a tourism destination context In tourism research the destination branding topic was, until recently,
shadowed by image studies (Konecnik & Gartner, 2007; Pike, 2009; Boo et al., 2009). However, since destination branding was introduced in the early 2000s it became the “hottest topic” in the field of destination marketing research (Morgan et al., 2004). According to Buhalis (2000), a destination’s name is a brand name for an amalgam of tourism products, services and integrated consumer experiences offered by a destination.
Accordingly, Blain et al. (2005) define destination branding as a set of the following marketing activities:
‐ supporting the creation of a name, symbol, logo etc. with the aim to identify and differentiate a destination;
‐ communicating the expectation of a memorable travel experience uniquely associated with the destination;
‐ establishing and reinforcing the emotional connection between the visitor and the destination;
‐ reducing search costs and perceived risk for the consumer. The goal of these activities is to create a destination image, which positively
influences the consumer’s destination choice (ibid., p. 337). Moreover, Blain et al. (2005) suggest, that the application of relationship management tools and practices to maintain and enhance tourists’ loyalty should also be considered as a goal of destination branding, as it similarly contributes to the long‐term success of tourist destinations.
While interest in destination branding keeps on growing, the issue of destination brand performance measurement has only recently attracted attention in tourism research (Pike, 2009). Pike (2009) identifies destination brand equity measurement and tracking as one of the main research streams in the field of destination branding. However, according to Gartner (2009), destination brand equity remains the concept, which is insufficiently elaborated from a theoretical point of view. Product brand equity can be expressed as additional monetary returns for the branded product in comparison with its generic (i.e., non‐branded) equivalent. If there is no generic equivalent, which is typically the case for geographical places, like tourism destinations, such a monetary approach cannot be directly applied. Therefore, a more feasible approach is to relate destination brand equity to the number of tourists choosing the destination, purchase behaviour comprising expenditures and duration of stay, as well as to tourists’ loyalty behaviour towards the destination in terms of repeat visitation and word‐of‐mouth (Gartner, 2009).
Destination brand equity research primarily focuses on the development of destination brand performance models, thus, better enabling the measurement of the marketing effectiveness on the level of tourism destinations, as well as the prediction of the destination’s brand performance in the future. Therefore, in the
40

destination context, brand equity is typically studied from the customers’ perspective. Particularly, the research literature on tourism destination marketing applies Aaker’s (1996) and Keller’s (1993) multidimensional conceptualization of customer‐based brand equity (CBBE). Moreover, the customer‐based brand equity concept is considered to be more relevant and valuable from the managerial point of view than the strict financial evaluation of the brand equity (Pike, 2009).
The issue of destination brand equity measurement has only recently attracted attention. By applying Aaker’s (1996) and Keller’s (1993) CBBE concept, tourism scholars view the customer‐based brand equity model for a tourism destination as “the sum of factors contributing to a brand’s value in the consumer’s mind” (Konecnik & Gartner, 2007, p. 401). More precisely, Konecnik and Gartner (2007) were the first ones to apply the CBBE model in a destination context. The authors argue that image should not be viewed as the single factor explaining tourists’ decision making process; thus, the image construct has been isolated from other brand dimensions. Hence, the model is defined as a higher‐order construct, where awareness, image, quality and loyalty are specified as model sub‐dimensions. Recently, the authors replicated the model validation with new data derived from a sample of potential repeat and renewal visitors from Germany to Slovenia (Gartner & Konecnik Ruzzier, 2010).
While Konecnik and Gartner (2007) validate a measurement model, Boo et al. (2009), Pike et al. (2010), Chen and Myagmarsuren (2010) and Kladou and Kehagias (2014) specify their CBBE for tourism destination as a structural model examining causal relationships between model dimensions. Furthermore, Horng et al. (2012), Im et al. (2012) and Bianchi et al. (2014) examine how the destination brand equity model dimensions influence destination brand loyalty, visit intentions and destination preference.
Other studies focus on the relationships between destination brand equity and other related constructs beyond the brand equity model framework, such as social influence (Evangelista & Dioko, 2011), destination involvement (Kim et al., 2009), or enduring travel involvement (Ferns & Walls, 2012). Interestingly, while Ferns and Walls (2012) isolate the CBBE model dimensions, Kim et al. (2009) specify destination brand equity, but as a first‐order construct (i.e., different to the higher‐order construct as defined in Konecnik & Gartner, 2007) conceptually consistent with Aaker’s (1991) and Keller’s (1993) perspective. However, Evangelista and Dioko (2011) follow by conceptualizing brand equity as a higher‐order (i.e. five dimensional) construct, thus, following Lassar et al.’s (1995) framework differently from Aaker’s (1991, 1996) and Keller’s (1993) dimensionality. Finally, Garcia et al. (2012) suggest that destination brand equity analysis should not be limited to the customers’ (i.e., tourists’) perspective, but rather equally integrate other stakeholders’ importance for the creation of brand value, including entrepreneurs
41
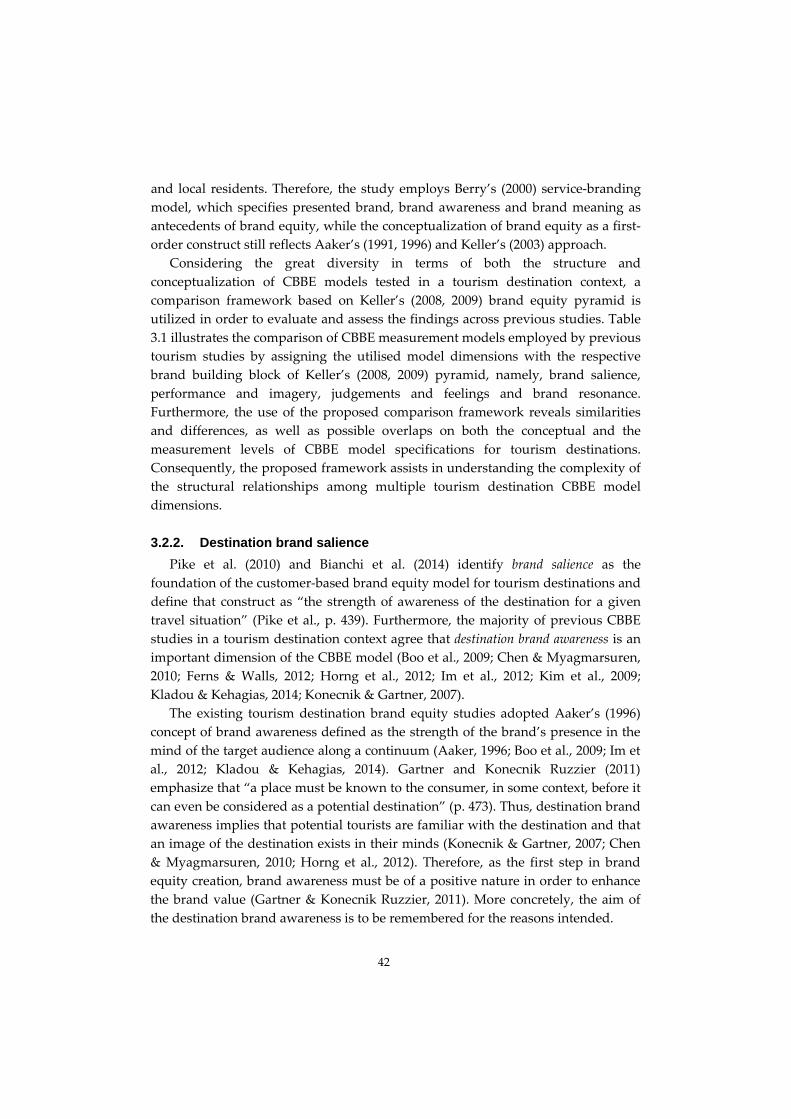
and local residents. Therefore, the study employs Berry’s (2000) service‐branding model, which specifies presented brand, brand awareness and brand meaning as antecedents of brand equity, while the conceptualization of brand equity as a first‐order construct still reflects Aaker’s (1991, 1996) and Keller’s (2003) approach.
Considering the great diversity in terms of both the structure and conceptualization of CBBE models tested in a tourism destination context, a comparison framework based on Keller’s (2008, 2009) brand equity pyramid is utilized in order to evaluate and assess the findings across previous studies. Table 3.1 illustrates the comparison of CBBE measurement models employed by previous tourism studies by assigning the utilised model dimensions with the respective brand building block of Keller’s (2008, 2009) pyramid, namely, brand salience, performance and imagery, judgements and feelings and brand resonance. Furthermore, the use of the proposed comparison framework reveals similarities and differences, as well as possible overlaps on both the conceptual and the measurement levels of CBBE model specifications for tourism destinations. Consequently, the proposed framework assists in understanding the complexity of the structural relationships among multiple tourism destination CBBE model dimensions. 3.2.2. Destination brand salience
Pike et al. (2010) and Bianchi et al. (2014) identify brand salience as the foundation of the customer‐based brand equity model for tourism destinations and define that construct as “the strength of awareness of the destination for a given travel situation” (Pike et al., p. 439). Furthermore, the majority of previous CBBE studies in a tourism destination context agree that destination brand awareness is an important dimension of the CBBE model (Boo et al., 2009; Chen & Myagmarsuren, 2010; Ferns & Walls, 2012; Horng et al., 2012; Im et al., 2012; Kim et al., 2009; Kladou & Kehagias, 2014; Konecnik & Gartner, 2007).
The existing tourism destination brand equity studies adopted Aaker’s (1996) concept of brand awareness defined as the strength of the brand’s presence in the mind of the target audience along a continuum (Aaker, 1996; Boo et al., 2009; Im et al., 2012; Kladou & Kehagias, 2014). Gartner and Konecnik Ruzzier (2011) emphasize that “a place must be known to the consumer, in some context, before it can even be considered as a potential destination” (p. 473). Thus, destination brand awareness implies that potential tourists are familiar with the destination and that an image of the destination exists in their minds (Konecnik & Gartner, 2007; Chen & Myagmarsuren, 2010; Horng et al., 2012). Therefore, as the first step in brand equity creation, brand awareness must be of a positive nature in order to enhance the brand value (Gartner & Konecnik Ruzzier, 2011). More concretely, the aim of the destination brand awareness is to be remembered for the reasons intended.
42

43
Table 3.1. Comparison of CBBE measurement models in previous tourism destination studies
Study Brand Building BlocksBrand Salience (Identity)
Performance and Imagery (Meaning)
Judgments and Feelings (Response)
Brand Resonance (Relationships)
Bianchi et al., 2014 ‐ Brand salience ‐ Quality ‐ Image ‐ Value
‐ Loyalty
Boo et al., 2009 ‐ Awareness ‐ ‐ ‐ Image ‐ Quality ‐ Experience (revised
model) ‐ Value
‐ Loyalty
Chen & Myagmarsuren, 2010
‐ Awareness ‐ Image ‐ Quality
‐ Satisfaction (*) ‐ Loyalty (*)
Evangelista & Dioko, 2011
‐ ‐ ‐ ‐ ‐ Image ‐ Performance ‐ Trust ‐ Value
‐ Attachment
Ferns & Walls, 2012 ‐ Awareness ‐ Image ‐ Quality ‐ Experience (revised
model)
‐ ‐ ‐ Loyalty ‐ Visit intention (*)

44
Table 3.1. (continues)
Study Brand Building BlocksBrand Salience (Identity)
Performance and Imagery (Meaning)
Judgments and Feelings (Response)
Brand Resonance (Relationships)
Garcia et al., 2012 ‐ Presented Brand (*)‐ Awareness (*)
‐ ‐ Brand meaning (*) ‐ Quality (**)
‐ Loyalty (**) ‐ Word‐of‐mouth
(**) Horng et al., 2012 ‐ Awareness ‐ Image
‐ Quality ‐ ‐ ‐ Loyalty
‐ Travel intentions (*)
Im et al., 2012 ‐‐ Awareness ‐ Image ‐ Brand associations Overall Brand Equity
‐ Loyalty (*) – the construct is not part of the CBBE model (**) ‐ single item, part of Destination Brand Equity construct measurement

Moreover, in many instances the source of destination awareness is the negative coverage in media, particularly in the context of natural disasters or terrorist threats. In this case, awareness is of negative value and, therefore, may be harmful for tourism destinations (Aaker, 1996; Pike et al., 2010; Gartner & Konecnik Ruzzier, 2011). Additionally, the development of community‐based social media (e.g., Facebook, Twitter etc.) has a rapidly increasing impact on destination awareness as other people besides just friends and relatives become the source of destination brand awareness beyond destination control (Xiang & Gretzel, 2010).
Garcia et al. (2012) do not consider brand awareness as part of brand equity, which, rather, is specified as a separate construct. Awareness, however, is one of the model dimensions and an antecedent of brand equity, which is an outcome construct of the service‐branding model (Berry, 2000). Evangelista and Dioko (2011) is the only study that does not consider brand
awareness as a dimension of a CBBE model for tourism destinations. Destination awareness exists on different levels, from low to high, including
brand recognition, brand recall, familiarity, top‐of‐mind awareness, brand dominance and brand knowledge (Aaker, 1996; Bianchi et al., 2014; Boo et al., 2009; Ferns & Walls, 2012; Garcia et al., 2012; Im et al., 2012; Pike et al., 2010; Konecnik & Gartner, 2007). However, there is still lack of agreement on how to measure the destination awareness construct.
Most studies integrate the ability to recall destination characteristics as an important element of destination brand awareness (Bianchi et al., 2014; Boo et al., 2009; Chen & Myagmarsuren, 2010; Ferns & Walls, 2012; Horng et al., 2012; Im et al., 2012; Kladou & Kehagias, 2014; Konecnik & Gartner, 2007; Pike et al., 2010). However, Garcia et al. (2012) integrate dominance, destination brand recall and recognition as the core elements of destination awareness. Similarly, Ferns and Walls (2012) and Im et al. (2014) consider the ability to recognize the destination among other travel destinations as part of the awareness construct measurement, while destination brand recall is the measure of top‐of‐mind awareness in Boo et al. (2009), Horng et al. (2012) and Kladou and Kehagias (2014). Furthermore, Pike et al. (2010), Ferns and Walls (2012) and Bianchi et al. (2014) employ the recall of destination advertising as the destination awareness metric. Other destination awareness measures include familiarity (Bianchi et al., 2014; Boo et al., 2009; Kladou & Kehagias, 2014; Pike et al., 2010), good name and reputation (Bianchi et al., 2014; Boo et al., 2009; Horng et al., 2012; Konecnik & Gartner, 2007), general awareness (Chen & Myagmarsuren, 2010; Ferns & Walls, 2012; Im et al., 2012) and general perception of the destination among tourists (i.e., positive or negative) (Chen & Myagmarsuren, 2010). Finally, Kim et al. (2009) consider destination knowledge as a single metric representing the awareness dimension of the CBBE model, which is defined as a first‐order construct.
45

Kladou and Kehagias (2014) seek to integrate the brand assets (Aaker, 1991) as a dimension in their CBBE model in the context of a cultural tourism destination and as the direct antecedent of the destination awareness construct. While Aaker (1991) identify brand assets as patents, trademarks and channel relationships, Kladou and Kehagias (2014) acknowledge that such a proprietary approach can hardly be directly transferred to destinations. Therefore, their study defines cultural brand assets as specific cultural representations, which “are the reason why tourists perceive a destinaton as unique” (ibid., p. 4). More specifically, iconic monuments and heritage sites, museums and art centres, events and cultural festivals, entertainment and nightlife options, traditions and cusine, which make the cultural destination unique in the eyes of potential tourists, may represent the assets of the cultural destination brand dimension. Furthermore, the study confirms that cultural brand assets positively influence awareness.
Another empirically confirmed antecedent of destination awareness is the presented brand (Garcia et al., 2012). The construct reflects the part of Berry’s (2000) service‐branding model by representing the brand message, including the brand name, logo and their visual presentation conceptualized and promoted by a tourism destination. The key characteristics of the presented brand particularly include being “appealing”, “attractive” and “interesting”, respectively.
Finally, Ferns and Walls (2012) examine and empirically confirm that enduring travel involvement has a direct positive effect on destination awareness as a dimension of the CBBE model for tourism destination. The study defines the enduring travel involvement as the person’s motivational state reflecting a person’s degree of interest in travel, arousal or emotional attachment one has to travel, the value the person prescribes to the pleasure of travel, as well as the perceived relevance of travel to the individual (ibid., p. 28).
In tourism literature the notion of awareness is also closely related to the information sources utilised by tourists, as well as the concept of familiarity. Particularly, Baloglu and McCleary (1999) address various information sources as the determinants of destination image. Similarly, Baloglu (2001) distinguishes between informational destination familiarity, which is based on previously used information, and experiential destination familiarity, which reflects previous destination experience. Particularly, in the course of the trip a tourist directly experiences only part of a destination’s offering in terms of available activities, sights etc. Therefore, an image of this part of the destination offering, which a tourist has not yet directly experienced, is based on various information sources (Baloglu, 2001).
Moreover, the study by Beerli and Martin (2004) illustrates the importance of information sources, which are beyond direct control of the destination management. The authors find that guidebooks and media, which represent
46

secondary autonomous sources of information, as well as word of mouth from family and friends, significantly contribute to the formation of cognitive destination image.
Overall, tourism destination research has reached an agreement, that brand salience, defined as the strength of destination awareness, is an important tourism destination brand equity model dimension and a first step in brand equity creation. However, there is no agreement on the construct operationalization, as the only destination awareness measure consistently employed across previous studies is the ability to recall destination characteristics. Moreover, tourism research identifies other theoretical constructs, which conceptually belong to the brand salience brand equity block and overlap with destination awareness on the measurement level. Particularly destination familiarity and the use of destination information sources are both specified as theoretical concepts closely related to destination awareness (Baloglu & McClearly, 1999; Baloglu, 2001; Beerli & Martin, 2004), and integrated into the destination awareness measurement scale (Boo et al., 2009; Bianchi et al., 2014; Ferns & Walls, 2012; Kladou & Kehagias, 2014; Pike et al., 2010). Furthermore, destination brand equity research proposes that tourists’ perception of various brand messages, including the ones directly disseminated by the destination (i.e., “presented brand” in Garcia et al., 2012) and existing in form of iconic cultural representations (e.g., brand assets in Kladou & Kehagias, 2014), are integrated into the brand equity model framework as direct antecedents of the destination awareness construct.
Thus, the literature analysis reveals the need for further theoretical and methodological discussions on the operationalization of the brand salience model block. However, because of the prior tourism destination CBBE literature findings, for the purpose of theoretical model development and awareness construct operationalization, this thesis will also emphasize aspects of destination characteristics recall, as well as the presence of information sources as most universally recognized. 3.2.3. Destination brand performance and imagery
Most tourism destination CBBE studies integrate the attribute‐based conceptualization of destination image and (or) perceived destination quality as CBBE model dimensions. Since attribute‐based image and quality reflect the characteristics and features of the tourism destination product, the two constructs belong to the destination brand performance and imagery building block of the CBBE model (Keller, 2009). Chen and Myagmarsuren (2010), Ferns and Walls (2012), Horng et al. (2012) and Konecnik and Gartner (2007) include both constructs as CBBE model dimensions. Furthermore, on the level of destination attributes, Im et al. (2012) empirically consider only the destination image, while
47

Bianchi et al. (2014), Kladou and Kehagias (2014) and Pike et al. (2010) solely consider the perceived quality of destination characteristics.
The studies accept Keller’s (1993) conceptualization of brand image and, therefore, define the destination brand image as perceptions of the destination’s brand reflected by a distinct set of associations, such as knowledge, beliefs, feelings and global impressions about a destination, which consumers hold in memory and connect to the destination name (Chen & Myagmarsuren, 2010; Ferns & Walls, 2012; Im et al., 2012).
Brand quality as a key dimension of CBBE is defined as the perception of the overall quality or superiority of a product or service (Aaker, 1991; Bianchi et al., 2014; Boo et al., 2009; Keller, 2003). The term is often used interchangeably with perceived quality (Ferns & Walls, 2012; Pike et al., 2010). Tourism studies follow Parasuraman et al. (1985, 1988) by discussing the concept of perceived quality as a comparison between customers’ expectations and actual performance, thus, reflecting the overall judgment or an attitude towards the excellence of service delivery (Chen & Myagmarsuren, 2010; Horng et al., 2012; Pike et al., 2010). Thus, the destination brand quality is defined as “travelers’ perception of a destination’s ability to fulfil their expectation” (Ferns & Walls, 2012, p. 29). Furthermore, Chen and Tsai (2007) describe the perceived trip quality as the representation of on‐site experience.
In destination image studies the specificity of tourism destinations is traditionally addressed by employing the framework proposed by Echtner and Ritchie (1991, 1993). They suggested a three‐dimensional framework for destination image conceptualization. The dimensions include attribute‐based and holistic images, functional and psychological characteristics as well as common and unique images of destinations. Therefore, Echtner and Ritchie (1991, 1993) conceptualize the destination image as a continuum. On the one end of the continuum the “common” functional and psychological characteristics are located, which can be easily ‘utilized’ by the customer to make comparisons across different destinations. On the other end the “unique” sights, events, as well as feelings and auras are located, which are abstract holistic impressions typically difficult to verbalize.
This approach was promoted by Gallarza, Saura and Garcia (2002), who further developed the conceptual framework of destination image particularly focusing on attribute‐based image metrics. The authors identified the 20 most common attributes used in tourism destination image studies and organized these attributes along a functional (i.e. tangible)/psychological (i.e. intangible) axis. The most frequently found attributes were “residents’ receptiveness”, “landscape and/or surroundings”, “cultural attractions”, “sport facilities” and “price, value, cost” (ibid., p. 63).
48
Therefore, the attribute‐based approach presumes that destination brand image reflects the destination resources, which make the destination attractive in the eyes of potential tourists (Horng et al., 2012; Im et al., 2012; Konecnik & Gartner, 2007). Similarly, destination brand quality in many instances refers to the quality of attributes for a destination brand as perceived by tourists (Bianchi et al., 2014, p. 217).
Konecnik and Gartner (2007) developed the measurement scale for both image and quality constructs by combining in‐depth interviews and the literature review based on Echtner and Ritchie (1993), Gallarza et al. (2002) and Mazanec (1994) for both constructs, as well as Baker and Crompton (2000), Ekinci and Riley (2001) and Murphy et al. (2000) for the quality construct specifically. Consequently, the scales developed by Konecnik and Gartner (2007) are partly employed or modified by Pike et al. (2010), Chen and Myagmarsuren (2010), Ferns and Walls (2012), Horng et al. (2012) and Bianchi et al. (2014). However, Im et al. (2012) develop a set of destination image attributes solely based on in‐depth interviews and focus groups, thus, taking into consideration the specificity of both the selected destination (i.e., Korea) and the specific niche market (i.e., Muslim culture in Malaysia as the sending country). Similarly, Ferns and Walls utilise focus groups in order to reflect the specificity of US Midwest as a tourist destination for the operationalization of the image and quality constructs. Furthermore, Horng et al. (2012), and Kladou and Kehagias (2014) modify the literature‐based scales by considering the specificity of culinary tourism in Taiwan and urban cultural tourism in Rome, respectively.
Therefore, there are only few attributes employed by several studies simultaneously. Accommodation facilities is the most commonly evaluated destination attribute put into scope by six tourism destination brand equity studies as part of both image and quality construct measurement (Bianchi et al., 2014; Chen & Myagmarsuren, 2010; Ferns & Walls, 2012; Im et al., 2012; Konecnik & Gartner, 2007; Pike et al., 2010). Furthermore, tourism destination brand equity research suggests that infrastructure, cleanliness, safety, history and culture, shopping, attractive urban areas, dining, nightlife and entertainment, events, atmosphere, service personnel, as well as lack of communication and language barriers also should be put in the scope when discussing both destination image and quality on the attribute level. Furthermore, while nature and scenery is the most commonly employed destination image attribute (Chen & Myagmarsuren, 2010; Ferns & Walls, 2012; Im et al., 2012; Konecnik & Gartner, 2007), other less frequently utilised image attributes include weather, activities, recreation opportunities, friendliness of locals, beaches, political stability, being featured in movies and on TV, religion, sightseeing, technology, water sports and family
49

vacation opportunities. Finally, cultural experience and unpolluted environment represent common aspects of destination quality.
While Chen and Myagmarsuren (2010) empirically demonstrate the positive antecedent‐consequent relationship between attribute‐based image and quality, Konecnik and Gartner (2007) and Ferns and Walls (2012) found a high correlation between the two constructs. Furthermore, Ferns and Walls (2012) respond to the poor model fit by revising the model and combining image and quality into a new latent construct of destination brand experience as suggested by Boo et al. (2009).
The discussed studies display the positive relationship between the brand salience level of the tourism destination brand equity model and customers’ perception of tourism destination attributes, although results remain inconclusive. Particularly, Pike et al. (2010) and Kladou and Kehagias (2014) empirically confirm the positive effect of brand awareness (salience) on perceived quality of destination attributes. However, the relationship between the two constructs in Chen and Myagmarsuren (2010) is non‐significant, while the study confirms the relationship between awareness and attribute‐based image. Furthermore, Kladou and Kehagias (2014) test and empirically confirm the post‐hoc hypothesis on the positive influence of cultural brand assets evaluation on brand quality. Additionally, Ferns and Walls (2012) confirm the hypothesis on the positive relationship between enduring travel involvement and the experience of destination attributes.
Thus, to sum up, the examination of attribute‐based destination image and quality as CBBE model dimensions demonstrates that tourism destination brand equity research has reached an agreement that situational, destination‐specific attributes should be selected in order to operationalize the performance and imagery brand building block. However, empirical results illustrate that attribute‐based image and quality greatly overlap on the measurement level and, therefore, can well constitute a single construct, e.g., “destination brand experience” manifested by the quality of experienced destination attributes (Ferns & Walls, 2012). 3.2.4. Judgments and feelings
Most tourism CBBE studies at hand, except Konecnik and Gartner (2007), Ferns and Walls (2012) and Horng et al. (2012), integrate various brand equity model sub‐dimensions depicting the overall evaluations and emotional responses towards the destination brand. However, the representation “judgments and feelings” as the destination brand equity building block (Keller, 2009) across previous tourism destination studies remains highly fragmented and mutually inclusive.
Boo et al. (2009) follow Keller (2003) and Lassar et al. (1995) when conceptualizing the brand quality through the brand performance dimension in
50

terms of the destination’s ability to meet tourists’ functional needs (p. 221). Similarly, in Evangelista and Dioko (2011), performance as ʺthe perceived utility that one derives from visiting a destination relative to the cost of doing soʺ (p. 318) is one of the brand equity model dimensions. On the measurement level Evangelista and Dioko (2011) employ the brand performance scale utilised by Lassar et al. (1995), which integrates the assessment of overall quality and performance superiority, while Boo et al. (2009), additionally, deduce measures of experience quality and quality consistency from Aaker (1991) and Sweeney and Soutar (2001). Furthermore, Garcia et al. (2012) include the measure of overall quality as part of the first‐order reflective brand equity construct (Berry, 2000).
In Evangelista and Dioko (2011) trust is the brand equity dimension (Lassar et al., 1995), representing the credibility sub‐dimension of the “judgements and feelings” brand building block (Keller, 2009). Trust is defined as “the confidence visitors place on the people, tourism bureaus and tourism service providers that market a destination” (ibid., p. 318). The measurement includes such aspects as trustworthiness, being caring and not taking advantage of consumers (Lassar et al., 1995; Evangelista & Dioko, 2011). Similarly, Garcia et al. (2012) include dimensions of trust as destination reliability, and believability as destination credibility to measure brand meaning as an isolated dimension of Berry’s (2000) service branding model and direct antecedent of brand equity. Additionally, the brand meaning construct includes such aspects as the personality of the destination brand and pleasant sensations evoked by the destination (Garcia et al., 2012).
Im et al. (2012), Kladou and Kehagias (2014) and Bianchi et al. (2014) consider brand associations as an important dimension of the CBBE model for tourism destinations. However, the studies demonstrate a lack of agreement on how to conceptualize the brand associations construct. Im et al. (2012) follow Aaker (1991), Keller (1993) and Low and Lamb (2000), and combine the overall quality and positive destination attitude as the brand association components. Kladou and Kehagias (2014), on the contrary, define brand associations in terms of the overall brand image perceptions and employ the measures of brand personality (i.e., authentic and interesting) and trust for construct operationalization. Therefore, however, the construct partly overlaps with brand meaning (Garcia et al., 2012) and trust as isolated brand equity model dimensions (Evangelista & Dioko, 2011). Similarly, Kim et al. (2009) incorporate “uniqueness” and “popularity” as single metrics representing brand associations and perceived quality dimensions of the first‐order reflective destination brand equity construct.
Bianchi et al. (2014) use the notion of destination brand association interchangeably with destination brand image. The study defines and operationalizes the construct in the same way as Boo et al. (2009), while Pike et al. (2010) and Evangelista and Dioko (2011) define and operationalize destination brand image as
51

limited to “visitor’s perceptions of the social esteem in which a destination is held by the visitor’s social group” (Evangelista & Dioko, 2011, p. 318). The construct measurement particularly includes aspects of social recognition and consistency of brand image with a person’s self‐image and personality (Lassar et al., 1995). Interestingly, the attribute‐based image measurement in Horng et al. (2012) includes one self‐image item, which, in contrast to other items depicting various attributes of Taiwan as a culinary tourism destination, serves as a measure of whether the destination choice “reflects who I am” (Horng et al., 2012).
Boo et al. (2009), Evangelista and Dioko (2011) and Bianchi et al. (2014) are the only studies considering destination brand value as an isolated dimension of the CBBE model. The studies follow Lassar et al. (1995) and Zeithaml and Bitner (2000) in adopting the price‐based definition of value as the customers’ perception of the balance between a product’s price and its perceived utility. The construct measurement is similar across the three studies and includes such aspects as value for money, reasonable price, and being a bargain relative to benefits one receives. Similarly, Kim et al. (2009) consider destination value for destination visitation as part of a CBBE first‐order construct measurement. Furthermore, Chen and Myagmarsuren (2010) and Horng et al. (2012) include price‐based value as part of the perceived quality of destination attributes.
Kim et al., 2009 and Chen and Myagmarsuren (2010) examine the relationships between brand equity and tourist satisfaction, although both studies avoid specifying the construct as part of the brand equity model. However, de Chernatony et al. (2004) demonstrate that in a (e.g. tourism) service context satisfaction is “conceptualised as an attitude‐like judgement after a purchase, or an interaction with a services provider” (p. 22), thus, should be considered as a relevant CBBE model dimension (de Chernatony et al., 2004).
Boo et al. (2009) empirically test the relationships within the “judgements and feelings” model block. Particularly, the study confirms that social image and self‐image positively influence value for money, while, interestingly enough, the relationship between perceived quality and value was only confirmed empirically for one out of two samples. Moreover, destination awareness has a direct positive effect on cultural brand assets (Kladou & Kehagias, 2014) and social and self‐image (Pike et al., 2010), while Boo et al. (2009) reject the hypothesis on the relationship between destination awareness and value for money. Additionally, “presented brand”, as an isolated dimension of Berry’s (2000) service branding model, directly influences the brand meaning perception (Garcia et al., 2012). Furthermore, Pike et al. (2010) test and empirically confirm the post‐hoc hypothesis on positive influence of perceived quality of destination attributes on social image and self‐image. Interestingly, Kladou and Kehagias (2014) reveal that brand associations positively influence the perceived quality of destination attributes. However, this
52

reverse relationship is similarly tested as a post‐hoc hypothesis and, therefore, is insufficiently justified from a theoretical point of view. Finally, Chen and Myagmarsuren (2010) confirmed that quality of destination attributes directly influence satisfaction, while the relationship between attribute‐based image and satisfaction was found as non‐significant.
Since Boo et al. (2009) reported inconsistent path relationships among their tourism destination CBBE model constructs across two samples, satisfactory (yet not perfect) goodness‐of‐fit indices, as well as high correlation between image and quality, they suggest that tourists’ previous experience might overshadow the model’s image dimension. Therefore, Boo et al. (2009) propose an alternative modelling approach and introduce destination brand experience as a new latent construct combining destination brand image and destination brand quality. Interestingly enough, the study demonstrates that awareness is a direct antecedent of destination brand experience, which in turn, directly influences value for money.
Overall, the examination of model dimensions representing the judgements and feelings block of the destination brand equity model reveals, that tourism studies emphasize the judgements component of the model specified as overall quality and credibility of the brand. Simultaneously, the benefits of using the brand are only partly represented by the social image dimension and, to some extent, by destination satisfaction. However, as suggested by Christodoulides and de Chernatony (2010), it is essential to integrate measures of overall product experience as part of the brand equity operationalization. Nonetheless, present tourism brand equity research ignores the emotional response dimensions, such as fun and excitement, which Keller (2008, 2009) conceptually identifies as significant sub‐dimensions of the judgements and feelings block of the brand equity pyramid. The only exception is one item (i.e., pleasant sensations) employed by Garcia et al. (2012) as part of their brand meaning measurement scale.
Therefore, this thesis aims at eliminating this gap by integrating destination‐specific emotional brand value dimensions as part of the proposed brand equity modelling and measurement (Gnoth, 2007; Keller, 2008, 2009). 3.2.5. Destination brand resonance
The interest in the repeat visitation phenomenon in tourism keeps on growing. Back and Parks (2003) applied Oliver’s (1997, 1999) model in the context of the hospitality industry. The authors could confirm that satisfied customers repurchase if they become attitudinally (i.e., cognitively‐affectively‐conatively) loyal to a brand. Moreover, the authors conclude that customers who have strong beliefs about the superiority of a product, are emotionally attached and strongly committed to a brand, will tolerate higher prices and, thus, generate more profit.
53

Moreover, Alegre and Juaneda (2006) investigate how repeat visitation, knowledge of a destination and quality of place influence tourist expenditures. Interestingly, empirical results show that repeat visitors, who have a better knowledge of the destination and, therefore, make more efficient choices regarding resource use before and during visitation, spend less than first‐time visitors. However, at the same time, destination quality triggers tourists’ expenditures. Thus, the authors conclude that repeat visitors have already achieved high degree of satisfaction, and, therefore, they are prepared to pay more for quality than first‐timers.
By following the general marketing literature, tourism literature commonly agrees that loyalty and attachment constitute the core of the destination’s brand equity and, thus, represent a major goal of destination brand measurement and management (Boo et al., 2009; Horng et al., 2012; Kladou & Kehagias, 2014). Indeed, according to Keller (2009), loyalty and attachment are crucial dimensions of brand resonance, which is at the top of the brand equity model pyramid.
Destination brand loyalty represents the level of attachment a potential tourist has to a destination brand (Boo et al., 2009; Ferns & Walls, 2012; Kladou & Kehagias, 2014; Pike et al., 2010). Evangelista and Dioko (2011) follow Lassar et al. (1995) by including destination attachment as the CBBE model dimension.
Tourism research distinguishes between behavioural and attitudinal loyalty. Behavioural destination brand loyalty is defined as tourists’ repeat visits to a destination and positive word of mouth referrals (Konecnik & Gartner, 2007). In turn, attitudinal destination brand loyalty is about “making a choice based on attributes and benefits to be obtained from travel to a particular place modified by one’s attitudes toward those benefits” (Gartner & Konecnik Ruzzier, 2011, p. 474). Therefore, attitudinal destination brand loyalty is manifested by the intention to revisit and recommend visiting the destination to others, as well as by the ‘brand commitment’ in terms of preference and disposition towards a destination brand. Moreover, destination loyalty presumes that a potential traveller has a greater confidence in the destination brand compared to its competitors, which translates into a willingness to pay a premium price (Bianchi et al., 2014; Boo et al., 2009; Chen & Myagmarsuren, 2010; Ferns & Walls, 2012; Im et al., 2012; Horng et al., 2012; Pike et al., 2010; Konecnik & Gartner, 2007).
While most studies specify attitudinal destination brand loyalty as an isolated construct, tourism literature shows a lack of agreement on the measurement and its related measurement scales. Preference (i.e., destination as a preferred choice for a vacation) and willingness to recommend are the most commonly employed measures of attitudinal destination brand loyalty. Particularly, Konecnik and Gartner (2007), Boo et al. (2009), Pike et al. (2010), Im et al. (2012), Bianchi et al. (2014) and Kladou and Kehagias (2014) consider both destination loyalty dimensions. Furthermore, willingness to recommend represents destination loyalty
54

in Chen and Myagmarsuren (2010), Horng et al. (2012) and Garcia et al. (2012), whereas Kim et al. (2009) Ferns and Walls (2012) employ tourists’ preference as the loyalty measure.
Fewer studies, including Konecnik and Gartner (2007), Pike et al. (2010), Chen and Myagmarsuren (2010), Im et al. (2012) and Bianchi et al. (2014), also integrate the revisit intention as part of destination loyalty. Interestingly, Ferns and Walls (2012) and Horng et al. (2012) specify the destination (re)visit intention as a separate construct directly influenced by loyalty. The construct, however, remains outside the CBBE model framework. Similarly, Kim et al (2009) empirically demonstrate that satisfaction mediates the relationship between customer‐based brand equity (CBBE) and revisit intention, as well as between CBBE and willingness to spend money. Specifically, Kim et al (2009) identify CBBE as a first order construct, which combines overall quality and loyalty dimensions. Finally, Im et al. (2012) exhibit the positive relationship between destination loyalty and overall brand equity defined as a construct capturing “the comparison of a particular destination brand against its competitors” (p. 396) manifested by a greater degree of destination preference.
Other less common destination loyalty measures particularly include overall loyalty (Boo et al., 2009; Ferns & Walls, 2012; Garcia et al., 2012; Im et al., 2012), enjoying the destination (Boo et al., 2009; Horng et al., 2012; Kadou & Kehagias, 2014), readiness to pay a price premium (Kim et al., 2009; Im et al., 2012), destination benefits (Konecnik & Gartner, 2007; Pike et al, 2010), confidence (Horng et al., 2012) and meeting the expectations (Kladou & Kehagias, 2014).
Identifying the drivers behind destination brand loyalty is an important task for destination brand equity research. Unsurprisingly, most hypothesised relationships empirically tested across previous studies involve loyalty or other related dimensions of brand resonance. Nevertheless, some results remain contradictory and inconclusive. First of all, Pike et al. (2010) confirm the relationship between destination awareness and loyalty as a post hoc hypothesis, while Im et al. (2012) reject the hypothesis, and Bianchi et al. (2014) confirm the hypothesis for only two out of three samples. Furthermore, Ferns and Walls (2012) and Horng et al. (2012) demonstrate a positive influence of destination awareness on (re)visit intention, while Im et al. (2012) confirm the relationship between awareness and overall brand equity (i.e., destination preference).
The relationship between attribute‐based image and loyalty is confirmed by Im et al. (2012) and rejected by Chen and Myagmarsuren (2010). Similarly, Pike et al. (2010) and Kladou and Kehagias (2014) confirm that perceived quality of destination attributes positively influence loyalty, while Chen and Myagmarsuren (2010) and Bianchi et al. (2014) reject the hypothesis. Furthermore, attribute‐based image and quality positively influence travel intentions (Horng et al., 2010).
55

Similarly, Ferns and Walls (2012) confirm a positive relationship between destination experience as a combination of attribute‐based image and quality and visit intentions. Finally, the relationship between attribute‐based image and overall brand equity tested by Im et al. (2012) turns out to be non‐significant.
The results, however, are more consistent when it comes to destination judgements and feelings influencing destination brand resonance. More concretely, tourism research clearly confirms that brand associations (Im et al., 2012; Kladou & Kehagias, 2014), perceived quality (Boo et al., 2009), social image and self‐image (Boo et al., 2009; Pike et al., 2010), value for money (Boo et al., 2009; Bianchi et al., 2014) and satisfaction (Chen & Myagmarsuren, 2010) are direct antecedents of destination brand loyalty. Furthermore, tourist satisfaction has a direct positive effect both on revisit intention and willingness to spend money (Kim et al., 2009), while brand associations directly influence overall brand equity (Im et al., 2012).
Finally, Ferns and Walls (2012) confirm that enduring travel involvement, defined as personal relevance of travel activity, influences destination loyalty. Similarly, Kim et al. (2009) confirm that involvement, defined as tourists’ expressed interest in visiting particular destinations, influences destination brand equity.
Therefore, despite general agreement that attitudinal destination loyalty represents the brand resonance as the brand building block placed on the top of the tourism destination “brand equity pyramid” (Keller, 2009), the issue of the inner structure and the measurement of the construct has not yet been satisfactorily resolved. Furthermore, it is difficult to distinguish between attitudes and actions when it comes to “liking” or “loving” the brand, “being confident” of the brand, etc. Thus, the destination brand resonance overlaps with destination judgements and feelings on the level of both isolated constructs and single measures. Particularly, “attachment” is a brand attitude measure in Im et al. (2012) and an isolated construct in Evangelista and Dioko (2011). Similarly, “trust” is an isolated construct in Evangelista and Dioko (2011) and part of the measurement scale for brand meaning (Garcia et al., 2012) and brand associations (Kladou & Kehagias, 2014). Furthermore, “benefits” in Konecnik and Gartner (2007) and Pike et al. (2010), as well as “enjoyment” in Boo et al. (2009), Horng et al. (2012) and Kladou and Kehagias (2014), employed as part of the loyalty construct operationalization, semantically belong to the judgements and feelings destination brand building block.
Hence, this study focuses on destination preference, willingness to recommend and intention to return as the most commonly utilised core dimensions of the attitudinal destination brand loyalty. At the same time, however, the study emphasizes the need for continuing the theoretical discussion on the phenomenon of destination brand loyalty and its operationalization.
56

3.2.6. Understanding the hierarchy of CBBE model dimensions for tourism destination
Figure 3.2 summarizes the findings gained through previous tourism studies, which go beyond the CBBE model measurement task and, especially, also examine causal relationships between various dimensions of the destination brand equity pyramid. The figure, particularly illustrates the relationships tested by previous tourism destination brand equity studies, including relationships found both, between and within the Keller’s (2008, 2009) model blocks. The diagram, however, does not show the relationships between “brand equity” specified as a first or second order construct and other isolated CBBE dimensions. Therefore, the comparison framework based on Keller’s (2008, 2009) brand equity pyramid enables identifying the gaps both on the measurement level and on the structural composition level of CBBE models across existing tourism studies.
Overall, the findings in tourism studies support the hierarchy of Keller’s framework. Particularly, the causal relationships between directly adjacent model blocks are consistently confirmed. However, the results of hypothesis testing are contradictory and frequently disconfirmed when the blocks located in the centre of the model are omitted (e.g., the relationships between destination awareness and overall destination brand judgement dimensions, influence of awareness on destination loyalty, as well the direct impact of attribute‐based image and quality on loyalty).
However, as illustrated by the discussion above, conceptualization of model building blocks across previous studies remains highly fragmented. Consequently, only few hypotheses are tested by two studies or more. Furthermore, only the relationships between destination awareness and destination brand resonance dimensions (i.e., loyalty and (re)visit intentions), attribute‐based quality and destination loyalty, as well as destination awareness and attribute‐based quality have been tested by three or more studies. By contrast, fewer relationships have been empirically confirmed by at least two studies without being disconfirmed by the other study. Finally, the positive influence of consistency of tourists’ self‐image with destination brand on destination brand loyalty is the only relationship tested and confirmed by three studies, which has not been disconfirmed by any other study (Bianchi et al., 2014; Boo et al., 2009; Pike et al., 2009).
The diagram, which shows all the previously tested hypotheses as one meta‐model reveals that most causal paths represent direct causal relationships between various brand equity dimensions and destination brand loyalty, while the inner core of the model (i.e., the mechanisms of the transformation of destination performance and imagery into customers’ destination judgements and feelings)
57

58
PQatt IM (post‐hoc) PQatt SAT IMatt SAT (n.s.)
PQatt BA (post hoc)
DESTINATION BRAND SALIENCE
AST AW PB AW
DESTINATION PERFORMANCE AND IMAGERY IMatt PQatt
DESTINATION JUDGMENTS AND
FEELINGS IM V PQ V (n.s. for 1 sample) EX V
DESTINATION BRAND
RESONANCE LOY VI LOY OBE
BA LOY IM LOY PQ LOY V LOY EX LOY (n.s.)
BA OBE SAT LOY SAT VI SAT WtS
AW BA; AW IM; AW EX; AW V (n.s.); PB BM
AW LOY (1 study – n.s. for 1 sample; 1 study – post hoc, 1 study – n.s.); AW VI; AW OBE
AST PQatt (post hoc) AW IMatt AW PQatt
(2 studies – confirmed; 1 study – n.s.)
IMatt LOY(1 study – confirmed; 1 study – n.s.); IMatt VI; IMatt OBE (n.s.); PQatt LOY (2 studies – confirmed; 2 studies – n.s.); PQatt VI; EXatt LOY
AW – awareness, AST – brand assets; PB – Presented brand; IMatt – attribute‐based image; PQatt – perceived quality of destination attributes; EXatt – experience of destination attributes; BA – brand associations; BM – brand meaning; IM – social image and self‐image; PQ – perceived destination quality; EX – destination experience; V – value for money; SAT – satisfaction; LOY – loyalty; VI – intention to (re)visit; WtS – willingness to spend money; OBE – overall brand equity Figure 3.2. Summary of findings in previous tourism destination brand equity studies

still remains a “black box”. As demonstrated by the destination brand equity literature review presented above, there is no consistency in the conceptual interpretation of the attribute‐based and overall image, as well as quality constructs among previous tourism destination brand equity studies, which results both in measurement gaps, inconsistencies, and overlaps.
Therefore, it is proposed in this study that the value co‐creation perspective resolves this disputable issue regarding the conceptualization and operationalization of both the image and quality constructs, respectively. Particularly, on the measurement level, both attribute‐based image and quality relate to the customers’ perception of promised, experienced and remembered performance of destination resources, which, in turn contribute, or have the potential to contribute, to customers’ value‐in‐use (Vargo & Lusch, 2004a; Grönroos, 2000, 2009).
The authors of previous CBBE studies in a tourism destination context (e.g., Konecnik & Gartner, 2007; Boo et al., 2009; Pike et al., 2010), particularly, point at the difficulties with model conceptualization and measurement, which are primarily explained by the huge complexity and multidimensionality of tourism destinations compared to physical goods and less complex services. Indeed, the mentioned complexity of the tourism destination is the primary reason, why measurement scales developed for consumer products and services cannot be directly applied in a tourism destination context (Pike, 2009; Gartner, 2009).
However, in the current study it is assumed that for the proposed value co‐creation perspective, both the complexity and multidimensionality of the tourism destination should not be regarded as a problem, but, rather, as an advantage. Particularly the tourism destination viewed as an amalgam of various service products and experience opportunities (Murphy et al., 2000) is an illustration of the value network concept: more precisely, the idea behind the concept of the value network is the co‐production of service offerings, the exchange of service offerings and value co‐creation from a customers’ perspective (Vargo, 2009; Lusch et al., 2010). Thus, a tourism destination shows the natural setting to understand the value creation process from a customers’ perspective and, consequently, to identify, which interactions most strongly impact total customer experience (Grönroos, 2006; Baron & Harris, 2010).
59

4. CONCEPTUAL FRAMEWORK
This section depicts the theoretical model of the customer‐based brand equity for tourism destinations (CBDBE) from a value co‐creation perspective. First, the destination brand promise is introduced as the core of the destination brand equity pyramid. Second, the model dimensions are defined, comprising destination awareness, perceived destination brand promise (i.e., tangible, intangible and social destination resources, value‐in‐use and value for money), and destination loyalty. Finally, a set of literature‐based hypotheses is presented.
4.1. Destination promise This thesis utilizes the value co‐creation perspective in order to improve the
CBBE model for tourism destinations in accordance with the latest developments in the service marketing theory. Particularly, the thesis proposes a clear distinction between (1) consumers’ evaluation of resources they receive from service providers, and (2) expected, experienced or obtained outcomes of resource transformation processes. Therefore, customers’ perception of tourism providers’ resources and obtained benefits constitute the two core dimensions of the proposed CBDBE model.
Figure 4.1 illustrates the dynamic process of brand equity formation from the value co‐creation perspective as discussed in the contemporary marketing literature. The proposed framework is based on Keller’s (1993, 2008) approach on brand equity conceptualization, which integrates the interactive process of relationship development between the customer and the brand, as well as a brand’s communication and a customers’ perception of the transformation of the product/service attributes into benefits for the customer.
Hence, the CBBE model is based on the premises that value‐in‐use for a customer is (1) promised by a firm through the brand (i.e., value proposition), (2) co‐created by a firm and a customer, and (3) evaluated by a customer, depending on how his/her state of being has modified in the result of interaction with the brand on the different stages of brand relationship development (Grönroos, 2000, 2006, 2008, 2009; Vargo & Lusch, 2004a, 2008a). Furthermore, as it is particularly emphasized by Grönroos (2000, 2009) and Lindberg‐Repo and Grönroos (2004), the firm’s marketing department is not the only source of the brand’s promise. Rather, the functional characteristics of the products used as input for the service process, the employees involved at the service encounter, as well as the service systems, other customers, competitors, media and various other entities, which convey the messages regarding the brand of a certain service provider, all contribute to the articulation of the brand’s promise.
60

Brand meaning
Brand relationships
After consumption
During consumption
Before consumption
t
BRAND DEVELOPMENT STAGES
Brand awareness
Fulfilled promise
Process of value
fulfilment (keeping promise)
Offering (brand promise)
Brand attitudes, attachment and activity (cognitive,
affective and conative brand loyalty)
BRAND CONTACTS
Unplanned communication
messages
Product messages
Planned communication
messages
Service messages
Brand identity
Brand response
Figure 4.1. The process of customer-based brand equity formation from a value-co-creation perspective. Source: adapted from Keller (2008), Grönroos (2006, 2009)
61

Thus, the perceived brand promise constitutes the core component of the proposed model of customer‐based brand equity formation. Particularly, the customer evaluates both the input and the output components of the brand’s promise, including the service provider’s resources, as well as the ability of the service provider to effectively contribute to the customers’ value creation process.
Therefore, the brand’s ability (1) to, first of all, promise value to the customer, (2) to facilitate the process of value fulfilment and, (3) to encourage the customer to have a continuous relationship with the brand, constitutes the value of the brand for a firm. Accordingly, the brand equity is a tool for measuring the brand’s value from the firm’s perspective.
Hence, this thesis proposes that destination resources, customers’ benefits and value for money together comprise the perceived destination brand promise reflected by the inner core of the destination brand equity model pyramid (Figure 4.2).
Particularly, Gnoth (2007) conceptualizes the destination brand as a representation of the functional, emotional and symbolic values of the destination, as well as the benefits, which tourists are promised to receive as the result of their service consumption (Gnoth, 2007, p. 348). This view is consistent with the service marketing discussion on value co‐creation and, specifically, the need to distinguish between the value‐in‐use and value‐in‐exchange (Vargo & Lusch, 2004a; Grönroos, 2009).
Core values, like the cultural, social and natural dimensions of destination resources, are, therefore, utilized as inputs for service provision aimed at satisfying tourists’ needs. Thus, destinations are viewed as a promise to transform customers’ resources; the inherent value concept is communicated through the brand, which is collectively perceived by homogenous tourist segments (Ek et al., 2008). Consequently, the destination promise as the inner part of the CBDBE model should include customers’ evaluation in terms of functional, intangible and human resources provided by the destination, the value‐in‐use as tourists’ benefits from destination visitation, and, finally, the price‐based value as the destination’s value‐in‐exchange.
4.2. The CBDBE model dimensions As shown by Figure 4.2, this thesis proposes that CBDBE is a multidimensional
model, which represents the full structure of consumer knowledge standing behind the destination brand development and, by doing so, depicts the hierarchical process of relationship building between the tourist and the destination brand, as proposed by Keller (2008, 2009). Thus, it is suggested that the CBDBE model consists of the following five distinct constructs:
62
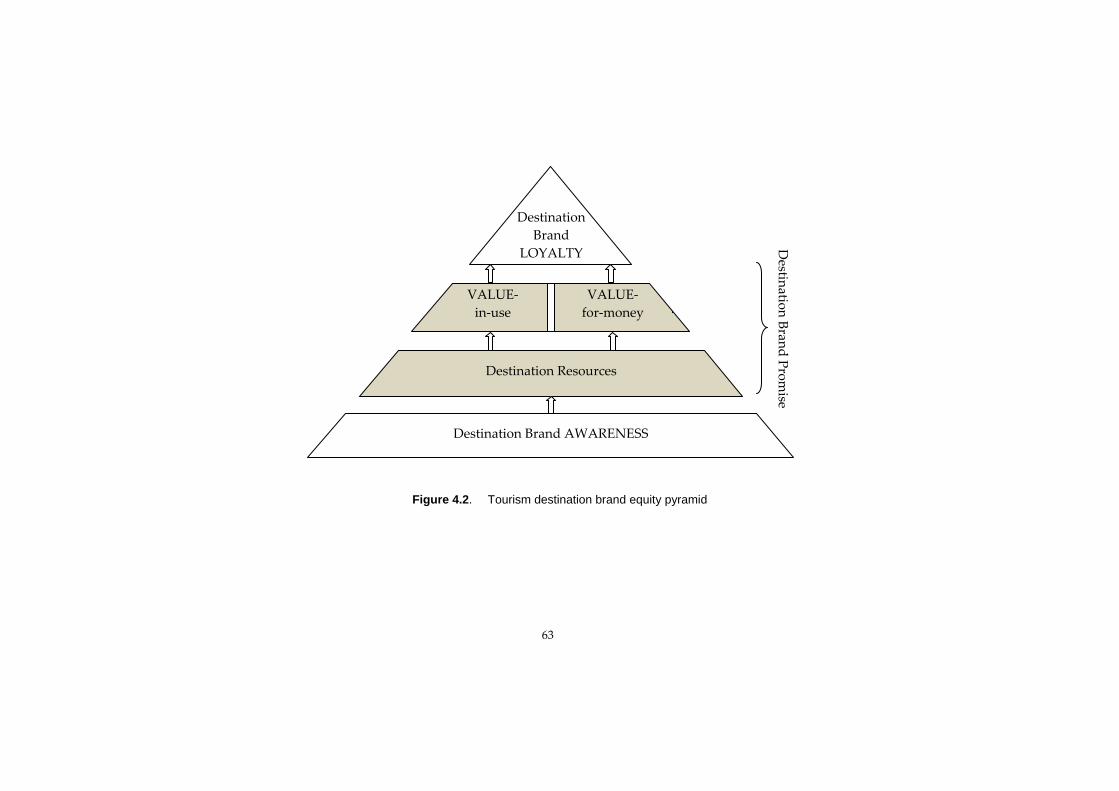
63
Figure 4.2. Tourism destination brand equity pyramid
Destination Brand AWARENESS
Destination Resources
VALUE‐ in‐use
VALUE‐ for‐money
Destination Brand
LOYALTY Destination Brand Prom
ise

‐ Destination brand awareness; ‐ Customers’ perception of a) functional, b) intangible, and c) social
destination resources; ‐ Customers’ perception of value‐in‐use; ‐ Customers’ perception of value‐for‐money; ‐ Destination brand loyalty. Accordingly, destination brand awareness is represented as an isolated CBDBE
model construct, which reflects the first stage of the brand relationship development. Destination brand awareness represents the strength of destination brand presence in the mind of potential tourists along with a continuum from low to high and is a prerequisite for including a destination in the consideration set by potential tourists (Aaker, 1996; Gartner, 2009; Boo et al., 2009; Pike et al., 2010; Gartner & Konecnik Ruzzier, 2011; Im et al., 2012; Kladou & Kehagias, 2014).
As specified by Aaker (1996), brand awareness emerges on six different levels. Therefore, the ability of potential tourists to recognize the destination name when it is mentioned refers to the brand recognition as the lowest level of destination brand awareness (Ferns & Walls, 2012; Garcia et al., 2012; Im et al., 2014). Destination brand recall is the ability to independently bring in mind the destination name when asked to name destinations of a particular category (e.g., cultural tourism destinations, culinary tourism destinations, gaming destinations etc.) or tourist destinations in general, while top‐of‐mind destination awareness can be observed if the name of a destination is mentioned first in a recall task (Gartner, 2009; Boo et al., 2009; Garcia et al., 2012; Horng et al., 2012; Kladou & Kehagias, 2014). Destination brand dominance implies that a certain destination name is the only one which comes to a tourist’s mind when he or she is asked to think of a tourist destination (Gartner, 2009; Garcia et al., 2012). Furthermore, destination brand knowledge refers to what potential tourists know about the brand, including destination characteristics, recall of advertising, and other facts and information distinguishing a destination among others (Konecnik & Gartner, 2007; Boo et al., 2009; Pike et al., 2010). Finally, destination opinion is the highest level of destination brand awareness, which occurs if a potential tourist has a very individual opinion about the destination, particularly if the destination has a good name and reputation (Konecnik & Gartner, 2007; Boo et al., 2009).
Most importantly, however, destinations can only partly control various communication messages which constitute the sources of destination brand awareness (Grönroos, 2000). Therefore, family and friends, mass‐media, and other customers are important sources of information about a tourism destination. While positive information about a destination clearly shows potentials for brand development, negative information implies risks for the development of the brand, and, consequently, creates negative destination brand awareness (Gartner, 2009).
64

This implication becomes increasingly important along with the worldwide use of social media and their growing influence on tourists decision‐making and information and communication behaviour (Xiang & Gretzel, 2010). Hence, in order to enhance the destination brand equity, the destination brand awareness must be of a positive nature (Gartner, 2009). Destination resources are defined as destination‐specific dimensions of the
complex tourism experiences, including tourism destination products and services, as well as various intangible characteristics of a destination and social interactions. The availability of resources is unique for every destination, while the configuration of required and experienced resources is unique for every tourist in a particular visitation context (Palmer, 2010; Zabkar, Brencic, & Dmtrovic, 2010; Moeller, 2010).
Tangible, intangible and human resources available for tourism consumption are widely addressed in the tourism marketing literature (Bianchi et al., 2014; Chen & Myagmarsuren, 2010; Echtner & Ritchie, 1991, 1993; Ferns & Walls, 2012; Gallarza et al., 2002; Horng et al., 2012; Im et al., 2012; Konecnik & Gartner, 2007). As previously discussed, attribute‐based image and quality represent functional, intangible and social resources of a tourism destination within the CBDBE model framework. However, conceptualization and measurement of both constructs greatly overlap, while studies integrating attribute‐based image and quality simultaneously report high correlations between the constructs (e.g., Konecnik & Gartner, 2007; Ferns & Walls, 2012). Thus, this thesis proposes resolving this issue by following Ferns and Walls (2012) and by combining the attribute‐based image and quality into a single dimension considering customers’ perception of promised, experienced and remembered performance on the level of destination resources which contribute to the formation of tourists’ benefits from destination visitation (Larsen, 2007).
The value‐in‐use for a tourist, on the contrary, represents the tourists’ state of being as the result of visiting the destination. Particularly, as discussed in the previous chapter, customer value is created within a dynamic and hierarchical means‐end process of utilizing product attributes in order to obtain desired experiences, thus achieving the customer’s goals and purposes of consumption (Woodruff, 1997). Furthermore, Sheth, Newman and Gross (1991) identify emotional, social and epistemic value among the perceived value dimensions. Specifically, emotional value is the utility derived from the feelings or affection generated by a product; social value represents the enhancement of a social self‐concept; epistemic value reflects the capacity of a product “to arouse curiosity, provide novelty, and/or satisfy a desire for knowledge” (ibid., p. 162). Therefore, emotional experience, social recognition, novelty and knowledge constitute the
65

dimensions of modification of a customers’ state of being, and, consequently, represent value‐in‐use for a customer.
Similarly, Holbrook’s (1999, 2006) customer value typology integrates the hedonic value as an intrinsic self‐oriented pleasurable experience of fun or aesthetic enjoyment, as well as the extrinsic other‐oriented social value of status‐enhancement, or improving the self‐esteem in the result of consumption. Additionally, Holbrook (2006) identifies intrinsic (i.e. other‐oriented) altruistic values, which presumes that “others” also benefit as a result of consumption. For a consumer, the altruistic value therefore represents engagement in ethically desirable practices, such as charity or other practise involving societal or community benefit. The experiential state of spiritual ecstasy is, however, the other instance of altruistic customer value. Furthermore, Komppula and Gartner (2013) suggest that Holbrookʹs typology should be extended to include “togetherness” as a new dimension of the intrinsic other‐oriented value component. Particularly, active togetherness is defined as a tourists’ “need to offer and share experiences for and with the loved ones”, while reactive togetherness is “the reaction of those accepting this offer” (ibid., p. 168).
In the tourism context, the value‐in‐use of a destination can also be exemplified on the basis of Crompton’s (1979) classification of benefits of destination visitation for tourists in terms of satisfying internal socio‐psychological needs. These benefits include, among others, push motivation factors of destination visitation, such as escape from routine environments, exploration and evaluation of self, relaxation, social recognition, social interaction, novelty seeking, and knowledge (Crompton, 1979).
Klenosky (2002) applies a means‐end approach to empirically examine relationships between pull and push motivation factors of destination choice. Pull factors (i.e., historical and cultural attractions, natural resources, location, activities etc.) are considered as ‘means’ employed to achieve rather abstract benefits (‘ends’), which correspond to travel pull motivations (i.e., fun and enjoyment, self esteem, excitement, etc.). Similarly, Komppula (2005) applies Woodruff’s (1997) customer value hierarchy in a rural tourism setting in order to illustrate the link between the attributes of the tourist product (e.g., nature and nature‐based activities, accommodation facilities, destination accessibility, etc.), customers’ “desired consequence experiences” (i.e., spending the holiday in the countryside), and the desired “end” states of peace, quite and being “rush‐free” (Komppula, 2005).
Furthermore, prior research (e.g., Pan & Ryan, 2007; Skår, Oden, & Vistad, 2008; Raadik, Cottrell, Fredman, Ritter, & Newman, 2010; Haukeland, Grue, & Veisten, 2010) identifies both, common and specific outcomes of destination visitation when it comes to different tourist segments. The latter observation, which is in line with
66

Moeller’s (2010) service provision model, poses both a theoretical and a practical dilemma for destination brand development and management. Therefore, a comprehensive measurement of the CBDBE model construct value‐in‐use should include destination‐specific visitation benefits.
From a perspective of positive psychology (i.e., Seligman & Csikszentmihalyi, 2000), the valued subjective (e.g. tourism) experience, which occurred in the past, is about well‐being, contentment and satisfaction. In the present it is about flow and happiness, and for the future it is about hope and optimism.
As discussed in the previous section, current destination brand equity research only partly reflects the value‐in‐use as a desired experiential state‐of‐being achieved during tourism consumption and the resulting fulfilment of tourists’ wants and needs. This especially concerns the social value construct, represented by the social image and self‐image dimensions in Boo et al. (2009), Pike et al. (2010) and Evangelista and Dioko (2011). Therefore, value‐in‐use is proposed as the dimension of the “judgements and feelings” CBDBE model building block and integrates destination‐specific destination visitation benefits, such as emotional (hedonic) value, or epistemic value (Sheth et al., 1991; Holbrook, 2006).
Boo et al. (2009), Evangelista and Dioko (2011) and Bianchi et al. (2014) isolate value‐for‐money as a separate CBDBE model dimension. Therefore, the construct representing the dimension of the judgements and feelings CBDBE model block is consistent with the functional (i.e., economic) value, which both Sheth et al. (1991) and Holbrook (2006) identify as part of the customers’ perceived value. Furthermore, from the service marketing perspective (Vargo & Lusch, 2004a; Grönroos, 2006, 2008), the price‐based value constitutes the value‐in‐exchange and allows for considering the customers’ own resources used as an input for the service process. However, it has to be acknowledged that customers’ resources include not only money, but also time, efforts and skills (Fuchs, 2004; Chen & Tsai, 2007; Moeller, 2010).
Finally, by following Keller (2008, 2009), this thesis defines destination brand loyalty as a crucial CBDBE model dimension, as the final stage and the primary goal of destination brand relationships development. This thesis especially follows prior tourism destination brand equity studies (i.e., Gartner, 2009; Boo et al., 2009; Pike et al., 2010; Ferns & Walls, 2012; Kladou & Kehagias, 2014), thus, defining the destination brand loyalty as the level of attachment which a potential tourist has to a destination brand, and distinguishes between attitudinal and behavioural loyalty, respectively. Behavioural loyalty refers to tourists’ actual behaviour and primarily manifests by repeated visitation and positive word of mouth referrals (Konecnik & Gartner, 2007). In contrast, attitudinal destination brand loyalty is about behavioral intentions and choices, which tourists make, based on their attitude towards the attributes the destination possesses, and benefits which
67

potential tourists can obtain by visiting the destination (Gartner, 2009). Attitudinal loyalty displays the willingness to revisit the destination and recommend the destination to others, readiness to prefer the destination when comparing the destination brand to its competitors, and readiness to pay a premium price (Bianchi et al., 2014; Boo et al., 2009; Chen & Myagmarsuren, 2010; Ferns & Walls, 2012; Im et al., 2012; Horng et al., 2012; Pike et al., 2010; Konecnik & Gartner, 2007). Hence, this thesis particularly focuses on attitudinal loyalty and integrates this construct as the target dimension of the CBDBE model.
4.3. Proposed causal relationships between the CBDBE model dimensions
This thesis specifies the CBDBE as a hierarchical model of the relationship building process between the tourist and the destination brand. Hence, the model dimensions represent the causally related stages of brand equity formation process.
The existence of strong, broad, deep and positive brand awareness is a necessary precondition for launching the interaction between the destination brand and a tourist, and, thus, a first step of the process of tourist‐destination relationship formation. Furthermore, the CBDBE model hierarchy stipulates the relationship between destination awareness and customer’s perception of destination resources, which represents the performance and imagery destination brand equity building block. Particularly, Keller (1993) specifies that brand awareness plays an important role in consumer’s decision‐making process as it influences the formation and strength of brand associations, which, in turn constitute the brand image3.
Keller (1993) uses the soft drink example to illustrate the memory activation process, when thinking of a particular brand name which evokes the various brand‐related associations, such as perceptions of taste and sugar content, images from a recent advertising campaign, as well as past product experiences (Keller,
3 This proposition is stipulated by the “associative network memory model”, which describes the process of memory retrieval and implies that semantic memory or knowledge consists of nodes and links between them (Collins and Loftus 1975; Raaijmakers and Shiffrin 1981; Ratcliff and McKoon 1988). Particularly, nodes as the units of stored information activate other nodes, when new external information is encoded or internal information is retrieved from long‐term memory. When the activation of this node spreads to another linked node in the memory and exceeds a certain threshold level, the information contained in this node is retrieved from memory. Hence, brand knowledge represents a node in memory related to a specific brand and, thus, links the brand name to a variety of associations (Keller, 1993).
68

1993). Similarly, by recalling the destination name, a potential tourist activates the memories he or she has about various destination characteristics, induced by various information sources or based on prior destination visitation, e.g., standard of accommodation, taste of food, landscape and scenery, activities, etc. Moreover, information sources, which create destination awareness, serve as the stimulus factors in the destination image formation process (Gartner, 1994; Baloglu and McClearly, 1999).
Prior tourism studies (i.e., Pike et al., 2010; Chen & Myagmarsuren, 2010; Kladou & Kehagias, 2014) empirically confirm the relationships between destination awareness and tourists’ perception of destination characteristics within the framework of destination brand equity model. Specifically, the findings in Pike et al. (2010) and Kladou and Kehagias (2014) demonstrate that strong destination brand awareness positively influences the perceived quality of destination attributes, while Chen and Myagmarsuren (2010) confirm the hypothesis on the positive relationship between destination awareness and attribute‐based image. Therefore, similar to Pike et al. (2010), Chen and Myagmarsuren (2010) and Kladou and Kehagias (2014), the following integrative hypothesis has been formulated: H1. The stronger the destination awareness, the more positive the customers’ perception
of a) functional, b) intangible and c) social destination resources.
The causal relationships between perceived destination resources, value‐in‐use and value‐for‐money constitute the core component of the proposed CBDBE model. Particularly, the inner part of the CBDBE model discloses the destination promise to combine the destination’s resources with tourist’s resources and to transform them into benefits as desired by the tourist (Grönroos, 2000; Moeller, 2010). The relationships between the three postulated constructs derive from the theories of consumer experience (e.g., Holbrook & Hirschman, 1982; Gupta & Vajic, 2000; Palmer, 2010) and consumer value, respectively (Zeithaml, 1988; Woodruff, 1997). Particularly, the proposed CBDBE model integrates the perception of tourist’s consumption at the destination setting, as the various destination attributes operate as stimuli which contribute to the experience formation process by triggering the desired outcomes of destination stay, such as relaxation, social interaction, self‐esteem, novelty etc. (Crompton, 1979; Sheth et al., 1991; Holbrook, 2006; Palmer, 2010). Furthermore, tourists evaluate the benefits of their destination stay and the sacrifice they made in relation to a trip, including the money they paid, the time they invested, the efforts they made etc. (Zeithaml, 1988).
The relationship between destination resources and value‐in‐use as the valued outcome of a destination stay has been confirmed by Pike et al. (2010), who
69

demonstrated the positive influence of destination attributes quality on tourists’ self‐esteem and social recognition. However, on a broader scale, this relationship derives from the inherent means‐end logic of destination resources’ transformation into the destination benefits as desired by the tourist (Chi & Qu, 2008; Chen & Tsai, 2007; Klenosky, 2002; Yoon & Uysal, 2005; Zabkar et al., 2010). Thus, on the level of “raw stimuli”, brand promise is constituted by at least three factors, comprising tangible, intangible and social destination resources (i.e., “means”), while the value‐in‐use level includes the predominantly abstract benefits of the visitation (i.e., “ends”), such as emotional and social value of the stay (Sheth et al., 1991).
Although, the relationship between the destination attribute’s perception and value‐for‐money has not yet been previously tested as an integrative part of the CBDBE model, Chen and Tsai (2007) particularly confirm that the attribute‐based trip quality has a strong and positive impact on the perceived value in terms of money, time and effort.
Therefore, the following set of hypotheses is formulated: H2. The more positive the customers’ perception of a) functional, b) intangible, and c)
social destination resources, the more positive the customers’ perception of value‐in‐use. H3. The more positive the customers’ perception of a) functional, b) intangible and c)
social destination resources, the more positive the customers’ perception of value‐for‐money. Finally, as specified by Gartner (2009), tourists’ attitudes towards benefits,
which can be obtained from visiting a destination, are shaping tourists’ behavioural intentions towards the destination and, therefore, are supposed to influence destination brand loyalty. This thesis follows Konecnik and Gartner (2007), Pike et al. (2010), Chen and Myagmarsuren (2010), Im et al. (2012) and Bianchi et al. (2014) when specifying destination loyalty as attitudinal loyalty, thus, integrating the intention to revisit and recommend the destination, as well as the preference of the destination brand over its competitors’ brands. Hence, similar to Boo et al. (2009), Kim et al. (2009), Pike et al. (2010), Chen and Myagmarsuren (2010), Im et al. (2012), Kladou and Kehagias (2014), and Bianchi et al. (2014), the following two hypotheses are reformulated: H4. The more positive customers’ perception of value‐in‐use, the stronger the loyalty to
a destination. H5. The more positive customers’ perception of value‐for‐money, the stronger the
loyalty to a destination.
70

5. WINTER MOUNTAIN DESTINATION CASE
The chapter presents the results of the CBDBE model validation for the leading Swedish mountain resort of Åre during the winter season. First, the model is calibrated with data collected by the web‐based pilot study in 2010. Second, the web‐based survey data conducted in 2013 serve as an input for repeat model testing. 5.1. Pilot winter study
The aim of the study is to calibrate and empirically validate the proposed CBBE model for tourism destinations (i.e., CBDBE). Therefore, this section presents the operationalization of the model constructs, describes data collection and the data preparation process, and introduces the method for data analysis.
5.1.1. Operationalization of the CBDBE model constructs The design of the survey instrument (Appendix 1) strives to achieve the goal of
testing the relationships between the dimensions of the proposed Åre‐specific customer‐based brand equity model, comprising destination awareness, functional, intangible and social destination resources, value‐in‐use defined as destination visitation benefits for a customer, value‐for‐money and loyalty. Destination awareness. A pilot study has been initially designed for international
tourists with previous experience of the leading Swedish ski destination Åre. Thus, since Aaker (1996) points out that top‐of‐mind awareness is difficult to measure when the consumer already has direct experience of the product, the top‐of‐mid metrics of brand awareness employed in previous CBBE studies in a tourism destination context (e.g., Konecnik & Gartner, 2007; Boo et al., 2009; Pike et al., 2010) cannot be directly utilised. Therefore, the survey adopts the metrics about brand knowledge and brand presence utilised by Lehman et al. (2008) to measure the awareness level of the CBBE model. Eight awareness items are formulated as statements and were rated on a five point Likert agreement scale, ranging from 1 (i.e. strongly disagree) to 5 (i.e. strongly agree).
For functional resources a total of 36 items are deduced from the literature with a focus on ski destinations (Hudson & Shephard, 1998; Weiermair & Fuchs, 1999; Faullant, Matzler, & Füller, 2008; Komppula & Laukkanen, 2009). Item‐rating ranges from 1=completely dissatisfied to 5=completely satisfied. The list of six intangible destination resources items and four social destination resources items is deduced from previous tourism research (Yoon & Uysal, 2005; Chen & Tsai, 2007; Konecnik & Gartner, 2007; Chi & Qu, 2008; del Bosque & Martin, 2008; Faullant et al., 2008; Bigne Alcaniz, Garcia, & Blas, 2009; Qu, Kim, & Im, 2011; Zabkar et al., 2010), and is refined based on a content analysis of Åre‐specific marketing
71

communications and publications in media as well as customers’ narratives in blogs. Item‐rating ranges from 1=strongly disagree to 5=strongly agree.
The conceptualization of the value‐in‐use of a destination visitation for a tourist is limited to the emotional (i.e., hedonic) value of the destination visitation, assuming that hedonic value is of primary importance for alpine ski tourism (Klenoski, Gengler, & Mulvey, 1993). However, it is acknowledged that the scope of value‐in‐use of destination visitation is broader and, thus, includes social value, as well as other types of value dimensions, like increased working capacity of a tourist after visitation as the result of relaxation, recreation or gained knowledge (Sheth et al. 1991; Crompton, 1979). The construct is, therefore, measured by four emotional value items based on the findings of the qualitative study by Klenoski et al. (1993) regarding the value of ski destinations. Furthermore, the value for money is operationalized by two items adopted from Boo et al. (2009), which capture the level of prices and value‐for‐money. The items are formulated as statements and rated on a five point Likert agreement scale, ranging from 1 (i.e. strongly disagree) to 5 (i.e. strongly agree).
Finally the study adopts the three most common measures of destination brand loyalty found in previous destination brand equity studies, including the willingness to recommend and to come back to the destination region, as well as destination preference as the measure of destination attachment (Konecnik & Gartner, 2007; Boo et al., 2009). Items are rated on a 5‐point Likert type scale (1=strongly disagree to 5=strongly agree).
Hence, the questionnaire for Åre’s international winter tourists includes a few more measurement items than needed for testing and verifying the CBBE model. The wording of the survey items, as well as the structure of the questionnaire, was finalized in the process of discussion with research colleagues and business partners. Additionally, a pre‐test with a group of students allowed for measuring the time required to complete the survey. A total of 44 students completed the survey at the pre‐test stage. The split‐half method was utilized to check item reliability (Churchill, 1979). The questionnaire was initially prepared in English and then translated into Swedish and Russian. The English version of the questionnaire is provided in Appendix 1. The translation to both languages was performed by native speakers. Finally, a web‐survey was implemented to reach international guests after having visited the destination.
5.1.2. Data collection and preparation The data collection process was organized in collaboration with business
partners in Åre as a part of the EU‐financed project “Customer‐based innovation in tourism” (CBIT). The survey was designated for international guests only. It was decided to approach international tourists after their visitation, when they had
72

already returned home. The idea that a complex event, such as the experience of a destination stay and the related trip, should be evaluated later when the experience is completed was expressed by Arnould and Price (1993). Furthermore, Palmer (2010) criticizes the widely adopted approach to evaluate service performance during or immediately after the consumption of services (e.g. tourism) and argues that customers’ attitudes adjust over time. Thus, a web‐survey was conducted to reach tourists after they returned home and had sufficient time to reflect and evaluate their holiday stay.
Web‐based survey Web‐based (i.e., online) surveys are constantly growing in popularity (Evans &
Mathur, 2005; Dolnicar, Laesser, & Matus, 2009). Evans and Mathur (2005), particularly, identify numerous advantages of using online surveys, comprising global reach, convenience, speed and timeliness, low administration costs, controlled sampling and ease of data entry and analysis, among others. At the same time, however, the authors address a number of potential weaknesses of online surveys. First, the e‐mail invitation to participate in an online survey may be perceived as a junk mail. Secondly, the skewed attributes of active Internet users can bias the results. Thirdly, sample selection and implementation issues have to be carefully treated. For instance, the use of “volunteer” samples creates implications for the sample representativeness. Furthermore, respondents with a lack of online experience can face difficulties when filling in the survey. Fifth, technological variations in the type of Internet connection and the configuration of hardware and software can affect the online survey. Sixth, the design of web‐surveys poses particularly high requirements on the clarity of the answering instructions. Seventh, since there is no human contact involved in the data collection process using online surveys, the invitation to take part in the survey may be perceived as impersonal and, therefore, can negatively affect the motivation to participate. Eighth, privacy and security issues might be important concerns for potential customers, including both the fear of computer viruses and the confidentiality of data. Finally, low response rate is an important shortcoming of online surveys as it puts at risk the sample representativity (Evans & Mathur, 2005; Dolnicar et al., 2009).
Indeed, Dolnicar et al. (2009) reported that in the tourism setting, online surveys may create non‐response biases due to the self‐selection of respondents to participate in the survey (e.g., tend to be urban, younger and more educated). At the same time, regular mail surveys were similarly biased, although the results were structurally different (i.e., rural and older persons). Therefore, the authors recommend using both data collection methods. At the same time, it is acknowledged that if the researcher is interested in a particular group of
73

population, only one data collection method can be utilised. Moreover, the response rate for an online survey is typically higher compared to a regular mail survey, while the costs associated with an online survey are substantially lower. Yet, as reported by Boo et al. (2009), who tested the CBDBE model using the data sample collected through an online survey, the response rate was only 5.1%.
Therefore, in order to overcome, or at least to minimize, the impact of the described weaknesses, the data collection strategy has been elaborated as discussed with partners of the CBIT project.
Accordingly, in order to address sampling issues, the guest structure of international winter tourists in Åre has been examined: the distribution of international tourists by sending country was estimated based on the number of overnight stays reported by the project partners, including Ski Star Åre (a major lift infrastructure and facility provider) and Holiday Club Åre (an accommodation and restaurant chain), which represent the two major operators at the destination (i.e. estimations indicate that they account for ca. 95% of the international guest base). Estimation results revealed that about 30% of international tourists come from Norway, the share of tourists from Finland and Russia is about 15%‐17% each, while the share of tourists from Denmark and the UK is about 10% each. Moreover, corresponding shares were estimated for tour operators separately. Thus, findings regarding the distribution of international tourists by sending country justified a proportional stratified sampling strategy (Creswell, 2009).
E‐mails were randomly selected from CRM‐databases of key Åre stakeholders for each sample strata. As the goal was an accuracy of 95% at a significance of 5%, target sample size was N=384. In total, 5.668 web survey invitations were disseminated.
In order to address technological aspects, the web‐survey was designed using the software NETIGATE. Data were anonymously collected during April‐May 2010. After two weeks of the first invitation a reminder was sent out in order to increase the response rate. The number of respondents, who opened the web‐survey link, was 595. However, 108 respondents did not start the survey after reading the welcome page, while 100 out of 487 respondents, who started the survey, did not fully complete it. Thus, the final response rate stood at 9% (i.e., 487 out of 5668).
Data preparation The number of fully completed questionnaires is N=387. However, as
respondents were provided with the “don’t know” option, the number of usable responses is lower. Only 9 out of 387 respondents answered all 64 questions intended for model testing. The share of missing values was highest for items measuring tourists’ perception of tangible attributes. This, however, can be
74

explained by the service heterogeneity characteristics, implying that only core destination components are used by the majority of respondents. Thus, items with more than 10% of missing‐values were removed, resulting in an exclusion of 25 out of 36 tangible attribute‐items.
Moreover, missing‐value imputation was performed, as suggested by Hair et al. (2010): missing values of resource variables were substituted by means. For remaining variables, a list‐wise deletion of cases with missing‐values was performed. As a result, the number of usable cases is 248. Z‐score‐examination revealed outliers (z>3.29) being substituted with “the next highest score plus one” (Field, 2005, p. 116). This type of score substitution affected 17 out of 34 items. The number of adjusted scores varied from 1 to 4 per item and, therefore, did not exceed 2% per item.
Finally, exploratory Factor Analysis (VariMax) examined the factor structure, communalities, KMO‐criteria and Cronbach’s Alpha separately for the CBDBE model constructs, including tangible destination resources (two factors emerged, labelled “Skiing” and “Service”), intangible destination resources (one factor), social destination resources (one factor), destination awareness (one factor, three items, including “Åre has a good reputation”, “I have heard about Åre from friends and relatives” and “I often find information about Åre on the internet” with factor loadings below 0.5 were dropped from the analysis) (Hair et al., 2010).
Table 5.1 compares the socio‐demographic characteristics for the initial dataset (i.e., N = 387) and the data set prepared for model testing (i.e., n = 248).
Overall, the differences between the initial data sample and the sub‐sample prepared for the CBDBE model testing are very minor and are all below 5%. Particularly the share of tourists from Norway, UK and Denmark remains fully stable, while there are minor changes in the shares of tourists from Finland and Russia, as well as Estonia and Latvia. Unfortunately, the destination does not have statistics regarding the latter sending countries. However, according to estimations based on various destination data provided earlier in the course of the CBIT project, the distribution of respondents by country of origin, in both the complete and the reduced samples, represents the profile of international tourists in Åre quite well.
75

Table 5.1. Socio-demographic characteristics of the respondents
Item N = 387 n = 248
FrequencyValid Percent Frequency
Valid Percent
Gender female 134 36.0 79 33.6 male 238 64.0 156 66.4 Total 372 100.0 235 100.0
Country of residence Norway 117 30.7 74 30.5
UK 62 16.3 39 16.0 Denmark 50 13.1 32 13.2 Finland 42 11.0 35 14.4 Russia 51 13.4 28 11.5
Estonia and Latvia 21 5.5 10 4.1 Other 38 10.0 25 10.3 Total 381 100.0 243 100.0
Age up to 25 years old 15 3.9 7 2.9
26‐35 years old 75 19.6 47 19.2 36‐45 years old 172 44.9 115 46.9 46‐55 years old 101 26.4 64 26.1 56‐65 years old 17 4.4 10 4.1 66‐75 years old 3 0.8 2 0.8
Total 383 100.0 245 100.0 The highest level of education completed
primary school 1 0.3 1 0.4 secondary school 17 4.5 11 4.5
vocational school/technical training
26 6.8 16 6.6
college graduate (e.g., BA or BS) 127 33.2 84 34.4 Master’s or Doctorate degree 196 51.3 125 51.2
other 15 3.9 7 2.9 Total 382 100.0 244 100.0
76

Table 5.2 illustrates aspects of skiing tourism behaviour among respondents. In the sub‐sample with fully completed responses for “Awareness”, “Customers’ benefits”, “Value for money” and “Loyalty” the share of the most active ski tourists (i.e., more than 4 ski trips a year) is 3.5% higher, while the share of respondents, who have visited the Åre destination in winter 4 times and more often is 5.8% higher. The share of first‐time visitors remains stable.
Table 5.2. Skiing travel behaviour of the respondents
Item N = 387 n = 248
FrequencyValid Percent Frequency
Valid Percent
Number of ski trips a year less than every second year 24 6.3 5 2.0
once every second year 10 2.6 3 1.2 once a year 153 39.9 102 41.8 twice a year 80 20.9 49 20.1
3 times a year 36 9.4 24 9.8 4 times a year 18 4.7 13 5.3
more than 4 times a year 62 16.2 48 19.7 Total 383 100.0 244 100.0
Number of previous visits to the destination it was my first visit 115 29.7 73 29.4
1 time 59 15.2 32 12.9 2‐3 times 78 20.2 42 16.9 4‐5 times 46 11.9 35 14.1
6 times or more 89 23.0 66 26.6 Total 387 100.0 248 100.0
Children in the travel group Yes 190 49.1 117 47.2 No 197 50.9 131 52.8
Total 387 100.0 248 100.0 Table 5.3 displays means and standard deviations for the model measurement
items. The values are shown for both the complete sample (i.e., N = 387 respondents) and the prepared sub‐sample used for model validation (i.e., n = 248). Comparison of descriptive statistics shows that the difference between mean values for the complete sample and the sub‐sample is negligibly small (i.e., does not exceed 0.11).
77

Table 5.3. Descriptive statistics
Items N = 387 n = 248
N MeanStd.
Deviation Mean Std.
Deviation Destination awareness
I see a lot of ads about Åre 364 3.20 1.176 3.26 1.190 I often read about Åre in newspapers and magazines
370 2.89 1.153 2.96 1.145
Many people know the Åre ski resort 373 3.51 1.307 3.49 1.301 Åre is a famous site for international winter sports competitions
355 3.72 1.072 3.71 1.074
Åre is known as one of the world’s top ski resorts
348 3.23 1.147 3.22 1.125
Tangible resources Snow reliability 365 4.09 0.985 4.08 0.966 Number and variety of ski slopes 367 4.29 0.862 4.29 0.832 Overall quality of alpine skiing 352 4.20 0.878 4.17 0.833 Safety in the ski area 353 4.33 0.819 4.29 0.761 Overall quality of skiing experience 363 4.21 0.862 4.22 0.795 Transportation at the mountain area (e.g., ski lifts, chair lifts, cable cars)
358 4.00 0.983 3.94 0.953
Overall quality of accommodation (e.g., hotel, cabin, apartment)
377 4.32 0.764 4.25 0.738
Service level of the staff in accommodation facilities
357 4.16 0.831 4.12 0.809
Quality of food and beverages 351 4.01 0.809 3.96 0.762 Service level of the staff in restaurants and bars
354 4.06 0.869 3.98 0.824
Intangible resources Åre has a peaceful and restful atmosphere
382 4.14 .915 4.13 0.898
Åre is family‐friendly 369 4.44 0.754 4.43 0.733 Åre is clean and tidy 383 4.41 0.746 4.40 0.719 Åre is safe and secure 381 4.39 0.799 4.38 0.760 Åre is a luxury winter resort 372 3.71 0.926 3.71 0.906 Landscape and scenery are beautiful in Åre
381 4.40 0.767 4.42 0.692
78

Table 5.3. (Continues)
Items N = 387 n = 248
N MeanStd.
Deviation Mean Std.
Deviation Social resources
Employees were friendly and professional
377 4.23 0.768 4.23 0.746
I liked the behaviour of other tourists 362 3.92 0.808 3.89 0.769 It was easy to interact and communicate with other tourists
336 3.91 0.849 3.83 0.807
Local people were hospitable and friendly
355 4.27 0.760 4.16 0.778
Value‐in‐use Åre is a thrilling winter destination 367 3.85 0.906 3.88 0.873 Åre offers various winter experiences 362 4.02 0.808 4.06 0.777 Åre offers fun and excitement 367 4.06 0.777 4.08 0.772 Åre brings you the joy of achievement 355 3.93 0.849 3.96 0.836
Value for money Compared to other skiing destinations, visiting Åre is good value for money
361 3.78 0.973 3.83 0.985
Overall, Åre as a skiing destination has reasonable prices
371 3.70 0.934 3.71 0.930
Destination loyalty I will come back to Åre in winter within 2 years
360 3.85 1.151 3.83 1.199
I consider Åre to be my first choice of a ski resort
364 3.26 1.356 3.28 1.338
I will encourage friends and relatives to visit Åre in winter
377 3.99 0.995 3.98 1.018
79

5.1.3. Pilot study results and model development In order to empirically test the constitutive measurement constructs of the
proposed CBBE model for tourism destinations, in a first methodological step confirmatory factor analysis (CFA) was employed by using the AMOS (vers. 21) software package (Hair et al., 2010). First, the unidimensionality of the specified measurement model was examined. Particularly all unstandardized loadings (i.e., regression weights) were statistically different from zero. All t‐values were higher than 1.96. However, the overall model‐fit revealed that most fit‐statistics were slightly below recommended thresholds (Brown, 2006). Thus, measurement model adjustment was performed.
An examination of standardized loadings (i.e. < 0.50), standardized residuals (i.e. > 2.58) and modification indices suggested the removal of three items (i.e. “Åre is a luxury winter resort”, “Åre is a famous site for international winter sports competitions” and “Åre is known as one of the world’s top ski resorts”). Additionally, discriminant validity analysis suggested the need to increase the extracted variance value for the “Skiing” factor, which was achieved by removing the “Safety in the ski area” and the “Transportation at the mountain area (e.g., ski lifts, chair lifts, cable cars)” items. As a result of the adjustments carried out, the model‐fit improved substantially (Table 5.4). Although Goodness‐of‐fit Index (GFI = 0.878) is still slightly below the recommended threshold, all other indexes satisfy cut‐off requirements (Steenkamp & Baumgartner, 2000; Hair et al., 2010). Moreover, the estimated model shows satisfactory measurement results (Table 5.5).
Table 5.4. CBDBE Measurement Model: CFA Goodness-of-fit Statistics
Indicator [Threshold value] Statistic value Absolute Fit Measures Goodness‐of‐fit Index (GFI) [>0.90] 0.852 Root Mean Square Error of Approximation (RMSEA) [<0.08: acceptable fit; < 0.05: good fit]
0.058
90 percent confidence interval for RMSEA [0.05;0.08] (0.051; 0.065) Standardized root mean residual (SRMR) [<0.08] 0.059 Normed‐Chi‐Square (χ2/df) [<2] 640.09/349=1.834 Incremental Fit Indices Tucker‐Lewis Index (TLI) [>0.90] 0.92 Comparative Fit Index (CFI) [>0.90] 0.93 Parsimony Fit Indices Adjusted Goodness‐of‐fit Index (AGFI) [>0.80] 0.81
80

Table 5.5. CBDBE Measurement Model: Test Statistics
Constructs Scale items
Composite Reliability
Standardized Loadings
t Value (CR)
SMC AVE
Awareness (AW)
AW1 0.85
0.871 ‐* 0.758 0.66 AW2 0.898 14.326 0.807
AW3 0.638 10.764 0.407
Tangible destination resources. Skiing (SKI)
SKI1
0.85
0.622 ‐ 0.387
0.60 SKI2 0.753 9.505 0.567 SKI3 0.840 10.329 0.705 SKI5 0.859 10.483 0.738
Tangible destination resources. Service (SER)
SER1
0.80
0.699 ‐ 0.489
0.50 SER2 0.702 10.011 0.492 SER3 0.712 9.457 0.507 SER4 0.715 9.422 0.512
Intangible destination resources (INT)
INT1
0.85
0.654 ‐ 0.427
0.55 INT2 0.803 10.729 0.645 INT3 0.875 11.019 0.766 INT4 0.775 10.145 0.600 INT6 0.538 7.528 0.289
Social destination resources (SOC)
SOC1
0.79
0.767 ‐ 0.589
0.50 SOC2 0.579 8.315 0.336 SOC3 0.698 10.245 0.488 SOC4 0.754 11.439 0.568
Emotional value (EMO)
EMO1
0.89
0.807 14.435 0.651
0.68 EMO2 0.828 13.973 0.685 EMO3 0.854 14.696 0.729 EMO4 0.806 ‐ 0.650
Value for money (VFM)
VFM1 0.90
0.959 17.339 0.919 0.83
VFM2 0.855 ‐ 0.731
Loyalty (LOY)LOY1
0.83 0.768 ‐ 0.589
0.61 LOY2 0.803 12.821 0.644 LOY3 0.781 11.318 0.611
*‐ indicates: paths fixed to one to estimate parameters
81
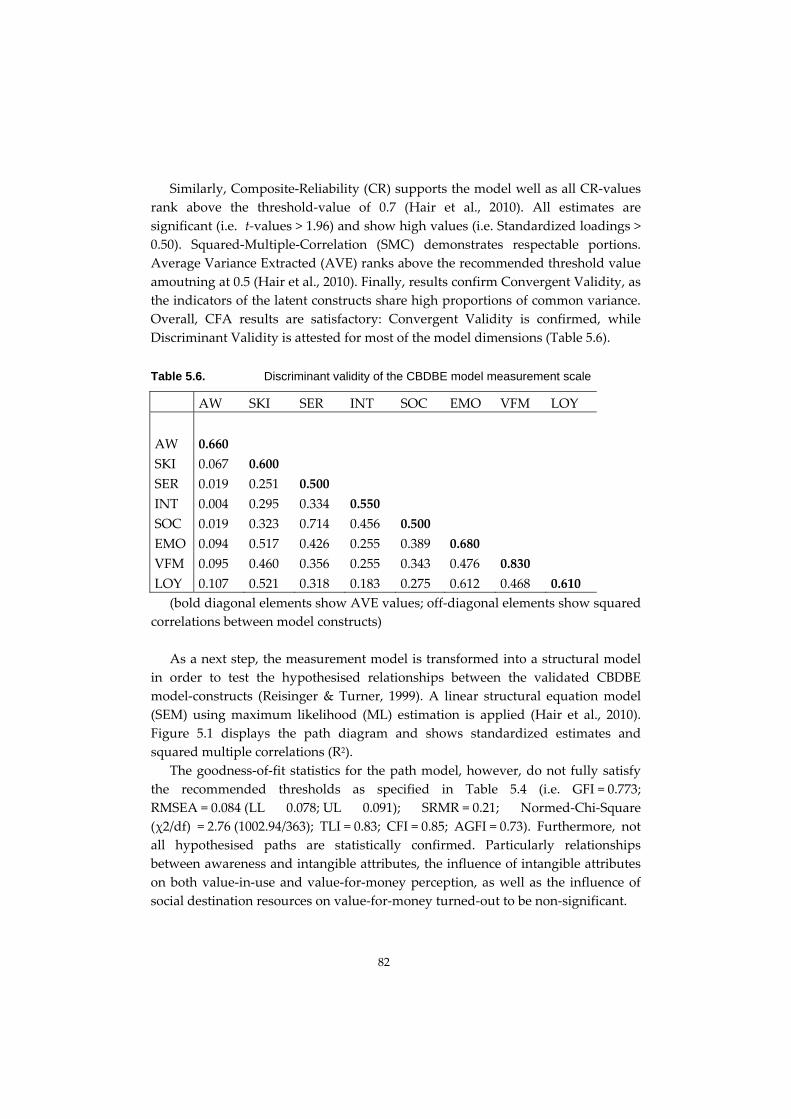
Similarly, Composite‐Reliability (CR) supports the model well as all CR‐values rank above the threshold‐value of 0.7 (Hair et al., 2010). All estimates are significant (i.e. t‐values > 1.96) and show high values (i.e. Standardized loadings > 0.50). Squared‐Multiple‐Correlation (SMC) demonstrates respectable portions. Average Variance Extracted (AVE) ranks above the recommended threshold value amoutning at 0.5 (Hair et al., 2010). Finally, results confirm Convergent Validity, as the indicators of the latent constructs share high proportions of common variance. Overall, CFA results are satisfactory: Convergent Validity is confirmed, while Discriminant Validity is attested for most of the model dimensions (Table 5.6).
Table 5.6. Discriminant validity of the CBDBE model measurement scale
AW SKI SER INT SOC EMO VFM LOY
AW 0.660 SKI 0.067 0.600 SER 0.019 0.251 0.500 INT 0.004 0.295 0.334 0.550 SOC 0.019 0.323 0.714 0.456 0.500 EMO 0.094 0.517 0.426 0.255 0.389 0.680 VFM 0.095 0.460 0.356 0.255 0.343 0.476 0.830 LOY 0.107 0.521 0.318 0.183 0.275 0.612 0.468 0.610
(bold diagonal elements show AVE values; off‐diagonal elements show squared correlations between model constructs) As a next step, the measurement model is transformed into a structural model
in order to test the hypothesised relationships between the validated CBDBE model‐constructs (Reisinger & Turner, 1999). A linear structural equation model (SEM) using maximum likelihood (ML) estimation is applied (Hair et al., 2010). Figure 5.1 displays the path diagram and shows standardized estimates and squared multiple correlations (R2).
The goodness‐of‐fit statistics for the path model, however, do not fully satisfy the recommended thresholds as specified in Table 5.4 (i.e. GFI = 0.773; RMSEA = 0.084 (LL 0.078; UL 0.091); SRMR = 0.21; Normed‐Chi‐Square (χ2/df) = 2.76 (1002.94/363); TLI = 0.83; CFI = 0.85; AGFI = 0.73). Furthermore, not all hypothesised paths are statistically confirmed. Particularly relationships between awareness and intangible attributes, the influence of intangible attributes on both value‐in‐use and value‐for‐money perception, as well as the influence of social destination resources on value‐for‐money turned‐out to be non‐significant.
82

PAW,SKI = 0.31 p=0.000
Figure 5.1. Standardized path estimates for the CBDBE structural model
However, a detailled examination of modification indices revealed that the
model fit can be substantially improved by allowing theoreically highly plausible correlations between the four destination resource dimensions. Thus, in the revised model (i.e. Figure 5.2) “Skiing” (SKI), “Service” (SER), “Intangible destination resources” (INT) and “Soical destination resources” (SOC) constitute the sub‐dimensions of the second‐order construct DRES (“Destination resources”). As a result of the performed model revision, which is fully compliant with the theory, the Goodness‐of‐fit statistics of the path model reach a satisfactory level: GFI = 0.83; RMSEA = 0.065 (LL 0.058; UL 0.072); Normed‐Chi‐Square (χ2/df) = 2.04 (750.65/368); SRMR = 0.077; TLI = 0.90; CFI = 0.91; AGFI = 0.80.
AW
EMO
LOY
VFM
PAW,SER = 0.20 p=0.011 PAW,SOC = 0.19 p=0.015 (PAW,INT – n.s.)
– confirmed – partly confirmed – not significant (n.s.)
Poutcome, predictor – path coefficient
PEMO,LOY = 0.59 PVFM,LOY = 0.28 p=0.000
R2 = 0.59
R2 = 0.60
R2 = 0.47
SKI SER
INT SOCPSKI,VFM = 0.55 p=0.000 PSER,VFM = 0.33 p=0.000 R2SKI = 0.10
R2SER = 0.04
PSOC,VFM, PINT,VFM – n.s.) PSKI,EMO = 0.60 p=0.000 PSER,EMO = 0.38 p=0.000
R2INT = 0.00 R2SOC = 0.03
PSOC,EMO = 0.16 p=0.047 (PINT,EMO – n.s.)
83

SKI SER
Figure 5.2. Standardized path estimates for the revised CBDBE structural model
Unstandardized loadings of the four sub‐dimensions of the second‐order
construct DRES are all statistically significant, while Standardized Loadings vary from 0.675 for “Intangible destination resources” to 0.812 for the “Social destination resources”.
Table 5.7. Structural parameter estimates for the revised CBDBE model
Structural Relationships
Unstandardized Parameter Estimate
Standard Error
t‐Value Standardized Parameter Estimate
H1: AW DRES 0.119 0.035 3.447 0.265 H2: DRES EMO 1.192 0.148 8.045 0.841 H3: DRES VFM 1.335 0.170 7.876 0.794 H4: EMO LOY 0.816 0.117 6.985 0.596 H5: VFM LOY 0.119 0.035 3.447 0.265 The AVE Value for the DRES construct amounts to 0.59 (Hair et al., 2010). All
proposed relationships between the model constructs are statistically significant (Table 5.7). The hypothesised hierarchical structure of the CBDBE model could be empirically confirmed, thus, the proposed approach can be considered as
AW
EMO
LOY
VFM
PEMO,LOY = 0.60 PVFM,LOY = 0.28 p=0.000 R2 = 0.70
R2 = 0.66
R2 = 0.63
DRES
SOC
PAW,DRES = 0.26 p=0.000
PDRES,VFM = 0.79 p=0.000 PDRES,EMO = 0.84 p=0.000
– confirmed
Poutcome, predictor – path coefficient
R2 = 0.07
INT
84
plausible, reliable and valid (Hair et al., 2010). However, in order to re‐test the revised model the survey instrument should be improved prior to collection of a new data sample. Particularly the perception of tangible, intangible, and, social destination resources should be consistently operationalized based on similar scales.
5.2. Winter study replication results With the purpose of demonstrating reliability and empirical robustness of the
above proposed CBDBE model, new data was collected during July‐August 2013 within the project “Engineering the Knowledge Destination through Customer‐based Competence Development” financed by the KK‐foundation, which like the follow‐up initiative was built upon the results of the CBIT project.
The survey instrument was slightly modified, thus a satisfaction scale was employed to measure intangible and social destination resources, as well as value for money. Furthermore, in order to better cope with the missing value issue and to re‐test the model without missing value replacement, the guest‐base was further extended to both domestic and international visitors of the leading Swedish ski destination Åre, in the winter season of 2012/2013. In total, 23,243 emails from the CRM‐databases of major destination stakeholders were disseminated. A reminder was sent out two weeks after the first invitation. While 3,013 respondents started the survey, thus, resulting in 13% response rate, 1,984 respondents fully completed the survey. Respondents who answered all 29 CBDBE model measurement items deduced from the previous pilot study made up the sub‐sample (n=752) for repeat model testing.
Table 5.8 displays means and standard deviations for the model measurement items. The values are shown for both the complete sample (i.e., N = 1,984 respondents) and the sub‐sample prepared and used for model validation (i.e., n = 752). Comparison of descriptive statistics shows that the difference between mean values for the complete sample and the sub‐sample is negligibly small (i.e., does not exceed 0.09).
The first effort to validate the measurement constructs with new data by CFA again produced model‐of‐fit statistics slightly below the recommended thresholds (Brown, 2006). The examination of standardized residuals (i.e. > 2.58) revealed the need to remove the social resource item “Friendliness and professionalism of employees”. Additionally, discriminant validity results indicated the need to increase the extracted variance of the “Service” construct, which could be achieved by removing the “Overall quality of accommodation” item with the lowest standardized loading score. The performed adjustments resulted in a substantial improvement of the model fit: Goodness‐of‐fit Index (GFI) = 0.896; Root Mean Square Error of Approximation (RMSEA) = 0.061 (LL 0.057; UL 0.065);
85

Standardized root mean residual (SRMR) = 0.062; Normed‐Chi‐Square (χ2/df) = 3.781 (1119.302/296); Tucker‐Lewis Index (TLI) = 0.93; Comparative Fit Index (CFI) = 0.94; Adjusted Goodness‐of‐fit Index (AGFI) = 0.87. The Normed‐Chi‐Square statistic slightly above the threshold value (χ2/df = 3.781) may, however, be neglected due to a large sample size above 750 (Hair et al., 2010).
Table 5.8. Descriptive statistics
Items N = 1984 N = 752
N MeanStd.
Deviation Mean Std.
Deviation I see a lot of ads about Åre AW1 1.881 3.65 1.008 3.69 0.996 I often read about Åre in newspapers and magazines
AW2 1.861 3.35 1.091 3.44 1.063
Many people know the Åre ski resort
AW3 1.953 4.51 0.812 4.46 0.831
Snow reliability SKI1 1.850 4.27 0.856 4.22 0.845 Number and variety of ski slopes
SKI2 1.845 4.33 0.803 4.30 0.839
Overall quality of alpine skiing
SKI3 1.840 4.24 0.795 4.21 0.810
Overall quality of skiing experience
SKI5 1.862 4.30 0.757 4.28 0.758
Overall quality of accommodation (e.g., hotel, cabin, apartment)
SER1 1.905 4.21 0.849 4.16 0.850
Service level of the staff in accommodation facilities
SER2 1.620 4.12 0.891 4.12 0.862
Quality of food and beverages SER3 1.653 4.05 0.830 4.09 0.803 Service level of the staff in restaurants and bars
SER4 1.701 4.00 0.849 4.03 0.836
Peaceful and restful atmosphere
INT1 1.912 4.12 0.894 4.15 0.903
Family‐friendliness INT2 1.700 4.08 0.849 4.08 0.861 Cleanliness and tidiness INT3 1.944 4.08 0.804 4.12 0.796 Safety and security INT4 1.862 4.21 0.790 4.20 0.793 Natural landscape and scenery
INT6 1.939 4.58 0.630 4.55 0.647
86

Table 5.8. (continues)
Items N = 1984 N = 752
N MeanStd.
Deviation Mean Std.
Deviation Friendliness and professionalism of employees
SOC1 1.892 4.07 0.817 4.07 0.827
Behaviour of other tourists SOC2 1.748 3.69 0.898 3.70 0.921 Friendliness of other tourists SOC3 1.732 3.76 0.870 3.77 0.879 Hospitality and friendliness of local people
SOC4 1.630 4.13 0.805 4.15 0.809
Åre is a thrilling winter destination
BEN11.965 4.29 0.797 4.30 0.774
Åre offers a diversity of winter experiences
BEN21.889 4.21 0.788 4.24 0.777
Åre offers fun and excitement BEN3 1.929 4.21 0.811 4.25 0.792 Åre brings you the joy of achievement
BEN41.854 4.04 0.907 4.10 0.864
Good value for money VFM1 1.943 3.30 0.986 3.32 1.016 Reasonable prices VFM2 1.935 3.08 1.005 3.09 1.009 I will come back to Åre in winter within 2 years
LOY11.984 4.29 1.035 4.31 1.011
I consider Åre to be my first choice of a ski resort
LOY21.984 3.72 1.354 3.75 1.334
I will encourage friends and relatives to visit Åre in winter
LOY31.984 4.03 1.065 4.07 1.056
The measurement model shows satisfactory measurement results (Table 5.9).
First, the values for Composite Reliabilities (CR) approve the model and all CR values rank well above the recommended threshold amounting to 0.7 (Hair et al., 2010). Second, all estimated (std.) regression weights (factor loadings) are relatively high and significant (t‐values). Particularly, all t‐values are above 1.96 and vary from 14.177 to 48.278; all standardized loadings are greater than 0.50, varying between 0.541 and 0.961, whilst most of standardized loading estimates exceed 0.7 (Janssens, de Pelsmacker, Wijnen, & Van Kenhov, 2008; Hair et al., 2010). Thirdly, Squared Multiple Correlations (SMC) demonstrate respectable portions. Finally, Average Variance Extracted (AVE) ranks well above the recommended threshold value amounting to 0.5 (Hair et al., 2010).
87

Moreover, the results shown in Table 5.9 confirm Convergent Validity of construct measurement by demonstrating that indicators of the latent construct share a high proportion of common variance (Hair et al., 2010). Furthermore, Table 5.10 shows the result of Discriminant Validity evaluation, which is fully confirmed for all model constructs.
Table 5.9. CBDBE Measurement Model: Replicated Test Statistics
Constructs Scale items
Composite Reliability
Standardized Loadings
t Value (CR)
SMC AVE
Awareness AW1
0.79 0.878 ‐* 0.771
0.57 AW2 0.805 18.914 0.649 AW3 0.541 14.177 0.292
Tangible destination resources. Skiing
SKI1
0.87
0.620 ‐ 0.384
0.64 SKI2 0.822 17.787 0.675 SKI3 0.856 18.257 0.733 SKI5 0.870 18.443 0.757
Tangible destination resources. Service
SER2
0.79
0.621 ‐ 0.386
0.56 SER3 0.799 15.651 0.638
SER4 0.806 15.647 0.650
Intangible destination resources
INT1
0.86
0.736 ‐ 0.542
0.56 INT2 0.790 20.764 0.624 INT3 0.768 20.272 0.591 INT4 0.808 21.177 0.652 INT6 0.638 17.21 0.407
Social destination resources
SOC2 0.89
0.933 ‐ 0.870 0.74 SOC3 0.961 48.278 0.924
SOC4 0.655 21.751 0.429
Emotional value
EMO1
0.92
0.870 29.623 0.756
0.75 EMO2 0.858 30.297 0.736 EMO3 0.887 30.641 0.787 EMO4 0.845 ‐ 0.714
88

Table 5.9. (continues)
Constructs Scale items
Composite Reliability
Standardized Loadings
t Value (CR)
SMC AVE
Value for money
VFM1 0.91
0.942 29.338 0.887 0.84
VFM2 0.893 ‐ 0.798
Loyalty LOY1
0.87 0.731 ‐ 0.534
0.69 LOY2 0.858 23.131 0.736 LOY3 0.889 22.807 0.791
*‐ indicates: paths fixed to one to estimate parameters Overall, the results of the CFA are satisfactory. Convergent and Discriminant
Validity are confirmed. As the next step, the validated measurement model is transformed into a structural model (Figure 5.3).
The goodness‐of‐fit statistics for the path model are all satisfactory (GFI = 0.874; RMSEA = 0.066 (LL 0.063; UL 0.070); SRMR = 0.076; χ2/df = 4.291 (1351.587/315); TLI = 0.92; CFI = 0.93; AGFI = 0.85). The AVE value for the DRES construct amounts to 0.60 (Hair et al., 2010). All hypothesized relationships between the model constructs are statistically significant (Table 5.11). Thus, the hierarchical structure of the CBDBE model has been repeatedly confirmed, thereby demonstrating the high reliability and empirical robustness of the proposed CBDBE modelling approach (Hair et al., 2010).
Table 5.10. Discriminant validity of the CBDBE model measurement scale (Replicated study)
AW SKI SER INT SOC EMO VFM LOY
AW 0.57
SKI 0.046 0.64 SER 0.097 0.234 0.56 INT 0.081 0.392 0.493 0.56 SOC 0.039 0.175 0.309 0.464 0.74 EMO 0.158 0.477 0.378 0.497 0.218 0.75 VFM 0.048 0.212 0.289 0.392 0.356 0.275 0.84 LOY 0.083 0.496 0.213 0.324 0.142 0.573 0.245 0.69
(the bold diagonal elements show AVE values; off‐diagonal elements show squared correlations between model constructs)
89

SKI SER
Figure 5.3. Standardized path estimates for the revised CBDBE structural model
(Replicated study)
Table 5.11. Structural parameter estimates for the revised CBDBE model (Replicated study)
Structural Relationships
Unstandardized Parameter Estimate
Standard Error
t‐Value Standardized Parameter Estimate
H1: AW DRES 0.145 0.02 7.244 0.145 0.352 H2: DRES EMO 1.528 0.116 13.221 1.528 0.798 H3: DRES VFM 1.702 0.142 11.95 1.702 0.698 H4: EMO LOY 0.724 0.047 15.411 0.724 0.690 H5: VFM LOY 0.108 0.029 3.679 0.108 0.131
AW
EMO
LOY
VFM
PEMO,LOY = 0.69 PVFM,LOY = 0.13 p=0.000 R2 = 0.64
R2 = 0.59
R2 = 0.49
DRES
SOC
PAW,DRES = 0.35 p=0.000
PDRES,VFM = 0.70 p=0.000 PDRES,EMO = 0.80 p=0.000
– confirmed
Poutcome, predictor – path coefficient
R2 = 0.12
INT
90

6. SUMMER MOUNTAIN DESTINATION CASE
The below presented summer mountain destination case study is subdivided into three stages. First, a qualitative study has been conducted at the Swedish mountain resort Åre in the summer of 2012. The qualitative study aimed at understanding both the common and specific outcomes of destination visitation in terms of value‐in‐use for different tourist segments, which are simultaneously attracted by one destination and, thus, have access to a common pool of destination resources. The perceived value‐in‐use scale based on the qualitative study findings was, subsequently, integrated into the CBDBE measurement instrument adjusted for mountain destinations in the summer season. Second, the web‐based study conducted in December 2012, allowed for testing the CBDBE model for the summer season. Finally, additional tests have been performed in order to test the proposed model separately for the main summer tourism segments, as well as to examine the role of tourist satisfaction as an additional CBDBE model dimension. 6.1. Understanding the value-in-use of a multi-segment
destination A qualitative study has been conducted at the Swedish mountain resort Åre in
the summer of 2012 in order to generate a comprehensive list of destination resources and visitation outcome items relevant to the main summer tourist segments, including hikers, mountain bikers and village tourists. For this purpose, and as suggested by the literature, the laddering method as a face‐to‐face interviewing technique has been employed to understand the means‐end hierarchy between tangible, intangible and social destination resources (i.e., attributes) and the outcomes (i.e., benefits) perceived by tourists visiting the Åre mountain summer resort4 (Gutman, 1982; Reynolds & Olson, 2001). Moreover, in order to better understand co‐creation dynamics, an effort has been made to uncover meaningful associations between tourists’ resources, such as time, money, efforts and equipment (Prebensen, Vitterso, & Dahl, 2013) and the outcomes of their summer vacation.
4 The non‐winter season in Åre lasts mainly from June to September, thus, covers both summer and autumn months. However, destination marketing promotes the season as “summer in Åre” as the opposite of the ski season, which lasts from December to early May.
91

6.1.1. Qualitative study research design Qualitative interviews have been divided into two parts: first of all, at the
elicitation stage (Reynolds & Olson, 2001), lists of destination‐based and tourists’ personal resources were retrieved by asking the following three questions:
‐ Please describe which characteristics of the Åre destination were important for your decision to come here;
‐ Now, please think about your interactions with other people during your stay, such as members of your travel group, family or friends, other tourists, the staff in the service facilities or local residents. Please describe which social interactions are important parts of your stay in Åre;
‐ Could you please describe what your personal contribution was towards coming to Åre and staying here (such as money, time, effort, equipment and skills)?
Subsequently, at the laddering stage, each of the elicited attributes have been discussed separately by first asking the question “Why are these characteristics/ interactions/personal contributions particularly important to you?”, and then continuing by asking the “Why is this important?” question, in order to reach the final valued state (i.e. not more than seven times).
In total, 40 in‐depth interviews have been conducted at various locations in Åre, including the tourist office, the central station, the upper and lower cable car stations, the main square and the lobbies of two major accommodation establishments, where the popular spa and water park facilities are placed as well. Most interviewees (i.e., 75%) were from Sweden. In addition, six tourists from Norway, two from Finland, one from Germany and one from the Netherlands took part in the study. The average duration of the interview was about ten minutes. The CEO of the destination management organisation confirmed that the distribution by country of arrival represents the actual profile of summer tourists in Åre well.
6.1.2. Qualitative study findings Accordingly, the sample is rather evenly distributed by gender, including 48%
men and 52% women. The ages range from 22 to 64 years, while 42 years is the average age of the respondents. The average duration of stay is 4.8 days and the average travel group size is 4 persons. Half of the study participants travelled with children. Hiking was reported as the most popular activity (i.e., 48%), followed by mountain biking (35%) and spa and pool facilities (23%). Therefore, based on the preferred activity responses, the study participants have been classified into three a‐priory segments, including “hikers” (48%), “mountain bikers” (25%) and “village tourists” (27).
92
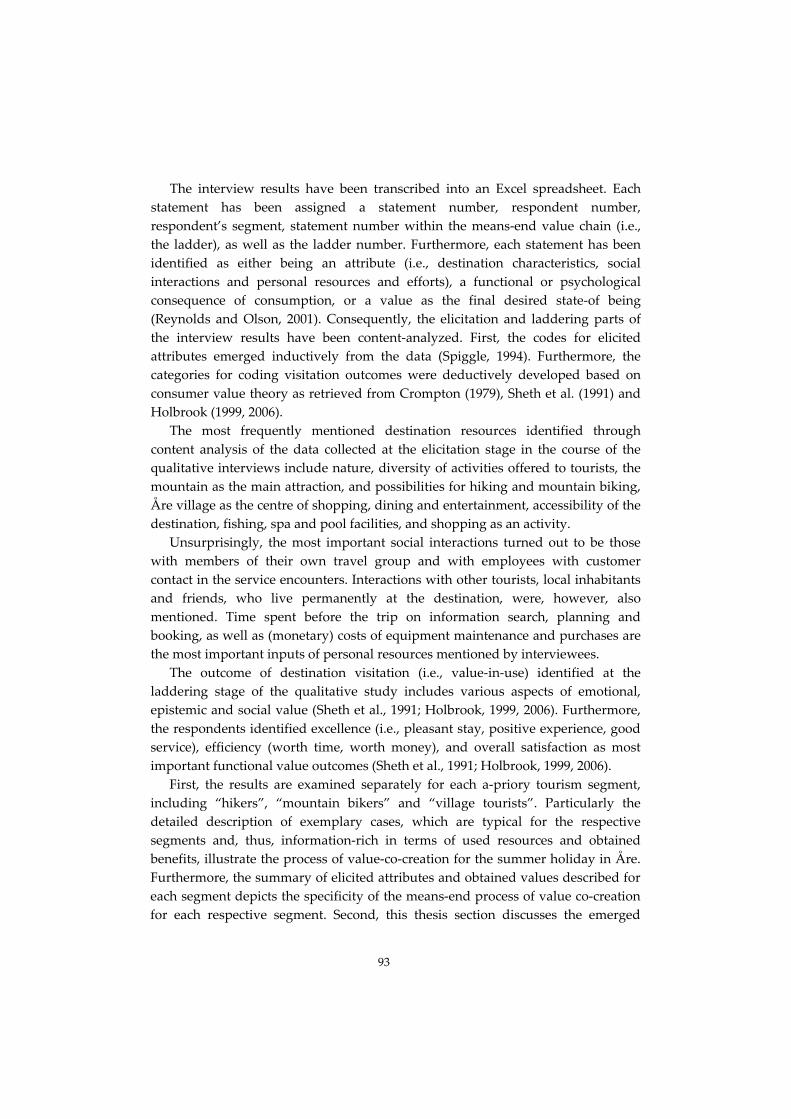
The interview results have been transcribed into an Excel spreadsheet. Each statement has been assigned a statement number, respondent number, respondent’s segment, statement number within the means‐end value chain (i.e., the ladder), as well as the ladder number. Furthermore, each statement has been identified as either being an attribute (i.e., destination characteristics, social interactions and personal resources and efforts), a functional or psychological consequence of consumption, or a value as the final desired state‐of being (Reynolds and Olson, 2001). Consequently, the elicitation and laddering parts of the interview results have been content‐analyzed. First, the codes for elicited attributes emerged inductively from the data (Spiggle, 1994). Furthermore, the categories for coding visitation outcomes were deductively developed based on consumer value theory as retrieved from Crompton (1979), Sheth et al. (1991) and Holbrook (1999, 2006).
The most frequently mentioned destination resources identified through content analysis of the data collected at the elicitation stage in the course of the qualitative interviews include nature, diversity of activities offered to tourists, the mountain as the main attraction, and possibilities for hiking and mountain biking, Åre village as the centre of shopping, dining and entertainment, accessibility of the destination, fishing, spa and pool facilities, and shopping as an activity.
Unsurprisingly, the most important social interactions turned out to be those with members of their own travel group and with employees with customer contact in the service encounters. Interactions with other tourists, local inhabitants and friends, who live permanently at the destination, were, however, also mentioned. Time spent before the trip on information search, planning and booking, as well as (monetary) costs of equipment maintenance and purchases are the most important inputs of personal resources mentioned by interviewees.
The outcome of destination visitation (i.e., value‐in‐use) identified at the laddering stage of the qualitative study includes various aspects of emotional, epistemic and social value (Sheth et al., 1991; Holbrook, 1999, 2006). Furthermore, the respondents identified excellence (i.e., pleasant stay, positive experience, good service), efficiency (worth time, worth money), and overall satisfaction as most important functional value outcomes (Sheth et al., 1991; Holbrook, 1999, 2006).
First, the results are examined separately for each a‐priory tourism segment, including “hikers”, “mountain bikers” and “village tourists”. Particularly the detailed description of exemplary cases, which are typical for the respective segments and, thus, information‐rich in terms of used resources and obtained benefits, illustrate the process of value‐co‐creation for the summer holiday in Åre. Furthermore, the summary of elicited attributes and obtained values described for each segment depicts the specificity of the means‐end process of value co‐creation for each respective segment. Second, this thesis section discusses the emerged
93

value themes in relation to the resource input and identifies similarities and differences between the a‐priory summer tourism segments in Åre. Finally, the section displays the development of the destination‐specific scale for perceived value‐in‐use based on the qualitative study findings.
“Hikers” segment The sub‐sample of tourists interested in hiking as an activity includes 10 female
and 9 male participants aged between 30 and 64 (Table 6.1). Most respondents were domestic tourists. One tourist arrived from the Netherlands (31‐year‐old male) and one tourist arrived from Germany (35‐year‐old female). The duration of stay varies from 2 to 10 days for most of the tourists (i.e., 5 days on average). However, one respondent (female tourist from Norway) indicated 21 days as the stay duration, which is the longest period of stay among all three a‐priory segments. Interestingly, 12 out of 19 hiking tourists indicated additional attractive activities, such as fishing (6 respondents), spa and pool (3 respondents), horse riding (3 respondents), climbing and water sports (1 respondent). Notably, few participants indicated more than one activity in addition to hiking, while the Norwegian female tourist with the longest stay (i.e., 21 days) indicated four such activities, including spa and pool, shopping, bicycling and fishing. Finally, 9 out of 19 participants in the “hiking tourists” group travelled with children. Most hiking tourists with children are from 38 to 52 years old. Case 1 represents the youngest participant within the “hiking tourism” segment
(Table 6.2). The 30‐year‐old male tourist from the province of Västra Götaland in Sweden came to Åre with his wife to spend one week at the mountain destination. The couple stayed at the hotel in the centre of the village. The tourist was approached at the tourist information office at the day of arrival. The tourist identified hiking as the main destination attraction and considered mountain biking and horse riding as potentially interesting activity options. The interview produced ten ladders covering a wide range of input resources and visitation benefits.
First, the variation of activities offered by Åre is an important factor for choosing the destination. Especially if it is raining, it is good to have other options. Hence, a destination with many different activities encourages the tourist to get different experiences and kicks (i.e., fun), to be thankful to nature and life. Second, spending a week in a village with a developed tourist infrastructure (e.g., restaurants) makes the hiking vacation more comfortable, which is important for recovery from work, renewing energy, taking time to relax and enjoy. Yet, without doubt, nature is a core resource for a hiking vacation. According to the respondent,
94

“nature means something stable”5 and provides an inspirational setting, which stimulates creativity (“one can write a new song or a melody”). Hence, benefits of vacation in a natural setting include inspiration, aesthetical value (beauty of nature) and escape (“being in Åre allows me to get off the hamster wheel”).
Table 6.1. Profile of the “hiking tourists” sub-sample
Case No. Age Gender
Country of residence
Duration of stay
Other attractive activities
Travel with
children 1 30 male Sweden 6 Horse riding ‐ 2 31 female Sweden 7 yes 3 31 male Netherlands 2 Fishing ‐ 4 35 female Germany 3 ‐
5 36 male Sweden 5 Climbing, water sports, horse riding ‐
6 36 male Sweden 8 Fishing ‐ 7 38 female Sweden 2 yes
8 39 female Norway 21
Spa and pool, shopping, bicycling, fishing yes
9 41 female Sweden 8 yes 10 43 male Sweden 10 Horse riding yes 11 45 female Sweden 4 Fishing yes 12 45 male Sweden 4 Fishing ‐ 13 47 female Sweden 3 ‐
14 48 female Sweden 3 Spa and pool, riding the cable car ‐
15 49 male Sweden 4 yes 16 50 female Sweden 7 Fishing yes
17 52 male Sweden 3 Spa and pool, riding the cable car yes
18 64 female Sweden 5 Riding the cable car ‐ 19 64 male Sweden 9 ‐ Social interactions constitute yet another important ingredient of the week
spent hiking in Åre, as revealed by respondent 1. Particularly service‐minded and
5 The statements enclosed in quotation marks identify direct citations of the respondents.
95

professional personnel at the hotel and tourist information office contribute to both functional value and satisfaction: the tourist feels welcome, gets practical help, experiences value‐for‐money (“I have paid for that”), and generally feels good. Interaction with other tourists brings the possibility to meet exciting people in a relaxed environment, which encloses the social value of the vacation (“important to have human contact, to meet other kinds of people”). The respondent also described the importance of interactions with travel partners. Particularly when hanging out with people one travels with, one can exchange thoughts and talk about life. Thus, travel partners can learn more about each other and focus on relationships (i.e., family value).
Table 6.2. Means-end value chains for Case 1
Variation of activities (many different activities)
↓ It is good to have other options, e.g., if
it is raining ↓
Fun (try different experiences, get kicks)/Freedom, just being (being
thankful to nature and life)
Travel companions (hang out with people I travel with)
↓ Exchange thoughts/Talk to each other
about life ↓
Family (learning more about each other, focus on relationships)
Åre village (village with restaurants, not just wilderness)
↓ Some comfort/Can get some rest
↓ Escape from the usual environment (recovery from work)/Feeling good (renewed energy)/Relaxation (take
time to relax and enjoy)
Searching for information on the Internet
↓ Choosing between Åre and other
destinations/A goal in sight/Feels nice to make a decision
↓ Excellence (meaningful vacation)
Nature ↓
Nature means something stable/One can write a new song or a melody
↓ Inspiration/Aesthetics (beauty in nature)/Escape from the usual
environment (being in Åre allows me to get off the hamster wheel)
Equipment (rainproof clothes, shoes, spirit stove, food)
↓ Preventive measures/Avoid getting wet / Otherwise being dull/Cooking on the
sprit stove ↓
Feeling good (keeps your mood up)/Efficiency (save money, investments
for future use)
96

Table 6.2. (continues)
Service encounter (service at the reception and at the tourist information
office) ↓
Influences the hotel stay as a whole/ They are interested in us, personalized service/Professional/It is good when the personnel takes an initiative
↓ Excellence (feel welcome, get practical help)/Efficiency (I have paid for that) / Satisfaction (feeling good, a bonus)
Prior knowledge about nature ↓
Be able to comprehend what you see ↓
Satisfaction (satisfaction, enjoyment)/ Efficiency (experience more)
Interaction with other tourists ↓
Meet exciting people/Meet people in a relaxed environment
↓ Social value (important to have human contact, to meet other kinds of people)
Mental efforts ↓
Expectations ↓
Relaxation (set structure for relaxation)/ Exploration and evaluation of self (great to be looking forward to something)
Finally, the interview with respondent 1 was especially revealing in terms of
personal resources and efforts required for the successful summer holiday. First, searching for information on the Internet before the trip is most helpful for making a decision in favour of Åre and, by doing so, identifying the goals of the visit, which, in turn, leads to a most meaningful vacation. Furthermore, an ideal hiking trip requires certain investments in rainproof clothes and shoes as a measure for preventing being wet, as well as in equipment (e.g., spirit stove). These spendings contribute to the emotional value of the trip, as being equipped for the hiking trip keeps the mood up. Additionally, these preparations help to save money and constitute investments for future use, thus, enhancing the vacation’s efficiency. The respondent also revealed that satisfaction and overall quality of a hiking vacation depends on the prior knowledge about nature, since comprehension of what you see in the nature largely enhances satisfaction and enjoyment and allows you to “experience more”. Finally, mental efforts shape expectations, which “set the structure for relaxation” and, thus, enhance possibilities for exploration and evaluation of oneself (“great to be looking forward to something”).
Respondent 16 is yet another representative of the “hiking tourism” segment (Table 6.3), which, in contrast to the previous case, travels with children. The 50‐year‐old female tourist from the Stockholm region was travelling in a group consisting of two adults and two children. Visiting Åre for one week was the main
97

travel purpose. Her family rented a privately owned cottage in Duved, which is a village adjacent to Åre and is part of the Åre mountain resort. The respondent was approached on her fifth day of vacation at the Åre main square (Åre torg).
Table 6.3. Means-end value chains for Case 16
Nature (mountains) ↓
Grand ↓
Aesthetics (beautiful)/Relaxation (calm)
Locals ↓
Exchange a word or two, to hear a story ↓
Fun (occasional encounters are fun)
Hiking ↓
I like it / This activity means a lot to me↓
Relaxation (relaxing, distressful)
Equipment (hiking boots, warm clothes) ↓
Not walking in rubber boots when it is wet ↓
Excellence (feels stable), efficiency (good investment)
Travel companions (hiking with children)
↓ Being active/The children should experience it/The children should
understand how beautiful Sweden is ↓
Fun (it’s cool to be together, to go hiking with them)/ Feeling good/
Challenge (it’s cool to manage, to walk long distance)/Family (to talk)/
Epistemic value for the children (there is a lot to show to my children)/ Satisfaction (pleased, happy)
Information search (to read before planning the trip)
↓ To be prepared/I want to know what I can do so that days don’t just disappear
↓ Efficiency (to not miss anything) / Relaxation (calm, not stressed)
Nature and hiking are the two main destination characteristics that influenced
the tourist’s decision to come to Åre. Nature in mountains brings you a feeling of something “grand”. It is both beautiful and calm. Furthermore, the respondent likes hiking a lot as a relaxing and de‐stressing activity. Moreover, hiking with children is very important for the respondent, and the respective ladder was particularly detailed. More precisely, the children should experience what it means to be active and to understand how beautiful Sweden is. Hence, travelling with children brings one various benefits: “it’s cool to be together, to go hiking with them” (fun), feeling good, “it’s cool to manage, to walk long distances” (challenge);
98

talking to each other (family value), epistemic value for the children (“there is a lot to show my children” (epistemic value for the children), being pleased and happy (satisfaction). In addition, according to the respondent, occasional encounters with locals, exchanging a word or two or, possibly, hearing a story, is fun (emotional value).
Similar to a previous case (i.e., respondent 1), respondent 16 commented that proper hiking boots and warm clothes are important for a hiking trip. In particular, it is better not to walk in rubber boots when it is wet. Hence, the hiking gear makes one feel stable during the hiking (excellence) and it is a good investment (efficiency).
Finally, the respondent revealed that the information search before the trip especially helps being prepared: “I want to know what I can do so that days don’t just disappear”. Hence, investing time in reading about the destination before planning the trip contributes to both efficiency (“to not miss anything”) and relaxation (“calm, not stressed”).
Nature is the only destination characteristic that has been identified as important by the majority of “hiking tourists” (i.e., 14 cases out of 19). In addition, hiking as an activity, variation of activities, Åre village as the centre of dining, shopping and entertainment, fishing, destination accessibility, ambience, as well as summer in Åre have been repeatedly mentioned (i.e., by at least two respondents). Other destination characteristics, such as shopping, spa and pool, child‐friendliness, etc. were elicited only once.
Furthermore, “hiking tourists” frequently identified interactions within the travel group and in the service encounter as an important part of their stay in Åre, while interactions with other people, local inhabitants and friends living in Åre were mentioned less frequently.
Finally, “hiking tourists” frequently elicited various personal resources and efforts as an important personal contribution towards their summer vacation in Åre. In particular, half of the respondents mentioned equipment (primarily investments in hiking gear) and information search before the trip. Additionally, several respondents identified money, personal accommodation, time required for transportation, previous experience and the need to exercise as important inputs for a successful stay in Åre. Additionally, one respondent identified the need for mental efforts and special prior knowledge about nature (see Case 1 presented above).
The analysis of the laddering results reveals that emotional value is of primary importance for the “hiking tourism” segment. In particular, relaxation, feeling good and escape from the usual environment are the most frequently mentioned emotional benefits. Additionally, several respondents identified fun, aesthetical value, challenge, freedom and a sense of belonging as desired outcomes of their
99
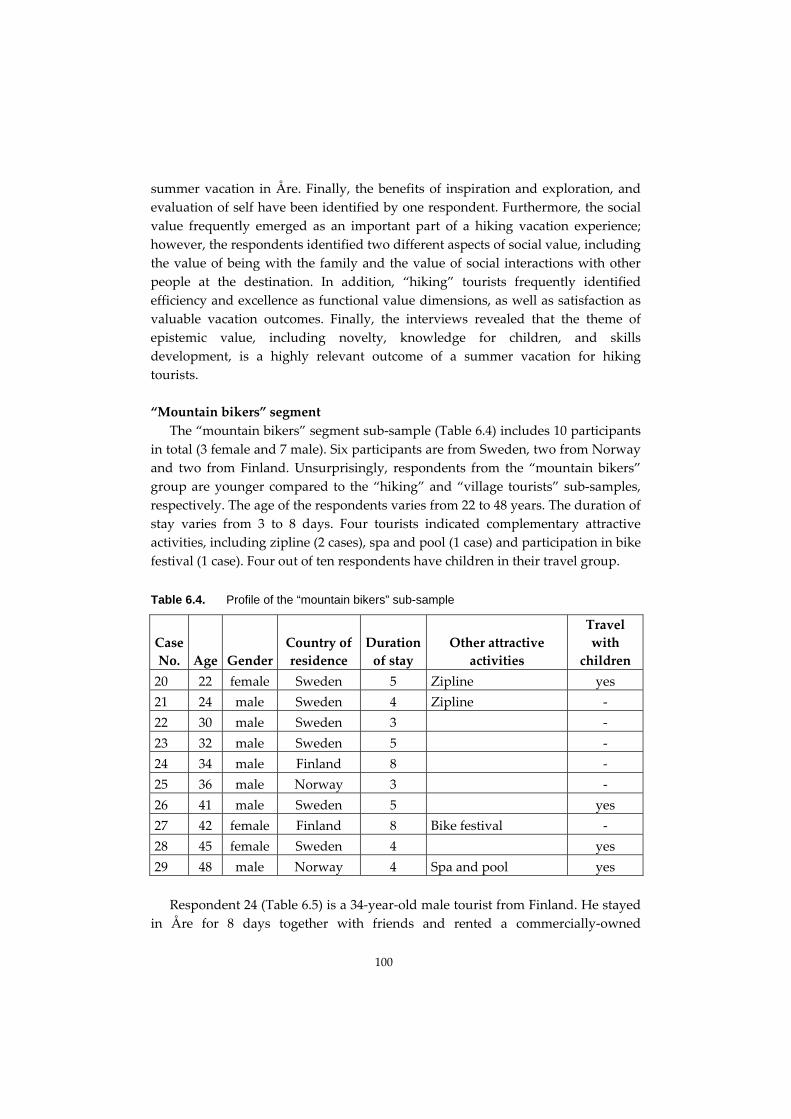
summer vacation in Åre. Finally, the benefits of inspiration and exploration, and evaluation of self have been identified by one respondent. Furthermore, the social value frequently emerged as an important part of a hiking vacation experience; however, the respondents identified two different aspects of social value, including the value of being with the family and the value of social interactions with other people at the destination. In addition, “hiking” tourists frequently identified efficiency and excellence as functional value dimensions, as well as satisfaction as valuable vacation outcomes. Finally, the interviews revealed that the theme of epistemic value, including novelty, knowledge for children, and skills development, is a highly relevant outcome of a summer vacation for hiking tourists. “Mountain bikers” segment
The “mountain bikers” segment sub‐sample (Table 6.4) includes 10 participants in total (3 female and 7 male). Six participants are from Sweden, two from Norway and two from Finland. Unsurprisingly, respondents from the “mountain bikers” group are younger compared to the “hiking” and “village tourists” sub‐samples, respectively. The age of the respondents varies from 22 to 48 years. The duration of stay varies from 3 to 8 days. Four tourists indicated complementary attractive activities, including zipline (2 cases), spa and pool (1 case) and participation in bike festival (1 case). Four out of ten respondents have children in their travel group.
Table 6.4. Profile of the “mountain bikers” sub-sample
Case No. Age Gender
Country of residence
Duration of stay
Other attractive activities
Travel with
children 20 22 female Sweden 5 Zipline yes 21 24 male Sweden 4 Zipline ‐ 22 30 male Sweden 3 ‐ 23 32 male Sweden 5 ‐ 24 34 male Finland 8 ‐ 25 36 male Norway 3 ‐ 26 41 male Sweden 5 yes 27 42 female Finland 8 Bike festival ‐ 28 45 female Sweden 4 yes 29 48 male Norway 4 Spa and pool yes Respondent 24 (Table 6.5) is a 34‐year‐old male tourist from Finland. He stayed
in Åre for 8 days together with friends and rented a commercially‐owned
100

apartment in the centre of Åre village. The travel group consisted of 6 adults. The respondent was approached at the top of the Åreskutan mountain on the sixth day after his arrival to Åre.
Table 6.5. Means-end value chains for Case 24
Åreskutan mountain, mountain biking↓
Good routes and trails/Exercise/I like it↓
Fun (rush, exhilaration)/Social interaction (get friends)/Memories / Prestige (other people treat me more
positively because I bike)
Locals ↓
Information and recommendations ↓
Excellence (they help)
Hanging out in bars, drinking beer ↓ ‐ ↓
Escape from the usual environment (cannot do it at home)/Memories (something to remember and talk
about later)
Service encounter (personnel) ↓ ‐ ↓
Excellence (good service)
Friends ↓ ‐ ↓
Safety/Fun (more fun to bike with friends)
Equipment (repair parts for the bike) ↓
Preparations/Try to do one thing for myself every year
↓ Safety/Excellence (my preparations lead
to good experience) The respondent immediately identified the Åreskutan mountain and its
mountain biking infrastructure as the main attraction of the Åre destination. The resort has routes and trails that are especially good for mountain biking, which is a type of activity the respondent particularly likes. The respondent identified a variety of mountain biking benefits, including fun (e.g., rush, exhilaration), social interactions (“get friends”), as well as memories and prestige (“other people treat me more positively because I bike”). Additionally, bars in Åre to hang out with friends and drink beer on a trip away from his family was yet another reason for the trip and an activity that the respondent identified as particularly attractive. The benefits of this activity include escape from the usual environment (“cannot do it at home”) and memories (“something to remember and talk about later”). Consequently, interactions with friends are an important part of the mountain biking trip for the respondent. In particular, it is both safer and more fun to travel
101

with friends on a mountain biking vacation. Additionally, locals are an important source of information and recommendations, which contribute to better quality of the trip. Furthermore, personnel in the service encounter similarly contribute to the overall quality (i.e., “good service”). Finally, the respondent identified equipment (particularly repair parts for the bike) as an important personal input for both the safety and excellence of the trip. These preparations are particularly important, since a mountain biking vacation is an activity the respondent tries to do regularly, i.e., at least every year.
In general, the “mountain biking” segment elicited fewer destination characteristics compared to other segments. At the same time, all ten respondents identified the Åreskutan mountain and its mountain biking infrastructure as an important factor, which influenced the decision to come to Åre. Additionally, several “mountain bikers” mentioned Åre village, the natural surroundings and the variation of activities as attractive characteristics of the Åre destination. Destination accessibility, bike festival, spa and pool offers, as well as the possibility to hang out in bars and drink beer (see Case 24 presented above) have been elicited by one respondent each. Furthermore, the analysis of the interview reveals that social interactions, including interactions with friends, service personnel, local inhabitants and other tourists, are an important part of the mountain biking vacation. Finally, the respondents identified the contribution of personal efforts and resources, including information search before the trip, money, investments especially in biking equipment, as well as the need to exercise, mental effort while biking and previous experience.
Consequently, the emotional benefits are of primary importance for “mountain bikers”. Fun is the main theme describing the benefits of the mountain biking vacation in Åre (9 out of 10 cases), followed by the value of feeling good (7 cases) and escape from the usual environment (6 cases). Additionally, “mountain bikers” mentioned relaxation, freedom, memories, safety and challenge, as well as nice and pleasant time together in a cozy atmosphere6 as valued emotional benefits of their summer vacation in Åre. Furthermore, the value of social interactions is a common
6 Respondents used the Swedish word ʺmysigtʺ to describe aspects of their Åre vacation experience. The word ʺmysigtʺ does not have a direct English translation in this context. The term expresses an emotional state of being, which implies an unexpectedly pleasant and nice experience in a “cozy” atmosphere together with family or close friends. The term is often used to describe “calm” or “pleasant” events or experiences that contrast with the busy routines of daily life. Hence, this particular benefit of the Åre vacation is closely linked with values of feeling good emotionally and escape from daily routine, as well as with the value of social interactions and being with family.
102

theme for all members of the “mountain bikers” group. Additionally, the respondents identified family value and prestige as an important part of their stay. Both value‐for‐money and overall quality dimensions frequently emerged as functional benefits of the destination stay. Additionally, three respondents mentioned overall satisfaction as the desired valued outcome. Finally, seven respondents identified different aspects of epistemic value as important results of their mountain biking vacation, including new knowledge for both themselves and the children in the travel group, as well as the development of skills. “Village tourists” segment
The remaining 11 respondents (8 females and 3 males), which are neither interested in hiking nor in mountain biking, constitute the “village tourists” sub‐sample (Table 6.6).
Table 6.6. Profile of the “village tourists” sub-sample
Case No. Age Gender
Country of residence
Duration of stay
Other attractive activities
Travel with
children 30 28 female Sweden 4 Spa and pool yes 31 32 female Norway 2 Spa and pool yes
32 37 female Norway 4 Spa and pool, shopping yes
33 39 female Sweden 1 Spa and pool yes
34 39 male Sweden 1 Orienteering (competition) yes
35 43 female Sweden 3 Spa and pool, riding the cable car, fishing yes
36 48 female Norway 3 Orienteering (competition) yes
37 52 male Sweden 1 Riding the cable car ‐ 38 56 female Sweden 2 Medical emergency ‐ 39 59 male Sweden 3 Fishing ‐ 40 59 female Sweden 4 Riding the cable car ‐ The age range of the group is from 28 to 59 years. Eight tourists are from
Sweden and three from Norway. The group is characterised by the shortest duration of stay, which varies between 1 and 4 days. The “village tourists” segment is highly heterogeneous in terms of preferred activities. First, five female tourists (3 from Sweden and 2 from Norway) in the age range from 28 to 43 years
103

accompanied by children indicated the spa and pool offer as an especially attractive activity. Second, one male tourist from Sweden (39 years old) and one female tourist from Norway (48 years old) indicated competition in orienteering as the main activity at the destination (both respondents travelled with children). Older tourists (age varies from 52 to 59) have no children in the travel group. In particular, one male tourist (52 years old) and one female tourist (59 years old) can be labelled as “excursionists”, as they indicated riding the cable car as the only attractive activity, which implies enjoying landscape and scenery without the need to engage in physical activities associated with hiking. Furthermore, one male tourist (59 years old) indicated fishing as the only attractive activity. Finally, one female tourist (56 years old) arrived at the destination due to a medical emergency that occurred during a hiking trip at a nearby destination.
Respondent 32 exemplifies the 37‐year‐old female tourist from Trøndelag in Norway, which directly neighbours the Jämtland province of Sweden where Åre is located. Visiting Åre is the main reason for her trip. She is primarily interested in the spa and pool facilities in Åre, but also the shopping possibilities. Her travel group consists of two adults and three children. The planned duration of stay is four days. The respondent was approached in the lobby of Copperhill Hotel, where she was staying for the second day since arrival. The interview produced nine ladders, which makes the case both informative and typical for the “village tourism” segment (Table 6.7).
Specifically at the elicitation stage of the interview the respondent identified a combination of six destination characteristics, including accommodation, spa and pool and shopping as most preferred activities, destination accessibility, nature surroundings and the location of destination in a foreign country, which lead to the decision to come to Åre. In particular, according to the respondent, staying at a nice hotel is important to feel calm, relaxed and to get away from stress. Possibilities to choose between different spa and pool facilities are important for all members of the travel group (both children and the respondent herself). Shopping in a neighbouring country makes the respondent feel happier, as the choice of goods is different and prices are lower, which additionally contributes to value‐for‐money of the vacation. Furthermore, the location of Åre not too far from the respondent’s place of residence, which contributes to the efficiency of the vacation (“you get much out of a short visit compared to a distant trip”). The surrounding nature, the village, and fresh air especially help the respondent to escape from the usual environment, and feel good and relaxed. Additionally, vacation in a foreign country with a different currency and language is a memorable and rich experience for all family members.
104

105
Table 6.7. Means-end value chains for Case 32
Copperhill (particular accommodation facility)
↓ Nice ↓
Relaxation (feeling calm/ relaxed/getting away from stress)
Accessibility (short distance from home)↓
Not too much time in the car ↓
Efficiency (you get much out of a short visit compared to a distant trip)
Service encounter (service at the hotel) ↓
Convenient ↓
Satisfaction (satisfied, happy)
Spa and pool facilities at Copperhill and Holiday Club
↓ Can choose different activities
↓ Family (children love the adventure
pool and swimming)/Feeling good (”It is good for me too”)
Nature ↓
Close to the village/Fresh air ↓
Escape from the usual environment (different)/Feeling good/Relaxation
Being with the family ↓ - ↓
Family (time together)/Relaxation (to relax) / Nice and pleasant time together in a cozy
atmosphere
Shopping ↓
Other choices of goods ↓
Feeling good (happy)/Efficiency (cheaper)
A foreign country ↓
Children can use the Swedish money they have/Foreign language
↓ Family (great memories for the
children)/Memories
Information from the Internet, chats with friends, prior experience
↓ New impressions
↓ Escape from the usual environment
(distraction from daily routines)/Memories (pictures to keep in your memory)

Similarly, interactions in service encounters (i.e., with hotel personnel) and spending time with the family are important components of the destination stay. Service staff at the hotel makes the stay more convenient, which especially leads to satisfaction. Travelling with children means relaxing and pleasant time together with family in a cozy atmosphere.
Finally, the respondent identified searching for information on the Internet, talking to friends, and personal prior experience as important contributions to a successful vacation in Åre, since it helps getting new impressions, thus distracting from the daily routines and getting new memorable experiences.
For respondent 37 (Table 6.8) a visit to Åre is a quick one‐day stop on a longer trip. The 52‐year‐old male tourist from the Norrbotten province of Sweden was travelling with his wife and visited Åre to take the cable‐car to the Åreskutan mountain. Table 6.8. Means-end value chains for Case 37
Nature ↓
Like it ↓
Relaxation (calm and safe)/Escape from the usual environment (opposite to work)/Aesthetics (enjoying the view)
Service encounter (personnel) ↓
Good mood/Reinforces ↓
Excellence (pleasant service)
Village ↓
Compare with other places/I have heard a lot about Åre/I have seen on
TV ↓
Epistemic value (see the reality)
Time / Money ↓ ‐ ↓
Excellence (I get experience by coming here. The greater the sacrifice, the greater the expectation of a great
experience. Since I did not spend a lot of money/time (small sacrifice), the
experience is even greater in relation to my expectations)
Cable car ↓
Comfortable way to get to the mountain top
↓ Aesthetics (the view)/Relaxation (peace
and quiet)/Excellence (awesome experience)
Nature was the first destination characteristic the respondent mentioned at the
elicitation part of the interview. In particular, the tourist likes nature, because it feels calm and safe, as opposed to the work environment and there are views to enjoy. Furthermore, the tourist wanted to see the Åre village with his own eyes
106

and compare it with other places, since he had heard a lot about it before and had seen it on TV. Additionally, the respondent mentioned the cable car as a comfortable way to get to the mountain top, to see the views, relax in a peaceful and quite surrounding and get an awesome experience. Interactions with service personnel are important for a good mood and to reinforce the service quality. Finally, the respondent commented on time and money input to the trip in the context of sacrifice minimization, leading to a higher appreciation of the overall quality of the trip: “The greater the sacrifice, the greater the expectation of a great experience. Since I did not spend a lot of money/time (small sacrifice), the experience is even greater in relation to my expectations”. Interestingly, this comment is fully in line with Zeithaml’s (1988) definition of value as a trade‐off between benefits and sacrifices.
Overall, social resources are among the most frequently mentioned by the “village tourists” segment. In particular, seven respondents mentioned the service encounter as an important interaction during their stay in Åre. Additionally, 5 out of 11 “village tourists” listed the personal travel companions as an important attribute of their vacation stay. Other social resources that “village tourists” identified at the elicitation stage of the interview include interactions with other people, local inhabitants, and friends living at the destination, respectively.
Similar to other travel segments, village tourists identified nature as the most important destination resource (5 out of 11 respondents). Similarly, the variation of activities and destination accessibility were mentioned frequently (i.e., by 4 out of 11 respondents each). However, the configurations of destination resources are somewhat different for the various activity‐based sub‐segments. For instance the “spa and pool” tourists mentioned accessibility, nature, the variation of activities, spa and pool as an activity, particular providers of accommodation, dining, adventure pool, spa and entertainment services, accommodation facilities in general, shopping, games for children, child‐friendliness of the destination, as well as the location of the destination in a foreign country. By contrast, the (two) “excursionists” indicated nature, cable car, and Åre village as key destination resources, as well as sightseeing. The two “orienteering” tourists mentioned the competition in orienteering, the variation of activities, shopping and Åre village. The “fishing” tourist listed fishing, cable car and gaming. Finally, the “medical emergency” tourist did not mention any destination resources as relevant at all.
Finally, the “village tourists” mentioned various personal resources and efforts as an important input to their vacation in Åre, including information search, planning and booking, money input, time, the need to take the train as an effort, as well as the need to exercise before the competition in orienteering.
Functional value and satisfaction are the most frequently mentioned visitation outcomes identified by various groups within the “village tourist” segment. In
107

particular efficiency related to value for money and excellence as the overall quality of visitation experience were mentioned by six respondents each. Furthermore, 9 out of 11 cases identified satisfaction as a valued outcome of their summer vacation in Åre.
Furthermore, social value is a common theme among “village tourists”, although, the social value is determined by the composition of the travel group. Particularly tourists travelling with children (i.e., “spa and pool” and “orienteering” tourists) identified the value of being with the family as an important value dimension (6 cases). Additionally, 4 respondents identified the value of social interactions as an important outcome of their vacation in Åre. Interestingly, none of the “spa and pool” tourists considered interactions outside the family group as valuable outcome of the trip.
Likewise, there are similarities among “village tourists” in terms of the valued emotional outcomes of the stay. Particularly, various “village tourists” sub‐groups frequently mentioned relaxation (6 cases), fun (6 cases), escape from the routine environment (5 cases), as well as feeling good (4 cases) as valued outcomes of destination stay. Furthermore, “spa tourists” and “excursionists” mentioned memories (3 cases) and freedom (3 cases). Additionally, one “excursionist” and one “fishing” tourist mentioned aesthetical value. “Orienteering” tourists mentioned challenge (2 cases) and good health (1 case). Finally, one “spa and pool” tourist mentioned nice and pleasant time together in a cozy atmosphere as valued emotional outcome of the destination stay. Additionally, three tourists (i.e. “excursionist”, “fishing tourist” and “medical emergency” tourist) identified new knowledge and experiences as epistemic value outcomes of their destination stays.
Hence, the interview results demonstrate that “village tourists” are highly heterogeneous, both in terms of preferred activities and utilised combinations of destination attributes, social interactions and personal resource configurations and efforts. In turn, the laddering results reveal that there is a convergence in terms of desired value outcomes between the sub‐groups with some exceptions determined by the purpose of stay and the composition of the travel group (e.g., value of being with family, value of social interactions, as well as value of new knowledge and experience). Emotional value
Various emotional value aspects represent the most frequently emerging benefits of a stay at the Åre destination during the summer season. 50% (i.e., 135 out of 271) of all means‐end sequences correspond to emotional and hedonic outcomes of the destination visitation (Sheth et al., 1991; Holbrook, 1999, 2006), while feeling good, relaxation, fun and escape from the usual environment are the most commonly mentioned emotional value dimensions. Other aspects, including
108

freedom, aesthetic value, challenge, sense of belonging, nice and pleasant time together in a cozy atmosphere, inspiration, memories and being safe, interestingly enough, are less recurrent.
Unsurprisingly, nature is the most frequently mentioned summer mountain destination resource, especially contributing to the emotional and hedonic visitation value, in terms of relaxation and escape from the usual environment (Table 6.9).
Table 6.9. Summary of relationships between resources and emotional value dimensions7
Resources Emotional value dimensions Destination resources Nature Escape (13), relaxation (12), aesthetics (6), feeling good
emotionally (5), freedom/just being (5), fun (1), challenge (1), inspiration (1)
Variation of activities
Fun (5), escape (3) , relaxation (2), freedom/just being (2), challenge (2), feeling good emotionally (1), good health (1)
Åreskutan mountain, mountain biking
Fun (8), felling good emotionally (2), escape (1), challenge (1), memories (1)
Åre village Relaxation (4), feeling good emotionally (3), escape (2), fun (2), nice and pleasant time together in a cozy atmosphere (1)
Hiking Relaxation (3), feeling good emotionally (2), fun (1), aesthetical value (1), challenge (1)
Peace and quiet Relaxation (2), escape (1), fun (1), freedom/just being (1)
Spa and pool Escape (2), relaxation (1), feeling good emotionally (1), nice and pleasant time together in a cozy atmosphere (1)
Cable car Aesthetical value (2), relaxation (1), escape (1) Fishing Fun (3), relaxation (1)
7 Both elicited resources and obtained values presented in the table are ranked from most to least frequently mentioned by the respondents. Frequencies of means‐end relationships between resources and values are provided in parentheses.
109
Table 6.9. (continues)
Resources Emotional value dimensions Social resources Travel companions
Feeling good emotionally (7), relaxation (4), escape from routine environment (3), fun (1), challenge (1), freedom/just being (1), nice and pleasant time together in a cozy atmosphere (1), being safe (1)
Service encounter Feeling good emotionally (6), memories (1) Other people Relaxation (2), feeling good emotionally (1), escape (1),
sense of belonging (1) Other tourists Fun (2), escape (1) Local inhabitants Fun (1), escape (1) Friends who live here
Fun (1), feeling good emotionally (1)
Personal efforts and resources Information search, planning and booking
Fun (1), escape (1), feeling good emotionally (1), being safe (1), relaxation (1), memories (1)
Equipment Fun (2), being safe (2), relaxation (1), feeling good emotionally (1)
Money Fun (2), escape (2), memories (1) Exercise and training
Fun (1), escape (1), feeling good emotionally (1)
Previous experience
Sense of belonging (3)
Personal accommodation
Sense of belonging (1)
The comparison of frequencies regarding relationship mentions between three
a‐priory segments reveals, however, that although all segments indicate the relationship between nature and emotional value as important, “hikers” identified this relationship three times more often compared to “mountain bikers” and “village tourists”. In particular, nature as a destination resource is linked to relaxation (e.g., peace and quiet, slower pace and charging batteries), escape from the usual environment, aesthetical value of nature, feeling good, as well as freedom and inspiration.
Similarly, the variation of activities offered by the destination demonstrates the connection with various aspects of emotional value. However, it is particularly important for “hikers” and “village tourists” and less important for “mountain
110

bikers”. For instance, the outcomes regarding the variation of activities offered by the destination include such aspects as fun and excitement, escape from daily routines, relaxation, challenge, freedom, feeling good emotionally and good health.
However, the Åreskutan mountain with mountain biking tracks, which is the third most important destination resource contributing to the emotional value, has been solely identified by the “mountain bikers” segment and is primarily linked to fun, adrenalin, exhilaration, and excitement.
Similarly, hiking as an activity and peace and quiet at the destination are only mentioned as sources of relaxation and feeling good by the “hikers” tourist segment.
Finally, Åre village as the centre of shopping, dining and entertainment is equally important to “hikers” and “mountain bikers” in terms of relaxation and feeling good, escape, fun and nice and pleasant time together in a cozy atmosphere. Yet, Åre village shows no relationship with emotional value for “village tourists”.
Furthermore, travel companions is the most important social resource contributing to the emotional value of destination stay, in terms of feeling good and having fun. Unlike other social resources, which are the components of the destination’s social environment, travel companions is in a way considered as similar to tourists’ personal resources. Simultaneously, interactions with service personnel appeared consistently in relationship with feeling good emotionally.
Additionally, the laddering process revealed the relationship between tourists’ personal efforts (i.e. in terms of information search, planning and booking) and various valued emotional outcomes, including fun, escape, feeling good, being safe, relaxation and memories. Moreover, the qualitative results suggest that a relationship exists between money and equipment as tourists’ personal resources and emotional value. Interestingly, “hikers” did not mention money as an important personal resource, while “village tourists” did not mention equipment at all.
Furthermore, personal accommodation and previous experience as tourists’ resources contribute to a sense of belonging. Finally, exercise and training have been mentioned among personal efforts behind the emotional value dimensions of fun, escape and feeling good.
Thus, qualitative findings confirm that the relationship between various resource inputs, including functional and intangible destination resources, social resources and tourists’ personal resources and efforts, as well as emotional benefits of destination visitation represent a highly complex phenomenon (Gnoth, 2007). Accordingly, although the same pool of destination resources is available to all tourists, the observed configurations of resources are very specific among the various tourist segments. Thus, some resources are solely utilised by a certain
111

segment, while other resources simultaneously identified as important by different segments contribute to certain aspects of emotional value. Therefore, characteristic consumption patterns emerge within homogeneous tourist segments. This finding is in line with Moeller’s (2010) “facility‐transformation‐usage” framework described in section 2.1.4 of this thesis.
Moreover, the qualitative results demonstrate, that emotional value of a destination visitation cannot be solely generated by destination resources; rather it is co‐created through the integration of customers’ personal resource input (Grönroos, 2006, 2008). Particularly travel companions and tourist’s personal efforts and resources represent important input sources for both emotional and hedonic dimensions of the destination value‐in‐use (Prebensen et al., 2013). Social value
The results of the laddering process revealed that social value is an important outcome of a stay at the Åre destination and, therefore, should be considered as a core dimension of destination value‐in‐use (Table 6.10).
Table 6.10. Summary of the relationships between resources and social value dimensions
Resources Social value dimensions Social resources Travel companions
Family (14), social interactions (13)
Other tourists Social interactions (4) Friends who live here
Social interactions (3)
Local inhabitants Social interactions (1) Other people Social interactions (1) Destination resources Åreskutan mountain, mountain biking
Family (2), social interactions (1), prestige (1)
Variation of activities
Family (2), social interactions (1)
Spa and pool Family (3) Hiking Family (2) Åre village Social interactions (2) Nature Family (1) Accessibility Family (1)
112

Table 6.10. (continues)
Resources Social value dimensions Personal efforts and resources Money Family (1), prestige (1) Information search, planning and booking
Family (1)
Equipment Family (1) Personal accommodation
Family (1)
Interestingly, while prestige refers to the extrinsic other‐oriented value
dimension according to Holbrook’s (1999, 2006) typology, the value of being with family and friends and sharing the experience with “loved ones” illustrates “togetherness” as the intrinsic other‐oriented customer value dimension, proposed by Komppula and Gartner (2013).
Predictably, the social value of “togetherness” has emerged most frequently as the outcome of the social resource “travel companions”. Interestingly, other tourists, local people, other people and friends living at the destination were also mentioned as resources contributing to the value of social interactions (Sheth et al., 1991; Holbrook, 1999, 2006). Thus, the destination establishes the setting facilitating interactions with family, friends and other people.
Furthermore, the “hikers” segment identifies nature, hiking activities and the variation of activities among destination resources enabling the value of being with the family, while Åre village especially encourages interactions with friends. According to the “mountain bikers” segment, Åreskutan mountain, the variation of activities, as well as spa and pool facilities are the most important components for enhancing the shared vacation experience with family and friends. Additionally, spa and pool has also been mentioned by “village tourists” in relation to the value dimension ‘being with family’.
In addition, personal efforts and resources, including information search and planning before the trip, money and equipment for “mountain bikers” and personal accommodation for “hikers”, similarly demonstrate the relationship with “togetherness” as valued outcome of the destination stay.
Finally, prestige as an extrinsic other‐oriented social value dimension (Holbrook, 1999, 2006) has emerged only once as the valued outcome of Åreskutan mountain: “Other people treat me more positively because I bike” (Finland, 34‐year‐old male, “mountain biking” segment).
The results demonstrate that value‐in‐use is co‐created not just within a dyadic relationship between the destination and the tourist; rather, the broader value
113

network is involved at all stages of service provision, including resource integration, transformation and usage, respectively (Moeller, 2010). Interestingly enough, the study findings demonstrate that the “togetherness” dimension of social value is particularly important when children are part of the travel group. Epistemic value
Novelty, knowledge, and skills development emerged as the valued outcomes of a destination stay in Åre, although not as important as the emotional and social value dimensions, respectively (Table 6.11).
Table 6.11. Summary of the relationships between resources and epistemic value
dimensions
Resources Epistemic value dimensions Destination resources Åreskutan mountain, mountain biking
Novelty and knowledge (2), epistemic value for children (1), skills development (1)
Nature Epistemic value for children (2) Hiking Skills development (1) Åre village Novelty and knowledge (1) Variation of activities
Novelty and knowledge (1)
Social resources Other tourists Novelty and knowledge (3) Local inhabitants Novelty and knowledge (2) Travel companions Epistemic value for children (2) Other people Novelty and knowledge (1) Personal efforts and resources Information search, planning and booking
Epistemic value for children (1)
Exercise and training
Skills development (1)
Interestingly, the study participants consistently distinguished between
knowledge and experience obtained for themselves and knowledge and experience for children in the travel group, which can, thus, be classified as an intrinsic other‐oriented value dimension, similar to the altruistic value dimension by Holbrook’s (1999) typology, and the “togetherness” dimension as specified by Komppula and
114

Gartner (2013). In particular the “mountain bikers” segment indicated the link between Åreskutan mountain and the possibility for skills development and new experiences, also for the children in the travel group. Similarly, “hikers” travelling with children identified nature as a destination resource linked to the epistemic value for children.
Likewise, interaction with the local population, other tourists and other people contributed to the novelty and knowledge dimension of the epistemic value in terms of new life experience, broaden perspective and new knowledge. Additionally, the results show a clear link between travel companions and the epistemic value for children, in terms of teaching children new things and doing things together with children in the course of the trip.
The relationship between personal efforts and resources as well as the epistemic value dimension is rather weak. Particularly the “mountain bikers” segment indicated prior information search as well as planning and booking as personal efforts contributing to the epistemic value for children, while exercise and training before the trip is considered as a prerequisite for successful skill development. None of the respondents indicated any relationship between personal resources and the epistemic value.
Similar to the social value, the epistemic value is dependent on both other actors’ involvement, including destination stakeholders (e.g., interaction with local residents), and tourists’ personal network, especially when tourists travel with children. Functional value and satisfaction
In addition to emotional, social and epistemic value representing the value‐in‐use of the Åre destination visitation (Vargo & Lusch, 2004a; Grönroos, 2006, 2008), the laddering process also revealed relationships between various resources and efficiency and excellence as functional value dimensions (Stheth et al., 1991; Holbrook, 1999, 2006), as well as the overall satisfaction as valued outcome (Table 6.12).
Therefore, destination accessibility, Åre village as the centre of shopping, dining and entertainment, variation of activities available at the destination, as well as nature have been related to both functional value dimensions and overall satisfaction. Particularly the means‐end relationships have been established between accessibility and efficiency (i.e., “worth time”), Åre village, and efficiency (e.g., value‐for‐money), nature and excellence (overall positive experience of the trip), as well as the variation of activities and satisfaction (happiness, positive feeling).
115

Table 6.12. Summary of the relationships between resources, functional value dimensions and overall satisfaction
Resources Emotional value dimensions Personal efforts and resources Information search, planning and booking
Excellence (10), efficiency (6)
Equipment Excellence (8), efficiency (8) Money Efficiency (11), excellence (1) Exercise and training
Satisfaction (3), excellence (1)
Personal accommodation
Efficiency (3)
Previous experience
Efficiency (3)
Social resources Service encounter Excellence (12), satisfaction (10), efficiency (5) Travel companions Satisfaction (4), efficiency (1) Local inhabitants Efficiency (1) Other people Excellence (1) Destination resources Accessibility Efficiency (4), excellence (2), satisfaction (2) Variation of activities
Satisfaction (4), excellence (1)
Åre village Satisfaction (2), excellence (2), efficiency (1) Nature Satisfaction (2), excellence (1), efficiency (1) Åreskutan mountain, mountain biking
Excellence (2)
Cable car Excellence (1) Fishing Efficiency (1) Additionally, Åreskutan mountain and the cable car contributed to destination
excellence (i.e., overall quality), while fishing as an attractive activity is related to destination efficiency (i.e., value in relation to costs).
Furthermore, interactions with service personnel have been frequently related to destination excellence and efficiency, as well as overall satisfaction. Similarly, the means‐end relationship has been established between travel companions and destination efficiency and overall satisfaction.
116

Finally, personal efforts and resources, especially prior information search and planning, as well as money, equipment and previous experience are important factors behind the functional value dimensions, while exercise and training before the trip has been related to the overall satisfaction.
Interestingly, more than half of the means‐end sequences identifying the functional value dimensions as the outcome of the destination visitation demonstrate a strong link to tourists’ personal efforts and resources. However, personal efforts and resources were not perceived as equally important as inputs to the emotional, social and epistemic dimensions of value‐in‐use. The qualitative findings are, therefore, in line with the well‐established conceptualization of overall quality and value as perceived sacrifice (Zeithaml, 1988). However, the gained results illustrate a further need to clearly define the relevant dimensions of destination value‐in‐use in order to model the relationships between the tourist and the destination and, thus, to better understand the value proposition of a tourism destination (Grönroos, 2000, 2008; Gnoth, 2007). Value scale development
As the next step, the revealed vacation benefits of Åre as a multi‐segment summer mountain destination served as an input to the destination‐specific scale development for the value‐in‐use construct of the CBDBE model (Table 6.13). For this purpose, the list of the qualitatively identified destination‐specific visitation outcomes have been matched against relevant items available in prior tourism literature as recommended by Churchill (1979).
The Perceived Value Scale (PVS) by Williams and Soutar (2009) sets up the framework for the value‐in‐use scale development. Particularly, the PVS scale has been developed for the adventure tourism context and is an adaptation of Sweeney and Soutar’s (2001) operationalization of Sheth et al.’s (1991) multidimensional model of perceived value.
First, the functional value dimension reflects the aspects of overall quality, which summer tourists in Åre identified as an expected vacation outcome (i.e., excellence). Similarly, vacation efficiency relates to the value‐for‐money dimension of the perceived value construct integrated by Williams and Soutar (2009). For the purposes of testing the CBDBE model in a summer tourism context, this thesis integrates “value‐for‐money” as an isolated construct, which particularly should depict the efficiency of the summer vacation in Åre.
Furthermore, the PVS measures of emotional value match the benefits of fun (i.e., excitement) and feeling good emotionally (e.g., feeling of well‐being). Additionally, the social value measures in Williams and Soutar (2009) depict the benefit of prestige, which emerged as a valuable outcome of the mountain biking vacation. Finally, the novelty value dimension of PVS relates to the novelty and
117

knowledge aspects of epistemic value identified as important outcomes of a summer vacation in Åre.
Table 6.13. Development of the value-in-use scale for a summer mountain destination
Value dimension
Item Source
Emotional value Relaxation I found peace and quietness Pan & Ryan, 2007;
Skår et al., 2008; Haukeland et al., 2010; Raadik et al., 2010
I was able to relax mentally during my stay in Åre
Pan & Ryan, 2007
I was able to relax physically during my stay in Åre
Pan & Ryan, 2007; Haukeland et al., 2010
I found new strength and energy during my stay in Åre
Skår et al., 2008
Feel good My stay in Åre produced feelings of well‐being for me
Williams & Soutar, 2009
My stay in Åre made me feel happy My stay in Åre made me joyful
Escape from routine environment
In Åre, I was able to avoid the hustle and bustle of daily life
Pan & Ryan, 2007
In Åre, I was able to relax from my daily routines
Skår et al., 2008
In Åre, I was able to experience a feeling of freedom
Haukeland et al., 2010
In Åre, I was able to encounter something different from everyday life
Fun Åre offers fun and excitement Adapted from Åre winter study Åre is a thrilling summer destination
I experienced speed and action during my stay in Åre
Skår et al., 2008
Aesthetic value
In Åre, I experienced the beauty of nature
Haukeland et al., 2010 Raadik et al., 2010
In Åre, I saw spectacular views Raadik et al., 2010 Sense of belonging
I got a sense of belonging during my stay in Åre
Pan & Ryan, 2007
118

Table 6.13. (continues)
Value dimension
Item Source
Memories Åre offers a diversity of summer experiences
Adapted from Åre winter study
After my stay in Åre, I feel I have a story to tell
Raadik et al., 2010
Challenge In Åre, I was able to challenge my abilities
Pan & Ryan, 2007
In Åre, I could perform demanding physical activities in nature
Haukeland et al., 2010
In Åre, I used my body in a comprehensive way
Skår et al., 2008
In Åre, I got exercise and training Social value Family and social interactions
In Åre, I could be with my family Skår et al., 2008 In Åre, I could build friendships with others
Pan & Ryan, 2007
In Åre, I could be with my friends In Åre I had a good time with friends I experienced greater closeness to my travel companions during my stay in Åre
Haukeland et al., 2010
Prestige Summer vacation in Åre gives social approval from others
Williams & Soutar, 2009
Summer vacation in Åre improves the way a person is perceived Summer vacation in Åre helps to give other people a good impression
Epistemic value Novelty and knowledge
I can learn about nature during my stay in Åre
Pan & Ryan, 2007
In Åre, I can discover new places and things
Novelty and knowledge for children
During my stay in Åre, I can teach my children about nature
Derived from Pan & Ryan, 2007
In Åre, I can show new places and things to my children
119

Hence, the Perceived Value Scale, implemented by Williams and Soutar (2009), covers all value relevant dimensions identified in the course of the qualitative study on the benefits of an Åre vacation in the summer season. However, the underlying structure of emotional, social and epistemic value is only fragmentally covered by PVS measures. Therefore, the obtained benefits of an Åre vacation have been compared with measures of the Recreational Experience Preference (REP), initially developed within the motivation theory framework for measuring the desired and expected goals of leisure activities (Manfredo, Driver, & Tarrant, 1996) and, later implemented in the context of national park experiences (Raadik et al., 2010) and mountain biking motivation (Skår et al., 2008). Additionally, the Leisure Motivation Scale (LMS) measures (Beard & Ragheb 1980; Ragheb & Beard 1982), which Pan and Ryan (2007) adjusted to a mountain area context, as well as the Nature Orientation Scale, tested for nature‐based tourism in mountain areas by Haukeland et al. (2010), complemented the pool of items used for developing the value‐in‐use scale for the purposes of CBDBE model testing.
The particular mountain biking motivation to experience speed and excitement (Skår et al., 2008) overlaps with the emotional value dimension of fun described by the “mountain biking” segment of summer tourists in Åre. Furthermore, the measures of relaxation (Pan & Ryan, 2007), seeking solitude (Raadik et al., 2010), inspiration (Haukeland et al., 2010) and contemplation (Skår et al., 2008) depict the calm atmosphere, tranquillity, peacefulness, quietness, mental and physical relaxation, the need to refresh the mind, gain inspiration and get new strength and energy, avoid the hustle and bustle of daily life and relax from daily routines, comprehensively describe the benefits of relaxation, inspiration, freedom and escape from routine environment identified by the respondents of the qualitative summer study in Åre.
Similarly, the leisure goals of seeking solitude and experiencing places (Raadik et al., 2010), as well as the motivation to get inspiration (Haukeland et al., 2010), and to experience “nature and place” and “speed and excitement” (Skår et al., 2009) integrate the measures of seeing spectacular views and dramatic landscapes as well as experiencing the beauty of nature, which directly link to the aesthetic value benefits of the Åre summer vacation.
The prior tourism research developed a wide range of measures related to challenge as the major motivational goal of nature‐based tourism, which, similarly, also various tourism segments in Åre identified as an important outcome of their summer vacation in the mountain summer resort. Particularly, the related dimensions of leisure motivation include mastery (Pan & Ryan, 2007), challenge (Skår et al., 2008; Haukeland et al, 2010; Raadik et al., 2010), and physical exercise (Skår et al., 2008), thus, depicting possibilities for challenging abilities, exercise and
120

training, using the body in a comprehensive way, and performing demanding physical activities in the nature.
Additionally, Raadik et al. (2010) integrated the measure “to have a story to tell” as a part of the leisure goal of experiencing places, which is linked to the benefit of obtaining memorable experiences as identified by Åre summer tourists. Finally, Pan and Ryan (2007) consider sense of belonging as a leisure motivation dimension.
The nature‐based motivation studies (Pan & Ryan, 2007; Skår et al., 2008; Haukeland et al., 2010) similarly reveal expectations about social value dimensions, including interactions with the family, social interactions, as well as prestige, which support the findings from the qualitative summer study in Åre. Particularly, being with the family is considered as a measure related to the social relations dimension in Skår et al. (2008). Furthermore, Pan and Ryan (2007), Skår et al. (2008), and Haukeland et al. (2010) identify social relations with friends and co‐travelers as an important leisure goal for nature‐based and mountain biking tourism. Additionally, Skår et al. (2008) integrate measures related to equipment and attention as a measure of prestige connected to mountain biking activities, which relates to the social value dimension in Williams and Soutar (2009).
Finally, the intellectual motivation behind nature‐based tourism in mountain areas in Pan and Ryan (2007) complement the novelty value measures utilized by Williams and Soutar (2009) and is related to the epistemic value of novelty and knowledge identified by summer tourists in Åre. Simultaneously, the literature does not offer measures of expected or obtained epistemic value related to children in the travel group, which, however, tourists in Åre repeatedly identified as important benefits of their summer vacation. Hence, as shown in table 6.13, the respective measures were additionally developed, based on items found in Pan and Ryan (2007).
As the final step, the operationalization of the value‐in‐use construct integrates the modified measures of emotional values, as already utilized in the winter study (Chapter 5). Particularly, the measures of fun, excitement and thrill, as well as diversity of summer holiday experiences complemented the emotional value dimension of the value‐in‐use scale. Hence, the proposed value‐in‐use scale developed within the framework of the CBDBE model proposed in this thesis reflects the destination‐specific benefits of summer vacation as identified by the main tourist segments of Åre, but it also integrates prior findings of the tourism literature with a special emphasis on desired benefits of nature‐based tourism in mountain areas, as well as mountain biking tourism (Pan & Ryan, 2007; Skår et al., 2008; Williams & Soutar, 2009; Haukeland et al., 2010; Raadik et al., 2010), and, finally, it connects to previous CBDBE model testing in Åre in a winter season context.
121

6.2. Validating the CBDBE model for a summer mountain
destination 6.2.1. Revision of the CBDBE model measurement instrument for a summer
mountain destination case The design of the survey instrument for the summer case study follows the
same structure as already established for the winter mountain destination case. Furthermore, the scales measuring destination awareness, value‐for‐money and destination brand loyalty replicate the respective scales used for the winter study with only minor adjustments (i.e., substituting the word “winter” for “summer”). However, the operationalization of the destination resources and the value‐in‐use dimensions pertaining to the CBDBE model is now proposed based on a destination‐specific means‐end hierarchy between destination attributes, social interactions with service personnel, local residents and other tourists, as well as tourists’ own resources, and the outcomes of destination visitation.
First, a total of 40 functional destination attributes has been deduced from the list of destination resources identified during the elicitation stage of the qualitative summer study. Additionally, four intangible attributes and four social attributes are employed similar to the winter study. A satisfaction scale was employed to measure the customers’ perception of destination resources. Item‐rating ranges from 1=strongly disagree to 5=strongly agree.
Finally, in order to measure the value‐in‐use, destination‐specific benefits have been matched against relevant items of the Perceived Value Scale (PVS) by Williams and Soutar (2009), complemented by the Recreational Experience Preference (REP) scale items used by Skår et al. (2008) and Raadik et al. (2010), nature orientation scale in Haukeland et al. (2010), as well as items of the Leisure Motivation Scale (LMS) in Pan and Ryan (2007). More specifically, the construct operationalization integrates both the general measures of emotional, social and epistemic value (Williams & Soutar, 2009), as well as aspects specific to summer mountain destinations as identified in the tourism literature (Haukeland et al., 2010); Raadik et al., 2010; Pan & Ryan, 2007; Skår et al., 2008). In particular the proposed scale captures such aspects as relaxation, belonging, mastery, social value and intellectual value (Pan & Ryan, 2007), contemplation, speed and excitement, challenge, physical exercise and value of social relations (Skår et al., 2008), experiencing places, solitude and self‐discovery (Raadik et al., 2010), as well as inspiration, challenge and recreation (Haukeland et al., 2010),
In total, 35 value‐in‐use items were formulated in the form of statements and rated on a five point Likert agreement scale (i.e. 1=strongly disagree; 5=strongly agree). As the next step, the proposed scale has been integrated into the CBDBE
122

measurement instrument developed in order to collect structured data from summer tourists in Åre using a web‐based survey.
6.2.2. Data collection and preparation The questionnaire was available in English and Swedish. In December 2012
data was collected by using a web‐based email survey. More precisely, 3,957 email addresses of tourists who visited Åre during the summer season 2012 were provided by key destination stakeholders involved in the “Engineering the Knowledge Destination through Customer‐based Competence Development” project financed by the KK‐foundation. The response rate was 22% as 854 tourists, who visited Åre in summer season 2012, responded to the email invitation. The number of usable questionnaires was, however, lower. In total, 522 respondents answered all three items in the destination brand loyalty section of the questionnaire.
Table 6.14 provides details on the demographic characteristics and visitation behaviour of the study sample. The table additionally demonstrates the shares of a‐priory segments, including hiking tourists, mountain biking tourists and village tourists, identified by examining the attractive activities profile, as well actual participation in the activities.8
Similar to the winter study, the issue of missing values poses constraints on the data analysis. First of all, only one respondent answered all 91 questions intended for model testing. Furthermore, only six items out of the 40 functional destination attributes show a response rate above 90%. Similarly, only 20 out of 35 value‐in‐use items have a share of missing values below 10%. Additionally, one intangible attribute item (i.e., family friendliness) shows an 84% response rate, while three out of four social attributes items (i.e., local people friendliness and hospitality, other tourists’ behaviour and other tourists’ friendliness) have a share of missing values in the range from 18% to 20%. However, the social and intangible attribute items
8 The three a‐priori segments have been identified based on the responses to the question about attractive activities and corrected based on responses to the attribute satisfaction question for the respective activity. First, respondents who selected “mountain biking” as an attractive activity were labeled as a “mountain biking” segment, with the exclusion of those respondents who chose the options “I have no opinion” or “I did not participate in the activity” for the relative satisfaction question or skipped that question. Second, respondents who indicated “hiking” as an attractive activity and provided evaluation of hiking in the attribute satisfaction section of the questionnaire were labeled as a “hiking tourism” segment. The remaining respondents (i.e. neither interested in hiking nor in mountain biking) were labeled as a “village tourists” segment.
123

exceeding the missing values threshold have been preserved in order to represent the respective categories of destination resources.
Table 6.14. Demographic and visitation behaviour characteristics of the respondents
Item N = 522
FrequencyValid Percent
Gender female 223 44% male 287 56% Total 510 100%
Country of residence Sweden, including 406 78% Stockholmsregionen 123 30%
Västernorrland 52 13% Jämtland 51 13%
Västra Götaland 39 10% Gävleborg 30 7% Uppsala 21 5%
Other Swedish regions 90 22% Norway 92 18% Finland 12 2% Other 8 2%
Total 518 100% Age
up to 25 years old 9 2% 26‐35 years old 72 14% 36‐45 years old 169 34% 46‐55 years old 159 32% 56‐65 years old 61 12%
66 years and older 34 7% Total 504 100%
124

Table 6.14. (continues)
Item N = 522
FrequencyValid Percent
Number of previous visits to the destination in summer it was my first visit 124 24%
1 time 70 13% 2‐3 times 115 22% 4‐5 times 76 15%
6 times or more 135 26% Total 520 100%
Number of previous visits to the destination in winter Never 108 21% 1 time 64 12%
2‐3 times 74 14% 4‐5 times 45 9%
6 times or more 224 43% Total 515 100%
Type of accommodation Hotel 274 54%
Rented apartment 154 30% Rented cabin 38 7%
Own apartment 21 4% Ownership 14 3% Own cabin 9 2% Camping 1 0%
Total 511 100% Children in the travel group
Yes 262 50% No 260 50%
Total 522 100% Travel segment
Hiking tourists 194 37% Mountain biking tourists 132 25%
Village tourists 196 38% Total 522 100%
125

Furthermore, exploratory Factor Analysis (VariMax) procedure has been
employed in order to examine the remaining functional destination attribute items, which constituted one factor. Again, according to Field (2005), missing values were substituted by means. However, the destination accessibility item has been removed since factor loadings were below 0.5. Furthermore, the “quality of accommodation” item has been removed due to a low communalities value (0.280) negatively affecting the total variance explained by a one‐factor solution (i.e., 52%). As a result, the produced one‐factor solution explains up to 60% of the total variance. Moreover, the KMO overall measure of sampling adequacy is at a satisfactory level of 0.675. The factor loadings vary from 0.666 to 0.847, communalities vary from 0.444 to 0.729, and Cronbach’s alpha coefficient value is 0.758 (Janssens et al., 2008). The remaining four items combine the perception of natural landscapes and nature quality with the variety of dining, shopping, entertainment and activities offered by the mountain village destination.
Finally, as suggested by Hair et al. (2010) and Janssens et al. (2008), Exploratory Factor Analysis (principal axis factoring, orthogonal varimax rotation, and cases with missing values replaced by means) was employed in order to examine the underlying factor‐structure of the visitation outcome. After removal of items with factor loadings below 0.5 (sense of belonging) and with factor loadings above 0.4 on more than one factor (happy, joyful, wellbeing, different from everyday life, experience the beauty of nature), the analysis reached a three‐factor solution explaining 69% of total variance (Table 6.15). The KMO measure is 0.903 which is well above the recommended threshold (Janssens et al., 2008). Particularly the sub‐dimensions of the destination value‐in‐use construct represent various aspects of the destination emotional value, including relaxation and escape, and summer experience, as well physical exercise.
The share of missing values for destination awareness and value‐for‐money items was relatively low and did not exceed 5%. Therefore, missing value substitution was similarly employed (Field, 2005). Table 6.16 shows means and standard deviations values for variables selected for CBDBE analysis. Additionally, z‐score‐examination revealed outliners (z>3.29). The substitution procedure similarly applied in the winter study case has affected a total of 22 items, while the number of adjusted scores varied from 2 to 7 per item and, therefore, did not exceed 2% per item (Hair et al., 2010).
126

127
Table 6.15. Empirical dimensionality of destination value-in-use
Factors/Items Factor loadings Communalities Eigenvalue
Variance explained (%)
Conbachʹs alpha
Relax and Escape I was able to relax mentally during my stay in Åre 0.815 0.762
6.895 49.249 0.915
I was able to relax physically during my stay in Åre 0.800 0.674 In Åre I was able to avoid the hustle and bustle of daily life 0.793 0.672 In Åre I was able to relax from my daily routines 0.776 0.716 I found peace and quiet 0.763 0.650 In Åre I was able to experience a feeling of freedom 0.709 0.708 I found new strength and energy during my stay in Åre 0.653 0.624
Summer experience Åre is a thrilling summer destination 0.779 0.671
1.665 11.892 0.836 Åre offers a diversity of summer experiences 0.764 0.691 Åre offers fun and excitement 0.759 0.610 After my stay in Åre I feel I have a story to tell 0.685 0.634 In Åre I saw spectacular views 0.585 0.478 Exercise
In Åre I got exercise and training 0.919 0.906 1.141 8.153 0.909
In Åre I used my body in a comprehensive way 0.906 0.905

Table 6.16. Descriptive statistics
Items N Mean Std. Deviation
Destination awareness I see a lot of ads about Åre 500 3.67 0.994 I often read about Åre in newspapers and magazines
498 3.39 1.066
Many people know Åre as a mountain summer resort
496 3.32 1.067
Functional resources Natural landscape and scenery 518 4.70 0.557 Quality of the natural environment 508 4.62 0.612 Åre village as the centre of shopping, dining and entertainment
493 3.93 0.928
Diversity of activities offered 474 4.25 0.803 Intangible resources
Peaceful and restful atmosphere 509 4.45 0.753 Cleanliness and tidiness 514 4.22 0.713 Family‐friendliness 438 4.24 0.796 Safety and security 479 4.39 0.720
Social resources Friendliness and professionalism of employees 493 4.21 0.756 Behaviour of other tourists 424 3.95 0.822 Friendliness of other tourists 418 3.96 0.799 Hospitality and friendliness of local people 429 4.22 0.762
Relax and escape I found peace and quiet 504 4.22 0.847 I was able to relax mentally during my stay in Åre
505 4.32 0.821
I was able to relax physically during my stay in Åre
491 4.13 0.982
I found new strength and energy during my stay in Åre
484 4.29 0.845
In Åre I was able to avoid the hustle and bustle of daily life
484 4.04 0.946
In Åre I was able to relax from my daily routines 500 4.31 0.809 In Åre I was able to experience a feeling of freedom
492 4.22 0.842
128

Table 6.16. (continues)
Items N Mean Std. Deviation
Summer experience Åre offers fun and excitement 479 4.14 0.840 Åre is a thrilling summer destination 500 4.07 0.887 In Åre I saw spectacular views 503 4.28 0.877 Åre offers a diversity of summer experiences 491 4.21 0.803 After my stay in Åre I feel I have a story to tell 502 4.34 0.763
Exercise In Åre I used my body in a comprehensive way 473 4.10 1.004 In Åre I got exercise and training 474 4.12 1.046
Value‐for‐money Good value for money 507 3.48 0.977 Reasonable prices 514 3.25 1.001
Destination loyalty I will come back to Åre in summer within 2 years 522 4.18 1.064 I consider Åre to be my first choice of a mountain summer resort
522 2.94 1.322
I will encourage friends and relatives to visit Åre in summer
522 4.20 0.986
6.2.3. Measurement model testing
The validation of the measurement constructs by means of Confirmatory Factor analysis confirmed the unidimensionality of the specified measurement model (Hair et al. 2010). Particularly all unstandardized loadings (i.e., regression weights) were statistically different from zero, all t‐values were higher than 1.96 and varied from 5.982 to 20.117, and all standardized loadings were above the required minimum of 0.50. However, the model‐of‐fit statistics results did not fully satisfy recommended thresholds (Hair et al., 2010).
More precisely, the relationship between the Chi‐square value and the number of degrees of freedom substantially exceeded both the required minimum of 2 (Janssens et al., 2008) and a more “generous” threshold of 3 (Hair et al., 2010) (χ2/df = 4.121). Moreover, the Goodness‐of‐fit Index (GFI = 0.793), the Adjusted Goodness‐of‐fit Index (AGFI = 0.759), the Tucker‐Lewis Index (TLI = 0.840) and Comparative Fit Index (CFI = 0.854) were all below recommended thresholds (Janssens et al., 2008; Hair et al., 2010). The Root Mean Square Error of Approximation (RMSEA = 0.077) indicated an acceptable fit, although, it was
129

below 0.05 threshold for a good fit. Finally, the Standardized Root Mean Square Residual (SRMR = 0.077) was just slightly below the recommended cut‐off value of 0.08.
Examination of standardized (normalized) residuals revealed that most of the values in the matrix were below two in absolute values (Jöreskog & Sörbom, 1984). However, a number of values in the matrix above 2.58 indicate possible model misspecification. Moreover, the values above 4 signal an unacceptable degree of error, which required removal of several problematic items (Hair et al., 2010).
In particular two functional attribute items “diversity of activities offered” and “Åre village as the centre of shopping, dining and entertainment”, one intangible attributes item “peaceful and restful atmosphere”, one social attributes item “hospitality and friendliness of local people “, two relaxation and escape value‐in‐use items “I was able to relax physically during my stay in Åre” and “I found new strength and energy during my stay in Åre” and one summer experience value‐in‐use item “in Åre I saw spectacular views” were removed from the analysis. Additionally, the social attributes item “Friendliness and professionalism of employees” was combined with the remaining intangible attribute items. The removal of 20% of measurement items represent an acceptable level of measurement model adjustment and allows further model testing with remaining data (Hair et al., 2010). From the theoretical point of view, the removal of items can be explained by a great degree of heterogeneity both between and within the tourist segments (e.g., based on the composition of the travel group) in terms of the combination of utilised resources and the structure of desired visitation outcomes (Moeller, 2010), which was particularly observed at the qualitative stage of the summer study.
Model modification substantially improved the measurement model fit statistics. Although the Goodness‐of‐fit Index (GFI = 0.899) just reached the recommended threshold of 0.90, normed‐χ2 statistics (χ²/df = 2.540) shows satisfactory fit, and all other indexes satisfy the cut‐off requirements as both incremental (CFI = 0.943. NFI = 0.910) as well as absolute fit indices (RMSEA = 0.054. SRMR = 0.053) rank well above recommended thresholds (Hair et al., 2010). Furthermore, after the performed adjustments, the estimated model shows satisfactory measurement results (Table 6.17).
130

Table 6.17. Testing of the CBDBE measurement model
Constructs Scale items
Composite Reliability
Standardized Loadings
t Value (CR)
SMC AVE
Destination awareness
AW1 0.79 0.529 0.280 0.56 AW2 0.805 11.057 0.648 AW3 0.867 11.396 0.752
Functional attributes (nature)
NAT1 0.86 0.819 0.671 0.76 NAT2 0.916 15.269 0.840
Intangible attributes
INT1 0.85 0.811 18.537 0.658 0.59
INT2 0.788 17.898 0.621 INT3 0.772 0.597 INT4 0.700 15.969 0.490
Social attributes (other tourists)
SOC1 0.95 0.940 0.884 0.90
SOC2 0.953 30.618 0.908
Value‐in‐use (relaxation and escape)
REL1 0.90 0.716 0.512 0.65 REL2 0.781 17.567 0.610 REL3 0.795 17.225 0.632 REL4 0.878 18.756 0.771 REL5 0.854 18.253 0.729
Value‐in‐use (summer experience)
EXP1 0.83 0.670 0.449 0.54 EXP2 0.752 15.009 0.565 EXP3 0.781 14.836 0.609 EXP4 0.745 14.173 0.555
Value‐in‐use (excercise)
TRA1 0.91 0.953 0.908 0.84
TRA2 0.876 17.351 0.768 Value‐for‐money
VFM1 0.90 0.948 0.899 0.82 VFM2 0.855 17.512 0.731
Destination loyalty
LOY1 0.75 0.638 0.407 0.50
LOY2 0.665 12.473 0.442 LOY3 0.801 13.040 0.642
131

Table 6.17. (continues)
Constructs Scale items
Composite Reliability
Standardized Loadings
t Value (CR)
SMC AVE
Destination resources
NAT 0.79 0.615 0.379 0.56 INT 0.877 9.747 0.770 SOC 0.736 9.739 0.542
Value‐in‐use REL 0.79 0.798 0.636 0.57 TRA 0.525 9.581 0.275 EXP 0.897 11.323 0.805
Table 6.18 displays the results of discriminant validity testing. While for most
pairs of constructs discriminant validity is confirmed, AVE values are slightly lower than the squared correlation estimates for the pair “Summer experience” – “Loyalty”. Considering that the constructs are meaningfully distinct, the discriminant test results signal that further efforts to strengthen construct measurement are necessary, particularly to further develop the theoretical conceptualization of the destination loyalty as a core CBDBE model dimension (Hair et al., 2010).
Table 6.18. Discriminant validity of the CBDBE model measurement scale
LOY VFM AW TRA EXP REL SOC INT NAT
LOY 0,500 VFM 0,203 0,820 AW 0,127 0,048 0,560 TRA 0,199 0,057 0,031 0,840 EXP 0,581 0,165 0,089 0,222 0,540 REL 0,460 0,130 0,071 0,176 0,513 0,650 SOC 0,171 0,171 0,042 0,086 0,250 0,198 0,900 INT 0,244 0,242 0,060 0,122 0,355 0,281 0,417 0,590 NAT 0,120 0,119 0,029 0,060 0,175 0,138 0,205 0,292 0,760
Overall, however, the results of the CFA are satisfactory. The next step in the analysis is, thus, to transform the validated measurement model into the structural model and to perform the path analysis to test the hypothesised causal relationships between the model constructs.
132

6.2.4. Path analysis results Figure 6.1 displays the path diagram and shows standardized path estimates
for the CBDBE structural model, as well as the squared multiple correlations (i.e., R2) for the endogenous model constructs.
Figure 6.1. Standardized path estimates for the revised CBDBE structural model
The Goodness‐of‐fit statistics relating to the path model are all satisfactory
(GFI = 0.896; RMSEA = 0.055 (LL 0.050; UL 0.060); SRMR = 0.057; χ2/df = 2.575 (806.024/313); TLI = 0.93; CFI = 0.94; AGFI = 0.87). Furthermore, all hypothesized relationships between the model constructs are statistically significant (Table 6.19).
AW
VFM
LOY
NAT INT
VIU
PVFM,LOY = 0.10 p=0.024 PVIU,LOY = 0.78 p=0.000 R2 = 0.33
R2 = 0.69
R2 = 0.56
DRES
PAW,DRES = 0.32 p=0.000
PDRES,VIU = 0.75 p=0.000
PDRES,VFM = 0.57 p=0.000
– confirmed
Poutcome, predictor – path coefficient
R2 = 0.10
SOC
REL
EXP
TRA
133

Table 6.19. Structural parameter estimates for the CBDBE model
Structural Relationships
Unstandardized Parameter Estimate
Standard Error
t‐Value Standardized Parameter Estimate
H1: AW DRES 0.131 0.025 5.197 0.322 H2: DRES VIU 1.547 0.180 8.616 0.750 H3: DRES VFM 2.363 0.275 8.581 0.573 H4: VIU LOY 1.144 0.117 9.797 0.783 H5: VFM LOY 0.075 0.033 2.260 0.103 Interestingly, the path model testing results for summer season demonstrate
strong similarities with the winter season case in terms of the strength of the hypothesized relationships. In particular the statistically significant relationship between destination awareness and customers’ perceptions of destination resources is rather weak. Therefore, the squared multiple correlations (i.e., R2) for destination resources are relatively low for both the winter and the summer season (R2DRES(winter) = 0.12; R2DRES(summer) = 0.10). This implies that only a marginal share of variance of the perception of destination resources can be explained by destination awareness. Furthermore, both winter and summer cases demonstrate that the relationship between value‐for‐money and destination loyalty is relatively weak (i.e., as low as P = 0.13 p=0.000 for the winter case and P = 0.10 p=0.024 for the summer case).
On the contrary, the relationship between value‐in‐use, which in both cases integrates various aspects of emotional and hedonic value, and destination loyalty is relatively strong (P = 0.69 p=0.000 for winter case and P = 0.78 p=0.000 for summer case), while the squared multiple correlation (R2) for the destination loyalty construct is as high as 0.59 in winter and 0.69 in summer, respectively.
Interestingly, the R2 values for value‐in‐use and value‐for‐money for the summer season are smaller compared to the winter season (R2VIU(winter) = 0.64; R2VIU(summer) = 0.56; R2VFM(winter) = 0.49; R2VFM(summer) = 0.33). Therefore, the combination of relevant destination resources, which is a direct antecedent of both constructs, should be examined more thoroughly, particularly by defining and testing the model separately for main segments of the summer mountain destination, which, typically, offers more diversity than the winter destination (Chekalina, Fuchs, & Lexhagen, 2014).
6.2.5. Developing and testing segment-specific CBDBE models As previously discussed, the heterogeneity of customers’ resources, in turn,
causing the heterogeneity of valued outcomes from the consumption of goods and
134

services is one of the major premises of the service provision process (Moeller, 2010). Therefore, considering the differences in both the composition of destination resources and the value‐in‐use dimensions revealed at the qualitative summer study stage, the following analysis demonstrates an effort to cross‐validate the proposed CBDBE model separately for the major a‐priory customer segments of Åre as a summer mountain destination, including hiking tourists, mountain biking tourists and village tourists, respectively. The respective sizes of the subsamples are 194 respondents for the hiking tourism segment, 132 for the mountain biking tourism segment and 196 for the village tourism segment. Table 6.20 provides details on the demographic characteristics and the visitation behaviour separately for each customer sub‐sample.
In order to ensure comparability of model testing results, destination awareness, value‐for‐money, destination loyalty, as well as the intangible and social dimensions of destination resources, were measured with the same items as used to validate the CBDBE model for the whole sample (N=522).
Functional destination resources, as well as value‐in‐use measures were, however, selected among items with at least 90% response rate by employing Exploratory Factor analysis (principal axis factoring, orthogonal varimax rotation, and cases with missing values replaced by means). First, for the hiking tourism segment, EFA produced a two‐factor solution explaining 66% of the total variance (KMO = 0.702, standardized loadings vary from 0.620 to 0.874). “Nature” as a sub‐dimension of the functional destination resources integrates measures of nature and landscape, nature quality and accommodation quality. The “village” dimension reflects Åre’s village architecture, as well as the variety of dining, shopping, and entertainment offered by the mountain village destination as well as accessibility of attractions and facilities.
Second, for the mountain biking segment, EFA produced a two‐factor solution (KMO = 0.645, standardized loadings vary from 0.665 to 0.918). Here, the “nature and village” factor combines measures of nature and landscape, nature quality, variety of dining, shopping, and entertainment offered by the mountain village destination as well as accessibility of attractions and facilities. The “mountain biking” dimension includes measures of satisfaction with mountain biking as an activity and Åre Bike Park as the supporting infrastructure.
Finally, for the village tourism segment, EFA produced one factor “nature and village” (KMO = 0.600, factor loadings varying from 0.660 to 0.922), which includes measures of nature and landscape, nature quality, and variety of dining, shopping, and entertainment offered by the mountain village destination. Therefore, the results are partly similar to the complete sample analysis. However, for the hiking segment nature and village are split into separate sub‐dimensions considering that nature is the core resource for hiking as an activity.
135

136
Table 6.20. Demographic and visitation behaviour characteristics of respondents
Item Hiking tourists
(n=194) Mountain biking tourists (n=132)
Village tourists (n=196)
FrequencyValid Percent Frequency
Valid Percent Frequency
Valid Percent
Gender
female 99 52% 34 26% 90 47% male 90 48% 95 74% 102 53% Total 189 100% 129 100% 192 100%
Age up to 25 years old 2 1% 6 5% 1 1%
26‐35 years old 18 10% 32 25% 22 12% 36‐45 years old 52 28% 51 40% 66 35% 46‐55 years old 53 29% 38 29% 68 36% 56‐65 years old 37 20% 2 2% 22 12%
66 years and older 23 12% 0 0% 11 6% Total 185 100% 129 100% 190 100%

137
Table 6.20. (continues)
Item Hiking tourists
(n=194) Mountain biking tourists (n=132)
Village tourists (n=196)
FrequencyValid Percent Frequency
Valid Percent Frequency
Valid Percent
Country of residence Sweden, including 170 89% 102 77% 134 69% Stockholmsregionen 64 38% 30 29% 29 22%
Västernorrland 23 14% 4 4% 25 19%Jämtland 15 9% 6 6% 30 22%
Västra Götaland 11 6% 21 21% 7 5%Gävleborg 12 7% 7 7% 11 8%Uppsala 11 6% 4 4% 6 4%
Other Swedish regions 34 20% 30 29% 26 19%Norway 18 9% 16 12% 58 30% Finland 0 0% 11 8% 1 1% Other 4 2% 3 2% 1 1% Total 192 100% 132 100% 194 100%

138
Table 6.20. (continues)
Item Hiking tourists
(n=194) Mountain biking tourists (n=132)
Village tourists (n=196)
FrequencyValid Percent Frequency
Valid Percent Frequency
Valid Percent
Number of previous visits to the destination in summerit was my first visit 46 24% 39 30% 39 20%
1 time 23 12% 14 11% 33 17% 2‐3 times 49 25% 19 15% 47 24% 4‐5 times 29 15% 21 16% 26 13%
6 times or more 47 24% 38 29% 50 26% Total 194 100% 131 100% 195 100%
Number of previous visits to the destination in winter Never 34 18% 20 15% 54 28% 1 time 19 10% 18 14% 27 14%
2‐3 times 32 17% 13 10% 29 15% 4‐5 times 15 8% 12 9% 18 9%
6 times or more 91 48% 68 52% 65 34% Total 191 100% 131 100% 193 100%

139
Table 6.20. (continues)
Item Hiking tourists
(n=194) Mountain biking tourists (n=132)
Village tourists (n=196)
FrequencyValid Percent Frequency
Valid Percent Frequency
Valid Percent
Type of accommodation Hotel 107 57% 31 24% 136 70%
Rented apartment 43 23% 77 60% 34 18% Rented cabin 14 7% 10 8% 14 7%
Own apartment 14 7% 4 3% 3 2% Ownership 5 3% 5 4% 4 2% Own cabin 6 3% 1 1% 2 1% Camping 0 0% 1 1% 0 0%
Total 189 100% 129 100% 193 100%
Children in the travel group Yes 80 41% 59 45% 123 63% No 114 59% 73 55% 73 37%
Total 194 100% 132 100% 196 100%

Similarly, mountain biking emerges as a separate sub‐dimension for the mountain biking segment. Finally, no activity‐specific sub‐dimension emerged for the village segment, considering that for most functional attributes the share of missing values was too high; thus, potentially relevant items could not be included in the analysis.
Furthermore, Table 6.21, 6.22 and 6.23 show the results of EFA for the value‐in‐use dimensions for the three a‐priory customer segments. KMO statistics are satisfactory for all three samples (i.e. 0.898 for the hiking segment, 0.888 for the mountain biking segment, and 0.884 for the village segment). In particular EFA revealed four sub‐dimensions of visitation outcomes, including “escape, relaxation and well‐being”, “fun and thrill”, “exercise” and “epistemic value”.
The empirical results are slightly different for the mountain biking segment. “Escape” and “relaxation” are specified as separate dimensions, while “relaxation” integrates the epistemic value measure of discovering new places and things. The “exercise” dimension additionally integrates the value of demanding physical activities in nature, while the dimension of “fun” also includes the experience of speed and action. Finally, for the village segment the value‐in‐use has two sub‐dimensions, including a combination of escape and fun, as well as aesthetical value of experiencing the beauty of nature and spectacular views, respectively.
Overall, the segment‐specific exploratory analysis results provide a more detailed and meaningful picture of the heterogeneous outcomes of the destination visitation compared to the total sample findings. Moreover, the results align the findings of the qualitative summer study.
Considering the small sample sizes for each model segment and the high complexity of the proposed measurement model, the second‐order constructs (i.e., destination resources and value‐in‐use) were transformed into first‐order constructs by computing summated scales for each construct’s sub‐dimension (Spector, 1992), thus, maximizing the number of responses per variable in the model as recommended by Hair et al. (2010). Finally, the examination of z‐scores revealed outliers (i.e., z‐scores above 3.29), which have been replaced with “the next highest score plus one” (ibid., 2005). This type of score substitution affected 22 out of 34 items. The number of adjusted scores varied from 1 to 7 per item and, therefore, did not exceed 1.5% per item.
140

141
Table 6.21. Underlying dimensions of destination value-in-use for the hiking tourism segment
Factors/Items Factor loadings Communalities Eigenvalue
Variance explained (%)
Conbachʹs alpha
Escape, relaxation and well‐being
In Åre I was able to experience a feeling of freedom 0.844 0.783 7.673
47.956
0.935
In Åre I was able to relax from my daily routines 0.824 0.710 In Åre I was able to avoid the hustle and bustle of daily life 0.804 0.713 In Åre I was able to encounter something different from everyday life
0.799 0.714
I was able to relax mentally during my stay in Åre 0.784 0.704 I found peace and quiet 0.772 0.715 My stay in Åre produced feelings of wellbeing for me 0.767 0.760 My stay in Åre made me feel happy 0.735 0.690 I was able to relax physically during my stay in Åre 0.693 0.519 Excercise In Åre I got exercise and training 0.908 0.887 2.064
12.898
0.937
In Åre I could perform demanding physical activities in nature
0.898 0.889
In Åre I used my body in a comprehensive way 0.896 0.868

142
Table 6.21. (continues)
Factors/Items Factor loadings Communalities Eigenvalue
Variance explained (%)
Conbachʹs alpha
Epistemic value I can learn about nature during my stay in Åre 0.861 0.836 1.364
8.523
0.789 In Åre I can discover new places and things 0.844 0.820
Fun and thrill Åre offers fun and excitement 0.840 0.784 1.032
6.452
0.708 Åre is a thrilling summer destination 0.780 0.740

143
Table 6.22. Underlying dimensions of destination value-in-use for the mountain biking tourism segment
Factors/Items Factor loadings Communalities Eigenvalue
Variance explained (%)
Conbachʹs alpha
Joyful escape
In Åre I was able to encounter something different from everyday life
0.798 0.821 7.569
47.305
0.915
My stay in Åre made me feel happy 0.782 0.722 In Åre I was able to experience a feeling of freedom 0.767 0.788 My stay in Åre made me joyful 0.739 0.733 My stay in Åre produced feelings of wellbeing for me 0.717 0.754 In Åre I saw spectacular views 0.704 0.576 Fun and action I experienced speed and action during my stay in Åre 0.838 0.825 1.876
11.724
0.896
Åre offers fun and excitement 0.837 0.850 Åre is a thrilling summer destination 0.812 0.799

144
Table 6.22. (continues)
Factors/Items Factor loadings Communalities Eigenvalue
Variance explained (%)
Conbachʹs alpha
Relax and discover I was able to relax physically during my stay in Åre 0.848 0.734 1.464
9.147
0.790
I found peace and quiet 0.826 0.740 In Åre I was able to avoid the hustle and bustle of daily life 0.689 0.591 In Åre I can discover new places and things 0.606 0.500 Excercise In Åre I could perform demanding physical activities in nature
0.912 0.881 1.107
6.920
0.910 In Åre I got exercise and training 0.901 0.898
In Åre I used my body in a comprehensive way 0.790 0.804

145
Table 6.23. Underlying dimensions of destination value-in-use for the village tourism segment
Factors/Items Factor loadings Communalities Eigenvalue
Variance explained (%)
Conbachʹs alpha
Escape and fun In Åre I was able to relax from my daily routines 0.806 0.772 5.351
59.451
0.908
I found new strength and energy during my stay in Åre 0.800 0.688 In Åre I was able to avoid the hustle and bustle of daily life 0.799 0.716 My stay in Åre made me feel happy 0.792 0.731 In Åre I was able to experience a feeling of freedom 0.783 0.765 My stay in Åre made me joyful 0.680 0.534 Åre offers fun and excitement 0.650 0.423 Aesthetical value In Åre I saw spectacular views 0.925 0.888 1.025
11.390
0.857
In Åre I experienced the beauty of nature 0.860 0.858

Table 6.24 displays the measurement model fit statistics, which are all satisfactory for each a‐priory customer segment.
Table 6.24. Model fit statistics
Indicator Statistic value Hiking tourists
Mountain biking tourists
Village tourists
Absolute Fit Measures Goodness‐of‐fit Index (GFI) 0.89 0.88 0.91 Root Mean Square Error of Approximation (RMSEA)
0.075 0.061 0.083
90 percent confidence interval for RMSEA
(0.060; 0.090)
(0.038; 0.081)
(0.065; 0.102)
Standardized root mean residual (SRMR)
0.068 0.065 0.059
Normed chi‐square (χ2/df) 195.685 / 94 = 2.082
139.323 / 94 = 1.482
129.043 / 55 = 2.346
Incremental Fit Indices Tucker‐Lewis Index (TLI) 0.89 0.94 0.91 Comparative Fit Index (CFI) 0.91 0.95 0.94 Parsimony Fit Indices Adjusted Goodness‐of‐fit Index (AGFI)
0.84 0.82 0.86
Table 6.25 shows the measurement model results for the hiking tourism
segment. Overall, the measurement results are satisfactory, all unstandardized loadings (i.e., regression weights) were statistically different from zero; all t‐values were higher than 1.96 and varied from 5.771 to 9.600. However, the standardized loadings value is slightly below the required minimum of 0.50 for one of the destination awareness items. Furthermore, the average variance explained values are below the recommended threshold of 0.50 for destination resources (0.48), value‐in‐use (0.40) and destination loyalty (0.42), although the composite reliability value is satisfactory for all constructs, i.e. above 0.7 for most constructs and close to the recommended threshold for destination loyalty (0.68).
146

Table 6.25. Testing of the CBDBE measurement model for the hiking tourism segment
Constructs Scale items
Composite Reliability
Standardized Loadings
t Value SMC AVE
Destination awareness
AW1 0.76 0.486 0.236 0.53 AW2 0.851 5.771 0.724 AW3 0.788 6.351 0.621
Destination resources
NAT 0.78 0.554 0.307 0.48
VIL 0.700 6.94 0.489 ATM 0.858 7.426 0.736 SOC 0.623 6.251 0.388
Value‐in‐use FUN 0.73 0.649 0.421 0.40 EPI 0.575 6.754 0.331 TRA 0.544 6.416 0.296
ESCREL 0.750 7.996 0.562 Value‐for‐money
VFM1 0.88 0.920 0.846 0.79 VFM2 0.860 9.6 0.74
Destintination loyalty
LOY1 0.68 0.625 0.391 0.42 LOY2 0.574 6.678 0.33 LOY3 0.732 6.899 0.536
Compared to the hiking segment, the measurement model for the mountain
biking segment displays better results (Table 6.26). The values for Composite Reliabilities (CR) fully approve the model and all CR values rank well above the recommended threshold amounting to 0.7 (Hair et al., 2010). All unstandardized loadings (i.e., regression weights) were statistically different from zero; all t‐values were higher than 1.96 and varied from 3.842 to 9.832. However, the standardized loadings value for the mountain biking item is slightly below the required minimum of 0.50. Furthermore, the AVE value for the destination resources construct is 0.48, which is slightly below the 0.50 threshold.
147

Table 6.26. Testing of the CBDBE measurement model for the mountain biking tourism segment
Constructs Scale items
Composite Reliability
Standardized Loadings
t Value SMC AVE
Destination awareness
AW1 0.81 0.542 0.294 0.59 AW2 0.789 6.106 0.622 AW3 0.928 5.843 0.861
Destination resources
MB 0.77 0.375 0.141 0.48 NATVIL 0.846 4.135 0.716 ATM 0.774 3.993 0.599 SOC 0.681 3.842 0.464
Value‐in‐use TRA 0.8 0.594 0.353 0.50 RELEPI 0.589 5.440 0.347 FUN 0.774 6.708 0.600
JOYESC 0.843 7.037 0.711 Value‐for‐money
VFM1 0.92 0.975 0.951 0.85 VFM2 0.869 9.832 0.754
Destintination loyalty
LOY1 0.78 0.698 0.488 0.55 LOY2 0.700 7.087 0.490 LOY3 0.819 7.539 0.671
Finally, Table 6.27 shows the measurement model results for the village tourism
segment.
Table 6.27. Testing of the CBDBE measurement model for the village tourism segment
Constructs Scale items
Composite Reliability
Standardized Loadings
t Value SMC AVE
Destination awareness
AW1 0.79 0.542 0.294 0.56 AW2 0.786 7.126 0.617 AW3 0.881 7.024 0.777
Destination resources
NATVIL 0.82 0.761 0.579 0.61 ATM 0.812 10.608 0.660 SOC 0.769 9.835 0.591
Value‐in‐use AES 0.75 0.593 0.351 0.62 ESCFUN 0.938 7.349 0.880
148

Table 6.27. (continues)
Constructs Scale items
Composite Reliability
Standardized Loadings
t Value SMC AVE
Value‐for‐money
VFM1 0.90 0.959 0.920 0.82 VFM2 0.848 11.796 0.718
Destintination loyalty
LOY1 0.76 0.637 0.406 0.52 LOY2 0.686 7.640 0.470 LOY3 0.827 8.189 0.685
The values for Composite Reliabilities (CR), again, approve the model and all
CR values rank well above the recommended threshold amounting to 0.7 (Hair et al., 2010). All unstandardized loadings (i.e., regression weights) were statistically different from zero; all t‐values were higher than 1.96 and varied from 7.024 to 11.796. All standardized loadings values for measurement items and AVE values for model dimensions exceed the 0.50 threshold.
Table 6.28, 6.29 and 6.30 display discriminant validity results for three a‐priory segments. Test results demonstrate that insufficiently high AVE values do not allow the approval of discriminant validity between destination resources, value‐in‐use and destination loyalty. Table 6.28. Discriminant validity of the CBDBE model measurement scale for the hiking
tourism segment
Loyalty
Value‐for‐money
Value‐in‐use
Destination resources Awareness
Loyalty 0.42 Value‐for‐money 0.181 0.79 Value‐in‐use 0.736 0.202 0.40 Destination resources 0.442 0.293 0.645 0.48 Awareness 0.362 0.040 0.199 0.104 0.53
149

Table 6.29. Discriminant validity of the CBDBE model measurement scale for the mountain biking tourism segment
Loyalty
Value‐for‐money
Value‐in‐use
Destination resources Awareness
Loyalty 0.55 Value‐for‐money 0.219 0.85 Value‐in‐use 0.672 0.270 0.50 Destination resources 0.415 0.298 0.661 0.48 Awareness 0.070 0.029 0.113 0.073 0.59
Table 6.30. Discriminant validity of the CBDBE model measurement scale for the village tourism segment
Loyalty
Value‐for‐money
Value‐in‐use
Destination resources Awareness
Loyalty 0.52 Value‐for‐money 0.236 0.83 Value‐in‐use 0.520 0.142 0.62 Destination resources 0.298 0.359 0.494 0.61 Awareness 0.114 0.072 0.194 0.121 0.56 To sum up, the discriminant validity test results demonstrate the need for a
more thorough examination of the measurement model, particularly on the level of individual items, which is, thus, identified as a need for future research in the outlook section. Furthermore, development and validation of the CBDBE models for the sub‐samples might increase the precision of the proposed measurement model results, particularly by including more relevant items omitted due to the relatively high share of missing values. In particular, further sub‐samples could have been identified based on the sending country, as well as the travel group composition (e.g., tourists travelling with or without children). However, such in‐depth analyses would require greater sample sizes. Therefore, for the purposes of structural model testing, the existing measurement models are utilised directly without modifications considering that except for discriminant validity, the model demonstrates good model‐of‐fit results and overall satisfactory measurement model testing results.
150

Table 6.31 and 6.32 show the results of the structural model testing for the three a‐priori tourism segments, including the structural parameter estimates and the squared multiple correlation values for the endogenous model constructs.
Four out of the five previously formulated hypotheses have been confirmed for all three samples, thus, empirically validating the cause‐effect sequence of destination awareness, destination resources, value‐in‐use and destination loyalty stipulated by the customer‐based brand equity pyramid (Keller, 2008, 2009). However, the relationship between value‐for‐money and destination loyalty has only been empirically confirmed for the village tourism segment, while the corresponding relationship was not significant for the hiking or the mountain biking tourism segment, respectively. Interestingly, this relationship, which was significant, although relatively weak for the model developed and tested for the total sample (N=522), is more than twice stronger for the village tourism sample (i.e., 0.10 for the total sample and 0.25 village tourism sample). Furthermore, the relationship between value‐in‐use and destination loyalty is weaker for the village tourism sample compared to the total sample as well as compared to the hiking and mountain biking samples. Furthermore, the R2 values for value‐in‐use and destination loyalty are lower for the village tourism sample compared to the other samples, which might indicate the need to isolate the activity‐based sub‐samples among village tourists, thus, to include more destination resources into the brand model.
6.2.6. Post-hoc examination of the mediating role of destination satisfaction
in the CBDBE model The qualitative study results revealed that satisfaction is an important outcome
of destination visitation, which, according to Cracolici and Nijkamp (2009), is linked to the tourist’s feeling of well‐being in relation to the holiday destination and is, thus, an important measure of destination attractiveness. A number of previous tourism studies confirmed that customers’ evaluation of destination attributes positively influences customer satisfaction, which Oliver (1999) defines as pleasurable fulfilment of needs, desires, goals, etc. (Chi & Qu, 2008; Chen & Tsai, 2007, Zabkar et al., 2010). Moreover, a vast body of tourism research (e.g., Yoon & Uysal, 2005; Chen & Tsai, 2007; Chi & Qu, 2008; del Bosque & Martin, 2008; Faullant et al., 2008; Zabkar et al., 2010) empirically confirm that overall customer (i.e. tourist) satisfaction directly influences tourists’ loyalty behaviour.
151

152
Table 6.31. Structural parameter estimates for segment-specific CBDBE models
Structural Relationships
Unstandardized Parameter Estimate Standard Error t‐Value
Standardized Parameter Estimate
HK MB VT HK MB VT HK MB VT HK MB VT H1: AW DRES 0.448 0.266 0.978 0.127 0.111 0.234 3.534 2.402 4.182 0.391 0.300 0.392 H2: DRES VIU 1.233 1.338 0.496 0.198 0.360 0.085 6.225 3.718 5.827 0.830 0.825 0.693 H3: DRES VFM 0.773 1.096 0.419 0.142 0.292 0.057 5.458 3.755 7.335 0.540 0.569 0.590 H4: VIU LOY 0.607 0.609 0.447 0.103 0.120 0.082 5.911 5.068 5.471 0.840 0.764 0.614 H5: VFM LOY n.s. n.s. 0.183 0.063 0.062 0.057 0.601 0.960 3.227 n.s. n.s. 0.249
Table 6.32. Squared multiple correlations (SMC)
HK MB VT DRES 0.153 0.090 0.153 VIU 0.688 0.681 0.480 VFM 0.291 0.323 0.349 LOY 0.746 0.655 0.564

As previously discussed in the literature review section, Kim et al. (2009) and Chen and Myagmarsuren (2010) examine the relationships between brand equity and tourist satisfaction, however, without specifying the construct as part of the brand equity model. Finally, de Chernatony et al. (2004) proposed that in a service context, satisfaction could be considered as a relevant additional CBBE model dimension.
Therefore, in addition to the five initially defined hypotheses, four additional post‐hoc hypotheses have been formulated: H6. The more positive the customers’ perception of a) functional, b) intangible, and c)
social destination resources, the greater the customer satisfaction. H7. The more positive customers’ perception of value‐in‐use, the greater the customer
satisfaction. H8. The more positive customers’ perception of value‐for‐money, the greater the
customer satisfaction. H9. The greater the customers’ satisfaction, the stronger the customers’ loyalty to a
destination. Table 6.33 compares the structural model fit statistics result for the total sample
and the three a‐priory segments, which all demonstrate satisfactory results. More concretely, Table 6.34 and 6.35 show the structural model testing results, including the comparison of structural parameter estimates and squared multiple correlation values across the various sub‐samples. First, the hypothesis about the direct relationship between destination resources and tourist satisfaction has not been confirmed for all four samples. Furthermore, the hypothesis that satisfaction partly mediates the relationship between value‐for‐money and destination loyalty has only been confirmed for the total sample and for the village tourism sample.
Simultaneously, the strong positive effect of destination value‐in‐use on tourist satisfaction has been statistically confirmed for all four samples, although the relationship between satisfaction and loyalty was not significant for the hiking tourism sample.
The squared multiple correlation statistics (R2) for the loyalty construct increased for all four samples compared to the original model without satisfaction as a model construct. The increase of the R2 value was most substantial for the village tourism segment (i.e., from 0.56 to 0.65).
153

Table 6.33. Model fit statistics
Indicator Statistic value Total sample
Hiking tourists
Mountain biking tourists
Village tourists
Absolute Fit Measures
Goodness‐of‐fit Index (GFI)
0.89 0.87 0.87 0.90
Root Mean Square Error of Approximation (RMSEA)
0.055 0.079 0.057 0.083
90 percent confidence interval for RMSEA
(0.050; 0.059)
(0.066; 0.093)
(0.035; 0.076)
(0.067; 0.100)
Standardized root mean residual (SRMR)
0.055 0.079 0.065 0.068
Normed chi‐square (χ2/df)
861.908 / 336 = 2.565
245.316 / 11 = 2.210
157.902 / 111 = 1.423
162.663 / 69 = 2.357
Incremental Fit Indices Tucker‐Lewis Index (TLI) 0.93 0.87 0.95 0.91 Comparative Fit Index (CFI)
0.94 0.90 0.96 0.93
Parsimony Fit Indices Adjusted Goodness‐of‐fit Index (AGFI)
0.87 0.82 0.82 0.85
Table 6.34. Squared multiple correlations (SMC)
N=522 HK MB VT DRES 0.101 0.147 0.089 0.153VIU 0.579 0.693 0.680 0.529VFM 0.325 0.291 0.324 0.340SAT 0.583 0.545 0.675 0.542LOY 0.713 0.770 0.706 0.650
154

155
Table 6.35. Structural parameter estimates for the revised CBDBE model
Structural Relationships
Unstandardized Parameter Estimate Standard Error t‐Value
Standardized Parameter Estimate
N = 522 HK MB VT
N = 522 HK MB VT
N = 522 HK MB VT
N = 522 HK MB VT
H1: AW DRES 0.130 0.445 0.265 0.983 0.025 0.127 0.111 0.235 5.174 3.505 2.396 4.184 0.318 0.383 0.298 0.391H2: DRES VIU 1.593 1.163 1.317 0.542 0.180 0.189 0.355 0.085 8.866 6.162 3.714 6.373 0.761 0.832 0.824 0.727H3: DRES VFM 2.338 0.761 1.093 0.415 0.270 0.138 0.290 0.056 8.667 5.497 3.762 7.351 0.570 0.539 0.569 0.583
H4: VIU LOY 0.852 0.539 0.355 0.242 0.124 0.123 0.131 0.077 6.857 4.381 2.715 3.152 0.600 0.732 0.449 0.341H5: VFM LOY 0.058 n.s. n.s. 0.129 0.031 0.058 0.053 0.050 1.896 0.422 0.536 2.570 0.080 n.s. n.s. 0.174H6: DRES SAT n.s. n.s. n.s. n.s. 0.240 0.179 0.203 0.083 0.049
‐0.446
‐0.006
‐0.060 n.s. n.s. n.s. n.s.
H7: VIU SAT 1.023 0.556 0.618 0.527 0.115 0.140 0.147 0.104 8.861 3.968 4.190 5.063 0.726 0.781 0.774 0.672H8: VFM SAT 0.053 n.s. n.s. 0.117 0.031 0.051 0.050 0.058 1.708 0.686 1.255 2.022 0.073 n.s. n.s. 0.142H9: SAT LOY 0.251 n.s. 0.405 0.385 0.067 0.118 0.138 0.092 3.757 1.466 2.930 4.180 0.249 n.s. 0.410 0.425

Although the causal relationship between satisfaction and loyalty was not confirmed for the hiking tourism segment, the examination of the path estimates suggests the plausibility of integrating the satisfaction as part of the value‐in‐use measurement scale.
As a result of the performed model revision, the Goodness‐of‐fit statistics of the path model remain at the previous satisfactory level: GFI = 0.87; RMSEA = 0.078 (LL 0.065; UL 0.091); Normed‐Chi‐Square (χ2/df) = 2.178 (248.253/114); SRMR = 0.079; TLI = 0.88; CFI = 0.90; AGFI = 0.83. Similar to the original model (i.e., without satisfaction as an item or a construct), four out of five structural relationships are confirmed (PAW,DRES = 0.384 p=0.000; PDRES,VIU = 0.824 p=0.000; PDRES,VFM = 0.543 p=0.000; PVIU,LOY = 0.886 p=0.000) and the relationship between value‐for‐money and loyalty remains non‐significant.
Interestingly, the AVE value for the value‐in‐use construct increases compared to the initial model from 0.40 to 0.43. Moreover, the R2 value similarly increases for destination loyalty from 0.75 to 0.80.
Overall, the performed empirical analyses demonstrate that the segment‐specific measurement of the CBDBE model is plausible and produces meaningful and managerially relevant results. Most importantly, however, identifying the relevant composition of destination resources and, thus, better understanding the value‐in‐use of destination stay, remains the core issue of the proposed model operationalization.
156

7. CONCLUSIONS AND FUTURE RESEARCH
The final section of the thesis summarizes the findings of the study and discusses their theoretical implications. Similarly, the managerial relevance of the CBDBE model for destination marketing practice, as well as study limitations and suggestions for future research are addressed. 7.1. Summary of research findings
This thesis continues the recent theoretical discussion on transferring the concept of customer‐based brand equity to a tourism destination context (e.g., Konecnik & Gartner, 2007; Boo et al., 2009; Pike et al., 2010) and therefore, it contributes to the existing body of knowledge on how tourists perceive tourism destinations as brands and how their evaluation of destination brands affects the loyalty towards destinations. However, by this thesis, the tourism destination branding literature, originally developed within a goods‐centric paradigm, has been revisited in the light of the new service logic, as particularly recommended by Li and Petrick (2008). More precisely, the theoretical conceptualization behind the CBBE model has been revised by taking into account the service marketing perspective, thereby focusing on the co‐created value‐in‐use of a tourism stay (Grönroos, 2000, 2006; Vargo & Lusch, 2004a, 2008a).
First, the study utilized Keller’s (2008, 2009) brand equity pyramid as the theoretical framework in order to integrate the empirical findings of previous tourism brand equity studies (i.e., Bianchi et al., 2014; Boo et al., 2009; Chen & Myagmarsuren, 2010; Ferns & Walls, 2012; Gartner & Konecnik Ruzzier, 2011; Horng et al., 2012; Im et al., 2012; Kim et al., 2009; Kladou & Kehagias, 2014; Konecnik & Gartner, 2007; Pike et al., 2010). A comparison of prior studies revealed similarities and overlaps, but also differences and gaps on both the conceptual and the measurement level of the CBBE model for tourism destinations.
More specifically, the study revealed that tourism destination brand equity research primarily follows the multidimensional conceptualization of the CBBE model proposed by Aaker (1991, 1996) and Keller (1993). Furthermore, most studies integrate destination awareness and destination loyalty as CBBE model dimensions, which, according to Keller’s (2009) framework represent the bottom (i.e., brand salience) and top (i.e., brand resonance) levels of the destination brand equity hierarchy. Additionally, previous tourism studies adjust the CBBE model to the tourism destination context by integrating attribute‐based image and quality as representations of destination performance and imagery dimensions of the model. However, on the measurement level, attribute‐based destination image and quality highly overlap. Thus, as proposed by Konecnik and Gartner (2007) and empirically
157
demonstrated by Ferns and Walls (2012), functional, intangible and social destination attributes can well constitute an isolated CBBE model dimension.
Furthermore, the review of prior research findings revealed that the operationalization of destination brand judgements and feelings remains the most disputable, highly fragmented and mutually inclusive part of the destination brand equity model. Particularly, eight isolated constructs identified across previous destination brand equity studies represent the judgements and feelings building block of the destination brand equity pyramid.
First, overall destination brand quality (Boo et al., 2009), destination brand performance and trust (Evangelista & Dioko, 2011), brand meaning (Garcia et al., 2012), and brand associations (Bianchi et al., 2014; Im et al., 2012; Kladou & Kehagias, 2014) mutually overlap on the measurement level. Moreover, the respective constructs overlap with the destination loyalty construct.
Second, benefits associated with the destination brand are only partly represented by the destination brand image, which integrates categories of self‐esteem, social recognition and consistency of a destination brand image with a person’s self‐image and personality (Bianchi et al., 2014; Boo et al., 2009; Evangelista & Dioko, 2011; Pike et al., 2010). Similarly, tourist satisfaction (Chen & Myagmarsuren, 2010; Kim et al., 2009), as the overall measure of tourists’ well‐being in the result of a destination stay (Cracolici & Nijkamp, 2009), represents the benefits of a tourism stay. Simultaneously, the review of prior research findings demonstrated that the emotional value of a destination stay has received only little attention in previous destination brand equity research so far (Garcia et al., 2012).
Finally, only three prior studies consider destination brand value specified as the value‐for‐money dimension of the CBBE model (Bianchi et al., 2014; Boo et al., 2009; Evangelista & Dioko, 2011).
Moreover, thorough examination of previously tested and empirically confirmed causal relationships between CBBE constructs demonstrates that most tourism destination brand equity studies aim at explaining tourism destination brand loyalty as the final endogenous construct. Simultaneously, the inner core of the destination brand equity model remains the “black box”. Particularly, the complex mechanisms of how destination performance and imagery that represent functional, intangible and social destination resources transform into customers’ destination judgements and feelings, have been overlooked.
Thus, the thesis at hand theoretically proposed and empirically tested an enhanced customer‐based brand equity model for tourism destinations (CBDBE) by following Keller’s (2008, 2009) brand equity hierarchy and by considering the concept of destination value‐in‐use (Grönroos, 2000, 2009; Vargo & Lusch, 2004a, 2008a) as a newly added destination‐specific model dimension. The proposed model consists of five isolated causally dependent constructs. First, destination
158

awareness represents the brand salience block at the bottom of the brand equity pyramid and is positively related to visitors’ perception of destination‐specific functional, intangible and social resources. Consequently, the positive relationship between the perception of destination resources and value‐in‐use of a destination stay discloses the destination brand promise to combine both destination’s and tourists’ resources and to transform them into valued benefits (Moeller, 2010). Furthermore, customer’s perception of destination resources is positively related to value‐for‐money, which constitutes the value‐in‐exchange of a destination stay, thus considering the input of tourists’ own resources into the process of value co‐creation as part of the CBDBE model (Vargo & Lusch, 2004a; Grönroos, 2006, 2008). Finally, by positively relating value‐in‐use and value‐for‐money to destination brand loyalty, placed at the top of the destination brand equity pyramid, the proposed CBDBE model seeks to explain and better understand the nature and depth of tourists’ relationships with the brand as a whole (Keller, 2008, 2009). The proposed CBDBE model was repeatedly empirically tested for the leading
Swedish mountain destination of Åre (see Figure 1.1 in the introduction chapter). More precisely, the measurement model has been validated by considering construct reliability, indicator reliability, and discriminant validity (Brown, 2006). The hypothesized causal relationships between the constructs of the CBDBE model have been tested using a linear structural equation modelling (SEM) approach (Byrne, 2001).
First, the model has been operationalized for the winter ski season in Åre. The value‐in‐use dimension was specified as the emotional value based on the previous qualitative study by Klenoski et al. (1993), who empirically identified the dimensionality of the emotional outcome of a ski winter holiday. At the pilot study stage, the model was tested with data collected from international tourists in Åre (winter season 2009/2010). After a series of theory‐based revisions in the course of the measurement model specification, the CBDBE model structure has been empirically confirmed. Furthermore, the model has been repeatedly tested with a sample consisting of both domestic and international tourists (winter season 2012/2013). The repeated test results again confirmed the hierarchical structure of the CBDBE model and, thus, demonstrated reliability and empirical robustness of the proposed model.
Second, the proposed CBDBE model has been operationalized and tested also for the summer season. As a preparatory step, the examination of results from face‐to‐face interviews conducted in summer 2012 in Åre uncovered the major relationships between destination resources offered by Åre in the summer season, tourists’ own resources and the various sub‐dimensions of value‐in‐use, including emotional, epistemic and social value (Sheth et al., 1991; Holbrook, 1999, 2006). Additionally, functional value and overall satisfaction similarly emerged as the
159

valued outcomes of a destination stay (Sheth et al., 1991; Holbrook, 1999, 2006). Moreover, the qualitative empirical study revealed differences in both the configuration of utilized resources and the outcomes of a destination visitation among the main tourism segments during the summer season, including hiking tourism, mountain biking tourism, and village tourists. Finally, the findings of the qualitative study served as input for the development of a destination‐specific value‐in‐use measurement scale, which is integrated into the CBDBE measurement instrument for mountain destinations in the summer season.
Third, the CBDBE model has been empirically tested with data collected in Åre after the summer season of 2012. As a result, the hierarchical structure of the CBDBE model adapted for the summer season has been repeatedly confirmed for the total sample. However, as an additional step, this thesis examined the composition of destination resources and the value‐in‐use dimensions considered to be the most relevant ones by the main summer tourism segments in Åre (i.e., hiking, mountain biking and village tourism). The findings again confirmed Moeller’s (2010) proposition on the heterogeneity of (i.e. tourism) service consumption outcomes. Thus, the measurement scales for customers’ perception of destination resources and destination value‐in‐use have been adjusted for each tourist segment, respectively. The model structure was again fully confirmed for the village tourism segment, while the relationship between value‐for‐money and destination loyalty was not significant for the hiking and the mountain biking segments, respectively.
Finally, as proposed by de Chernatony et al. (2004), the role of tourism satisfaction as part of the CBDBE model has been additionally tested with data collected from tourists in Åre after the summer season of 2012. The results were, again, in most parts, reconfirmed. First, for the total sample, as well as for the mountain biking and village tourism segment, tourist satisfaction demonstrated direct positive effects on destination loyalty and mediated the relationship between value‐in‐use and destination loyalty. Additionally, tourist satisfaction mediated the relationship between value‐for‐money and destination loyalty for the total sample and the village tourism segment. However, the proposed relationships could not be confirmed for the hiking tourism segment. Nevertheless, tourist satisfaction was successfully integrated as the value‐in‐use sub‐dimension reflecting the (i.e. overall positive) evaluation of tourists’ well‐being (e.g., Cracolici and Nijkamp, 2009). As a result of integrating tourist satisfaction into the CBDBE model, the square multiple correlation values for the destination loyalty construct for all samples and, consequently, the model’s explanation power, have increased.
Overall, the explanation power of the proposed CBDBE model has been relatively high both for the winter and summer case studies. Moreover, the squared multiple correlations for both the destination value‐in‐use and destination
160

loyalty (R2) exceeded the 0.50 value for all tourist samples employed for model testing. Furthermore, the chain of causal relationships between customers’ perception of destination resources, value‐in‐use and destination loyalty is similarly strong and significant across all samples.
7.2. Theoretical implications This thesis empirically confirms that the value‐co‐creation perspective provides
an adequate extension of the framework for better understanding the relationship building process between tourists and destination brands. More specifically, the value‐co‐creation framework enables the development of a CBDBE model, which takes into consideration both the complex and multidimensional nature of tourism destinations and heterogeneous consumption patterns between various tourist segments. Particularly, the proposed hierarchical model well explains the complex mechanisms of interaction between tourists and the destination brand and, therefore, enables destinations to gain relevant managerial knowledge of destination value‐in‐use and destination loyalty.
As the main theoretical contribution, this thesis addressed the gap in the brand equity literature for tourism destinations by conceptualizing the inner core of the model as the “perceived destination promise”, which depicts the customers’ evaluation of the service process comprising the destination resources offered by the destination and the transformation of these resources into value‐in‐use for the customer.
Furthermore, by considering the unique, experiential and contextually dependent nature of value‐in‐use (Vargo & Lusch, 2008a), this thesis emphasizes the need to understand the benefits of destination visitation, which are both destination‐specific and customer (i.e. segment) specific. Particularly, destination‐specific value‐in‐use depends on the destination’s capacity to “be of value” for tourists. Moreover, heterogeneous tourist segments, which are typically simultaneously attracted by one destination and, thus, have access to a common pool of destination resources, may obtain different experienced benefits as the outcome of their destination stay (Moeller, 2010).
Hence, this thesis introduced value‐in‐use as a new isolated CBDBE dimension. However, the strong and significant relationships between the perception of destination resources and destination value‐in‐use, as well as between value‐in‐use and destination loyalty as found in this study have been only partly confirmed by previous studies considering the (i.e. positive) influence of attribute‐based destination quality on tourists’ self‐esteem and social recognition (Pike et al., 2009), the relationship between attribute‐based quality and satisfaction (Chi & Qu, 2008; Chen & Tsai, 2007; Yoon and Uysal, 2005; Zabkar et al., 2010), as well as the
161

relationships between various dimensions of destination brand judgments and feelings and destination loyalty (Boo et al., 2009; Bianchi et al., 2014; Chen & Myagmarsuren, 2010; Im et al., 2012; Kim et al., 2009; Kladou & Kehagias, 2014; Pike et al., 2010).
Thus, although the thesis study empirically confirms the overall hierarchical structure of the proposed CBDBE model, the inner composition of the core model dimension “perceived destination promise” and its measurement remains a challenging research task, as it requires additional understanding of destination‐specific consumption patterns across various tourism segments. Therefore, further empirical examination is required to validate the relatively complex CBDBE constructs (measurement model validation) as well as the theoretically most plausible causal structures (structural model validation).
Particularly, the post‐hoc examination of the role of destination satisfaction in the CBDBE model has a number of theoretical implications. First, in line with de Chernatony et al. (2004), the multi‐dimensional structure of the CBDBE model can be revised depending on the service context, and other constructs can be added, such as satisfaction. Second, the model’s explanation power increases after the integration of the satisfaction variable into the CBDBE model.
However, the question remains on how to conceptually clarify the role of the satisfaction construct within the CBDBE model framework. Particularly, tourism research widely addresses the issue of tourist satisfaction as the overall judgment about whether or not the destination succeeded in meeting tourists’ needs and desires, which, in turn, is most heavily determined by the quality of various destination attributes (e.g., Back and Parks, 2003; Chi and Qu, 2008). Furthermore, prior tourism research has agreed that overall tourism satisfaction is the direct antecedent of destination loyalty (e.g., Bigne et al., 2001; Back and Parks, 2003; Yoon and Uysal, 2005; Chi and Qu, 2008; del Bosque and Martin, 2008; Faullant et al., 2008). Interestingly, the results obtained in the course of this thesis research partly disconfirm this relationship for one of the summer tourism segments, namely “hiking tourists”. At the same time, however, the model structure is empirically confirmed when satisfaction is integrated as a sub‐dimension of value‐in‐use for the hiking tourism segment, and the model explanation power simultaneously further increases. Therefore, in the context of a CBDBE model measurement, customer satisfaction not only represents the overall judgment about the destination visitation, but also depicts a state‐of‐being (Cracolici and Nijkamp, 2009), which tourists explicitly identify as their desired vacation benefit, as illustrated by the qualitative study results presented in this thesis. Hence, the issue of whether destination satisfaction is an isolated CBDBE model construct or a sub‐dimension of value‐in‐use remains open and, thus, deserves further examination.
162

Overall, the results of this thesis are in line with findings of previous tourism research (e.g., Konecnik & Gartner, 2007; Boo et al., 2009; Pike et al. 2010). First of all and most importantly, this thesis confirms the multidimensional nature of the tourism destination brand equity model, which integrates the concepts of destination brand awareness, attribute‐based image perception and quality of tourism destinations, value‐for‐money and destination loyalty as isolated CBDBE model constructs.
Furthermore, examination of the causal structure within the CBDBE model confirmed previous findings regarding positive relationships between destination awareness and tourists’ perception of functional, intangible and social destination resources (i.e., Pike et al., 2010; Chen & Myagmarsuren, 2010; Kladou & Kehagias, 2014). At the same time, however, this relationship, which has been confirmed for both the winter and summer season, and for all major summer tourism segments, is consistently weak and thus, its contribution towards explaining tourists’ perception of destination resources is only minor. This issue brings up the discussion about the role destination awareness plays in the brand equity formation process, particularly in such situations where tourists have already personally visited and experienced the destination, as addressed by Milman and Pizam (1995). Similarly, as Gartner and Konecnik (2011) reveal, the awareness dimension is more important for the renewal market compared to the repeat market.
Moreover, this study repeatedly confirms the strong positive relationship between tourists’ perception of destination resources and destination value‐in‐use. First, this finding confirms prior tourism studies, which demonstrated the positive influence of attribute‐based destination image and quality on tourists’ perception of desired destination benefits (Chi & Qu, 2008; Chen & Tsai, 2007; Klenosky, 2002; Pike et al., 2010; Yoon & Uysal, 2005; Zabkar et al., 2010). Second, the result supports the co‐creation logic behind the destination value promise to provide destination resources and to transform them into emotional, social and novelty values for the tourist (Moeller, 2010; Palmer, 2010; Sheth et al., 1991). Similarly, the positive relationship between the perception of destination resources and value‐for‐money is fully in line with the traditional conceptualization of consumer value as the interplay between consumers’ benefits and sacrifices (Zeithaml, 1988), and, thus demonstrates the distinction between the theoretical concepts value‐in‐use and value‐in‐exchange (Vargo & Lusch, 2004a, 2008a).
The confirmation of the hypothesis that destination value‐in‐use is a direct antecedent of destination loyalty is an important finding, which has not been previously discussed in the tourism literature. Nevertheless, the result is in line with prior tourism brand equity studies which demonstrate that overall judgements of destination performance and the consistency of destination image
163

with the tourist’s own image positively influence loyalty towards the destination (e.g., Boo et al., 2009; Im et al., 2012; Kladou & Kehagias, 2014; Pike et al., 2010). At the same time, this thesis demonstrates that destination loyalty, to a great extent, is determined by tourists’ evaluation of the segment‐specific configuration of benefits, which tourists can obtain by visiting a destination.
Additionally, the study confirmed the relationship between value‐for‐money and destination loyalty, as previously found by Chen and Tsai (2007). However, the relationship was relatively weak and was not significant for all segments, thus, indicating that under certain circumstances, the evaluation of sacrifice does not contribute to the process of destination loyalty formation. Particularly, this relationship was significant but weak for the winter tourism study. Moreover, it was twice as weak for the repeat winter study comprising a high share of domestic tourists in the sample (on the contrary, only international tourists participated in the first winter survey). Additionally, the relationship between value‐for‐money and destination loyalty was weak but significant for the “village tourism” segment during summer season, but non‐significant for both hiking tourism and mountain biking tourists.
These findings bring up the concept of the zone‐of‐tolerance, defined as the area between the adequate and individually desired level of service, while the positive impact on behavioural intentions only occurs above the upper end of the zone‐of‐tolerance (Zeithaml et al., 1996). This implies the existence of critical levels of sacrifices which may influence tourists’ behaviour both in a case of negative or positive service perception. Furthermore, this thesis solely integrates monetary sacrifices (i.e., value‐for‐money). However, as particularly emphasized by Moeller (2010), the configuration of customers’ (i.e., tourists’) resources is highly heterogeneous and, therefore, segment‐specific. More precisely, as demonstrated by the qualitative study identifying benefits from a summer vacation in Åre, there are other types of tourists’ sacrifices in addition to monetary costs, such as mountain biking equipment or hiking gear, time required for travelling to the destination, need for training and exercise before the trip, etc. All these personal tourists’ resources contribute to the quality of the destination experience perceived by various tourists segments. Hence, the logic of the value‐co‐creation concept requires an understanding of tourists’ resource input and, consequently, its full integration into the CBDBE model measurement.
7.3. Managerial implications The proposed CBDBE model rests upon a resource‐based view of marketing
strategy (Palmer, 2010; Zabkar et al., 2010; Moeller, 2010), and, thus, assumes that destination management should better understand the co‐creative nature of a unique destination experience made by various customer (i.e. tourist) segments.
164

More precisely, by monitoring the brand equity dimensions proposed in this thesis, destination management can a) implement effective brand development strategies and, b) influence and manage customer loyalty through the provision of functional destination attributes. Moreover, destination management may c) better evaluate and constantly upgrade its marketing measures and, finally, d) discover promising innovation potentials to especially improve experience intensive destination offers showing the core destination resources being responsible for tourists’ emotional destination experiences (Mossberg, 2007).
Therefore, destination managers will have the opportunity to combine and interrelate knowledge bases about destination resources devoted to tourism consumption and value‐in‐use for tourists. Moreover, the link between resources and value‐in‐use can be clearly communicated through the destination brand (Gnoth, 2007; Vargo & Lusch, 2004a). For instance, based on the present thesis, the destination management of the Swedish mountain destination Åre can, for the first time, reliably identify the attributive dimensions behind value‐in‐use of a destination visitation and destination loyalty, both for different seasons and different customer (i.e. tourist) segments. More concretely, for winter tourists skiing, service quality, intangible destination resources, such as family‐friendliness, tidiness and safety, and interaction with other tourists serve as the main resource inputs to the generation of emotional value of the tourism destination stay. During the summer season, nature, mountain village setting, intangible attributes (e.g., peaceful and restful atmosphere, cleanliness and tidiness, family‐friendliness, and safety and security), and interaction with other tourists emerge as the most significant determinants of value for all tourism segments.
Moreover, the configuration of destination resources can be considered as highly segment‐specific. For instance, the hiking segment perceives nature and village as distinct sub‐dimensions, where the first one is related to the core segment activity (i.e. hiking), and the second sub‐dimension provides the setting for complementary activities in the village. On the contrary, mountain biking and village tourists view the nature and the village as one single factor for the setting of their main activity (e.g., mountain biking, which is identified as an activity factor on its own by the respective segment). Thus, for the main (i.e., winter) season at the mountain destination, skiing is clearly perceived as the main attractive resource, while other resources, such as spa and pool facilities, indoor activities, nightlife, sightseeing etc., are less important. For the non‐winter season, which is described by a relatively larger heterogeneity of both offered destination resources and visiting tourist segments, certain activities are only perceived as attractive in combination with other destination resources (i.e., natural landscape and the quality of natural environment in combination with Åre village infrastructure and diversity of offered activities). Hence, the study results provide the destination
165

management with new valuable knowledge about which specific (i.e. attribute‐based) experience aspects are responsible in the complex value co‐creation and destination loyalty formation process, respectively.
Finally, and probably most importantly, also the crucial dimensions for co‐creating destination value‐in‐use can now be reliably identified by destination managers. Particularly, the winter season study confirmed the importance of the key emotional value dimensions, such as fun, thrill and variety, as previously identified by Klenoski et al (1993). For the mountain summer destination product, this thesis extracted most relevant value‐in‐use dimensions separately for three a priori segments. For the hiking segment, the most relevant value‐in‐use sub‐dimensions include value areas, like escape, relaxation and well‐being, fun and thrill, exercise and novelty. For the mountain biking segment, escape and relaxation are specified as separate dimensions. Furthermore, relaxation integrates the epistemic value measure of discovering new places and things. The exercise dimension, additionally, integrates the value of demanding physical activities in the nature. Finally, for “mountain bikers”, the dimension of fun also includes the experience of speed and action. For the village segment, the sub‐dimensions of destination value‐in‐use include a combination of escape and fun, as well as the aesthetical value of nature. Therefore, the results demonstrate that destination management can identify both common and specific sub‐dimensions of destination value‐in‐use across existing customer segments, which enables the customization and communication process of the destination value proposition.
Particularly, from a destination perspective, the insights obtained by measuring the CBDBE translates into a valuable source of customer‐based knowledge and, thus, an important element of organizational learning and innovation at tourism destinations (Fuchs et al., 2014). Moreover, the framework of the Business Intelligence‐based “Knowledge Destination” (Höpken et al., 2011) sets up the Destination Management Information System (DMIS), prototypically implemented in the destination of Åre. Particularly, DMIS integrates the CBDBE model dimensions represented by a set of customer perception and experience indicators, together with indicators related to the customer behaviour and the destination’s economic performance, such as prices, bookings, occupancy rates, etc. (Fuchs et al., 2015). However, DMIS’ capacity for knowledge generation can be enhanced substantially if a direct link is established between perceptual CBDBE feedback data, data on tourist behaviour and destination‐based information (e.g., promotional campaigns, destination products inventory, occupancy etc.). Particularly, obtained knowledge in a real‐time Business Intelligence context can serve as a basis for a continuous real‐time dialogue with the customer, for instance, by offering customized recommendation services (Fuchs et al., 2014).
166

Thus, the proposed and empirically evaluated CBDBE model provides destination managers with a tool, which enables the measurement of customers’ brand perceptions on different stages of the brand value co‐creation process and, ultimately, the measurement of the brand’s value for the destination.
Particularly, the model integrates customers’ evaluation of various brand messages. These messages comprise both planned and unplanned marketing communication associated with the destination brand (Grönroos, 2009). First, these are communication messages (i.e. fully or partly) controlled by the destination management, such as destination promotion campaigns as well as online and offline destination information provided by the Destination Management Organisation (DMOs), tourism firms operating at the destination, as well as travel agencies. Second, these communication messages also comprise various unplanned and, therefore, uncontrolled destination brand messages, such as information in “official” media channels (i.e., TV programmes, magazines, newspapers etc.), and social media (e.g., online communities and customers’ review websites, such as TripAdvisor), as well as word‐of‐mouth from family members, friends and acquaintances. Finally, these brand‐related communication messages also comprise product and service messages received by the customers as a result of their destination visitation experience.
Furthermore, the proposed CBDBE model integrates the empirical estimation of customers’ perception of the promised, experienced and remembered destination performance (i.e. on the level of destination resources) and its contribution to customers’ value‐in‐use. Thus, the destination management and marketers can now evaluate the brand’s ability to promise value to the customers and to facilitate this value by guiding tourists on how to assemble (i.e. configure), use, and interpret destination resources in the course of their destination visitation experience. More specifically, the destination, defined as an amalgam of products and experience opportunities (Murphy et al., 2000) constitutes the actual (i.e. destination) value network (Lusch et al., 2010). Hence, the proposed CBDBE model provides the destination managers with a tool for the evaluation of the individual contribution of destination stakeholders (e.g., hotels, restaurants, activity providers etc.) in creating the total destination experience of tourists’ visitation.
Finally, the proposed CBDBE model enables the evaluation of the destination brand’s ability to encourage both existing and potential customers to continuously establish and maintain stable and mutually beneficial relationships with the destination brand and to identify the nature, the strength, and stability of these customer‐based brand relationships.
However, in order to employ the results of the brand evaluation as input for the decision‐making process of the destination management and marketing practice, a longitudinal measurement of destination brand performance should be considered.
167

Particularly, the monitoring of CBDBE dimensions before and after brand‐related events, including promotional campaigns, festivals and mega‐events (e.g. winter sport competitions, as in the case of alpine skiing destinations), as well as product modifications and the introduction of new destination products, allows an evaluation of the success of destination marketing efforts and a forecast of customers’ demand in terms of the destination brand.
Thus, as emphasized by Keller and Lehman (2009), the current brand equity evaluation reflects both the past and the future of the brand, and it is the first step in the long‐term process of (e.g. destination) brand value creation. 7.4. Limitations and future research
This thesis shows a number of limitations. First of all, the study limitations arise from the need to further improve the measurement of the CBDBE model constructs. Particularly, for the winter season case, the operationalization of the customers’ benefits component of the destination brand promise particularly emphasized the emotional value of the ski holiday (Sweeney & Soutar, 2001; Klenoski et al., 1993), while other aspects of the value‐in‐use concept, such as social value, remained outside the model. Thus, the next planned research step is to improve the comprehension of value‐in‐use of the Swedish ski destination Åre, particularly by conducting a qualitative study in order to develop a better measurement scale for this complex construct, as already performed in a similar way for the summer season case.
Another limitation applies to both winter and summer cases and arises from testing the model only for actual visitors, since it was relatively difficult to reach potential visitors for a small‐scale destination, like Åre. Furthermore, recent service marketing literature suggests that a brand, and what is branded, should be alienated and, therefore, a brand has a value‐in‐use of its own (Merz et al., 2009). This particularly implies that the value‐in‐use of tourism destination brands does not have to be directly related to a destination visitation. Thus, a future CBDBE model version should integrate other dimensions which do not only reflect value‐in‐use as communicated by the destination, but also value‐in‐use of the brand beyond destination visitation, such as, for instance, the symbolic value of the tourism destination brand for the customer.
Moreover, the operationalization of destination awareness factors should be further improved. Tourism literature particularly suggests that the depth of destination‐based brand knowledge builds on a variety of information sources, such as brochures, independent publications in mass‐media, travel agencies, relatives and friends, social media, as well as previous visits (Baloglu & McCleary, 1999; Baloglu, 2001; Beerli & Martin, 2004). However, at the same time, Gartner and Konecnik (2010) argue that in the case of repeated visitation, destination awareness
168
becomes less important compared to other CBDBE dimensions. Finally, Aaker (1996) points at various difficulties associated with the operationalization and measurement of the awareness construct for situations of repeated purchase (e.g., the irrelevance of top‐of‐mind awareness). Thus, as this issue is inadequately represented in the tourism literature so far, there is a need to properly conceptualize the construct of destination awareness relevant to both, repeat and new customers. Consequently, a CBDBE model that incorporates destination awareness needs to be similarly tested based on data comprising repeat and first‐time visitors, respectively. However, this raises the question about the specificity of branding and brand performance measurement for tourism destinations on differing geographical levels. Although not yet intensively discussed in the literature (e.g., Konecnik & Gartner, 2007), but basically supported by the results gathered in this thesis, the CBDBE dimension “awareness” is assumed to be relatively more important for a destination country. By contrast, for local or regional tourism destinations, functional destination characteristics become most critical.
Similarly, the analysis of discriminant validity in the pilot winter study and the summer study suggest the need to further strengthen the operationalization of the destination loyalty construct. Thus, for future research, it is proposed to further develop the theoretical conceptualization of destination loyalty as a core CBDBE model construct. Particularly, it is proposed to employ a combination of measurement items reflecting both the degree of cognitive and affective attachment to the brand, future purchase intentions, as well as brand activity measures reflecting the extent of using the brand in communication with other customers, information search and response to destination promotion activities (Back & Parks, 2003; Oliver, 1997, 1999; Keller, 2008).
The other group of limitations refer to the issues of study design and data collection. Thus, the empirical testing of the proposed CBDBE model also has its limitations. Particularly, all three datasets used for empirical analysis contained a relatively high number of missing values. The primary reason for missing values was the effort to address the large variety of destination resources used as possible input for value co‐creation during both the winter and summer season (Moeller, 2010). Furthermore, the summer case study additionally aimed at examining the underlying structure of the value‐in‐use model dimension. Thus, all potentially relevant value‐in‐use dimensions were included as part of the CBDBE measurement instrument (i.e. online questionnaire), including measures that are of relevance only for narrow niche segments.
As a result, for the winter pilot study (winter season 2009/2010), only one third of the items originally intended for measuring the destination’s tangible resources were actually used in the model validation process. However, the measurement
169
model developed with the remaining items has been repeatedly tested with new data collected after the winter season 2012/2013, thus demonstrating reliability and empirical robustness of the proposed CBDBE model. Therefore, since the share of missing values was similarly high in the summer season 2012 case study, the gained test results relating to the measurement model should be replicated with new data.
Simultaneously, this thesis emphasizes that the high share of missing values is not merely a measurement problem, but rather illustrates the complexity of the consumption process across different tourism segments, as only few resources and, eventually, few visitation benefits are commonly utilized and, thus, experienced by different customer segments. This observation is particularly in line with the nature of value‐in‐use (Vargo & Lusch, 2004a; Grönroos, 2006, 2008) and the nature of the service co‐creation process (Moeller, 2010). This thesis addressed this issue by adjusting the measurement model for a priori summer tourism segments, including hiking, mountain biking and village tourism. However, due to a relatively low sample size and the relatively high model complexity, an in‐depth examination of the measurement model could not be performed and, especially, discriminant validity could not be fully confirmed. Moreover, as the share of missing values remained high even after dividing the sample into three a priori segments, additional examination of the data is necessary in order to identify sub‐samples based on actual consumption patterns (Chekalina, Fuchs, Lexhagen, & Margaryan, 2013). Both cluster analysis and more advanced data mining techniques, such as association rules and neural networks (e.g., Larose, 2005; Fuchs et al., 2015) can be considered as useful tools for solving this task.
In addition, testing the model for two different seasonal products of the same destination allowed an increase in the generalizability of the results for destinations of different types. However, with regard to future research, it is suggested to test the model separately for different markets (i.e. a priori segments) in terms of country of origin, age groups and travel group composition, as well as a posteriori, consumption‐based segments, which, however, requires special efforts (and costs) to increase the sample size. Therefore, for a future stud, it is proposed to employ the Partial Least Squares (PLS) method, which is particularly useful, when the sample size is relatively small (i.e., as low as 30 observations or even less) (Hair et al., 2010). Furthermore, it is planned to test the proposed model for other destinations, including destinations of a higher geographical aggregate level (e.g., provinces or countries).
Furthermore, there are areas for future conceptual development of the proposed CBDBE model. Since the tourism destination example in this study is also a representation of a value network (Lusch et al., 2010), for future research, it is suggested that the proposed CBDBE model is similarly relevant for the broader
170

context of the service industry, as the focus is continuously shifting from a particular firm to a value network of service products, service providers, contexts, systems, information, customers, etc., which collectively co‐creates value‐in‐use for a particular customer.
Moreover, future research should introduce the time dimension into the conceptualization and measurement of the CBDBE model. Particularly, the proposed hierarchy of CBDBE model dimensions reflects the stages of the relationship development process between the tourist and the destination brand as proposed by Keller (2008, 2009). However, although “relationship” as a concept inherently implies that time dynamics should be taken into account, the CBDBE model, as it is currently formulated, remains static and is, thus, only capable to reflect tourists’ perceptions of the destination brand at a given moment of time. However, the question which inevitably arises, is how relevant various model dimensions are at different stages of the tourist‐destination relationship process? For instance, the conceptualization of destination awareness is particularly relevant for a renewal market, however, this is a problematic construct even for repeat customers (Aaker, 1996). On the contrary, since customers’ attitude and service performance evaluation adjusts over time, the assessment of respective dimensions should be performed later when the experience is completed, e.g. when tourists returned home and had sufficient time to reflect upon their holiday stay (Arnould and Price, 1993; Palmer, 2010). Thus, integrating the time dimension into the CBDBE model becomes an essential element for ensuring both theoretical validity and managerial relevance.
Finally, ethical aspects of value‐co‐creation in the context of brand relationship development between a tourist and a destination brand were left beyond the scope of this thesis. However, as discussed by Vargo and Lusch (2008a), ethical issues are deeply embedded within the service marketing paradigm and, specifically, the notion of value‐co‐creation. Particularly, as discussed by William and Aitken, 2011), the value‐co‐creation implies mutual dependency and reciprocal exchange and, thus, is the result of differences in goals and desires of economic actors. Moreover, goals and desires are different, because economic actors not only have different access to resources, but also have different values, which, under certain circumstances motivate some people to gain profit, and others to sustain personal relationships or to fulfil social duty. As a result, the process of value‐co‐creation depends on judgments of the involved actors about what is ‘good’ and what is ‘bad’, and, therefore, ethical decisions are highly involved. Most importantly, in the context of contemporary digital society and heavy use of social media, the failure to make ethically sound decisions spreads globally in no time and has an immediate impact on brand value. Moreover, this global connectedness in near‐real time implies that the target audience for marketing communications of
171

economic stakeholders expands far beyond the pool of the traditional set of potential customers. Today, everyone has the power to amplify or to weaken the brand value, as more and more people are taking action if they consider that the behaviour of a stakeholder does not comply with ethical norms (Williams and Aitken, 2011).
172

8. REFERENCES
Aaker, D.A. (1991). Managing brand equity. New York: The Free Press.
Aaker, D.A. (1996). Building strong brands. New York: The Free Press.
Abbott, L. (1955). Quality and competition. New York, NY: Columbia University Press.
Alderson, W. (1957). Marketing behaviour and executive action. Irwin: Homewood, IL.
Alegre, J., & Juaneda, C. (2006). Destination Loyalty. Consumer’s Economic Behavior. Annals of Tourism Research, 33(3), 684‐706.
Armstrong, G., & Kotler, P. (2007). Marketing, an introduction. 8th edition. Pearson Prentice Hall.
Armstrong, G., & Kotler, P. (2009). Marketing ‐ An Introduction. 9th ed. Pearson Prentice Hall.
Arnould, E.J., & Price, L.L. (1993). River Magic: Extraordinary Experience and the Extended Service Encounter. The Journal of Consumer Research, 20(1), 24‐45.
Arnould, E.J., Price, L.L., & Tierney, P. (1998). Communicative Staging of the Wilderness Servicescape. The Service Industries Journal, 18(3), 90‐115.
Babakus, E., & Boller, G.W. (1992). An Empirical Assessment of the SERVQUAL Scale. Journal of Business Research, 24 (May), 253‐268.
Back, K. J., & Parks, S. C. (2003). A Brand Loyalty Model involving cognitive, affective and conative Brand loyalty and customer satisfaction. Journal of Hospitality and Tourism Research, 27(4), 419‐435.
Baker, D., & Crompton, J. (2000). Quality, Satisfaction and Behavioural Intentions. Annals of Tourism Research, 27, 785–804.
Baloglu, S. (2001). Image variations of Turkey by familiarity index: informational and experiential dimensions. Tourism Management, 22, 127‐133.
Baloglu, S., & McCleary, K.W. (1999). A model of destination image formation. Annals of Tourism Research, 26(4), 868‐897.
Baron, S., & Harris, K. (2010). Toward and understanding of consumer perspective on experiences. Journal of Services Marketing, 24(7), 518‐531.
Baron, S., Conway, T., & Warnaby, G. (2010). Relationship Marketing. A Consumer Experience Approach. 2nd ed. SAGE.
Baum, S.H. (1990). Making Your Service Blueprint Pay Off. Journal of Services Marketing, 4 (Summer), 45‐52.
173

Beard, J.G., & Ragheb, M.G. (1980). Measuring leisure satisfaction. Journal of Leisure Research, 12, 20–33.
Beerli, A., & Martin, J.D. (2004). Factors influencing destination image. Annals of Tourism Research, 31(3), 657‐681.
Berry, L.L. (1983). Relationship Marketing. In: L.L. Berry, L.G. Shostack and G.D. Upah (Eds.), Emerging Perspectives on Services Marketing. Chicago, IL: American Marketing Association, 25‐28.
Berry, L.L. (2000). Cultivating Service Brand Equity. Journal of the Academy of Marketing Science, 28(1), 128‐137.
Berry, L.L., & Parasuraman, A. (1991). Marketing Services: Competing Through Quality. New York, NY: The Free Press.
Berry, L.L., & Parasuraman, A. (1993). Building a New Academic Field – The Case of Services Marketing. Journal of Retailing, 69 (Spring), 13‐60.
Bianchi, C., Pike, S., & Ling, I. (2014). Investigating attitudes towards three South American destinations in an emerging long haul market using a model of consumer‐based brand equity (CBBE). Tourism Management, 42, 215‐223.
Bigne Alcaniz, E., Garcia, I.S., & Blas, S.S. (2009). The functional‐psychological continuum in the cognitive image of a destination: A confirmatory analysis. Tourism Management, 30, 715‐723.
Bitner, M.J. (1990). Evaluating Service Encounters: The Effects of Physical Surroundings and Employee Responses. Journal of Marketing, 54 (April), 69‐82.
Bitner, M.J. (1992). Servicescapes: The Impact of Physical Surroundings on Customers and Employees. Journal of Marketing, 56 (April), 57‐71.
Bitner, M.J., Booms B.H., & Tetreault, M.S. (1990). The service Encounter: Diagnosing Favourable and Unfavourable Incidents. Journal of Marketing, 54 (January), 71‐84.
Blain, C., Levy, S. E., & Ritchie, J. R. B. (2005). Destination branding: insights and practices from destination management organizations. Journal of Travel Research, 43, 328–338.
Blumberg, B., Cooper, D.R., and Schindler, P.S. (2008). Business research methods. Second European edition. McGraw‐Hill Higher Education.
Bolton, R.N., & Drew, J.H. (1991)a. A Longitudinal Analysis of the Impact of Service Changes on Consumer Attitudes. Journal of Marketing, 55 (January), 1‐9.
174

Bolton, R.N., & Drew, J.H. (1991)b. A Multistage Model of Customers’ Assessments of Service Quality and Value. Jounral of Consumer Research, 17(4), 375.384.
Boo, S., Busser, J., & Baloglu, S. (2009). A model of customer‐based brand equity and its application to multiple destinations. Tourism Management, 30(2), 219‐231.
Bowen, D.E., & Lawler, E.E. (1992). The Empowerment of Service Workers: What, Why, How, and When. Sloan Management Review, 33 (Spring), 31‐39.
Brown, S.W., & Swartz, T.A. (1989). A Gap Analysis of Professional Service Quality. Journal of Marketing, 53 (April), 92‐98.
Brown, T.A. (2006). Confirmatory Factor Analysis for Applied Research. New York, London: The Guilford Press.
Buhalis, D. (2000). Marketing the competitive destination of the future. Tourism Management, 21, 97‐116.
Buhalis, D., & Law, R. (2008). Progress in information technology and tourism management: 20 years on and 10 years after the Internet ‐The state of eTourism research. Tourism Management, 29, 609‐623.
Byrne, B.M. (2001). Structural Equation Modelling with AMOS, EQS and LISREL ‐Comparative Approaches to Testing for the Factorial Validity of Measurement Instrument. International Journal of Testing, 1(1), 55‐86
Callarisa, L., Garcia, J. S., Cardiff, J. & Roshchina, A. (2012). Harnessing social media platforms to measure customer‐based hotel brand equity. Tourism management, 4, 73‐79.
Carman, J.M. (1990). Consumer Perceptions of Service Quality: An Assessment of the SERVQUAL Dimensions. Journal of Retailing, 66 (Spring), 33‐55.
Chekalina T., Fuchs M. & Lexhagen M. (2014). A value co‐creation perspective on Customer‐Based Brand Equity Model for Tourism Destinations, Finnish Journal of Tourism Research (Matkailututkimus), 10 (1), p. 8‐24.
Chekalina, T., Fuchs, M., Lexhagen, M., & Margaryan, L. (2013). Measuring Customer‐Based Brand Equity for Tourism Destinations ‐ Understanding Missing Value Patterns for Tangible Destination Resources. In: L. Altinay, V. Jauhari, F. Vong and M. Uysal (Eds.), The 6th International Conference on Services Management – Managing Services Across Continents, 23‐25 June, Cyprus, 138‐175.
Chen, C. F., & Tsai, D. (2007). How destination image and evaluative factors affect behavioral intentions? Tourism Management, 28(4), 1115‐1122.
175

Chen, C.‐F., & Myagmarsuren, O. (2010). Exploring relationships between Mongolian destination brand equity, satisfaction and destination loyalty. Tourism Economics, 16(4), 981‐994.
Chesbrough, H., & Spohrer, J. (2006). A research manifesto for services science. Communication of the ACM, 49(7), 35‐40.
Chi, C.G.Q., & Qu, H.L. (2008). Examining the structural relationships of destination image, tourist satisfaction and destination loyalty: An integrated approach. Tourism Management, 29(4), 624‐636.
Christodoulides, G., & de Chernatony, L. (2010). Consumer‐based brand equity conceptualisation and measurement. A literature review. International Journal of Market Research, 52(1), 43‐66.
Christodoulides, G., de Chernatony, L., Furrer, O., & Abimbola, T. (2006). Conceptualising and measuring the equity of online brands. Journal of Marketing Management, 22(7/8), 799–825.
Christopher, M., Payne, A., & Ballantyne, D. (1991). Relationship Marketing: Bringing Quality, Customer Service and Marketing Together. Oxford: Butterworth Heinemann.
Churchill, G.A. (1979). A Paradigm for Developing Better Measures of Marketing Constructs. Journal of Marketing Research, 16, 64‐73.
Clancy, M. (1998). Commodity chains, services and development: theory and preliminary evidence from the tourism industry. Review of International Political Economy, 5(1), 122‐148.
Collins, A.M., & Loftus, E.F., (1975). A Spreading Activation Theory of Semantic Procesing. Psychological Review, 82, 407‐428.
Cova, B., & Dalli, D. (2009). Working consumers: the next step in marketing theory? Marketing Theory, 9, 315‐339.
Cracolici, M.F., & Nijkamp, P. (2009). The attractiveness and competitiveness of tourist destinations: A study of Southern Italian regions. Tourism Management, 30(3), 336‐344.
Creswell, J.W. (2009). Research Design: Qualitative, Quantitative, and Mixed Method Approaches. 3rd edition. London: Sage Publications.
Crompton, J.L. (1979). Motivations for pleasure vacation. Annals of Tourism Research, 6(4), 408‐424.
Cronin, J. J., Jr., & Taylor, S. A. (1992). Measuring service quality: a reexamination and extension. Journal of Marketing, 56(3), 55–68.
176

Crosby, L.A., & Stephens, N. (1987). Effects of Relationship Marketing on Satisfaction, Retention, and Prices in the Life Insurance Industry. Journal of Marketing Research, 24, 404‐411.
Crosby, L.A., Evans K.R., & Cowles, D. (1990). Relationship Quality in Services Selling: An Interpersonal Influence Perspective. Journal of Marketing, 54 (July), 68‐81.
Davis, R., Piven, I. & Breazeale, M. (2014). Conceptualizing the brand in social media community: the five source model. Journal of Retailing and consumer services, 21(4), 468‐481.
de Chernatony, L. (1999). Brand Management Through Narrowing the Gap Between Brand Identity and Brand Reputation. Journal of Marketing Management, 15, 157‐179.
de Chernatony, L., & McDonald, M. (2001). Creating Powerful Brands in Consumer, Service and Industrial Markets. Oxford: Butterworth‐Heinemann.
de Chernatony, L., Harris, F.J., & Christodoulides, G. (2004). Developing a brand performance measure for financial services brands. Services Industries Journal, 24(2), 15–33.
Debbage, K.G., & Daniels, P. (1998). The tourist industry and economic geography: missed opportunities. In Ioannides, D. and Debbage, K.G. eds. The economic geography of the tourist industry. London and New York: Routledge, 17‐30.
del Bosque, I. R., & Martin, H. S. (2008). Tourist Satisfaction ‐ A Cognitive‐Affective Model. Annals of Tourism Research, 35(2), 551‐573.
Dolnicar, S., Laesser, C., & Matus, K. (2009). Online Versus Paper: Format Effects in Tourism Surveys. Journal of Travel Research, 47(3), 259‐316.
Echtner, C. M., & Ritchie, J.R.B. (1993). The Measurement of Destination Image: An Empirical Assessment. Journal of Travel Research, 31 (Spring), 3–13.
Echtner, C.M., & Ritchie, J.R.B. (1991). The Meaning and Measurement of Destination Image. The Journal of Tourism Studies, 2(2), 2‐12.
Eiglier, P., Langeard, E., Lovelock, C.H., Bateson, J.E.G., & Young, R.F., eds. (1977). Marketing Consumer Services: New Insights. Cambridge, MA: Marketing Science Institute.
Ek, R., Larsen, J., Hornskov, S.B., & Mansfeldt, O.K. (2008). A Dynamic Framework of Tourist Experiences: Space‐Time and Performances in the Experience Economy. Scandinavian Journal of Hospitality and Tourism, 8(2), 122‐140.
177

Ekinci, Y., & Riley, M. (2001). Validating Quality Dimensions. Annals of Tourism Research, 28, 202–223.
Evangelista, F., & Dioko, L.A.N. (2011). Interpersonal influence and destination brand equity perceptions. International Journal of Culture, Tourism and Hospitality Research, 5(3), 316‐328.
Evans, J.R., & Mathur, A. (2005). The value of online surveys. Internet Research, 15(2), 195‐219.
Faullant, R., Matzler, K., & Füller, J. (2008). The Impact of Satisfaction and Image on Loyalty. The Case of Alpine Ski Resorts. Managing Service Quality, 18(2), 163‐178.
Ferns, B.H., & Walls, A. (2012). Enduring travel involvement, destination brand equity, and travellers’ visit intentions: A structural model analysis. Journal of Destination Marketing and Management, 1, 27‐35.
Field, A. (2005). Discovering statistics using SPSS. SAGE Pulbications.
Fisk, R.P., Brown S.W., & Bitner, M.J. (1993). Tracking the evolution of the services marketing literature. Journal of Retailing, 69(1), pp.61‐103.
Franke, N., & Mazanez, J.A. (2006). The six identities of marketing: a vector quantization of research approaches. European Journal of Marketing, 40 (5/6), 634‐661.
Fuchs, M. (2004). Strategy development in tourism destinations: A data envelopment analysis approach. Poznan University Economics Review, 4(1), 52‐73.
Fuchs, M., & Weiermair, K. (2003). New Perspectives of satisfaction research in tourism destinations. Tourism Review, 58(3), 6‐14.
Fuchs, M., Chekalina, T., Höpken, W., & Lexhagen, M. (2015). Customer‐based Brand Equity Modelling for Big Data Analytics in Tourism Destinations – A Case from Sweden. In. E. Fayos‐Solá and J. Jafari (Eds.), Tourism Intelligence in Action. T‐Forum 2015 Global Conference, (in print)
Fuchs, M., Höpken, W., & Lexhagen, M. (2014). Big Data Analytics for Knowledge Generation in Tourism Destinations – A Case from Sweden. Journal of Destination Marketing and Management, 3(4), 198‐209.
Gallarza, M. G., Saura, I. G., & Garcia, H. C. (2002). Destination image ‐ Towards a conceptual framework. Annals of Tourism Research, 29(1), 56‐78.
Garcia, J.A., Gómez, M., & Molina, A. (2012). A destination‐branding model: An empirical analysis based on stakeholders. Tourism Management, 33, 646‐661.
178
Gartner, W.C. (1994). Image Formation Process. Journal of Travel and Tourism Marketing, 2(2‐3), 191‐216.
Gartner, W.C. (2009). Deconstructing brand equity. In Tourism Branding: Communities in Action. Bridging Tourism Theory and Practice, 1, 51‐63.
Gartner, W.C., & Konecnik Ruzzier, M. (2011). Tourism Destination Brand Equity Dimensions: Renewal versus Repeat Market. Journal of Travel Research, 50(5), 471‐481.
Gensler, S., Völcker F., Liu‐Thompkins, Y. & Wiertz, C. (2013). Managing brands in the social media environment. Journal of interactive marketing, 27(4), 242‐256.
George, W.R. (1990). Internal Marketing and Organizational Behaviour: A Partnership in Developing Customer‐Conscious Employees at Every Level. Journal of Business Research, 20 (January), 63‐70.
Gnoth, J. (2007). The structure of destination brands: leveraging values. Tourism Analysis, 12(5/6), 345–358.
Goodall, B., & Ashworth, G. (eds.) (1988). Marketing in the tourism industry: The promotion of destination regions. London: Groom Helms.
Goodwin, C.F. (1990). I Can Do It Myself: Training the service Consumer to Contribute to Service Productivity. Journal of Services Marketing, 2 (Fall), 71‐78.
Grönroos, C. (1979). Marketing of services: A study of the Marketing Function of Service Firms. Econ. D. dissertation, Swedish school of Economics (Finland).
Grönroos, C. (1981). Internal Marketing – An Integral Part of Marketing Theory. In J.H. Donnely and W.R. George (Eds.), Marketing of Services. Chicago, IL: American Marketing Association, 236‐238.
Grönroos, C. (1982). An Applied Service Marketing Theory. European Journal of Marketing, 16(7), 30‐41.
Grönroos, C. (1983). Strategic Management and Marketing in the Service Sector. Cambridge, MA: Marketing Science Institute.
Grönroos, C. (1990). Relationship Approach to Marketing in Service Contexts: The Marketing and Organizational Behaviour Interface. Journal of Business Research 20 (January), 3‐11.
Grönroos, C. (2000). Service Management and Marketing. A customer relationship management approach. 2nd edition. Wiley.
Grönroos, C. (2006). Adopting a Service Logic for Marketing. Marketing Theory, 6(3), 317‐333.
179

Grönroos, C. (2008). Service logic revisited: who creates value? And who co‐creates? European Business Review, 20(4), 298‐314.
Grönroos, C. (2009). Marketing as promise management: regaining customer management for marketing. Journal of Business and Industrial Marketing, 24/5/6, 351‐359.
Grönroos, C., & Gummesson, E. (Eds.) (1985). Service Marketing – Nordic school Perspectives. Stockholm, Sweden: University of Stockholm.
Gummesson, E. (1976). Marknadsfunktionen i företaget (The Marketing Function of the Firm). Stockholm: Norstedts.
Gummesson, E. (1987). Using Internal Marketing to Develop a New Culture – The Case of Ericsson Quality. Journal of Business and Industrial Marketing, 2 (Summer), 23‐28.
Gummesson, E. (2002). Total Relationship Marketing. 2nd ed. Oxford: Butterworth Heinemann.
Gummesson, E. (2008). Customer centricity: reality of a wild goose chase? European Business Review, 20(4), 315‐330.
Gummesson, E., Lusch, R.F., & Vargo, S.L. (2010). Transitioning from service management to service‐dominant logic. Observations and recommendations. International Journal of Quality and Service Sciences, 2(1), 8.22.
Gupta, S., & Vajic, M. (2000). The contextual and dialectical nature of experiences. In Fitzsimmons, J.A. and Fitzsimmons, M.J. (Eds.), New Service Development: Creating Memorable Experiences. Thousand Oaks, CA; Sage.
Gutman, J. (1982). A Means‐end chain model based on consumer categorization processes. Journal of Marketing, 46(1), 60‐72.
Haigh, D. (1999). Understanding the Financial Value of Brands. Brussels: European Association of Advertising Agencies.
Hair, J.F. Jr., Black, W.C., Babin, B.J., & Anderson, R.E. (2010). Multivariate Data Analysis. A Global Perspective. 7th ed. Pearson.
Hanson, D., & Grimmer, M. (2007). The mix o qualitative and quantitative research in major marketing journals, 1993‐2002. European Journal of Marketing, 41 (1/2), 58‐70.
Harris, R., Harris, K., & Baron, S. (2003). Theatrical service experiences: dramatic script development with employees. International Journal of Service Industry Management, 14(2), 184‐99.
180

Hart, C.W.L. (1988). The Power of Unconditional Service Guarantees. Harvard Business Review, July‐August, 54‐62.
Hart, C.W.L., Sasser, W.E. Jr., & Heskett, J.L. (1990). The Profitable Art of Service Recovery. Harvard Business Review, July‐August, 148‐156.
Haukeland, JV., Grue, B. & Veisten, K. (2010) Turning National Parks into Tourist Attractions: Nature Orientation and Quest for Facilities. Scandinavian Journal of Hospitality and Tourism, 10(3), 248‐271.
Helkkula, A., & Kelleher, C. (2010). Circularity of customer service experience and customer perceived value. Journal of Customer Behaviour, 9(1), 37‐53.
Holbrook, M.B. (1999). Consumer value: a framework for analysis and research. Routledge, New York.
Holbrook, M.B. (2006). Consumption experience, customer value, and subjective personal introspection: An illustrative photographic essay. Journal of Business Research, 59, 714‐725.
Holbrook, M.B., & Hirschman, E.C. (1982). The experiential aspects of consumption: consumer fantasies, feelings and fun. Journal of Consumer Research, 9(2), 132‐40.
Höpken, W., Fuchs, M., Keil, D., & Lexhagen, M. (2011). The Knowledge Destination – A Customer Information‐based Destination Management Information System. In: R. Law, M. Fuchs and F. Ricci (Eds.), Information and Communication Technologies in Tourism. New York: Springer, 417‐429.
Horng, J.‐S., Liu, C.‐H., Chou, H.‐Y., & Tsai C.–Y. (2012). Understanding the impact of culinary brand equity and destination familiarity on travel intentions. Tourism Management, 33 815‐824.
Hudson, S., & Shephard, G.W.H. (1998). Measuring Service Quality at Tourist Destinations: An Application of Importance‐Performance Analysis to an Alpine Ski Resort. Journal of Travel and Tourism Marketing, 7(3), 61‐77.
Hudson, S., Roth M. S., Madden, T. J., & Hudson, R. (2015). The effects of social media on emotions, brand relationship quality, and word of mouth: An empirical study of music festival attendees. Tourism Management, 47, 68‐76.
Im, H.H., Kim, S.S., Elliot, S., & Han, H. (2012). Conceptualizing Destination Brand Equity Dimensions from a Consumer‐Based Brand Equity Perspective. Journal of Travel & Tourism Marketing, 29(4), 385‐403,
Janssens, A.W., de Pelsmacker, P., Wijnen, K., & Van Kenhov, P. (2008). Marketing research with SPSS. Prentice Hall.
181

Jennings, G. R. (2009). Methodologies and Methods. In: Jamal, T. And Robinson, M. (Eds), The SAGE Handbook of Tourism Studies. London, SAGE.
Johnson, E.M. (1969). Are Goods and Services Different? An Exercise in Marketing Theory. PhD. Dissertation, Washington University.
Jöreskog, K.G., & Sörbom, D. (1984). LISREL VI: Analysis of linear structural relationships by maximum likelihood, instrumental variables, and least squares methods. Mooresville, IN: Scientific Software.
Jung, Y. N., Kim, S., & Kim, S. (2014). Influence of consumer attitude toward online brand community on revisit intention and brand trust. Journal of retailing and consumer services, 21(4), 581‐589.
Keller, K.L. (1993). Conceptualizing, measuring, and managing customer‐based brand equity. Journal of Marketing, 57, 1‐22.
Keller, K.L. (2008). Strategic Brand Management Building, Measuring and Managing Brand Equity. 3rd ed.. Ney Jersey: Pearson Education.
Keller, K.L. (2009). Building strong brands in a modern marketing communications environment. Journal of Marketing Communications, 15(2‐3), 139‐155. Keller, K.L., & Lehman, D.R. (2009). Assessing long‐term brand potential. Brand Management, 17(1), 6‐17.
Kelley, S.W., Donnelly, J.H. Jr., & Skinner, S.J. (1990). Customer Participation in Service Production and Delivery. Journal of Retailing, 66 (Fall), 315‐335.
Kim, S.‐H., Han, H.‐S., Holland, S., & Byon, K.K. (2009). Structural relationships among involvement, destination brand equity, satisfaction and destination visit intentions: The case of Japanese outbound travelers. Journal of Vacation Marketing, 15(4), 349‐365.
Kingman‐Brundage, J. (1991). Technology, Design and Service Quality. International Journal of Service Industry Management, 2(3), 47‐59.
Kladou, S., & Kehagias , J. (2014). Assessing destination brand equity: An integrated approach. Journal of Destination Marketing and Management, 3, 2‐10.
Klenoski, D.B., Gengler, C.E., & Mulvey, M.S. (1993). Understanding the Factors Influencing Ski Destination Choice: A Means‐End Analytic Approach. Journal of Leisure Research, 25(4), 362‐379.
Klenosky, D. B. (2002). The “Pull” of Tourism Destinations: A Means‐End Investigation. Journal of Travel Research, 40(4), 385‐396.
Komppula, R. (2005). Pursuing Customer Value in Tourism – A Rural Tourism Case‐Study. Journal of Hospitality and Tourism, 3(2), 83‐104.
182

Komppula, R., & Gartner, W.C. (2013). Hunting as a travel experience: An auto‐ethnographic study of hunting tourism in Finland and the USA. Tourism Management, 35, 168‐180.
Komppula, R., & Laukkanen, T. (2009). Ski Destination Profile Based on Attributes of Ski Destination Choice. In Dioko, L. and Xiang, Li (eds.), 3rd International Conference on Destination Branding and Marketing, 2‐4 Dec. Macau, 238‐249.
Konecnik, M., & Gartner, W.C. (2007). Customer‐based Brand Equity for a Destination. Annals of Tourism Research, 34(2), 400‐421.
Kotler, P. (1984). Marketing management: analysis, planning, and control. 5th edition. Englewood Cliffs, N.J. : Prentice‐Hall.
Kotler, P. (2000). Marketing management. 10th edition. Upper Saddle River, N.J.: Prentice Hall.
Kotler, P., & Keller, K. (2006). Marketing management. 12th edition. Pearson Prentice Hall.
Kotler, P., & Keller, K. (2009). Marketing Management. 13th edition. Pearson Prentice Hall.
Kotler, P., Bowen, J.T., & Makens, J.C. (2006). Marketing for hospitality and tourism. 4th edition. Pearson Prentice Hall.
Laroche, M., Habibi, M. R., & Richard, M‐O. (2012). To be or not to be in social media: how brand loyalty is affected by social media. International journal of information management, 33(1), 76‐82.
Larose, D.T. (2005). Discovering knowledge in data. New Jersey: John Wiley & Sons.
Larsen, S. (2007). Aspects of a Psychology of the Tourist Experience. Scandinavian Journal of Hospitality and Tourism, 7(1), 7‐18.
Lassar, W., Mittal, B., & Sharma, A. (1995). Measuring customer‐based brand equity. Journal of Consumer Marketing, 12(4), 11–19.
Lehmann, D.R., Keller, K.L., & Farley, J.U. (2008). The Structure of Survey‐Based Brand Metrics. Journal of International Marketing, 16(4), pp.29‐56.
Li, X., & Petrick, J.F. (2008). Tourism Marketing in an Era of Paradigm Shift. Journal of Travel Research, 46 (February), 235‐244.
Lindberg‐Repo, K., & Grönroos, C. (2004). Conceptualising communications strategy from a relational perspective. Industrial Marketing Management, 33(3), 229‐239.
183

Lovelock, C., & Gummesson, E. (2004). Whither Services Marketing? In Search of a New Paradigm and Fresh Perspectives. Journal of service Research, 7(1), 20‐41.
Lovelock, C.H. (1983). Classifying Services to Gain Strategic Marketing Insights. The Journal of Marketing, 47(3), 9‐20.
Low, G. S., & Lamb, C. W. (2000). The measurement and dimensionality of brand associations. Journal of Product and Brand Management, 9(6), 350–368.
Lusch, R.F., Vargo, S.L., Tanniru, M. (2010). Service, value networks and learning. Journal of the Academy of Marketing Science, 38, 19‐31.
Manfredo, M.J., Driver, B.L., & Tarrant, M.A. (1996). Measuring leisure motivation: A meta‐analysis of the Recreation Experience Preference Scale. Journal of Leisure Research, 28, 188‐213.
Mazanec, J. (1994). Image Measurement with Self‐Organizing Maps: A Tentative Application to Austrian Tour Operators. Revue du Tourisme, 49(3), 9–18.
McDowel, W.J. (1953). The Marketing of Consumer Services. PhD. Dissertation, University of Iowa.
Merz, M.A., He, Y., & Vargo, S.L. (2009). The evolving brand logic: a service‐dominant logic perspective. Journal of the Academy of Marketing Science, 37, 328‐344.
Milman, A., & Pizam, A. (1995). The Role of Awareness and Familiarity with a Destination: The Central Florida Case. Journal of Travel Research, 33(3), 21‐27.
Moeller, S. (2010). Characteristics of services – a new approach uncovers their value. Journal of services Marketing, 24/5, 359‐368.
Morgan, N. J., Pritchard, A., & Pride, R. (Eds.) (2004). Destination Branding. Creating the Unique Destination Proposition. 2nd ed. Oxford: Elsevier.
Mossberg, L. (2007). A Marketing Approach to the Tourist Experience. Scandinavian Journal of Hospitality and Tourism, 7(1), 59‐74.
Murphy, P., Pritchard, M.P., & Smith, B. (2000). The destination product and its impact on traveler perceptions. Tourism Management, 21, 43‐52.
Murphy, P.E. (1985). Tourism: A Community Approach. London: Methuen.
Oliva, T.A., Oliver, R.L., & MacMillan, I.C. (1992). A Catastrophe Model for Developing Service Satisfaction Strategies. Journal of Marketing, 56 (July), 83‐95.
Oliver, R.L. (1997). Satisfaction: A behavioral perspective of the consumer. New York: Irvin/McGraw‐Hill.
Oliver, R.L. (1999). Whence Consumer Loyalty? The Journal of Marketing, 63 (Special Issue), 33‐44.
184

Palmer, A. (2010). Customer experience management: a critical review of an emerging idea. Journal of Services Marketing, 24/3, 196‐208.
Pan, S., & Ryan, C. (2007). Mountain Areas and Visitor Usage‐Motivations and Determinants of Satisfaction: The Case of Pirongia Forest Park, New Zealand. Journal of Sustainable Tourism, 15(3), 288‐308.
Parasuraman, A. (2002). Service quality and productivity: a synergistic perspective. Managing Service Quality, 12(1), 6‐9.
Parasuraman, A., Berry L.L., & Zeithaml, V.A. (1991). Refinement and Reassessment of the SERVQUAL Scale. Journal of Retailing, 67 (Winter), 420‐450.
Parasuraman, A., Zeithaml V.A., & Berry, L.L. (1985). A Conceptual Model of Service Quality and Its Implications for Future Research. Journal of Marketing, 49 (Fall), 41‐50.
Parasuraman, A., Zeithaml, V.A., & Berry, L.L. (1988). SERVQUAL: A Multiple‐item Scale for Measuring Consumer Perceptions of Service Quality. Journal of Retailing, 64 (Spring), 12‐37.
Pettersson, R., & Getz, D. (2009). Event Experiences in Time and Space: A Study of Visitors to the (2007) World Alpine Ski Championships in Åre, Sweden. Scandinavian Journal of Hospitality and Tourism, 9(2‐3), 308‐326.
Pike, S. (2005). Tourism destination branding complexity. Journal of Product and Brand Management, 14(4), 258‐259.
Pike, S. (2009). Destination Brand Positions of a Competitive Set of Near‐Home Destinations. Tourism Management, 30(6), 857‐866.
Pike, S., Bianchi; C., Kerr, G., & Patti, C. (2010). Consumer‐based brand equity for Australia as a long‐haul tourism destination in an emerging market. International Marketing Review, 27(4), 434‐449.
Pike, S., Murdy, S., & Lings, I. (2011). Visitor Relationship Orientation of Destination Marketing Organizations. Journal of Travel Research, 50(4), 443‐453.
Prahalad, C.K., & Ramaswamy, V. (2004). Co‐creation experiences: the next practice in value creation. Journal of interactive marketing, 18(3), 5‐14.
Prebensen, N.K., Vitterso, J., and Dahl, T.I. (2013). Value Co‐Creation Significance of Tourist Resources. Annals of Tourism Research, 42, 240‐261.
Qu, H., Kim, L.H., & Im, H.H. (2011). A model of destination branding: Integrating the concept of the branding and destination image. Tourism Management, 32(3), 465‐476.
185

Quinn, J.B., Doorley, T.L., & Paquette, P.C. (1990). Beyond Products: Services‐Based Strategy. Harvard Business Review, 68 (March‐April), 58‐68.
Raadik, J., Cottrell, S., Fredman, P., Ritter, P. & Newman, P. (2010) Understanding Recreational Experience Preferences: Application at Fulufjället National Park, Sweden. Scandinavian Journal of Hospitality and Tourism, 10(3), 231‐247.
Raaijmakers, J.G.W., & Shiffrin, R.M. (1981). Search of Associative Memory. Psychological Review, 88, 93‐134.
Ragheb,M.G., & Beard, J.G. (1982). Measuring leisure attitudes. Journal of Leisure Research, 14, 155–162.
Ratcliff, R., & McKon, G. (1988). A Retrieval Theory of Priming in Memory. Psychological Rview, 95(3), 385‐408.
Rathmell, J.M. (1966). What Is Meant By Services? Journal of Marketing, 30 (October), 32‐36.
Reichheld F.F., & Sasser, W.E. (1990). Zero Defections: Quality Comes to Services. Harvard Business Review, 68 (September‐October), 105‐111.
Reisinger, Y., & Turner, L. (1999). Structural Equation Modelling with LISREL: Application in Tourism. Tourism Management, 20(2), 71‐88.
Reynolds, T.J., & Olson, J.C. (2001). Understanding consumer decision making. The Means‐End Approach to Marketing and Advertising Strategy. LEA Publishers.
Sánchez‐Fernández, R., & Iniesta‐Bonillo, M.Á. (2007). The concept of perceived value: a systematic review of the research. Marketing Theory, 7(4), 427‐451.
Scheuing, E.E., & Johnson, E.M. (1989). A Proposed Model for New Service Development. Journal of Services Marketing, 3 (Spring), 25‐34.
Schmitt, B. (1999). Experiential Marketing: How to Get Customers to Sense, Feel, Think, Act and Relate to Your Company and Brands. New York, NY: Free Press.
Seligman, M.E.P., & Csikszentmihalyi, M. (2000). Positive Psychology. An Introduction. American Psychologist, 55(1), 5‐14.
Sheth, J.N., & Parvatiyar, A. (1995). The evolution of Relationship Marketing. International Business Review, 4(4), 397‐418.
Sheth, J.N., Newman, B.I., & Gross, B.L. (1991). Why We Buy What We Buy: A Theory of Consumption Values. Journal of Business Research, 22, 159‐170.
Shostack, G.L. (1977). Breaking Free from Product Marketing. Journal of Marketing, 41 (April), 73‐80.
186

Shostack, G.L. (1984). Designing Services That Deliver. Harvard Business Review, 62 (January‐February), 133‐139.
Shostack, G.L. (1987). Service Positioning Through Structural Change. Journal of Marketing, 51 (January), 34‐43.
Simon, C.J., & Sullivan, M.V. (1993). The measurement of determinants of brand equity: a financial approach. Marketing Science, 12(1), pp. 28–52.
Skår, M., Odden, A., & Vistad, O.I. (2008). Motivation for mountain biking in Norway: Change and stability in late‐modern outdoor recreation. Norwegian Journal of Geography, 62(1), 36‐45.
Smith, S.L.J. (1994). The tourism product. Annals of Tourism Research, 21(3), 582‐595.
Smith, S.L.J. (1998). Tourism ad an industry: debates and concepts. In Ioannides, D. and Debbage, K.G. eds. The economic geography of the tourist industry. London and New York: Routledge, 31‐52.
Solomon, M.R. Surprenant, C., Czepiel, J.A., & Gutman, E.G. (1985). A Role Theory Perspective on Dyadic Interactions: The Service Encounter. Journal of Marketing, 49, 99‐111.
Spector, P. A. (1992). Summated Rating Scale Construction: An Introduction. Newbury Park, CA, Sage.
Spiggle, S. (1994). Analysis and Interpretation of Qualitative Data in Consumer Research. Journal of Consumer Research, 21(3), 491‐503.
Steenkamp, J.‐B.E.M., & H. Baumgartner (2000). On the Use of Structural Equation Models for Marketing Modelling. International Journal of Research in Marketing, 17(2), 195‐202.
Sweeney, J.C., & Soutar, G.N. (2001). Consumer perceived value: The development of a multiple item scale. Journal of Retailing, 77, 203‐220.
Thomas, D.R.E. (1978). Strategy is Different in Service Businesses. Harvard Business Review, 56 (July‐August), 158‐165.
UN (United Nations), World Tourism Organization (WTO), EUROSTAT and Organisation for Economic Co‐operation and Development (OECD) (2008). Tourism Satellite Account: Recommended Methodological Framework (2008). Luxembourg, Madrid, New York, Paris.
Vargo, S.L. (2009). Toward a transcending conceptualization of relationship: a service‐dominant logic perspective. Journal of Business and Industrial Marketing, 24/5/6, 373‐379.
187

Vargo, S.L., & Lusch, R.F. (2004)a. Evolving to a New Dominant Logic for Marketing. Journal of Marketing, 68, 1‐17.
Vargo, S.L., & Lusch, R.F. (2004)b. The Four Service Marketing Myths: Remnants of a Goods‐Based, Manufacturing Model. Journal of Service Research, 6(4), 324‐335.
Vargo, S.L., & Lusch, R.F. (2008)a. Service‐dominant logic: continuing the evolution. Journal of the Academy of Marketing Science, 36, 1‐10.
Vargo, S.L., & Lusch, R.F. (2008)b. Why “service”? Journal of the Academy of Marketing Science, 36, 25‐38.
Weiermair, K., & Fuchs, M. (1999). Measuring tourist judgments on service quality. Annals of Tourism Research, 26(4), 1004‐1021.;
Williams, J., & Aitken, R. (2011). The Service‐Dominant Logic of Marketing and Marketing Ethics. Journal of Business Ethics, 102, 439‐454.
Williams, P., & Soutar, G.N. (2009). Value, Satisfaction and Behavioral Intentions In An Adventure Tourism Context. Annals of Tourism Research, 36(3), 413‐438.
Woodruff, R.B. (1997). Customer Value: The Next Source for Competitive Advantage. Journal of the Academy of Marketing science, 25(2), 139‐153.
Xiang, Z., & Gretzel, U. (2010). Role of social media in online travel information search. Tourism Management, 31(2), 179‐188.
Yeganeh, H., & Su, Z. (2005). Positivism and constructivism: two opposite but reconcilable paradigms in cross‐cultural management research. Proceedings of 33rd ASAC Annual Conference, Administrative Sciences Association of Canada.
Yoon, Y., & Uysal, M. (2005). An examination of the effects of motivation and satisfaction on destination loyalty: a structural model. Tourism Management, 26(1), 45‐56.
Zabkar, V., Brencic, M.M., & Dmitrovic, T. (2010). Modelling perceived quality, visitor satisfaction and behavioral intentions at the destination level. Tourism Management, 31, 537‐546.
Zeithaml, V., & Bitner, M. J. (2000). Service marketing: Integrating customer focus across the firm (2nd ed.). New York: Irwin McGraw‐Hill.
Zeithaml, V.A. (1988). Consumer Perceptions of Price, Quality, and Value: A Means‐End Model and synthesis of Evidence. The Journal of Marketing, 52(3), 2‐22.
Zeithaml, V.A., Berry, L.L., & Parasuraman, A. (1996). The Behavioral Consequences of Service Quality. Journal of Marketing, 60(2), 31‐46.
188

Zeithaml, V.A., Parasuraman, A., & Berry, L.L. (1985). Problems and Strategies in Services Marketing. The Journal of Marketing, 49(2), 33‐46.
189
APPENDIX 1. SURVEY INSTRUMENT
Welcome to the Åre Winter Customer Survey! This survey concerns your most recent stay in Åre during the winter season 2009/2010. We are interested in various aspects of your stay such as quality of skiing, accommodation and dining, other activities and services offered by the destination as well as your overall perception of Åre as a winter resort. This survey is held fully anonymously. 1. How many ski trips do you normally take? Less than every second year Once every second year Once a year Twice a year Three times a year Four times a year More than four times a year 2. How many times have you been to Åre in the winter before your recent visit in season 2009/2010? It was my first visit 1 time 2‐3 times 4‐5 times 6 times & more
190

3. Have you been to Åre during the summer? Never 1 time 2‐3 times 4‐5 times 6 times & more 4. For how long did you stay in Åre during your recent visit in 2009/2010 season? 1 day 2‐4 days 5‐7 days 8 days or more 5. In which time period did you visit Åre during the winter season 2009/2010? (You can choose more than 1 box) Week 51 (December 14‐20, 2009) Week 52 (December 21‐27, 2009) Week 53 (December 28, 2009 – January 3, 2010) Week 1 (January 4‐10, 2010) Week 2 (January 11‐17, 2010) Week 3 (January 18‐24, 2010) Week 4 (January 25‐31, 2010) Week 5 (February 1‐7, 2010) Week 6 (February 8‐14, 2010) Week 7 (February 15‐21, 2010) Week 8 (February 22‐28, 2010) Week 9 (March 1‐7, 2010) Week 10 (March 8‐14, 2010) Week 11 (March 15‐21, 2010) Week 12 (March 22‐28, 2010) Week 13 (March 29 – April 4, 2010) Week 14 (April 5‐11, 2010) Week 15 (April 12‐18, 2010) Week 16 (April 19‐25, 2010) Week 17 (April 26 – May 2, 2010)
191

6. How satisfied have you been with the following aspects of your stay in Åre? 1 – completely dissatisfied 2 – somewhat dissatisfied 3 – neither satisfied nor dissatisfied 4 – somewhat satisfied 5 – completely satisfied Skiing in Åre Snow reliability Number and variety of ski slopes Overall quality of alpine skiing Opportunities for off‐piste skiing Number and variety of cross‐country ski tracks Overall quality of cross‐country skiing Overall quality of snowboarding Åre Snow Park (e.g., jumps for kids, snowboard park etc.) Variety of activities for all interests and ages Safety in the ski area Easy skiing for children Floodlight skiing (e.g., in the evening) Value for money for the skiing experience Overall quality of skiing experience 7. How satisfied have you been with the following aspects of your stay in Åre? 1 – completely dissatisfied 2 – somewhat dissatisfied 3 – neither satisfied nor dissatisfied 4 – somewhat satisfied 5 – completely satisfied Winter sport services in Åre Transportation to the mountain area with the ski bus Transportation at the mountain area (e.g., ski lifts, chair lifts, cable cars) Rental of ski equipment Ski schools / skiing instruction Restaurants in the ski area Places to warm up and heat up your lunch at the ski area
192
8. How satisfied have you been with the following aspects of your stay in Åre? 1 – completely dissatisfied 2 – somewhat dissatisfied 3 – neither satisfied nor dissatisfied 4 – somewhat satisfied 5 – completely satisfied Other activities in Åre Other winter activities (e.g., ice skating, toboggan runs, dog sledding, snow‐scooter safari etc.) Indoor activities (e.g., bowling, mini‐golf, gym etc.) Spa and pool (e.g., HC Pool and Sauna World) After‐Ski Nightlife Sport events and competitions Sightseeing and attractions Shopping Overall value for money for other (i.e., non‐ski) activities 9. How satisfied have you been with the following aspects of your stay in Åre? 1 – completely dissatisfied 2 – somewhat dissatisfied 3 – neither satisfied nor dissatisfied 4 – somewhat satisfied 5 – completely satisfied Other services and features Accessibility of Åre from your home country Overall quality of accommodation (e.g., hotel, cabin, apartment) Service level of the staff in accommodation facilities Value for money for the accommodation Quality of food and beverages Service level of the staff in restaurants and bars Low‐budget options for dining (e.g., grocery stores, fast food) Value for money for food and beverage Local transportation (e.g., bus, taxi, etc.) Parking areas Tourist information (e.g., online and printed)
193

10. Do you agree or disagree with the following statements? 1 – strongly disagree 2 – disagree 3 – neither agree nor disagree 4 – agree 5 – strongly agree Åre environment Åre has a peaceful and restful atmosphere Åre is family‐friendly Åre is clean and tidy Åre is safe and secure Åre is a luxury winter resort Åre is a unique ski resort Åre has a beautiful architecture Åre is well planned (i.e., street layout is convenient, attractions are easily accessible etc.) Landscape and scenery are beautiful in Åre Åre is an environmentally‐friendly winter resort 11. Do you agree or disagree with the following statements? 1 – strongly disagree 2 – disagree 3 – neither agree nor disagree 4 – agree 5 – strongly agree Your overall experience of Åre Åre is a thrilling winter destination Åre offers various winter experiences Åre offers fun and excitement Åre brings you the joy of achievement Employees were friendly and professional I liked the behaviour of other tourists It was easy to interact and communicate with other tourists Local people were hospitable and friendly When I visit Åre, I always feel like I belong there
194

12. Do you agree or disagree with the following statements? 1 – strongly disagree 2 – disagree 3 – neither agree nor disagree 4 – agree 5 – strongly agree Information about Åre I see a lot of ads about Åre I often read about Åre in newspapers and magazines I often find information about Åre on the Internet I have heard about Åre from friends and relatives Many people know the Åre ski resort Åre is a famous site for international winter sports competitions Åre is known as one of the worldʹs top ski resorts Åre has a good reputation 13. Do you agree or disagree with the following statements? 1 – strongly disagree 2 – disagree 3 – neither agree nor disagree 4 – agree 5 – strongly agree Your overall satisfaction Compared to other skiing destinations, visiting Åre is good value for money Overall, Åre as a skiing destination has reasonable prices Overall, visiting Åre was the right decision Overall, visiting Åre was worth the time and effort spent I have really enjoyed visiting Åre this winter I am happy about my decision to visit Åre this winter Overall, I am satisfied with my winter holiday in Åre My expectations have been fulfilled My expectations have been exceeded
195

14. Do you agree or disagree with the following concluding statements? 1 – strongly disagree 2 – disagree 3 – neither agree nor disagree 4 – agree 5 – strongly agree Åre provides superior quality of experience as compared to any other ski resort I believe Åre provides more benefits than other ski resorts I feel better when I come to Åre I like Åre more than other ski destinations I would still come to Åre, even if it is more expensive than other ski resorts I will come back to Åre in winter within 2 years I consider Åre to be my first choice of a ski resort I will encourage friends and relatives to visit Åre in winter 15. How did you book your recent winter holiday in Åre in season 2009/2010? Skistar’s webpage Skistar Call Center Holiday Club’s webpage Holiday Club’s Call Center Travel agent Other 16. Which type of accommodation did you use? Hotel Cabin Apartment Other Day visit 17. Which mode of transportation did you use to come from your home to Åre? (You can choose more than 1 box) Flight Train Bus Car
196

18. Who accompanied you during your recent Åre winter holiday in season 2009/2010? (You can choose more than 1 box) I travelled alone Spouse / partner Travel group Friends Family 1 child 2 children More than 2 children I participated in a conference/seminar 19. Gender Female Male 20. Age up to 25 years old 26‐35 years old 36‐45 years old 46‐55 years old 56‐65 years old 66‐75 years old more than 75 years old 21. Which country are you from? Denmark Estonia Finland Germany Latvia Lithuania Netherlands Norway Poland Russia UK Other
197

22. Zip Code _________________________________ 23. What is the highest level of education that you have completed? Primary school Secondary school Vocational school / Technical training College graduate (e.g., BA or BS) Graduate school degree: Master or Doctorate degree Other If you have any other comments or concerns regarding your recent stay in Åre, please, do not hesitate to express them in the text box below: _____________________________________________________________________ _____________________________________________________________________ _____________________________________________________________________ _____________________________________________________________________ _____________________________________________________________________ _____________________________________________________________________ _____________________________________________________________________ _____________________________________________________________________ _____________________________________________________________________ _____________________________________________________________________ Thank you for your participation! Your responses have been successfully submitted.
198

199
APPENDIX 2. CORRELATION MATRIX (PILOT WINTER STUDY) LOY3 LOY2 LOY1 VFM2 VFM1 BEN4 BEN3 BEN2 BEN1 SOC3 SOC2 SOC1 INT5 INT4 INT3 INT2 INT1
LOY3 1.000 LOY2 0.679 1.000 LOY1 0.562 0.601 1.000 VFM2 0.510 0.501 0.559 1.000 VFM1 0.387 0.419 0.478 0.820 1.000 BEN4 0.452 0.514 0.581 0.564 0.494 1.000 BEN3 0.490 0.497 0.513 0.539 0.447 0.626 1.000 BEN2 0.471 0.443 0.574 0.552 0.464 0.658 0.788 1.000 BEN1 0.465 0.540 0.556 0.551 0.478 0.719 0.603 0.665 1.000 SOC3 0.255 0.252 0.366 0.438 0.413 0.327 0.405 0.382 0.329 1.000 SOC2 0.251 0.307 0.391 0.401 0.338 0.384 0.405 0.380 0.343 0.514 1.000 SOC1 0.251 0.293 0.394 0.423 0.406 0.372 0.450 0.417 0.419 0.558 0.488 1.000 INT5 0.301 0.317 0.395 0.404 0.369 0.399 0.394 0.410 0.410 0.362 0.302 0.341 1.000 INT4 0.196 0.196 0.327 0.349 0.355 0.302 0.315 0.345 0.352 0.415 0.291 0.354 0.425 1.000 INT3 0.235 0.218 0.374 0.425 0.421 0.329 0.345 0.383 0.347 0.419 0.355 0.403 0.464 0.724 1.000 INT2 0.286 0.263 0.389 0.379 0.347 0.309 0.356 0.379 0.296 0.424 0.322 0.339 0.416 0.625 0.728 1.000 INT1 0.208 0.281 0.326 0.276 0.321 0.319 0.308 0.306 0.266 0.394 0.443 0.393 0.332 0.464 0.555 0.600 1.000SER3 0.295 0.366 0.299 0.399 0.397 0.367 0.344 0.328 0.322 0.429 0.335 0.523 0.309 0.248 0.269 0.245 0.310SER2 0.192 0.220 0.287 0.331 0.364 0.307 0.310 0.282 0.289 0.452 0.353 0.587 0.288 0.223 0.260 0.222 0.286SER1 0.295 0.363 0.453 0.389 0.379 0.386 0.403 0.396 0.412 0.465 0.330 0.456 0.357 0.384 0.427 0.391 0.283SKI5 0.257 0.328 0.321 0.364 0.336 0.429 0.361 0.359 0.444 0.270 0.276 0.344 0.266 0.250 0.213 0.206 0.236SKI4 0.425 0.429 0.549 0.570 0.481 0.475 0.488 0.504 0.526 0.408 0.335 0.442 0.429 0.411 0.469 0.428 0.359SKI3 0.370 0.384 0.476 0.486 0.421 0.418 0.439 0.380 0.453 0.288 0.279 0.328 0.323 0.349 0.363 0.334 0.182SKI2 0.427 0.446 0.436 0.491 0.404 0.455 0.491 0.485 0.513 0.252 0.278 0.390 0.371 0.297 0.358 0.318 0.244SKI1 0.229 0.267 0.335 0.377 0.401 0.348 0.382 0.338 0.351 0.344 0.246 0.318 0.319 0.316 0.379 0.357 0.273AW4 0.298 0.283 0.351 0.300 0.267 0.316 0.270 0.279 0.283 0.172 0.284 0.239 0.175 0.052 0.126 0.098 0.168AW3 0.230 0.164 0.189 0.184 0.187 0.174 0.129 0.103 0.162 0.009 0.076 0.031 ‐0.001 ‐0.089 ‐0.040 ‐0.020 ‐0.060AW2 0.249 0.259 0.173 0.242 0.232 0.283 0.240 0.205 0.248 0.085 0.137 0.110 0.088 ‐0.080 ‐0.034 ‐0.052 ‐0.062AW1 0.255 0.230 0.171 0.277 0.286 0.268 0.201 0.165 0.227 0.055 0.110 0.074 0.107 ‐0.017 0.037 ‐0.009 ‐0.042

200
Correlation matrix (continues) SER3 SER2 SER1 SKI5 SKI4 SKI3 SKI2 SKI1 AW4 AW3 AW2 AW1
LOY3 LOY2 LOY1 VFM2 VFM1 BEN4 BEN3 BEN2 BEN1 SOC3 SOC2 SOC1 INT5 INT4 INT3 INT2 INT1 SER3 1.000 SER2 0.441 1.000 SER1 0.389 0.609 1.000 SKI5 0.292 0.251 0.235 1.000 SKI4 0.335 0.288 0.390 0.488 1.000 SKI3 0.171 0.174 0.245 0.431 0.676 1.000 SKI2 0.282 0.304 0.303 0.456 0.632 0.680 1.000 SKI1 0.211 0.200 0.273 0.331 0.557 0.536 0.439 1.000 AW4 0.129 0.244 0.204 0.252 0.221 0.273 0.371 0.108 1.000 AW3 ‐0.012 0.118 0.078 0.214 0.107 0.201 0.227 0.033 0.569 1.000 AW2 0.111 0.154 0.132 0.217 0.152 0.249 0.259 0.062 0.425 0.563 1.000 AW1 0.044 0.086 0.123 0.221 0.115 0.223 0.225 0.048 0.427 0.562 0.783 1.000