Embed Size (px)
Citation preview
American Journal of Analytical Chemistry, 2010, 1, 113-126 doi:10.4236/ajac.2010.13015 Published Online November 2010 (http://www.SciRP.org/journal/ajac)
Copyright © 2010 SciRes. AJAC
A Validated Stability-Indicating LC Method for Fluocinonide in the Presence of Degradation Products,
Its Process-Related Impurities and Identification of Degradation Products
Prabha Srinivasu1,2, Devarakonda V. SubbaRao1, Raju V. K. Vegesna1, K. Sudhakar Babu2 1Versapharm Incorporated, Warminister, USA
2Department of Chemistry, Sri Krishnadevaraya University, Anantapur, India E-mail: {sreenu_ind, drdvsubbarao}@yahoo.com
Received July 26, 2010; revised October 14, 2010; accepted October 27, 2010
Abstract The objective of the current study was to develop a validated, specific and stability-indicating reverse phase liquid chromatographic method for the quantitative determination of fluocinonide and its related substances. The determination was done for active pharmaceutical ingredient and its pharmaceutical dosage forms in the presence of degradation products, and its process-related impurities. The drug was subjected to stress condi- tions of hydrolysis (acid and base), oxidation, photolysis and thermal degradation per International Confer- ence on Harmonization (ICH) prescribed stress conditions to show the stability-indicating power of the method. Significant degradation was observed during acid, base hydrolysis, and peroxide degradation. The major degradants were identified by LC-MS, FTIR and 1H/13C NMR spectral analysis. The chromatographic conditions were optimized using an impurity-spiked solution and the samples generated from forced degra- dation studies. In the developed HPLC method, the resolution between fluocinonide and its process-related impurities, (namely imp-1, imp-2, imp-3, imp-4, imp-5, imp-6, imp-7 and imp-8) and its degradation products was found to be greater than 2.0. The chromatographic separation was achieved on a C18, 250 mm × 4.6 mm, 5 µm column. The LC method employed a linear gradient elution and the detection wavelength was set at 240 nm. The stress samples were assayed against a qualified reference standard and the mass balance was found to be close to 99.3%. The developed RP-LC method was validated with respect to linearity, accuracy, precision and robustness. Keywords: Fluocinonide, RP-LC, LC-MS, Forced Degradation, Validation, Stability-Indicating
1. Introduction Fluocinonide, pregna-1, 4-diene-3, 20-dione, 21-(acety- loxy)-6, 9-difluoro-11-hydroxy-16, 17-[(1-methylethyli- dene)bis(oxy)]-, (6α, 11β, 16α)-, is a potent glucorticoid steroid used topically as anti-inflammatory agent for the treatment of skin disorders such as eczema. It relieves itching, dryness, redness, crusting, scaling, inflammation and discomfort. Fluocinonide is a white or almost white crystalline powder. It is practically insoluble in water; slightly soluble in absolute ethanol. There are seven classes of topical corticosteroids ranked according to their potency based vasoconstrictor assays. Fluocinonide is a fluorinated, highly potent, corticosteroid. It ranks as
a “high-potency” (second-highest rank) topical cortico- steroid [1]. Corticosteroids have multiple actions, in-cludeing anti-inflammatory and anti-proliferative effects. When applied topically for at least one week, fluocinon- ide is effective in the treatment of inflammation and itching caused by a number of skin conditions such as allergic reactions, eczema and psoriasis. Minimal amounts should be used for a minimal length of time to avoid the occurrence of adverse effects. Fluocinonide is also used in veterinary medicine. It is used for treatment of aller-gies in dogs. Natural systemic cortisol concentrations can be suppressed for weeks after one week of topical expo-sure.
A chromatographic assay method has appeared in US
114 P. SRINIVASU ET AL.
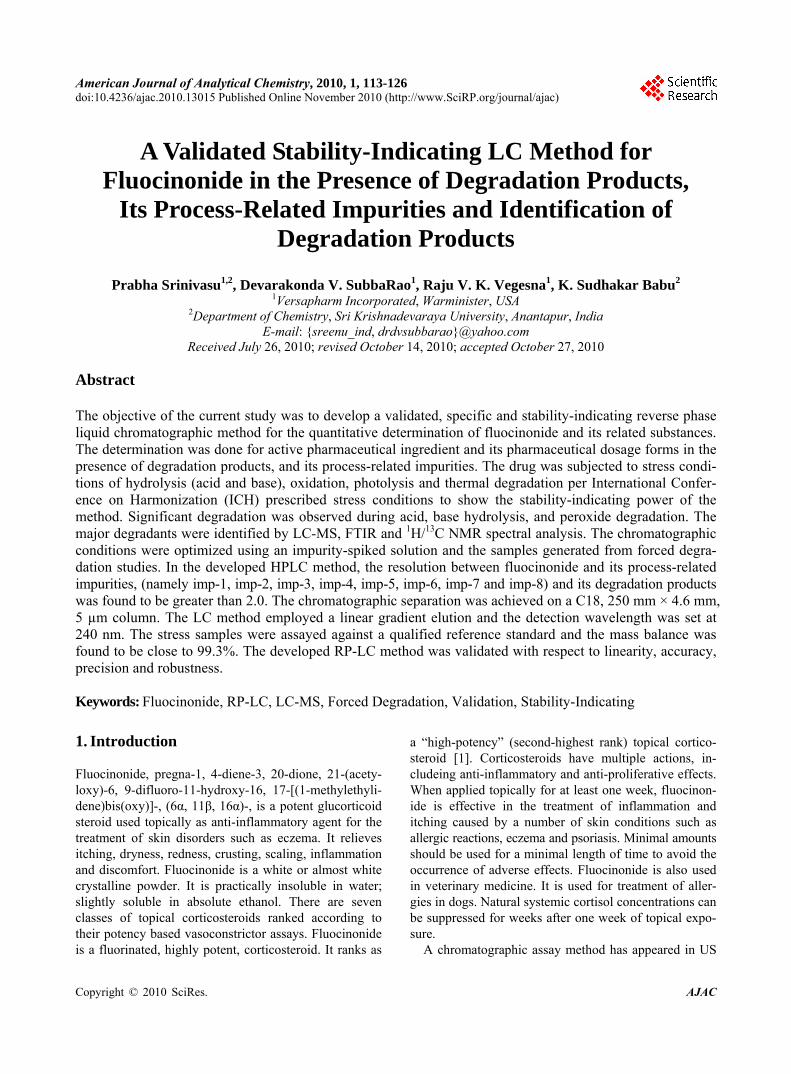
pharmacopeia for the quantification of fluocinonide in drug substance and its pharmaceutical topical dosage forms [2]. Few analytical methods were available in lit- erature for the quantification of fluocinonide and fluclo- cortisone acetate. Shek E. et al. has described an HPLC procedure to chromatograph fluocinonide as well as tri- amcinolone acetonide and diflorasone diacetate [3-6]. In addition, Shek E. et al. reported the stability indicating LC method for triple corticoid integrated system in a cream. [3] in which Shek. E. et al. described the quanti- fication of–fluocinonide, procinonide and ciprocinonide and expected the major degradation product under hy- drolytic conditions would be fluocinolone acetonide. Further study was not carried out to confirm this impu- rity. The present study was carried out to describe de- tailed degradation studies as per ICH guidelines and de- veloped a suitable LC method for the separation and es- timation of both process related impurities and degrada- tion impurities. Interestingly author observed two major degradation products in acid, base hydrolysis and perox- ide degradation of fluocinonide. The major degradation products of fluocinonide were isolated using preparative HPLC and structure elucidation was performed for the same using advanced spectral techniques such as NMR, LC-MS and IR. The purpose of the present research work was to develop a suitable single stability-indicating LC method for the determination of fluocinonide and its related substances and structure elucidation of major degradation products. The developed LC method was validated with respect to specificity, LOD, LOQ, linear- ity, precision, accuracy and robustness. Forced degrada- tion studies were performed on the drug substance and drug products to show the stability-indicating nature of the method [7-13]. These studies were performed in ac- cordance with established ICH guidelines [14-15]. 2. Experimental 2.1. Chemicals Samples of fluocinonide and its related impurities were received from Versapharm Incorporated, Warminister, PA, USA. (Figure 1). All of the impurities and the fluo- cinonide standard were of > 90% purity and are as fol- lows:-, fluocinonide (99.6%), imp-1 (95.9%), imp-2 (99.3%), imp-3 (93.7%), imp-4 (99.5%) imp-5 (96.7%), imp-6 (98.5%), imp-7 (97.8%) and imp-8 (99.2%). Commercially available fluocinonide ointment and fluo- cinonide solution (LIDEX) were purchased for this study. In addition, HPLC grade acetonitrile and methanol were purchased from Merck, (Darmstadt, Germany). Analyti- cal reagent grade sodium dihydrogen phosphate mono- hydrate, phosphoric acid and acetic acid were purchased
Fluocinonide
1
2
3
4
5
10
O 67
8
914
13
12
11
15
16
17
F
F
HO
19
18
20O
21
O
O
O
24
26
25
O
2223
(a) pregna-1, 4-diene-3, 20-dione, 21-(acetyloxy)-6, 9-difluoro-11- hydroxy-16, 17-[(1-methylethylidene)bis(oxy)]-, (6α, 11β, 16α)-. Mo- lecular weight: 494.52.
Imp-1
1
2
3
4
5
10
O6
7
8
914
13
12
11
15
16
17
F
F
HO
19
18
20O
21
OH
OH
OH
(b) pregna-1, 4-diene-3, 20-dione, -6, 9-difluoro-11, 16, 17, 21- tetrahydroxy-, (6α, 11β, 16α)-. Molecular weight: 412.42.
Imp-2
1
2
3
4
5
10
O 67
8
914
13
12
11
15
16
17
F
F
HO
19
18
20 O
21
OH
O
O
23
25
24
H3CO22
(c) pregna-1, 4-diene-3, 20-dione, -6, 9-difluoro-11, 21-dihydroxy- 21methoxy-16, 17-[(1-methylethylidene)bis(oxy)]-(6α, 11β, 16α) Mo- lecular weight: 482.51.
Copyright © 2010 SciRes. AJAC
P. SRINIVASU ET AL.
115
Imp-3
1
2
3
4
5
10
O6 7
8
914
13
12
11
15
16
17
F
F
HO
19
18
20 O
21
OH
O
O
22
24
23
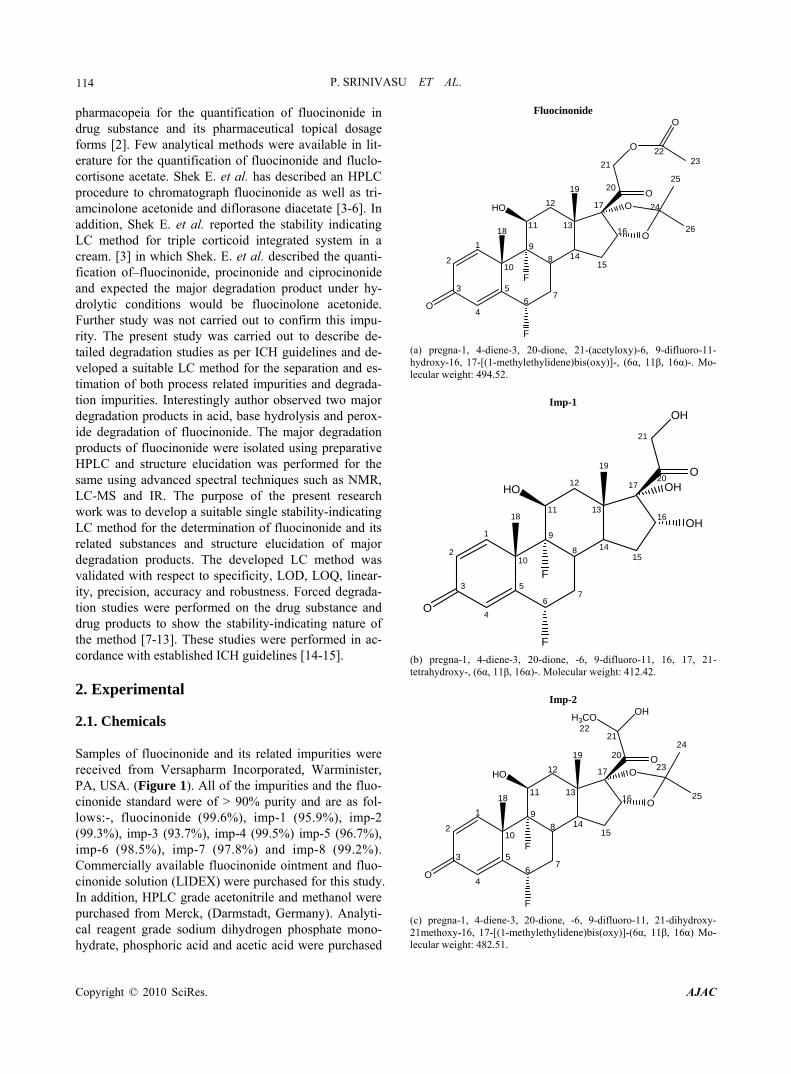
(d) pregna-1, 4-diene-3, 20-dione, -6, 9-difluoro-11, 21-dihydroxy-16, 17-[(1-methylethylidene)bis(oxy)]-, (6β, 11β, 16α)-. Molecular weight: 452.49.
Imp-4
1
2
3
4
5
10
O6 7
89 14
13
12
11
15
16
17
F
19
18
20 O
21
OH
O
O
22
24
23
O
(e) pregna-1, 4-diene-3, 20-dione, -6-fluoro-9, 11 epoxy, -21- hydroxy-16, 17-[(1-methylethylidene)bis(oxy)]-, (6α, 11β, 16α)-. Mo-lecular weight: 432.48.
Imp-5
1
2
3
4
5
10
O6 7
8
914
13
12
11
15
16
17
Cl
F
HO
19
18
20 O
21
OH
O
O
22
24
23
(f) pregna-1, 4-diene-3, 20-dione, -6 chloro, 9-fluoro-11, 21-dihydroxy- 16, 17-[(1-methylethylidene)bis(oxy)]-, (6α, 11β, 16α)-. Molecular weight: 468.94.
Imp-6
1
2
3
4
5
10
O 67
8
914
13
12
11
15
16
17
F
F
HO
19
18
20O
21
O
O
O
24
26
25
O
2223
(g) pregna-1, 4-diene-3, 20-dione, 21-(acetyloxy)-6, 9-difluoro-11- hydroxy-16, 17-[(1-methylethylidene)bis(oxy)]-, (6β, 11β, 16α)-. Mo-lecular weight: 494.52.
Imp-7
1
2
34
5
10
O6
7
8
914
13
12
11
15
16
17
F
HO
19
18
20O
21
O
O
O
24
26
25
O
2223
F (h) pregna-1, 4-diene-3, 20-dione, 21-(acetyloxy)-4, 9-difluoro-11- hydroxy-16, 17-[(1-methylethylidene)bis(oxy)]-, (4α, 11β, 16α)- Mo-lecular weight: 496.54.
Imp-8
1
2
3
4
5
10
O 67
8
914
13
12
11
15
16
17
Cl
F
HO
19
18
20O
21
O
O
O
24
26
25
O
(i) pregna-1, 4-diene-3, 20-dione, 21-(acetyloxy)-6-Chloro, 9-fluoro- 11-hydroxy-16, 17-[(1-methylethylidene)bis(oxy)]-, (6α, 11β, 16α)-. Mo- lecular weight: 510.18.
Copyright © 2010 SciRes. AJAC
116 P. SRINIVASU ET AL.
Degradation (Base degradation) impurity at RRT 0.54
1
2
3
4
5
10
O6
7
8
9
14
13
12
11
15
16
17
F
F
HO
19
18
20O
21
O
OH
OH
22
O
23
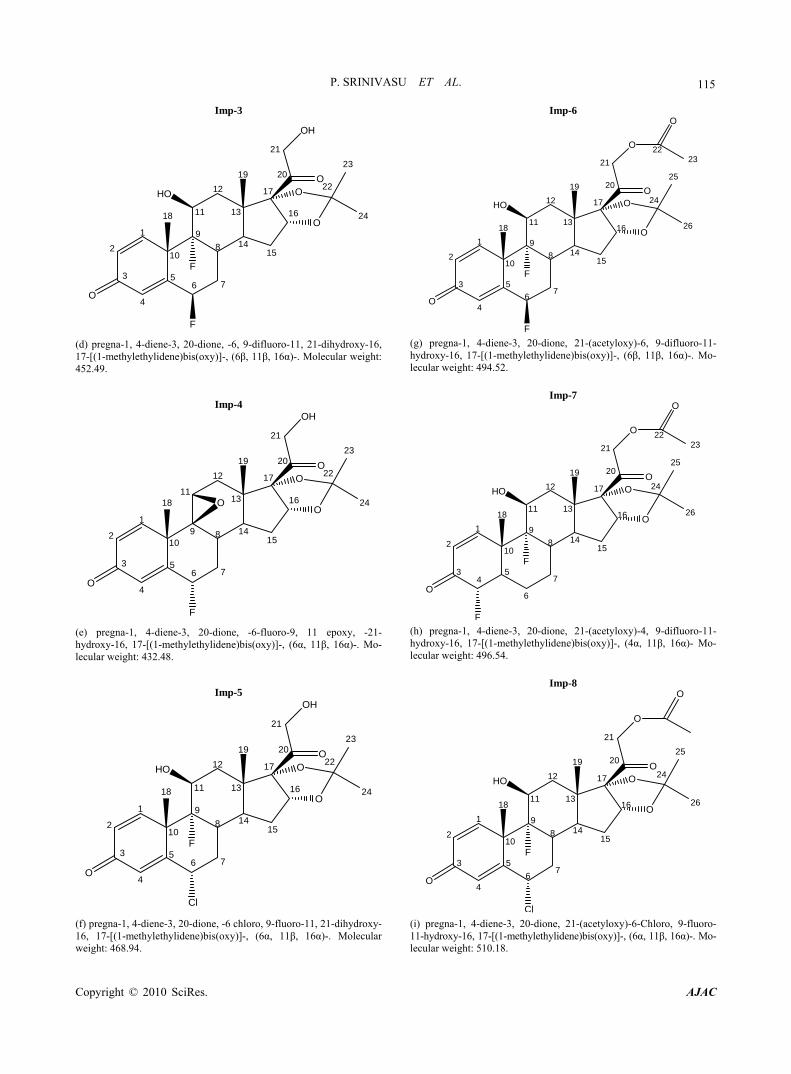
(j) Pregna-1, 4-diene-3, 20-dione, 21-(acetyloxy)-6, 9-difluoro-11, 16, 17-trihydroxy-(6α, 11β, 16α)- Molecular weight: 454.46.
Degradation (Acid and peroxide degradation) impurity at RRT 0.60
1
2
3
4
5
10
O 67
8
914
13
12
11
15
16
17
F
F
HO
19
18
20O
21
OH
O
O
22
23
24
(k) Pregna-1, 4-diene-3, 20-dione, 6, 9-difluoro-11, 21 dihydroxy-16, 17-[(1-Methylethylidene) bis (oxy)]-, (6α, 11β, 16α)- Molecular weight: 452.49.
Figure 1. Structures and names of fluocinonide and its im-purities. from Merck. Highly pure water was prepared with the Millipore Milli-Q Plus water purification system. 2.2. Equipment The LC system used for method development, forced degradation studies and method validation consisted of a Waters 2695 binary pump with an auto sampler and a 2996 photo diode array detector (PDA). The output sig- nal was monitored and processed using Empower soft- ware on a Pentium computer (Digital equipment Co.). Photo stability studies were carried out in a photo stabi- lity chamber (Sanyo, Leicestershire, UK). Thermal stabi- lity studies were carried out in a dry air oven (Lindberg- Blue, USA).
2.3. Chromatographic Conditions A Waters symmetry C18 250 mm × 4.6 mm, 5 µm col- umn was used with a mobile phase containing a gradient of solvents A and B. Solvent A was composed of water, with its pH adjusted to 3.0 with orthophosphoric acid. Water and acetonitrile in the ratio of 150:850 (v/v) was used as solvent B. The flow rate of the mobile phase was 1.0 ml/min with a gradient program of 0/40, 30/80, 35/80, 35.1/40 and 45/40 (time (min)/%B). The column tem- perature was maintained at 27°C and the detection wavelength was set at 240 nm. The injection volume was 20 μl. The diluent consisted of water and acetonitrile in a ratio of 50:50 (v/v). 2.4. LC-MS Conditions The LC-MS system (Agilent 1100 series liquid chroma- tography system coupled with a 6400 series triple quad- rapole mass spectrometer) was used for the identification of unknown compounds formed during forced degrada tion. A Waters symmetry C18 250 mm × 4.6 mm, 5 µm column was used as the stationary phase. Water, acetone- trile and acetic acid in a ratio of 60:40:1 (v/v/v) was used as the mobile phase. A mixture of water and acetonitrile in a 50:50 (v/v) ratio was used as the diluent. The flow rate was 1.0 ml/min. The analysis was performed in positive and negative electrospray ionization modes. The capillary and cone voltages were 3.5 kV and 25 V, re- spectively. The source and dissolvation temperatures were 120°C and 350°C, respectively and the dissolvation gas flow was 500 l h-1. 2.5. Preparation of Standard Solutions and
Sample Solutions A stock solution of fluocinonide (2.5 mg/ml) was pre- pared by dissolving the appropriate amount of fluoci- nonide solid in the diluent. Working solutions of 250 and 25 μg/ml were prepared from the stock solution for the determinations of related substances and assay respect- tively. A stock solution of impurity (mixture of imp-1, imp-2, imp-3, imp-4, imp-5, imp-6, imp-7 and imp-8) at 0.25 mg/ml was also prepared in the diluent.
Fluocinonide solution sample preparation: The solution (2.5 g) equivalent to 2.5 mg of drug was transferred into a 10 ml volumetric flask, and 2 ml of diluent was added. The flask was attached to a rotary shaker and shaken for 10 min to mix completely. The mixture was sonicated for 2 min and then diluted to the appropriate volume with diluent to make a solution containing 0.25 mg/ml. The solution was filtered through a 0.45 µ Nylon 66 mem-brane filter.
Copyright © 2010 SciRes. AJAC
P. SRINIVASU ET AL.
117
Fluocinonide ointment sample preparation: Sample (2.5 g ointment) equivalent to 2.5 mg of drug was trans- ferred into a 50 ml screw test tube, and 5 ml of diluent was added. The test tube was heated for 5 min at 65°C, cooled to room temperature, cyclomix for 2 min and re- peated the procedure once again, cool to room temp and added 5ml of diluent cyclomix for 3 min. The solution was filtered through a 0.45 µ Nylon 66 membrane filter. These solutions were used for the related substances es- timation of fluocinonide. For assay analysis 19-nore- thindrone was used as internal standard. 2.6. Stress Studies/Specificity Specificity is the ability of the method to measure the analyte response in the presence of its potential impuri- ties [14]. The specificity of the developed LC method for fluocinonide was determined in the presence of its impu- rities (namely imp-1, imp-2, imp-3, imp-4, imp-5, imp-6, imp-7 and imp-8) and degradation products. Forced deg- radation studies were also performed on fluocinonide to provide an indication of the stability- indicating property and specificity of the proposed method [7-12]. The stress conditions employed for the degradation study included light (carried out as per ICH Q1B), heat (60°C), acid hydrolysis (1M HCl), base hydrolysis (0.1M NaOH) and oxidation (5% H2O2). For heat and light studies, the samples were exposed for 10 days, whereas the samples were treated for 48 h for acid hydrolysis and for oxida- tion, 30 minutes for base hydrolysis. The peak purity of the fluocinonide stressed samples was checked by using a Waters 2996 photo diode array detector (PDA). The purity angle was within the purity threshold limit in all of the stressed samples, demonstrating the homogeneity of the analyte peak.
Assays were carried out for the stress samples against a qualified reference standard. The mass balance (% as- say + % of impurities + % of degradation products) was calculated for all of the samples. 2.7. Method Validation The proposed method was validated per ICH guide lines [14-15]. 2.7.1. Precision The precision of the related substance method was investi- gated by injecting six individual preparations of (250 μg/ml) fluocinonide spiked with 0.15% each of imp-1, imp-2, imp-3, imp-4, imp-5, imp-6, imp-7 and imp-8. The %RSD of the areas of each imp-1, imp-2, imp-3, imp-4, imp-5, imp-6, imp-7 and imp-8 was calculated.
The intermediate precision of the method was evalu-
ated using a different analyst and instrument located within the same laboratory.
The precision of the assay method was evaluated by carrying out six independent assays of a test sample of fluocinonide against a qualified reference standard. The %RSD of six obtained assay values was calculated. 2.7.2. Limit of Detection (LOD) and Limit of
Quantification (LOQ) The LOD and LOQ for imp-1, imp-2, imp-3, imp-4, imp-5, imp-6, imp-7 and imp-8 were estimated at a sig- nal-to-noise ratio of 3:1 and 10:1, respectively, by in- jecting a series of dilute solutions with known concentra- tions. The precision study was also carried at the LOQ level by injecting six individual preparations of imp-1, imp-2, imp-3, imp-4, imp-5, imp-6, imp-7 and imp-8 and calculating the %RSD of the areas. 2.7.3. Linearity Linearity test solutions for the assay method were pre- pared from a stock solution at five concentration levels from 50 to 150% of the assay analyte concentration (12.5, 20, 25, 30, and 37.5 μg/ml). The peak area versus con- centration data was analyzed with least-squares linear regression.
Linearity test solutions for the related substance method were prepared by diluting the impurity stock solution (2.5) to the required concentrations. The solu- tions were prepared at eight concentration levels from the LOQ to 150% of the specification level (LOQ, 0.05%, 0.10%, 0.15%, 0.20%, 0.25% and 0.3%). The slope and y-intercept of the calibration curve are reported. 2.7.4. Accuracy The accuracy of the assay method was evaluated in trip- licate at four concentration levels (LOQ, 12.5, 25 and 37.5 μg/ml), and the percentage recoveries were calcu- lated.
The drug substance did not show the presence of imp-1, imp-2, imp-3, imp-4, imp-5, imp-7 and imp-8, but contained 0.29% of imp-6. Standard addition and recov- ery experiments were conducted to determine the accu- racy of the related substance method for the quantifica- tion of all eight impurities (imp-1, imp-2, imp-3, imp-4, imp-5, imp-6, imp-7 and imp-8) in the drug substance as well as in the drug product. The study was carried out in triplicate at 0.075%, 0.15% and 0.225% of the analyte concentration (250 μg/ml). The percentage of recoveries for imp-1, imp-2, imp-3, imp-4, imp-5, imp-6, imp-7 and imp-8 were calculated. 2.7.5. Robustness To determine the robustness of the developed method,
Copyright © 2010 SciRes. AJAC
P. SRINIVASU ET AL.
Copyright © 2010 SciRes. AJAC
118
the experimental conditions were altered and the resolu- tion between fluocinonide and imp-1, imp-2, imp-3, imp-4, imp-5, imp-6, imp-7 and imp-8 was evaluated. The flow rate of the mobile phase was 1.0 ml/min. To study the effect of the flow rate on the resolution, the flow rate was changed by 0.1 units (0.9 and 1.1 ml/min). The effect of pH on the resolution of the impurities was studied by varying the pH by ± 0.1 units (buffer pH of 2.9 and 3.1). The effect of the column temperature on the resolution was studied at 22°C and 32°C instead of 27°C. In all these varied conditions, the components of the mo- bile phase remained constant, as outlined in Subsection 2.3. 2.7.6. Solution Stability and Mobile Phase Stability The solution stability of fluocinonide in the assay method was carried out by leaving both the sample and reference standard solutions in tightly capped volumetric flasks at room temperature for 48h. The same sample solutions were assayed for in 6h intervals over the study period. The mobile phase stability was also examined by assaying the freshly prepared sample solutions against freshly prepared reference standard solutions for 6h in- tervals up to 48h. The prepared mobile phase remained constant during the study period. The %RSD of the fluo- cinonide assay was calculated for the mobile phase and solution stability experiments.
The solution stability of fluocinonide and its impuri- ties in the related substance method was carried out by leaving a spiked sample solution in a tightly capped volumetric flask at room temperature for 48h. The con-
tent of imp-1, imp-2, imp-3, imp-4, imp-5, imp-6, imp-7 and imp-8 was determined at 6h intervals up to the study period.
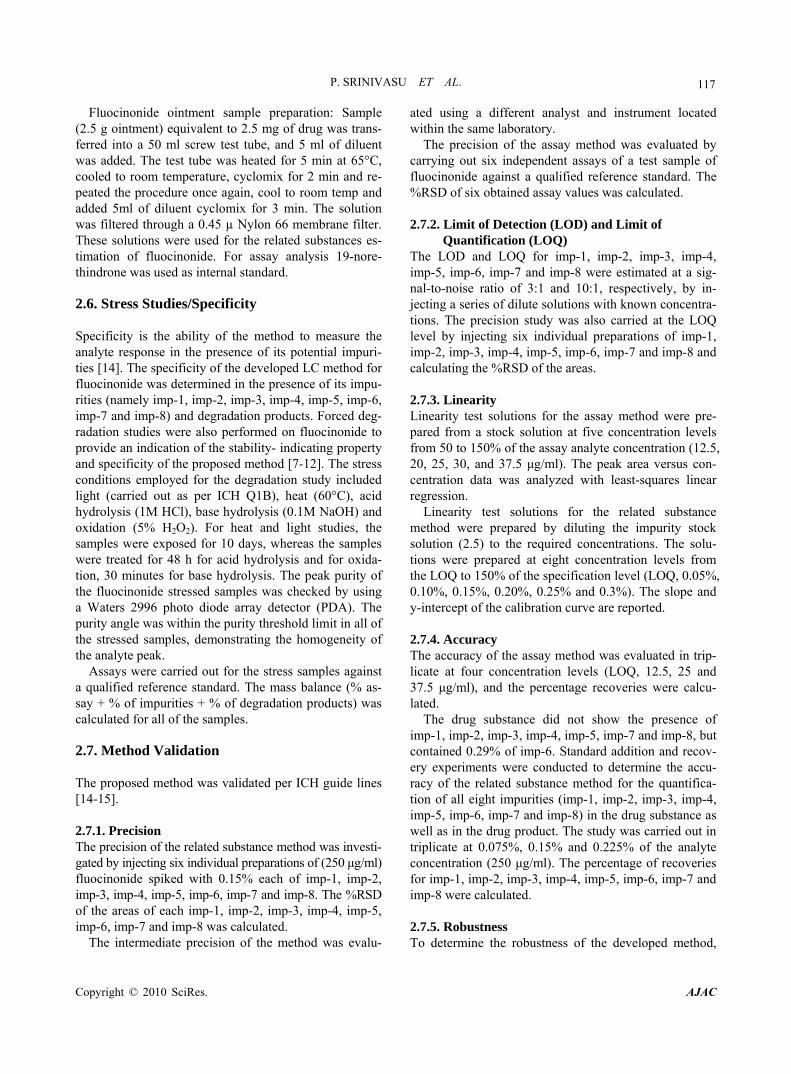
The mobile phase stability was also investigated for 48h by injecting the freshly prepared sample solutions for every 6h interval. The content of imp-1, imp-2, imp-3, imp-4, imp-5, imp-6, imp-7 and imp-8 was determined in the test solutions. The prepared mobile phase remained constant during the study period. 3. Results and Discussion 3.1. Method Development and Optimization All the impurities and fluocinonide solutions were pre- pared in diluent at a concentration of 10 ppm and scanned in UV-visible spectrophotometer; all the eight impurities and fluocinonide had a UV maxima at around 240 nm (Figure 2). Hence detection at 240 nm was se- lected for method development purpose.
The main objective of the chromatographic method was to separate imp-1, imp-2, imp-3, imp-4, imp-5, imp-6, imp-7, imp-8 and the generated degradation products from the analyte peak during stress studies. Impurities and degradation products were co-eluted by using different stationary phases, such as C8, cyano and phenyl with various mobile phases with buffers, such as phosphate and acetate with different pH values (3-7), and organic modifiers, including acetonitrile and methanol.
United States Pharmacopeia stated LC method for the
Fluocinonide imp-1 imp-2 imp-3 imp-4 imp-5 imp-6 imp-7 imp-8
Figure 2. Typical spectrums of fluocinonide and its impurities.
P. SRINIVASU ET AL.
Copyright © 2010 SciRes. AJAC
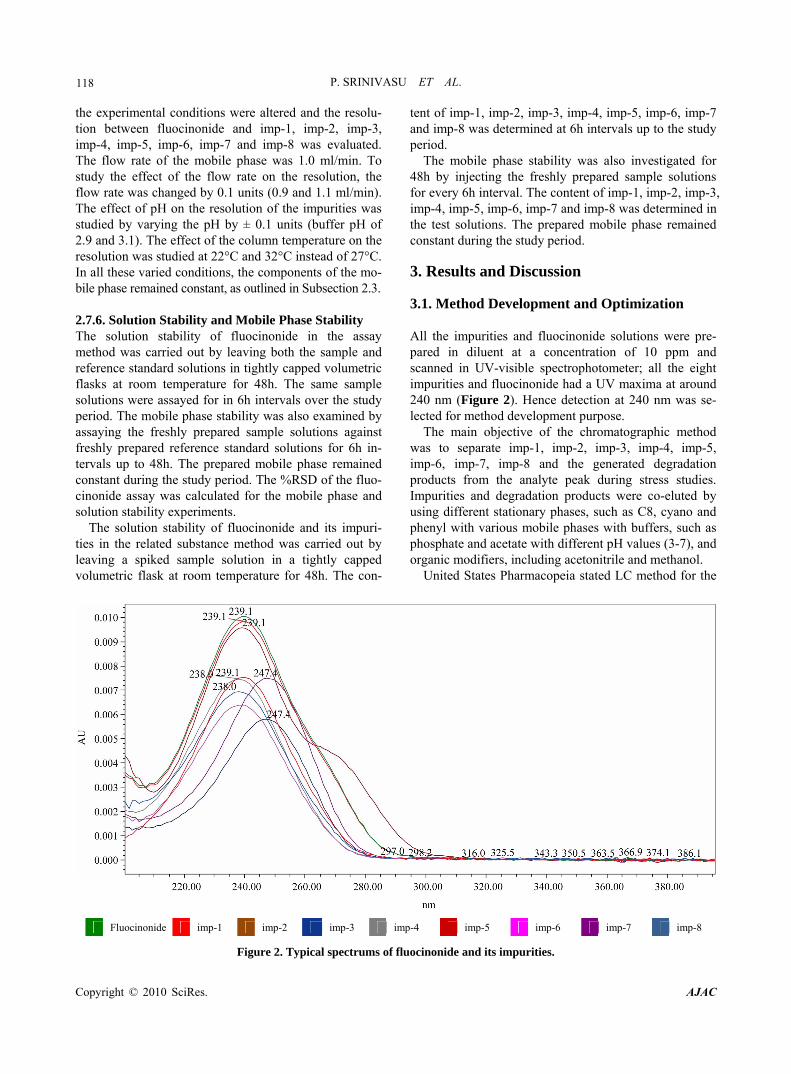
119 estimation of related substances of fluocinonide for drug substance [2]. Hence this was chosen as initial experi- ment. The method consists of water and acetonitrile (50:50, v/v) as mobile phase at a flow rate of 2.0 ml/min with Waters bonda pack 300 mm × 3.9 mm ID column and 10 µm particle size C18 stationary phase. When an impurity spiked solution of fluocinonide was injected. Imp-1 and Imp-2 were eluted at void with retention times of 0.8 and 1.3, imp-6 and imp-7 were co eluted (Figure 3). In acid degradation sample the resolution between one of the major degradant and imp-3 was very less (Rs < 1.2). To improve the resolution between impurities and retention of imp-1 and imp-2, particle size of the column was decreased to 5 µm and flow rate was decreased to 1.0 ml/min and injected the impurity spiked solution. The resolution between Imp-6 and imp-7 was slightly
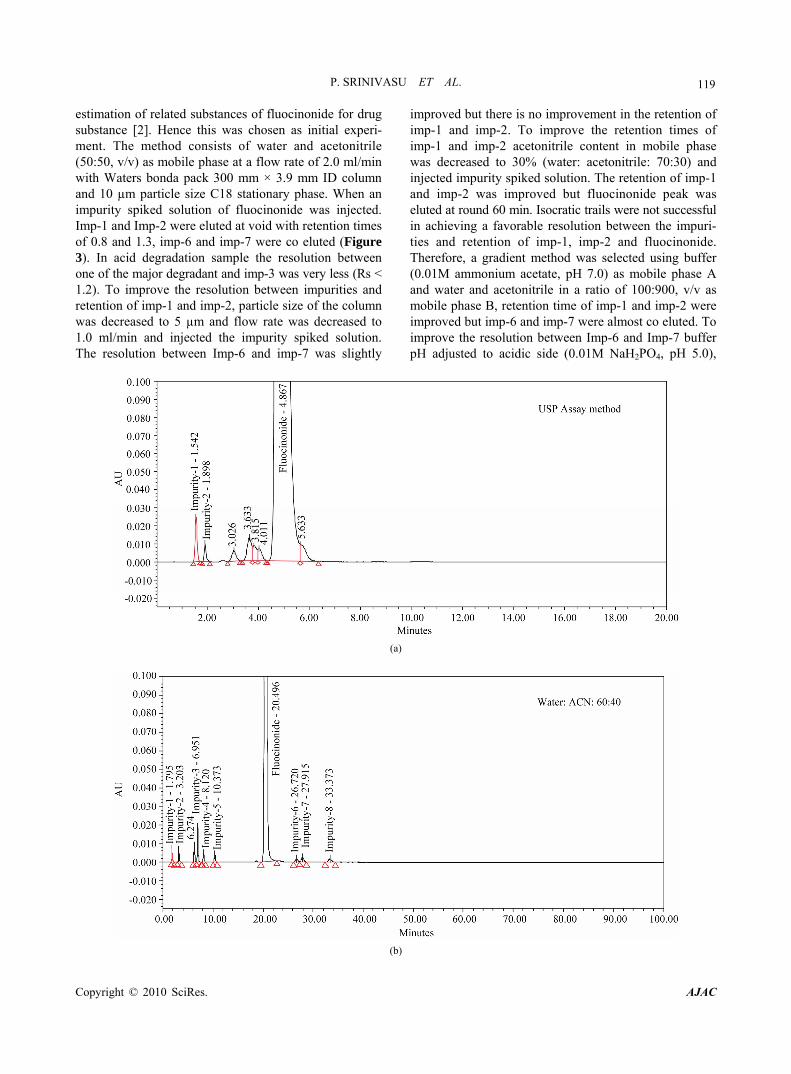
improved but there is no improvement in the retention of imp-1 and imp-2. To improve the retention times of imp-1 and imp-2 acetonitrile content in mobile phase was decreased to 30% (water: acetonitrile: 70:30) and injected impurity spiked solution. The retention of imp-1 and imp-2 was improved but fluocinonide peak was eluted at round 60 min. Isocratic trails were not successful in achieving a favorable resolution between the impuri- ties and retention of imp-1, imp-2 and fluocinonide. Therefore, a gradient method was selected using buffer (0.01M ammonium acetate, pH 7.0) as mobile phase A and water and acetonitrile in a ratio of 100:900, v/v as mobile phase B, retention time of imp-1 and imp-2 were improved but imp-6 and imp-7 were almost co eluted. To improve the resolution between Imp-6 and Imp-7 buffer pH adjusted to acidic side (0.01M NaH2PO4, pH 5.0),
(a)
(b)
120 P. SRINIVASU ET AL.
(c)
(d)
(e)
Copyright © 2010 SciRes. AJAC
P. SRINIVASU ET AL.
121
(f)
(g)
(h)
Copyright © 2010 SciRes. AJAC
P. SRINIVASU ET AL.
Copyright © 2010 SciRes. AJAC
122
(i)
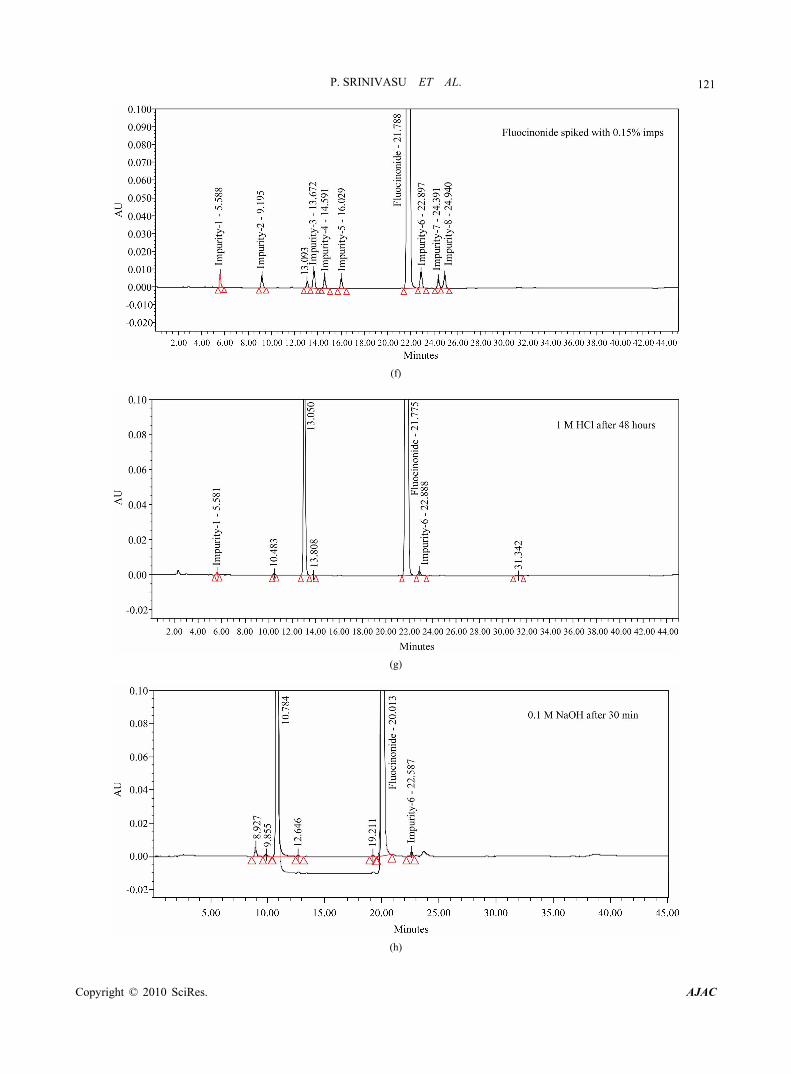
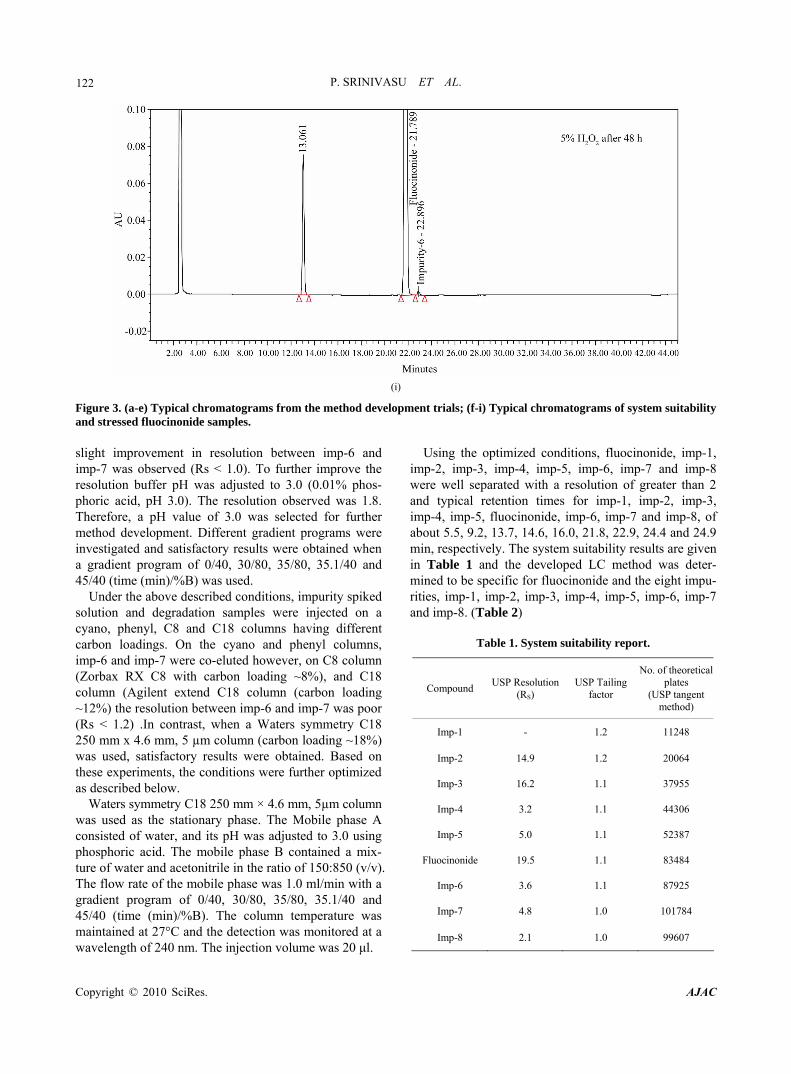
Figure 3. (a-e) Typical chromatograms from the method development trials; (f-i) Typical chromatograms of system suitability and stressed fluocinonide samples.
Using the optimized conditions, fluocinonide, imp-1, imp-2, imp-3, imp-4, imp-5, imp-6, imp-7 and imp-8 were well separated with a resolution of greater than 2 and typical retention times for imp-1, imp-2, imp-3, imp-4, imp-5, fluocinonide, imp-6, imp-7 and imp-8, of about 5.5, 9.2, 13.7, 14.6, 16.0, 21.8, 22.9, 24.4 and 24.9 min, respectively. The system suitability results are given in Table 1 and the developed LC method was deter- mined to be specific for fluocinonide and the eight impu- rities, imp-1, imp-2, imp-3, imp-4, imp-5, imp-6, imp-7 and imp-8. (Table 2)
slight improvement in resolution between imp-6 and imp-7 was observed (Rs < 1.0). To further improve the resolution buffer pH was adjusted to 3.0 (0.01% phos- phoric acid, pH 3.0). The resolution observed was 1.8. Therefore, a pH value of 3.0 was selected for further method development. Different gradient programs were investigated and satisfactory results were obtained when a gradient program of 0/40, 30/80, 35/80, 35.1/40 and 45/40 (time (min)/%B) was used.
Under the above described conditions, impurity spiked solution and degradation samples were injected on a cyano, phenyl, C8 and C18 columns having different carbon loadings. On the cyano and phenyl columns, imp-6 and imp-7 were co-eluted however, on C8 column (Zorbax RX C8 with carbon loading ~8%), and C18 column (Agilent extend C18 column (carbon loading ~12%) the resolution between imp-6 and imp-7 was poor (Rs < 1.2) .In contrast, when a Waters symmetry C18 250 mm x 4.6 mm, 5 µm column (carbon loading ~18%) was used, satisfactory results were obtained. Based on these experiments, the conditions were further optimized as described below.
Table 1. System suitability report.
Compound USP Resolution
(RS) USP Tailing
factor
No. of theoretical plates
(USP tangent method)
Imp-1 - 1.2 11248
Imp-2 14.9 1.2 20064
Imp-3 16.2 1.1 37955
Imp-4 3.2 1.1 44306
Imp-5 5.0 1.1 52387
Fluocinonide 19.5 1.1 83484
Imp-6 3.6 1.1 87925
Imp-7 4.8 1.0 101784
Imp-8 2.1 1.0 99607
Waters symmetry C18 250 mm × 4.6 mm, 5µm column was used as the stationary phase. The Mobile phase A consisted of water, and its pH was adjusted to 3.0 using phosphoric acid. The mobile phase B contained a mix- ture of water and acetonitrile in the ratio of 150:850 (v/v). The flow rate of the mobile phase was 1.0 ml/min with a gradient program of 0/40, 30/80, 35/80, 35.1/40 and 45/40 (time (min)/%B). The column temperature was maintained at 27°C and the detection was monitored at a wavelength of 240 nm. The injection volume was 20 μl.
P. SRINIVASU ET AL.
Copyright © 2010 SciRes. AJAC
123
Table 2. Summary of forced degradation results.
Stress condition Time % Assay of
active substance
Mass balance (%assay + %impurities + % degra-
dation products) Remarks
Acid hydrolysis (1 M HCl)
48 h 86.5 99.4 One major degradation product was formed.
Base hydrolysis (0.1 M NaOH) 30 min 74.7 99.3 One major degradation product was formed.
Oxidation (5% H2O2) 48 h 90.8 99.3 One major degradation product was formed.
Thermal (60°C) 10 days 99.3 99.8 No degradation products formed
Light (photolytic degradation) 10 days 99.2 99.7 No degradation products formed
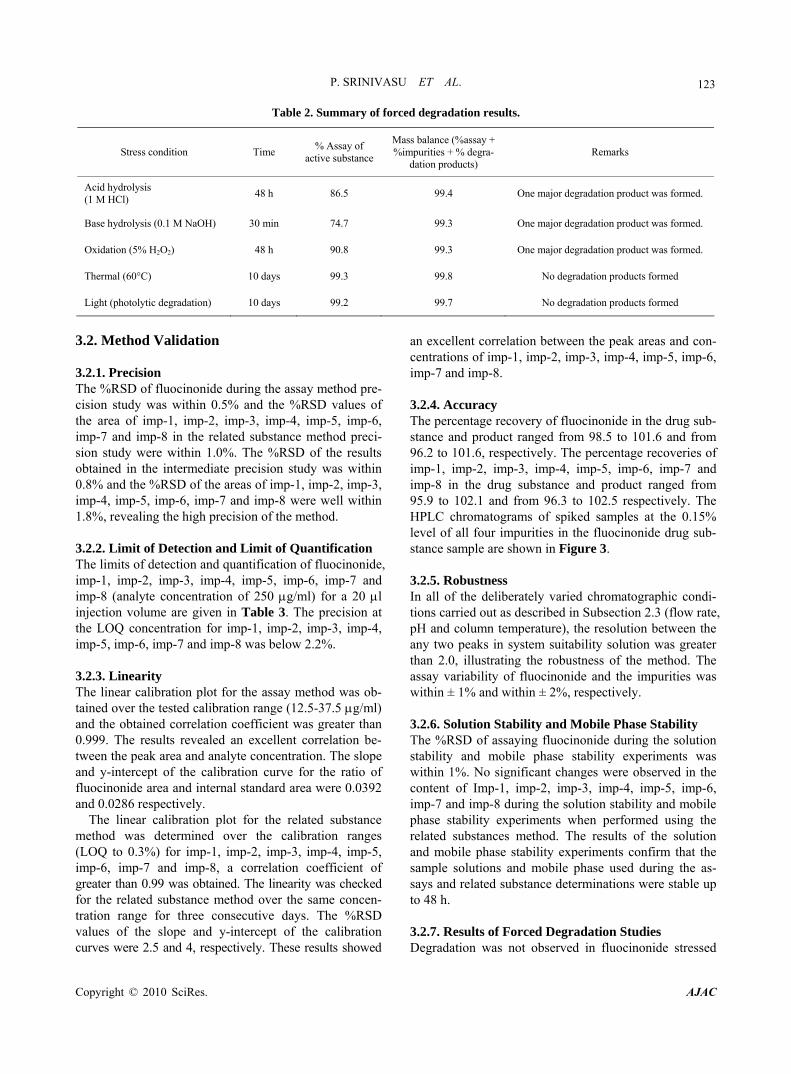
3.2. Method Validation 3.2.1. Precision The %RSD of fluocinonide during the assay method pre- cision study was within 0.5% and the %RSD values of the area of imp-1, imp-2, imp-3, imp-4, imp-5, imp-6, imp-7 and imp-8 in the related substance method preci- sion study were within 1.0%. The %RSD of the results obtained in the intermediate precision study was within 0.8% and the %RSD of the areas of imp-1, imp-2, imp-3, imp-4, imp-5, imp-6, imp-7 and imp-8 were well within 1.8%, revealing the high precision of the method. 3.2.2. Limit of Detection and Limit of Quantification The limits of detection and quantification of fluocinonide, imp-1, imp-2, imp-3, imp-4, imp-5, imp-6, imp-7 and imp-8 (analyte concentration of 250 g/ml) for a 20 l injection volume are given in Table 3. The precision at the LOQ concentration for imp-1, imp-2, imp-3, imp-4, imp-5, imp-6, imp-7 and imp-8 was below 2.2%. 3.2.3. Linearity The linear calibration plot for the assay method was ob- tained over the tested calibration range (12.5-37.5 g/ml) and the obtained correlation coefficient was greater than 0.999. The results revealed an excellent correlation be- tween the peak area and analyte concentration. The slope and y-intercept of the calibration curve for the ratio of fluocinonide area and internal standard area were 0.0392 and 0.0286 respectively.
The linear calibration plot for the related substance method was determined over the calibration ranges (LOQ to 0.3%) for imp-1, imp-2, imp-3, imp-4, imp-5, imp-6, imp-7 and imp-8, a correlation coefficient of greater than 0.99 was obtained. The linearity was checked for the related substance method over the same concen-tration range for three consecutive days. The %RSD values of the slope and y-intercept of the calibration curves were 2.5 and 4, respectively. These results showed
an excellent correlation between the peak areas and con-centrations of imp-1, imp-2, imp-3, imp-4, imp-5, imp-6, imp-7 and imp-8. 3.2.4. Accuracy The percentage recovery of fluocinonide in the drug sub- stance and product ranged from 98.5 to 101.6 and from 96.2 to 101.6, respectively. The percentage recoveries of imp-1, imp-2, imp-3, imp-4, imp-5, imp-6, imp-7 and imp-8 in the drug substance and product ranged from 95.9 to 102.1 and from 96.3 to 102.5 respectively. The HPLC chromatograms of spiked samples at the 0.15% level of all four impurities in the fluocinonide drug sub-stance sample are shown in Figure 3. 3.2.5. Robustness In all of the deliberately varied chromatographic condi- tions carried out as described in Subsection 2.3 (flow rate, pH and column temperature), the resolution between the any two peaks in system suitability solution was greater than 2.0, illustrating the robustness of the method. The assay variability of fluocinonide and the impurities was within ± 1% and within ± 2%, respectively. 3.2.6. Solution Stability and Mobile Phase Stability The %RSD of assaying fluocinonide during the solution stability and mobile phase stability experiments was within 1%. No significant changes were observed in the content of Imp-1, imp-2, imp-3, imp-4, imp-5, imp-6, imp-7 and imp-8 during the solution stability and mobile phase stability experiments when performed using the related substances method. The results of the solution and mobile phase stability experiments confirm that the sample solutions and mobile phase used during the as-says and related substance determinations were stable up to 48 h. 3.2.7. Results of Forced Degradation Studies Degradation was not observed in fluocinonide stressed
124 P. SRINIVASU ET AL.
Table 3. 1H-NMR and 13C-NMR assignments for fluocinonide and its degradation impurities.
Position Impurity at RRT 0.54 (Base Deg imp) Impurity at RRT 0.60 (Acid Deg imp) Fluocinonide
δ C δ H(J/HZ) δ C δ H(J/HZ) δ C δ H(J/HZ)
1 154.5 7.1(1H,d, 10) 155.4 7.15(1H,d,10) 155.9 7.2(1H,d,10)
2 128.8 6.3(1H,dd,10,1.5) 128.4 6.4(1H,dd,10,1.4) 127.8 6.4(1H,dd,10,1.4)
3 184.6 - 185.5 - 184.1 -
4 123.5 6.15(1H,s) 124.1 6.5(1H,s) 124.9 6.5(1H,s)
5 163.4 - 163.8 - 163.1 -
6 87.1 5.4(1H,dd) 87.5 5.4(1H,dd) 87.8 5.4(1H,dd)
7 34.2 1.58(2H,m) 33.7 1.58(2H,m) 34.4 1.58(2H,m)
8 31.5 1.68(1H,m) 32.3 1.68(1H,m) 32.3 1.67(1H,m)
9 101.5 - 100.7 - 100.9 -
10 47.4 - 47.9 - 47.9 -
11 70.1 4.45(1H,m) 70.9 4.45(1H,m) 70.1 4.45(1H,m)
12 33.9 1.63(2H,m) 33.5 1.63(2H,m) 33.6 1.63(2H,m)
13 36.1 - 36.6 - 36. 8 -
14 36.5 1.4(1H,m) 37.2 1.4(1H,m) 37.7 1.4(1H,m)
15 26.9 1.75(2H,m) 26 1.75(2H,m) 27 1.75(2H,m)
16 74.1 4.76(1H,m) 81.5 4.91(1H,m) 80.5 4.90(1H,m)
17 103.1 - 96.8 - 96.5 -
18 18.1 0.9(3H,s) 18.5 0.9(3H,s) 18.4 0.9(3H,s)
19 15.6 1.5(3H,s) 14.2 1.5(3H,s) 14.1 1.5(3H,s)
20 212.9 - 211.5 - 211.8 -
21 65.4 4.95(2H,s) 64.1 4.20,4.70(dd, 2H,19,6) 64.8 4.85(2H,s)
22 170.5 - 108.6 - 171.2 -
23 20.8 2.2(3H,s) 26.6 1.25(3H,s) 26.6 2.1(3H,s)
24 26.6 1.45(3H,s) 170.1 -
25 - - - - 26.2 1.20(3H,s)
26 - - - - 26.2 1.42(3H,s)
11-OH - 5.27(H,bd) - 5.29(1H,bd) - 5.25(1H,bd)
16-OH - 4.65(1H,d,6) - - -
17-OH - 4.85(1H,s) -
21-OH - - - 4.95(1H,t,6) - -
Copyright © 2010 SciRes. AJAC
P. SRINIVASU ET AL.
Copyright © 2010 SciRes. AJAC
125 samples subjected to light and heat. Significant degrada- tion of the drug substance and product was detected un- der acid, base hydrolysis and peroxide degradation, leading to the formation of two major unknown degrada- tion products one is at 0.54 RRT (due to base hydrolysis) and another one is at 0.60 RRT (due to acid hydrolysis and peroxide degradation) (Figure 1). Fluocinonide is very sensitive towards base compared to acid and perox- ide, within 30 minutes fluocinonide degraded 25% to an unknown impurity at RRT 0.54. Peak purity test results derived from the PDA detector, confirmed that the fluo- cinonide peak and the degraded peaks were homogene- ous and pure in all of the analyzed stress samples. Assay studies were carried out for the stress samples against a qualified reference standard of fluocinonide.
The mass balance of the stressed samples was close to 99.3%. The assay of fluocinonide was unaffected in the presence of imp-1, imp-2, imp-3, imp-4, imp-5, imp-6, imp-7, imp-8and its degradation products, confirming the stability- indicating power of the developed method. 3.2.8. Identification of Major Degradation Products
Formed in Acid Hydrolysis, Peroxide Degradation (RRT ~0.60) and Base Hydrolysis (RRT ~0.54).
Degradation product in acid hydrolysis ( RRT ~0.60) and base hydrolysis (RRT ~0.54) were isolated using a Shi- madzu LC-8A preparative liquid chromatograph equipped with SPD-10A VP, PDA detector (Shimadzu corporation, Japan), Symmetry C18 (250 mm long × 19 mm i.d) preparative column packed with 7 micron particle size (Waters, USA). A mixture of water and acetonitrile in a 50:50 (v/v) ratio was used as the mobile phase. The flow rate was 10 ml/min. The detection was carried out at 240 nm, Injection volume is 10 ml. Peak cut criteria was set based on peak retention time. Fractions > 95% purity were pooled together and concentrated by rotavapour to remove solvents. Concentrated fraction was passed through the preparative HPLC column again, the elute was concentrated using rotavapour to remove solvents then lyophilized using freeze dryer to obtain a white powder with > 98% purity. 3.2.9. Structure Elucidation of Degradation Impurity
at RRT ~0.54 A LCMS study was carried to determine the m/z value of the major degradation product formed under base hy- drolysis using an Agilent 1100 series liquid chromatog- raphy system coupled with a 6400 series triple quad- rapole mass spectrometer. The volatile mobile phase contained water, acetonitrile and acetic acid in a ratio of 60:40:1 (v/v/v) and the conditions were described in sec- tion 2.4. The molecular ion peak m/z value obtained for
the degradation product resolving at 0.54 RRT is 455 [(MH)] +, in ESI positive mode corresponding to a mo- lecular weights of 454.
In 1H-NMR and 13C-NMR spectra of new impurity shows chemical shift similarity with fluocinonide, except signals corresponding to C-16 and C-17. In 13C-NMR C-16 and C-17 carbons resonated at δ 74.1 ppm and δ 103.1 ppm respectively (where as C-16 and C-17 carbons in fluocinonide at δ 80.5 ppm and 96.5 ppm). In addition, the hydroxyl groups on C-16 and C-17 resonated as dou- blet at 4.65 ppm and as a singlet at 4.85 ppm respectively. Comparative 1H-NMR and 13C-NMR spectral data for fluocinonide and RRT ~0.54 is given in Table 3.
The IR Spectra performed on dispersion KBr of RRT ~0.54 degradant show the following absorption bands 3415, 3398 ~(broad, OH Stretching) when compared to fluocinonide IR spectrum, a broad signal with a small splitting(doublet) was observed in the region of 3200- 3500 which is a clear indication of 2 additional –OH groups, 2950-2850 (CH,CH2 and CH3 Stretching) 1720 (C = O Saturated keto group), 1660 (C = O Conjugation) 1630 and 1610 (C = C Stretching)
The elemental analysis data calculated for C23H28F2O7 (454.46): C, 60.79; H, 6.21; F, 8.36; O, 24.64 and found: C, 60.74; H, 6.18. From the above spectral data the deg-radation impurity at RRT~0.54 was confirmed as pregna-1, 4-diene-3, 20-dione, 21-(acetyloxy)-6, 9-di- fluoro-11, 16, 17-trihydroxy-(6α, 11β, 16α)-. 3.2.10. Structure Elucidation of Degradation
Impurity at RRT ~0.60 A LCMS study was carried to determine the m/z value of the major degradation product formed under acid hy- drolysis using an Agilent 1100 series liquid chromatog- raphy system coupled with a 6400 series triple quad- rapole mass spectrometer. The volatile mobile phase contained water, acetonitrile and acetic acid in a ratio of 60:40:1 (v/v/v) and the conditions were described in sec- tion 2.4. The molecular ion peak m/z value obtained for the degradation product resolving at 0.60 RRT is 454 [(MH)]+, in ESI positive mode corresponding to a mo- lecular weights of 452.5.
In 1H-NMR and 13C-NMR spectra of new impurity shows chemical shift similarity with fluocinonide, except signals corresponding to C-21. In 1H-NMR the two pro- tons on C-21 resonated as doublet of doublet at 4.20 & 4.70 ppm (J = 19 and 6 HZ) and the corresponding hy- droxyl proton as triplet (which is a double doublet and appearing as triplet because of masking effect) at 4.95 ppm. Comparative 1H-NMR and 13C-NMR spectral data for fluocinonide and RRT ~0.60 is given in Table 3.
The IR Spectra performed on dispersion KBr of RRT ~0.60 degradant show the following absorption bands
126 P. SRINIVASU ET AL.
~3500 (broad OH Stretching), 2950-2850 (CH, CH2 and CH3 Stretching) 1720 (C = O Saturated keto group), 1660 (C = O Conjugation) 1630 and 1610 (C = C Stretching)
The elemental analysis data calculated for C24H30F2O6 (452.49): C, 63.70; H, 6.68; F, 8.4; O, 21.22 and found: C, 63.74; H, 6.64. From the above spectral data the degradation impurity at RRT ~0.60 was confirmed as pregna-1, 4-diene-3, 20-dione, 6, 9-difluoro-11, 21 dihy- droxy-16, 17-[(1-methylethylidene) bis(oxy)]-, (6α, 11β, 16α)-. 4. Conclusions In this paper, a sensitive, specific, accurate, validated and well-defined stability indicating LC method for the de- termination of fluocinonide in the presence of degrada- tion products and its process-related impurities was de- scribed. The behavior of fluocinonide under various stress conditions was studied, and the hydrolysis (acid and base) degradants were identified by LCMS and other spectral analysis presented. All of the degradation prod- ucts and process impurities were well separated from the drug substance and drug product demonstrates the stabil- ity-indicating power of the method. The information presented in this study could be very useful for quality monitoring of drug substance and its dosage forms and be used to check drug quality during stability studies. 5. Acknowledgements The authors wish to thank the management of Ver- sapharm Incorporated for supporting this work. They also thank Mr. Naresh Chintalapati, Mr. Ramalingaraju Gadiraju, Dr. Ramanujachary Kandalam, Dr. Vijay Krishna Kari, Dr. Rajendra Prasad Kalakodimi and Dr. Sivaku-mar Vasireddy for their technical support in carrying out this work. 6. References [1] R. D. Zenoble and R. J. Kemppainen, “Adrenocortical
Suppression by Topically Applied Corticosteroids in Healthy Dogs,” Journal of American Veterinary Medical Association, Vol. 191, No. 6, 1987, pp. 685-688.
[2] Fluocinonide, United States Pharmacopeia USP32 NF 27, 2009, pp. 2401-2403.
[3] E. Shek, J. Bragonje, E. J. Benjamin, M. J. Sutherland and J. A. P. Gluck, “A Stability Indicating High-Performance Liquid Chromatography Determination of Triple Corti-coid Integrated System in a Cream,” International Jour-nal of Pharmaceutics, Vol. 11, No. 3, 1982, pp. 257-269.
[4] E. Bailey and P. N. Brittain, “The Quantitative Determi-nation of Fluocinolone Acetonide and Acetonide Acetate in Formulated Products by High Pressure Liquid Chro-matography,” Journal of Pharmacy and Pharmacology, Vol. 24, No. 6, 1972, pp. 425-428.
[5] W. C. Landgraf and E. C. Jennings, “Steroid Determina-tion from Complex Mixtures by High Pressure Chroma- tographic Techniques,” Journal of Pharmaceutical Sci-ences, Vol. 62, No. 2, 1973, pp. 278-281.
[6] F. Biley, A. Holbrook and R. J. Miller, “The Determina- tion of Fluocinolone Acetonide in Formulated Products,” Journal of Pharmacy and Pharmacology, Vol. 18, 1966, pp. 12S-16S.
[7] M. Bakshi and S. Singh, “Development of Validated Stability Indicating Assay Methods—Critical Review,” Journal of Pharmaceutical and Biomedical Analysis, Vol. 28, No. 6, 2002, pp. 1011-1040.
[8] P. Srinivasu, D. V. Subbarao, R. V. K. Vegesna, K. S. Babu, “A Validated Stability Indicating LC Method for Acetazolamide in the Presence of Degradation Products and Its Process Related Impurities,” Journal of Pharma-ceutical and Biomedical Analysis, Vol. 52, No. 1, 2010, pp. 142-148.
[9] D. V. Subbarao, P. Radhakrishnanand and V. Himabindu, “Stress Degradation Studies on Tadalafil and Develop-ment of a Validated Stability Indicating LC Assay for Bulk Drug and Pharmaceutical Dosage Form,” Chroma-tographia, Vol. 67, No. 1-2, 2008, pp. 183-188.
[10] D. V. Subbarao, P. Radhakrishnanand, M. V. Suryanara-yana and V. Himabindu, “A Stability Indicating LC Method for Candesartan Cilexetil,” Chromatographia, Vol. 66, No. 7-8, 2007, pp. 499-507.
[11] A. Madhavi, D. V. Subbarao, P. Srinivasu and A. Naidu, “Development and Validation of a New Analytical Method for the Determination of Related Components and Assay of Ranolazine in Bulk Drug and Pharmaceuti-cal Dosage Forms by LC,” Chromatographia, Vol. 70, No. 1-2, 2009, pp. 333-338.
[12] A. Madhavi, A. Naidu, D. V. Subbarao and P. Srinivasu, “Development and Validation of a New LC Method for the Analysis of Determination of Brimonidine Tartrate and Related Components,” Chromatographia, Vol. 69, No. 11-12, 2009, pp. 1413-1419.
[13] J. T. Carstensen and C. T. Rhodes, “Drug Stability Prin-ciples and Practices,” 3rd Edition, Marcel Dekker, New York, 2000.
[14] U.S. Food and Drug Administration, “ICH Guidelines on Validation of Analytical Procedures: Text and Method-ology Q2 (R1),” Federal Register, FDA, Silver Spring, 2005.
[15] International Federation of Pharmaceutical Manufactures & Associations, “ICH Stability Testing of New Drug Substances and Products Q1A (R2),” International Con-ference on Harmonization, Geneva, 2003.
Copyright © 2010 SciRes. AJAC


![PÿlIElÿl iIÿ.'I ÿliÿ P.III I[O] =!b'dl NSAIDS ANTIFUNGALS drug 010113.pdf · mefenamic acid Meloxicam nabumetone naproxen ... fluocinonide emollient base fluocinonide-e fluticasone](https://img.pdfslide.us/doc/110x75/5ade1efb7f8b9a213e8db38c/pliell-iii-li-piii-io-bdl-nsaids-drug-010113pdfmefenamic-acid-meloxicam.jpg)