Embed Size (px)
Citation preview

.
DOE/PETC/TR-96/4
A UTILITY SURVEY AND MARKET ASSESSMENT ON REPOWERING IN THE ELECTRIC POWER INDUSTRY
BY J.M. Klara R .E . Weinstein M.R. Wheriey
August 1996

DISCLAIMER
Portions of this document may be illegible in electronic image products. Images are produced from the best available original document.

DOE/PETC/TR-96/4
REC€WD SEP 3 0
O m \ A Utility Survey and Market Assessment on Repowering in the Electric Power Industry
J.M. Klara
U.S. Department of Energy Pittsburgh Energy Technology Center
P.O. Box 10940 Pittsburgh, PA 15236
R.E. Weinstein
Parsons Power Group Inc. 2675 Morgantown Road
Reading, PA 19607
M.R. Wherley
Science Applications International Corporation 11251 Roger Bacon Drive
Reston, VA 22090
August 1996

-A Utility Survey and Market Assessment on Repowering in the Electric Power Industry
August 1996 Prepared by:
The United States Department of Energy Pittsburgh Energy Technology Center
P.O. Box 10940 Pittsburgh, Pennsylvania 15236
Project Manager: Julianne M. Klara
U.S. DOE PETC
Authors: Richard E. Weinstein
Parsons Power Group Inc. Michael R Wherley
Science Applications International Corporation

Notice
NOTICE
NOTICE
This report was prepared as an account of work sponsored by an agency of the United States Government. Neither the United States Government nor any agency thereof, nor any of their employees, makes any warrantee, express or implied, or assumes any legal liability or responsibility for the accuracy, completeness or usefulness of any information, apparatus, product or process disclosed, or represents that its use would not infringe privately owned rights. Reference herein to any specific commercial product, process, or sexvice by trade name, trademark, manufacturer, or otherwise does not necessarily constitute or imply its endorsement, recommendation, or favoring by the United States Government or any agency thereof The views and opinions of authors expressed herein do not necessarily state or reflect those of the United States Government or any agency thereof.
Augurt 1996 i US. OOUPETC
SUMMARY
With the projected need for additional electric generating capacity in the U.S. and the age of many - coal-fired steam plants, electric utilities are considering repowering existing generating units as a
cost-effective option to extend unit life, improve efficiency, increase capacity, and comply with environmental regulations. To assess the electric utility thoughts about repowering, a U.S. Department of Energy (DOE) team comprised of government personnel and contractors developed a survey for the senior management of several electric utilities. This report provides the following:
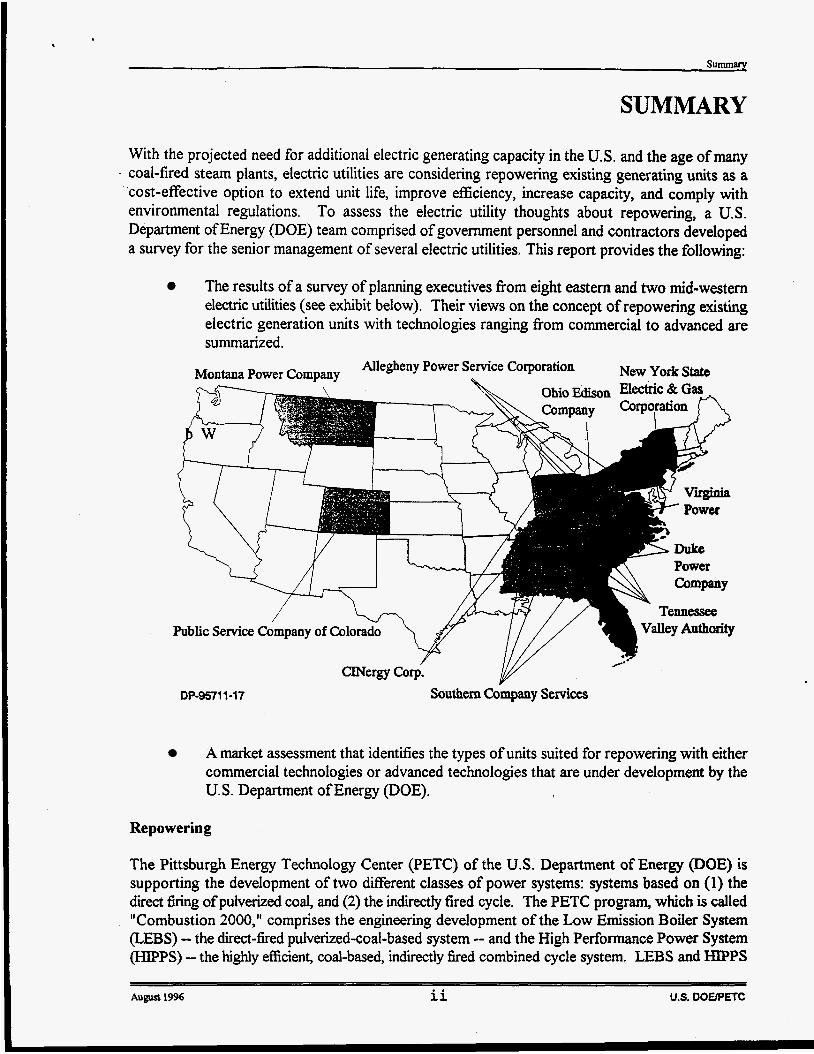
The results of a survey of planning executives fiom eight eastern and two mid-westem electric utilities (see exhibit below). Their views on the concept of repowering existing electric generation units with technologies ranging fiom commercial to advanced are summarized.
Public Service Company of Colorado ~ ~ V a l l e y A u t h o r i i y
rZ.' CINergy Coy.
DP-95711-17 southern Company services
A market assessment that identifies the types of units suited for repowering with either commercial technologies or advanced technologies that are under development by the U.S. Department of Energy (DOE).
Repowering
The Pittsburgh Energy Technology Center (PETC) of the U.S. Department of Energy (DOE) is supporting the development of two different classes of power systems: systems based on (1) the direct firing of pulverized coal, and (2) the indirectly fired cycle. The PETC program, which is called "Combustion 2000," comprises the engineering development of the Low Emission Boiler System (LEBS) - the direct-fired pulverized-coal-based system -- and the High Performance Power System CHIpPS) - the highly efficient, coal-based, indirectly fired combined cycle system. LEBS and HIPPS
August 19% ii US. DOEPETC

are intended primarily for new plants; however, DOE envisions that repowering applications may be the initial market entry for Combustion 2000 power cycles.
In a conceptual design study, “Repowering with High Performance Power Systems (HIPPS),” PETC . evaluated several unit repowering options with HIPPS. This study provided research guidance to the
HIPPS program, providing cycle development needs, economic feasibility, technology demonstration needs, risk assessment, and commercialization potential for a repowering application. In support of that evaluation, DOE performed this market assessment and utility survey to ensure that key questions and needs of electric utility companies were addressed.
What This Report Contains
Backerou nd. Section 1 of this report provides a background about the DOE HIPPS program. There are two kinds of HIPPS cycles under development. One team is led by the Foster Wheeler Development Corporation, the other team is led by the United Technologies Research Center. These cycles are described in Section 1.
Survey. Section 2 summarizes the feedback from the survey of the repowering needs of ten electric utility companies. The survey verified that the utility company planners favor a repowering for a first-of-a-kind demonstration of a new technology rather than an d-new-site application. These planners list the major factor in considering a unit as a repowering candidate as plant age: they identie plants built between 1955 and 1965 as the most likely candidates. Other important factors include the following:
0
0 The need to reduce operating costs, The need to perform major maintenanceheplacement of the boiler, and The need to reduce emissions.
A unit of less than 200 MW capacity is the most likely size to be considered for repowering by the electric utility industry. The survey responses also indicate that proven capability and competitive cost are mandatory. Capital cost must be reasonable and economics must be competitive as the industry responds to open access and moves toward decreased regulation and increased competition. The perceived risk factors that affect the decision to repower vary among the respondents. The strongest agreement relates to fbture price of natural gas, which respondents expect will escalate greatly after 2005 compared to the price of coal.
Market Assessma . Section 3 reports the results of the market assessment. Using the size and age preferences identified in the survey, a market assessment was conducted (with the aid of a power plant data base) to estimate the number and characteristics of U.S. generating units which constitute the current, primary potential market for coal-based repowering. Nearly 250 units in the U.S. meet the criteria determined to be the potential repowering market.
August 1996 iii U.S. OOUPETC

TABLE OF CONTENTS
Section
1
2
3
NOTICE
SUMMARY LIST OF EXHIBITS
ACKNOWLEDGEMENTS
Title
BACKGROUND 1.1 The DOE HIPPS Program
1.2
UTILITY COMPANY SURVEY 2.1 Survey Objectives
2.2 Survey Participants
2.3
2.4
2.5
2.6
2.7
2.8 2.9
2.10 Summary of Survey Results
MARKET ASSESSMENT 3.1
3.2 Pre-Selection Criteria
3.3 Unit Age and Size 3.4 Reheat versus Non-Reheat
The New Electric Generation Market
How the Information is Summarized
What Motivates Consideration of Repowering?
What Makes a Specific Unit a Candidate?
What Repowering Technology Attributes Are Important?
What Type of Repowering Method Is Attractive?
What Risk Factors AfEect the Decision? Sensitivity of Unit Dispatch to Operating Costs
Data Source for Market Assessment
Paee
1 .. 11
vi
vii
1-1 1-1
1-2
2-1 2-1
2-4 2-6
2-7
2-11
2-12
2-15
2-20
2-22 2-23
3-1 3-1
3-1
3-3
3-6
August 1996 iv U.S. DOWETC

Table of Contents
3.5 Throttle Pressure 3-7
3.6 Throttle Temperature 3 -8
3.7 Representative Plant Population for Repowering 3-8
4
5
REFERENCES
ABBREVIATIONS USED IN THIS REPORT
4- 1
5-1
Augw& 1996 V U.S. DOEPETC

LIST OF EXHIBITS
Exhibit
Exhibit 1
Exhibit 2
Exhibit 3
Exhibit 4
Exhibit 5
Exhibit 6
Exhibit 7
Exhibit 8
Exhibit 9
Title
Electric Utility Company Return Before and M e r Deregulation
U.S. Plant Efficiency Versus Year Installed
Characteristics of the Survey Participants
States Served by the Participants in the Electric Utility Company Survey
Reasons For Considering Repowering
Important Technology Attributes
Preferences for Method of Repowering
Perceptions on Risk Factors
Perceptions on a HIPPS Demonstration Project
Exhibit 10 Typical Operating Costs versus Annual Hours of Operation
Exhibit 1 1 Fossil Plant Generation Capacity versus Year of Startup
Exhibit 12
Exhibit 13
Number of U.S. Coal Units Sorted by Size
Number of Presently-Operating U.S. Coal-Fired Units by Age and Size
Exhibit 14
Exhibit 15
Prevalence of Reheat in U.S. Power Plants
Throttle Pressure of Coal-Fired Units
Exhibit 16 Superheat Temperature of Coal-Fired Units
1-2
2-3
2-5
2-6
2-9
2-13
2-15
2-20
2-21
2-23
3-2
3-3
3-4
3-6
3-7
3-8
~~~
August 1996 vi U.S. WUPETC

ACKNOWLEDGEMENTS
This report was prepared by the United States Department of Energy. It was prepared with the support of a number of persons both within the Department and from industry contractors. Key contributors to this report include:
Project Manager: Julianne M. Klara U.S. DOE, PETC
Authors: Richard E. Weinstein, P.E. Michael R. Wherley
Parsons Power Group Inc. Science Applications International Corp.
Other significant contributors include:
Lawrence E. Van Bibber JonH. Ward
Parsons Power Group Inc. Science Applications International Corp.
This report could not have been prepared without the excellent cooperation of the electrk utility companies that participated in the survey. These participants are acknowledged in Section 2.2.
vii U.S. DOEPETC August 1996

1 BACKGROUND
. 1.1 THE DOE HIPPS PROGRAM
Anticipating the need for new generation capacity in the U.S., the Pittsburgh Energy Technology Center (PETC), a field office of the U. S. Department of Energy (DOE), developed the Combustion 2000 program. This program strives to assure that the U.S. can economically continue to use its extensive coal resources to meet fbture power-generating needs by improving efficiency, emissions control, and cost with innovative technologies suited for both building new and repowering existing power plants. The Combustion 2000 program consists of two systems: the Low-Emission Boiler System (LEBS) and the High Performance Power System (HIPPS).
LEBS uses highly advanced combustion, emission control, and power cycle technology that will help electric generating companies add new coal-fired base-load capacity, or repower existing plants, beginning afker the year 2000. The LEBS goals include decreased emissions, increased efficiency, and similar capital costs as compared to today's coal-fired power plants.
.
HIPPS, targetted for a later introduction (2004), is aimed at developing advanced coal-based power systems using an indirectly-fired gas-turbine that offer significant improvements over today's conventional power plants. The HIPPS goals are more aggressive than those of LEBS: major improvements in thermal efficiency, environmental performance, and cost of electricity.
Other technologies, such as gasification and pressurized fluidized-bed combustion, are alternatives to HIPPS; however, the HJPPS concept has the advantage of similarity in design to a conventional pulverized-coal plant. The environmental performance for the HIPPS systems are excellent (less than 1/10 of what New Source Performance Standards allow today) compared to today's coal-fired units. HIPPS emission reductions far exceed that of a modem pulverized-coal plant with conventional flue gas treatment at reduced capital investment.'.*
Through a competitive solicitation issued in September 1990, two teams headed by Foster Wheeler Development Corporation O C ) and United Technologies Research Center (UTRC) were contracted by DOE to develop HIPPS. These teams completed Phase 1 activities that included preliminary research and development, engineering analysis, and experimental testing. An open solicitation (not limited to the two industry teams involved in Phase 1) for Phases 2 and 3 of the engineering development of HIPPS was issued in April 1994, and awards were made in June 1995. Both FWDC and UTRC were selected to continue the development oftheir concepts. Phase 2 entails engineering development and subsystem testing at a moderate scale and the site-specific engineering design of a prototype plant. Phase 3 includes the design of a prototype plant, followed by plant construction, testing and evaluation.
DOEPETC envisions that repowering applications may be the initial market entry for HIPPS technology. If the initial demonstration of this technology proves successhl, then a number of repowering project replicates would launch HJPPS and develop market demand for both repowering and new site applications.
August 1996 1-1 US. DOEPETC

Section 1: Badtground
1.2
Public policy is rapidly pushing the electric power industry away fiom its former regulated monopoly structure and toward unprecedented competition. The industry is adjusting to new ways of doing
. business as it moves to open transmission access and responds to the implications of increased competition, as evidenced by recent major restructuring, price structure adjustments, and operating changes. The price of electricity will be set by market forces, rather than tariffs set by rate cases. Generation companies will need to minimize capital and production costs in order to generate a profit with no certainty of an assured minimum return (see Exhibit 1).
THE NEW ELECTRIC GENERATION MARKET
Exhibit 1.
Electric Utility Company Return: Before 1 and After Deregulation
At the same time, increasingly stringent environmental regulations demand that units operate with exemplary emissions characteristics. These and other market forces impel generating companies to consider the purchase of new or upgraded generation with characteristics that meet goals similar to those of PETC’s Combustion 2000 program:
August 1996 1-2 U.S. DOEPETC
Section I: Ekkground
New generation technology that is reliable, very clean, easy to operate, and inexpensive to maintain. Technology that has a competitive cost. Technology that is highly efficient, and able to operate at low production cost using a reliable supply of abundant, low-price domestic &el.
Combined cycles, most often fueled by natural gas, are in high demand today because of their high efficiency, good reliability, and the present competitive price of natural gas. However, the U.S. has huge reserves of coal, which is a lower priced fuel than natural gas. Thus, there is a desire to fuel combmed-cycles with coal (without damaging the gas turbine) at a competitive cost. PETC has been developing HIPPS to meet this objective.
U.S. DOEPETC August 1996 1-3

Section 2 utility company Survey
2 UTILITY COMPANY SURVEY
. On behalf of DOE, seventeen utilities were contacted to participate in a survey concerning the repowering of electric generating units. Of the fourteen utilities that agreed to participate in the survey, ten responded to the questions on repowering issues. The survey objectives and the respondent’s characteristics are described in Sections 2.1 and 2.2. Sections 2.3 - 2.10 contain the results of the survey.
2.1 SURVEY OBJECTIVES
The objective of the survey was to gather information about where repowering fits into the plans of regulated electric utility companies, and what considerations are important to them when considering a repowering technology option. The survey requested feedback on the following issues:
0
0
What factors are most important for considering repowering as an option? What makes a specific unit likely or unlikely for consideration for repowering? What considerations are important for selecting a particular repowering technology? What type of repowering method is attractive? What are the risks (fbture fuel costs, externalities, deregulation) that affect the decision? What level of risk is suggested as acceptable for a first-of-a-kind technology demonstration? - What should be the major emphasis of an advanced technology
What are the principal technical concerns about advanced technologies? repowering demonstration ? -
What is the sensitivity of unit dispatch to operating costs?
In preparing the utility survey, the DOEFETC study team reviewed the typical motivations for repowering and the factors pertinent to evaluating a potential repowering site. This information is summarized below.
2.1.1 Motivations for Repower in
Companies with aging generating units consider repowering for a number of reasons:
a. The need for added capacity on the system either to meet local demands or for long- distance retail wheeling.
b. The need to make the unit more competitive. Improving heat rate can reduce generating costs. This can improve a unit’s position in the dispatch order and thereby increase its capacity factor.
C. The need to reduce environmental emissions to comply with local regulations and the Clean Air Act and its amendments.
~~
August 1996 2- 1 U.S. DOUPETC

Section 2: Utility Company Survey
d. The need to replace major equipment. Repowering with new equipment can be more cost-effective than extensive refhrbishment.
2.1.2 Factors Influencing the Implementation of Repowe ring
Evaluation of the potential for repowering a particular facility involves consideration of numerous factors. Every site requires a site-specific evaluation of these issues. At a minimum, the following site- and plant-related factors must be evaluated.
a.
b.
C.
d.
e.
f
Overall Condition and Potential for Life Extension. The condition of the infrastructure of the plant, such as roads and civil works, steam turbine generator, and ancillary equipment is an important consideration in determining the amount of equipment that can be retained in service, or economically refurbished. Any equipment and infrastructure that can be preserved reduce the capital investment required.
Cycle Integration Compromises Must Be Modest. Repowering is most attractive when the amount of preserved equipment is large, and the power-cycle integration needed to fit new equipment to the existing process does not signiscantly compromise performance advantages. Trying to match a repowering process to existing equipment fiequently involves a compromise in heat rate that would not exist if all new equipment were selected. The performance loss incurred to preserve the existing equipment must be evaluated against the capital savings.
Present and Repowered Generating Capacity. The repowering technology must be compatible with the existing unit size while providing the desired final capacity. Some advanced technologies are scalable over a wide range of sizes. Others are modular and come in discrete sizes. These issues are significant in determining the economic efficiency of the repowering scheme, and mismatches will impair the economic attractiveness of repowering.
Match to Existing Steam Turbine. When the existing steam turbindgenerator is retained, the repowering technology must be matched in size to provide the necessary steam requirements. If the repowering approach increases the amount of low temperature heat available for economizer duty, feedwater heaters can be taken out of service, increasing the amount of steam flow available for power generation. If the steam turbines do not have the back-end capacity to handle the added steam, the throttle steam flow must be reduced so back-end flow limits are not exceeded.
Fuel Use. Repowering may be based on continued use oflthe current &el, the return to a previously-used fuel, or the introduction of a "new" fuel (examples include replacing oil with either natural gas or coal, or introducing a new process-derived fuel). The selection of the appropriate fuel for repowering depends on the specific repowering technology, overall economics, and on the capabilities of the site and regional infrastructure to supply that &el.
Heat Rate and Operating Cost, Present and Repowered. Fuel costs represent the largest operating cost for fossil-fueled facilities. The change in heat rate and the change in he1 costs (where a fuel change is made), along with the costs of required chemicals and sorbents, are
~
August 1996 2-2 U.S. DOEPETC

Section 2: Utility Company Survey
very important in repowering economics. Normally, the repowered unit will operate at an improved heat rate or with a lower-cost fuel and, therefore, can obtain a higher dispatch priority and increased annual use. The improved dispatch will significantly improve the cost of electricity and return on investment. It may also significantly reduce the number of unit start-stop thermal fatigue and pressure fatigue cycles, thus reducing maintenance costs.
Exhibit 2 shows the net plant efficiency of the U.S. generating fleet versus the year installed. There has been little improvement in plant efficiency since the 1960s. This is largely due to the installation of pollution control equipment and the increased use of cooling towers. These increase auxiliary load and steam turbine back pressure, respectively, which tends to offset any improvement in the generation equipment. Although higher efficiency equipment that uses higher steam cycle conditions is within technical capabilities, their use is not economical in the U.S. currently. A new generation of advanced technologies is needed to increase energy efficiency at reduced cost and risk.
Exhibit 2 U.S. PLANT EFFICIENCY VERSUS YEAR INSTALLEV
40 > I I
s 0 c a 0
w .I
E
30
20
10
0 I I I i
1880 90 1900 10 I
20 I I I I I
30 40 50 60 70 80 90 YEAR
~~
August 19% 2-3 U.S. DOUPETC

Section 2: Utility Company Survey
- _ h.
1.
Site Adaptability/Space/Access. Candidate repowering sites must have space to accommodate new structures, facilities, and equipment. There must also be adequate space for laydown and construction access. Space for fuel acces and storage must also be considered.
Outage Period Needed. The construction t i e required to complete the repowering upgrade must be within a scheduled outage since the cost of replacement power bought during the upgrade could be significant.
Environmental Emissions, Present and Repowered. Reduction of air emissions (such as SO, NO, particulate matter, air toxics and (perhaps) COJ to meet environmental regulations is often one of the main motivating factors to repowering.
Transmission Capacityh'roximity to Major Load Centers. Since repowering is likely to increase capacity, additional transmission capacity may be needed. Expansion of the transmission right-of-way can be expensive and may significantly change the economics of repowering a site with a designated technology.
2.2 SURVEY PARTICIPANTS
The companies invited to participate in the survey were selected on the following basis:
0
Having participated or cooperated in prior DOE projects, or Having indicated an interest in DOE'S HIPPS Program through past meetings or contact, or Having coal-fired units in the 100-300 MW range, which was determined by the DOELPETC study team to be a favorable plant she for repowering.
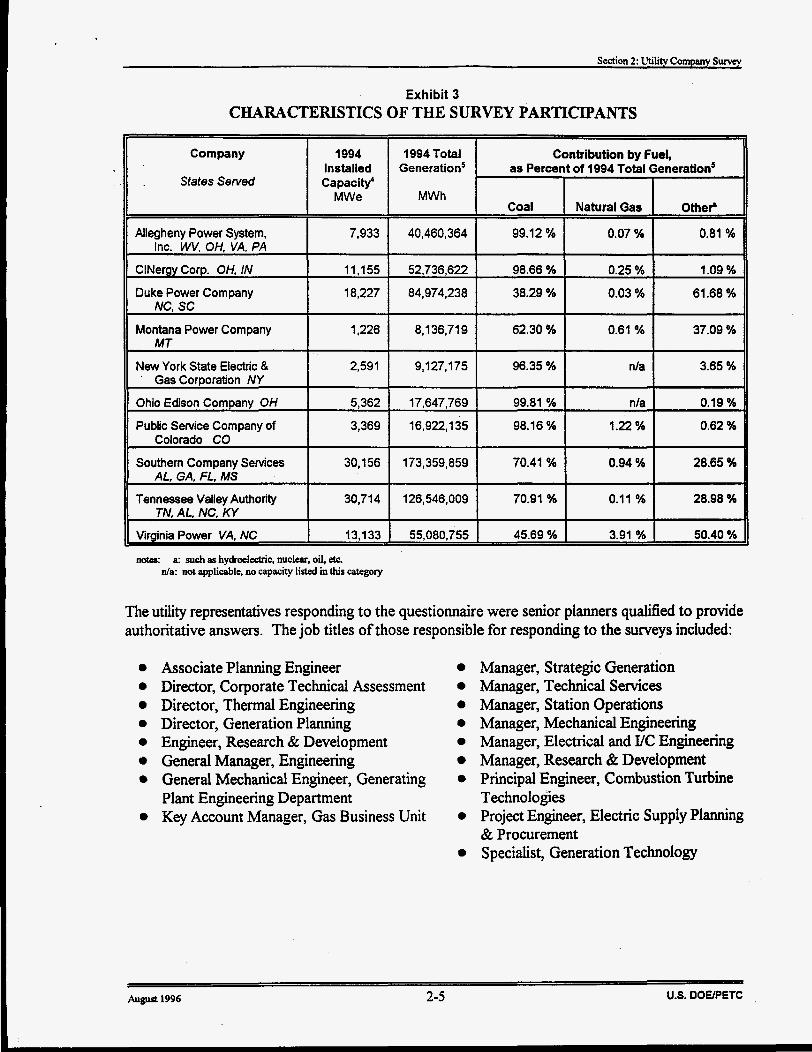
Seventeen utilities were contacted to determine their interest in HPPS and in participating in a survey about repowering. Of those contacted, ten utilities (listed in Exhibit 3) responded. The various states served by these companies are illustrated in Exhibit 4.
August 1996 2-4 US. OOEPETC
Section 2: Utility Company Survey
Capacity'
Exhibit 3 CHARACTERISTICS OF THE SURVEY PARTICIPANTS
Contribution by Fuel, as Percent of 1994 Total Generation5
I I
Company
States Served MWe
Allegheny Power System, Inc. W, OH, VA, PA
ClNergy Corp. OH, IN
MWh I Coal Natural Gas Other'
Duke Power Company NC, SC
11,155
18,227
Montana Power Company MT
52,736,622 98.66 % 0.25 % 1.09 %
84,974,238 38.29 % 0.03 % 61.68 %
1,226 8,136,719 62.30 % 0.61 % 37.09 %
7,933 1 40,460,364 I 99.12 % 1 0.07 % I 0.81 %
New York State Electric & Gas Corporation NY
Ohio Edison Company OH
Public Service Company of
Southern Company Services
Tennessee Valley Authority TN, AL. NC, KY
Virginia Power VA, NC
Colorado CO
AL, GA. FL, MS
~
2,591 9,127,175 96.35 % nla 3.65 %
5,362 17,647,769 99.81 % nla 0.19 %
3,369 16,922,135 98.16 % 1.22 % 0.62 %
30,156 173,359,859 70.41 % 0.94 % 28.65 %
30,714 126,546,009 70.91 % 0.11 % 28.98 %
13,133 55,080,755 45.69 % 3.91 % 50.40 %
notes: a: such as hydroelectric, nuclear, oil, eic. da: not applicable. no capacity iisted in this category
The utility representatives responding to the questionnaire were senior planners qualified to provide authoritative answers. The job titles of those responsible for responding to the surveys included:
Associate Planning Engineer Director, Corporate Technical Assessment Director, Thermal Engineering Director, Generation Planning Engineer, Research & Development General Manager, Engineering General Mechanical Engineer, Generating Plant Engineering Department Key Account Manager, Gas Business Unit 0
0
Manager, Strategic Generation Manager, Technical Services Manager, Station Operations Manager, Mechanical Engineering Manager, Electrical and YC Engineering Manager, Research & Development Principal Engineer, Combustion Turbine Technologies Project Engineer, Electric Supply Planning & Procurement Specialist, Generation Technology
US. DOEPETC August 1996 2-5

Section 2: Utility Company Survey
Exhibit 4 STATES SERVED BY THE PARTICIPANTS
IN THE ELECTRIC UTILITY COMPANY SURVEY
New York State Allegheny Power Service Corporation Montana Power Company
Southern Company Senrices OP-95711-17
2.3 HOW THE INFORMATION IS SUMMARIZED
The remaining subsections discuss the major points made by the utility company participants in the survey. Selective responses are listed here to highlight the sigruficant results, and some narrative comments have been summarized for clarity. Specific responses of the individual company are not identified. Major conclusions from the survey are listed in subsection 2.10.
To aid in the interpretation of the survey results, both numerical and graphical presentation format is used. An example of this format is shown on the following page:
U.S. DOUPETC August1996 2-6

Section 2: Utility Company Survey
I How important are the following in considering a unit as a candidate for repowering?
1 2 3 4 5 slight key
T T T t t t t T t
not important influence considered - ' -
Ratings - I 1 1.5 2 2.5 3 3.5 4 4.5 5 I I ............... ..............
Need For Additional Power: -1 stddev average + I srd dev Baseload
2.8 avgktd dev. 1.55/10 responses
The left-most block ("not important") is assigned a rating of 1, the "slight influence" block a rating of 2, "considered," a rating of 3, and so forth. The number of responses in each block is multiplied by the rating, and the totals are averaged. Note that the center of each box is the location of the valuation; thus "slight influence" has a value of 2.0 at the center of that box, while 2.5 is the edge of the box.
The standard deviation of the answers provides a good measure of the degree of consensus. For the above example, the standard deviation is 1.55. The average is displayed by a bullet e), with bars to the left and right showing one standard deviation below and above the average, respectively. A contentious issue will have a wide spread, while a consensus issue will have a narrow spread. In the example, the average is shown as 2.8, with bars bounding *l standard deviation (f1.55), that is, fiom 1.25 to 4.35. This issue is a contentious one, with a very wide band of disagreement among those responding.
In most sections, the responses are listed in descending order of importance to the utility companies, rather than in the order the questions were asked.
2.4 WHAT MOTIVATES CONSIDERATION OF REPOWERING?
Exhibit 5 summarizes the reasons that utilities consider repowering. The age of the unit is the highest-ranked reason. Improved costs and reduced emissions also ranked high. The size of the existing plant is not a very significant reason to repower. The needs for summer and winter peaking have only a slight influence on the choice to repower.
2.4.1 &e of Candidate Un its. Shown below are the utility responses regarding age, indicating that the units preferred for repowering would have reached an average age of 40 years, and that any unit under 25 years of use would not be repowered.
August 1996
m
2-7 U.S. DOWETC

Section 2: Utility Company Survey
Age range most likely considered as repowering candidate?
40 to 50 years older than 45 years, 45years older than 40 years older than 35 years 35to45years 30 to 40 years
Age range least likely considered as a repowering candidate?
0-10 years less than 30 years lessthan3Syears 10t020years
U.S. DOWETC August 1996 2-8

Section 2: ihility Company Survey
Exhibit 5 REASONS FOR CONSIDERING REPOWERING
I . . . . . . . . . . . . . . . . . .
I I 1 I
2.5 ave/std dev. 1.18/10 responses
2.5 avp/std dev. 1.3910 responses
2 4 avgfstd dev. 1.43110 responses
. . . . . . . . . . . . . . . . . . . . . Need for summer peaking
Need for winter peaking . . . . . . . . . . . . . . . . . . . . . .
*ST-G = Steam turbine-generator
U.S. OOUPETC August 1996 2-9

Section 2: Utility Company Survey
2.4.2 The Desire to C hanee Fuel. The need to change fuel can be an important motivator for repowering. The surveyed utilities identified the fuel changes most likely to be made as part of a repowering, Notice the diversity of opinion about natural gas versus coal: some companies would like to switch from coal, others would like to switch to coal. Basically, gas is preferred because of
'its environmental performance and coal because of its low cost.
Present fuel most likely to be replaced?, and Why is this fuel undesirable?
coal -- 1990 cAAA* (environmental) -- High SO,, NO,, (However, coal does have ample supply at low cost) -- If natural gas becomes cost competitive -- Coal units are 45 years old Oil -- cost -- SO, emissions Nuclear -- Unit needs to be replaced: never ran at full capacity
Fuel most desired for the replacement?, and Why is this fuel desired?
Gas -- 1990 CAAA* (environmental) -- Very low emissions (but high cost) -- Efficiency -- Reduction in air emissions outweigh fuel costs
-- Low cost -- If can get lower emissions Not decided -- site dependent; depends on cost and availability
Coal
*CAAA = Clean Air Act Amendments
2.4.3 Nameplate Rating of Candidate Un its. The utilities surveyed listed the following as the most and least likely unit sizes that would be candidates for repowering. Generally, respondents considered units of 50 to 200 MW as likely candidates:
US. DOEPETC August 1996 2-10
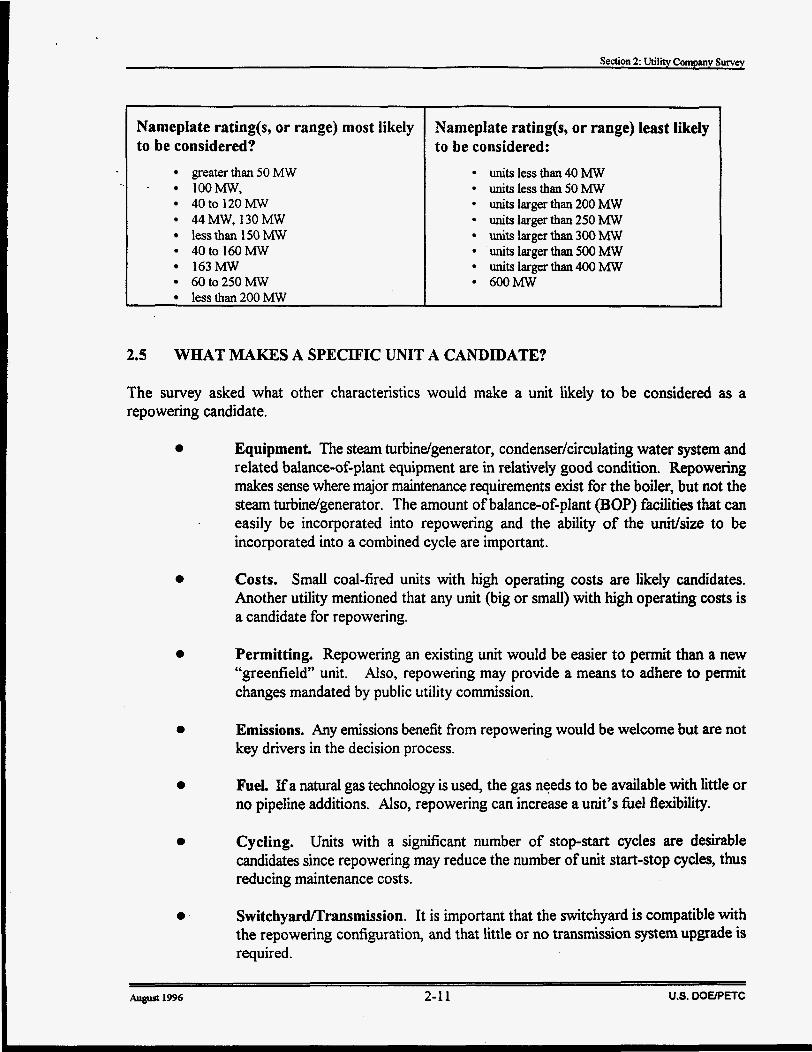
Nameplate rating(s, or range) most likely to be considered?
- lOOMW, greater than 50 MW
40to 120MW 44 MW, 130 MW less than 150 MW 40 to 160 MW 163MW 60 to 250 MW less than 200 MW
I
Nameplate rating(s, or range) least likely to be considered:
units less than 40 MW units less than 50 MW
units larger than 250 Mw
units larger than 500 MW
600 MW
units larger than 200 Mw
units larger than 300 Mw
units larger than 400 MW
2.5 WHAT MAKES A SPECIFIC UNIT A CANDIDATE?
The survey asked what other characteristics would make a unit likely to be considered as a repowering candidate.
0
0
0
0
0
0
0
Equipment. The steam turbindgenerator, condenser/circulating water system and related balance-of-plant equipment are in relatively good condition. Repowering makes sense where major maintenance requirements exist for the boiler, but not the steam turbindgenerator. The amount of balance-of-plant (BOP) facilities that can easily be incorporated into repowering and the ability of the unit/size to be incorporated into a combined cycle are important.
Costs. Small coal-fired units with high operating costs are likely candidates. Another utility mentioned that any unit (big or small) with high operating costs is a candidate for repowering.
Permitting. Repowering an existing unit would be easier to permit than a new “greenfield” unit. Also, repowering may provide a means to adhere to permit changes mandated by public utility commission.
Emissions. Any emissions benefit from repowering would be welcome but are not key drivers in the decision process.
FueL Ifa natural gas technology is used, the gas needs to be available with little or no pipeline additions. Also, repowering can increase a unit’s he1 flexibility.
Cycling. Units with a significant number of stop-start cycles are desirable candidates since repowering may reduce the number of unit start-stop cycles, thus reducing maintenance costs.
SwitchyadTransmission. It is important that the switchyard is compatible with the repowering configuration, and that little or no transmission system upgrade is required.
August 1996 2-1 1 U.S. OOElPETC
Section 2: Utility Company Survey
0 Space. Adequate space for repowered plant configuration is necessary.
0 Location. Location of plant is important: wilderness area, metropolitan areas.
'Bquaily important is what the companies feel makes a unit unlikely to be a candidate for repowering. Their edited responses included:
0 New plants. Current baseload units with high capacity factors and high availabiity have low heat rates and good emissions.
0 BOP life. If there is little remaining life in the balance of plant facilities, there is little merit.
0 Emission restrictions. If emissionddischarge restrictions are not amenable, the plant will not be repowered.
2.6 WHAT REPOWERING TECHNOLOGY ATTRIBUTES ARE IMPORTANT?
Important technology attributes for repowering were ranked by the utilities and are shown below. Survey responses indicate that proven capability and competitive cost are mandatory.
~~
U.S. DOWETC August 1996 2-12

Section 2: Utility Company Survey
Exhibit 6 IMPORTANT TECHNOLOGY ATTRIBUTES
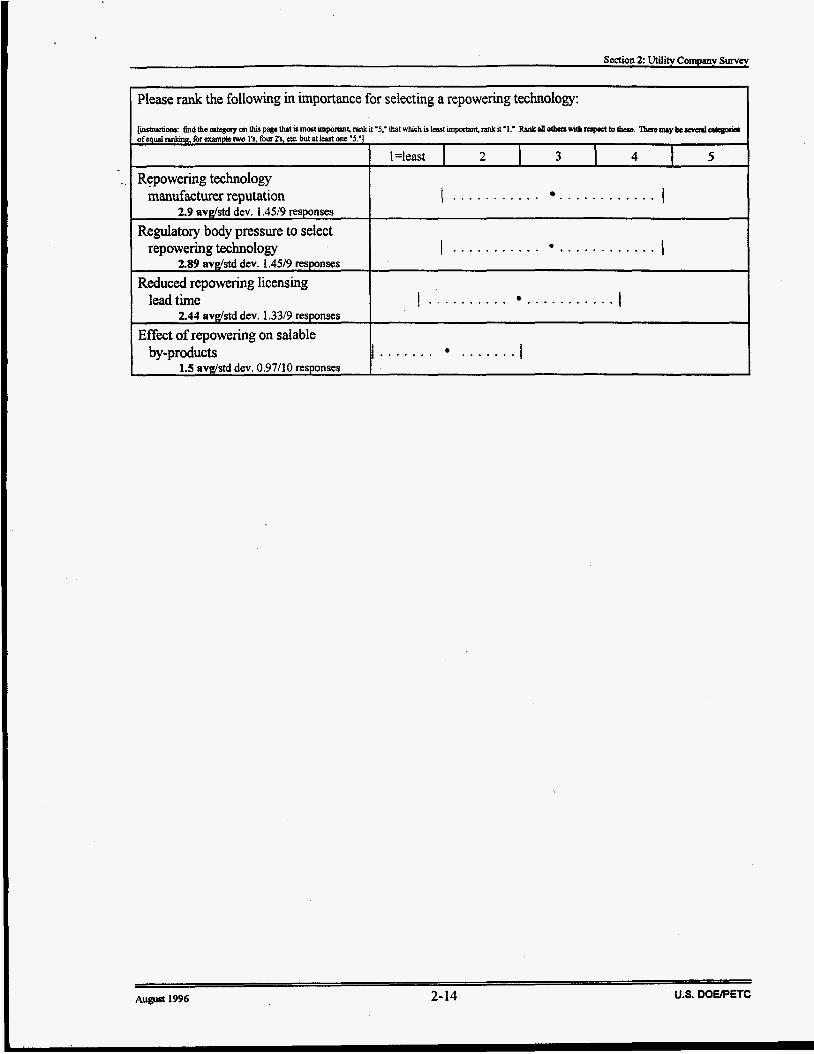
Please rank the following in importance for selecting a repowering technology:
~
Proven reliability of repowering I . . . . . . I
. . . . . . . . . . . . . . . . I I
. . . . . . . . . I e,......... I
U.S. DOUPETC August 1996 2-13
Section 2: Utility Company S W e y
Please rank the following in importance for selecting a repowering technology:
. . . . . . . . . . . . . . . . . . . . . . . I I
. . . . . . . . . . . . . . . . . . . . .
. . . . . . .
August 1996 2- 14 U.S. DOEPETC

Section 2: Utility Company Survey
2.7 WHAT TYPE OF REPOWERING METHOD IS ATTRACTIVE?
Shown below are the methods of repowering that survey participants felt were attractive. This table is followed by a listing of the favorable and unfavorable features of each option, as identified by the respondents.
Exhibit 7 PREFERENCES FOR METHOD OF REPOWERING
Please indicate the applicability of each repowering option to your site, and why. I 1 I 2 I 3 I 4 I 5
-ndY W g l Y *Station repowering technology dislike dislike neutral favor fava
* Note: HRSG =heat recovery steam generator AFBC =atmospheric fluidized bed combustion IGCC =integrated gasi6cation combined cycle CT =combustion turbine PFBC =pressurized fluidized bed combustion HIPPS =high perfomance power system ST-G =steam turbine-generator
August 1996 2-15 U.S. DOWETC

Section 2: U t i l i Company Survey
Favorable Comments
Overall economics based on cost and cycle efficiency This is our unit’s second phase: a combustion turbine/HRSG
Unfavorable Comments
Only at existing combined cycle plant
2nd Ranked: CT/HRSG/ST-G Repower
Favorable Comments
It is possible that the existing steam turbine-generator not developed yet for coal Low capital cost Large capacity gain Very low emissions Proven technology and reliable operation Overall economics - good‘cycle efficiency, moderate cost aided by utiliing existing site, low emissions Familiar technology In some cases can use existing ST-G or CT or HRSG Abilitv to uroceed in stem
Unfavorable Comments
High operating cost, could dramatically change capacity factor Minimal capital savings
3rd Ranked: Integrated Gasification Combin
Favorable Comments
OK at existing combined cycle Large capacity and efficiency gain Fuel flexibility Low fixel cost Very low SO, and NOx emissions. Coal is our primary he1 Combined cycle has good efficiency. Coal is our best cost fbel. This option was looked at in our 1993 integrated resource plan. Abilitv to add in stem. reliabilitv
Cycle Station Repower
Unfavorable Comments
High capital cost; long lead time. Space limitations Insufficient operating experience, see IGCC more as a “greenfield” option
2-16 U.S. DOUPETC August 1996

Section 2: Utility Company Survey
4th Ranked: HIPPS Station Reoower I Favorable Comments Unfavorable Comments
Not very familiar Have had no introduction to HIPPS until now Efficiency improvement desirable but needs to be proven
. 5th Ranked: Supplemental HRSG Repower
Favorable Corn men ts Unfavorable Comments
Can partially to fblly repower existing Low capacity and efficiency gain for steam turbine generator relatively high cost
Does not appear to be cost effective for our svstem at this time
6th Ranked: Atmospheric Fluidized Bed Cor
Favorable Comments
Utilizes wide variety of fkels/coal Better SO, and NOx emissions; low fuel cost Fuel versatility with coal; proven technology Economics This option was looked at in our 1993 integrated resource plan Ability to use at site
bustion System Station Repower
Unfavorable Comments
Little or no capacity gain or efficiency gain Space limitations Too early to commit
U.S. DOWETC August 1996 2-17

Section 2: Utility Company Survey
7th Ranked: Pressurized Fluidized Bed Com
Favorable Comments
Moderate capacity gain Good efficiency gain Fuel flexibility Low fuel cost Low SO, and NOx emissions May be economically favorable in some cases This option was looked at in our 1993 integrated resource plan
d o n System Station Repower
Unfavorable Comments
Needs additional testindoperating
High capital cost Long lead time Solid waste disposal Unproven at large scale sizes; integration is questionable Space limitations
maturity
8th Ranked: Combustion Turbine Hot Windt
Favorable Comments
Optimum use of existing plant
x ReDower
Unfavorable Comments
Limited improvement in efficiency for cost of a new combustion turbine; okay if combustion turbine is existing Low capacity and efficiency gain for relatively high cost Not a lot of efficiency boost, with increased emissions Does not appear to be cost effective for our system at this time Does hot windbox repowering hlly f i e a steam turbine generator? If so, we do not need that much capacity, we are phasing in our capacity over a 7-year Deriod
U.S. DOE/PETC August 1996 2-18

Section 2: Utility Company Survey
9th Ranked (Least Favored): Combustion Turbine Feedwater Heating Repower
Favorable Comments Unfavorable Comments
Similar to HRSG repowering Low capacity and efficiency gain for relatively high cost Does not appear to be cost effective for our system at this time Not a lot of efficiency boost with increased emissions Not promising
U.S. OOEPETC August 1996 2-19

Section 2: Utility Company Survev
A
2.8 W&AT RISK FACTORS AFFECT TEE DECISION?
1 -0ngiY disagree
2.8.1 3. Fuel Respondents displayed a lack of consensus and certainty in their assessments of certain risk factors pertinent to a repowering decision. The strongest
'.,agreement related to gas prices, which, on average, respondents agreed would escalate greatly after 2065 compared to coal prices.
2 3 4 5 StmOglY
disagree neutral agree agree
Exhibit 8 PERCEPTIONS ON RISK FACTORS
Natural gas projects before year 2005 are risky investments
are risky investments
2.6Avglstd dev. 1.17/10 responses Natural gas projects beyond 2005
. . . . . . . . . . . . . . . . . . I I
I . . . . . . . . . . . . . . . I 3.1 avg/std dev. 0.99/10 responses
$/Btu for gas and coal will diverge atly before year 2005 (gas will
. . . . . . . . . . . . . . . . . ore expensive relative to I I
greatly beyond year 2005 (gas will . . . . . . . . . . . . . get more expensive relative to I I
Securing an adequate long-term supply of gas can be done at . . . . . . . . . . . . . . . I I
. . . . . . . . . . . . . . . . . . . . . I I
August 1996 2-20 US. DOElPETC

Section 2: Utility Company Survey
2.8.2 First-of-a-Kind HlpPS Risk Level. Respondents were in greater agreement about the form a HIPPS demonstration project should take and the risk that it should entail. They generally agreed that it should be a lower-risk, larger-scale repowering application.
Exhibit 9 PERCEPTIONS ON A HIPPS DEMONSTRATION PROJECT
Lower Risk Option: demonstrate 1400°F HIPPS repowering with modest development and modest 10% improvement in heat rate Higher Risk Option: demonstrate 1700°F HIPPS repowering with substantial improvement in heat rate
Can you give your opinion on the following? 1 2 3 4 5
fiongiy strongly disagree disagree neuttal agree agree
levelopment of HIPPS should proceed I . . . . . . I
3.5 avglstd dev. 0.53/8 responses ragree or strongly agree, please continue, otherwise skip to the next question 3IPPS should preferably first be demonstrated in a repowering application
3IPPS should preferably fmt be demonstrated in an all new site application
DOE should be conservative: take small steps: the first HIPPS application demonstration should be a low-risk project
DOE should be aggressive: go for the most improvement possible with today's materials: the first
I . . . . . . . . I 4.0 avgistd dev. 0.63/6 responses
1 .: . . I 2.17 avdstd dev. 0.6316 responses
1.1 (1oo%consensus)
4.0 avgistd dev. 0.016 responses
1.1 HIPPS application should demonstrate the higher-risk
I I ( 100% consensus)
option
If funding were limited, it is better to test less aggressive technology at full scale than test more aggressive technology at sub- commercial size
2.0 avdstd dev. 0.0/6 responses
I . . . . I
3.83 avdstd dev. 0.4116 responses
US. DOUPETC August 1996 2-2 1

Section 2: Utility Company Survey
Major Emphasis and Technical Concerns of HIPPS
Approximately one-half of the survey participants felt adequately informed about HIPPS to provide opinions regarding the major emphasis on a HIPPS repowering demonstration and to list primary
. technical concerns for HIPPS.
For a demonstration of HIPPS, these respondents believed that: 0
0
0
0
Overall cost (capital costs and operations and maintenance (O&M) costs) must be minimized, The reliability of the high-risk components must be established, Low environmental emissions need to be demonstrated, and Cycle efficiency should be economically maximized.
0
0 0 0
The technical concerns of the survey participants included the following: 0 Materials reliability at high-temperature, 0 Cost (capital and O&M) for repowering - the addition of many new and expensive
components could make HIPPS a high-cost option, SO, and NO, control, Cycle start-up time, cycling ability, Pyrolyzer performance and reliability, and Potential for peaking duty.
Other activities the participants felt DOE should sponsor include: 0
0
Detailed cost assessments to identify feasibility and market acceptance compared to competing technologies, Continued support of advanced generation research to: - Increase efficiency -- Decrease emissions -- Make cost competitive, Improve emission performance via pre-combustion methods, and Evaluate potential for distribution generation.
2.9 S E N S m OF UNIT DISPATCH TO OPERATING COSTS
A very important consideration in any repowering is the overall energy efficiency. High energy efficiency reduces fuel costs, which are usually the most significant element in operating cost. The lower the unit operating cost, the more hours per year the unit is called on to meet demand (dispatched), and the higher its capacity factor. Most repowering technologies improve unit energy efficiency, so (assuming the fuel price is not significantly different) the repowered unit can be expected to have more operating hours and be subjected to fewer start-stop cycles. Unit dispatch is assessed by utility company generation planning models over the projected life of the project to estimate yearly use levels.
August 1996 2-22 U.S. OOEPETC

Section 2: Utility Company Survey
As an illustration, a representative curve of unit dispatch versus operating costs is shown as Exhibit 10.
Exhibit 10 TYPICAL OPERATING COSTS VERSUS ANNUAL HOURS OF OPERATION
0 IOIO 2000 3000 4000 5000 6000 7DlO 8000 9000 Hours per year that generation cost is at or below level shown
The survey participants were asked to estimate the sensitivity of unit dispatch to operating cost. Most participants chose not to provide this information since it is often considered a sensitive competitive issue. However, one participant provided the following breakdown, which shows a trend similar to that of Exhibit 10:
Hourspe r veat: Above 4000 hrdyr
below 500 hrdyr 500 - 4000 h r d ~
Ope ratin E cost range at or below; $0.014 - $0.016 per kWh $0.021 - $0.023 per kwh $0.033 - $0.036 per kwh
2.10 SUMMARY OF SURVEY RESULTS
The responses fiom electric utility companies provided extremely valuable guidance for a conceptual design study of repowering with HIPPS technology and resulted in the following major conclusions:
Most important factors in cons iderinp a u nit as a renowe - ring a d id&:
1. 2. 3. 4. 4. 6.
The plant preferably was built between 1955 and 1965. Operating costs are not projected to remain competitive. The boiler needs major maintenancdreplacement. The unit needs SO, emissions reduction. The unit's heat rate needs to be improved. The unit's rated output is generally between 50 and 200 W e .
August 1996 2-23 U.S. DOEPETC

Section 2: Utility Company Survw
Most important factors for selectin? a repowerinp technology:
1.
2. 3.
Proven reliability is the most important selection criterion. The utility companies need to be convinced of technical maturity. The economics must be competitive after deregulation. The capital and operating costs must be reasonable.
Most favored repowe r i w methods:
1. 2. 3.
Combustion turbine with new HRSG. Repowering with an integrated gasification combined cycle. HIPPS repowering. This option was rated "neutral" because of lack of famiiiarity. Respondents, on average, had less favorable opinions regarding all other repowering options.
Least favored reuowe ring methods:
0 0
Combustion turbine feedwater heating repowering. Combustion turbine hot windbox repowering.
Perceived Risks:
Most utilities believe that natural gas projects before the year 2005 are not risky investments. The $/Btu for gas and coal will diverge beyond year 2005 (gas will get more expensive relative to coal). Some companies are deferring capital investments until utility restructuring implications are clearer.
~~
August 1996 U.S. DOEPETC 2-24
Section 3: Market Assessment
3 MARKET ASSESSMENT
. A market assessment was conducted to estimate the number and characteristics of U.S. generating units that constitute the current, primary potential market for coal-based repowerings, including HIPPS-based approaches.
The U.S. population of coal-fired power plants was characterized using an existing data base. Results of the utility survey were then used to define the ages and Sizes of units that utilities currently consider to be their primary candidates for repowering. The data base was then used again to determine the most likely plant characteristics for units of these ages and sizes.
This section describes the basis for the plant market assessment, the pre-selection criteria used, and the results of the assessment.
3.1
I DATA SOURCE FOR MARKET ASSESSMENT
A commercially available electronic data base, The Electric Plant Data Base System6, was used to establish power plant characteristics that are representative of a typical repowering candidate and to estimate the number of U.S. units having these characteristics. Section 2.1 discussed the main characteristics of a power plant that are pertinent to a repowering evaluation. Of these, the following five are used by the data base to describe a generating unit:
0 age,
0 generating capacity,
0 throttle steam design conditions,
0 present fhel, and I
0 current operating status.
Therefore, these characteristics form the basis of the market assessment.
3.2 PRE-SELECTION CRITERIA
The assessment focused on the introduction of an advanced coal-fueled technology as a repowering technology, and as a new technology needing demonstration. This placed some constraints on the plants considered, namely:
The site must be coal-fired, or designed for coal use, to be an economical candidate.
Units built prior to 1940 are more likely to be too small, inefficient, old, and worn to be capable of long extensions in service. The study therefore evaluated units placed in service fiom 1940 to present. In the 2000-2010 time period many of these units will be approaching
I
3-1 U.S. DOEPETC August 1996 I

the end of their usefbl lives. They will need upgrade to continue operation, and will thus be candidates for repowering, life extension without repowering, or retirement. Over half the units in this category are below 200 Mwe in nameplate rating.
Exhibit 11 shows the fossil-fueled plant capacity in megawatts that was installed in the U.S. by year 1980. From this exhibit, it is clear that virtually all fossil-fired, U.S. generating capacity entered service after 1945.
The population of existing power plants in the data base is limited to those located in the continental U.S. and operated by investor-owned electric utilities. This covers a very wide spectrum of unit-types, and is also likely to be representative of a significant number of industrial, municipal, and cooperative units.
Exhibit 11 FOSSIL PLANT GENERATION CAPACITY
VERSUS YEAR OF STARTUP
930 1940 1950 1960 I 1970 1980 Year Plants Became Active
August 1996 U.S. OOUPETC 3-2
Section 3: Market Ass*omcnt
3.3 UNIT AGE AND SIZE
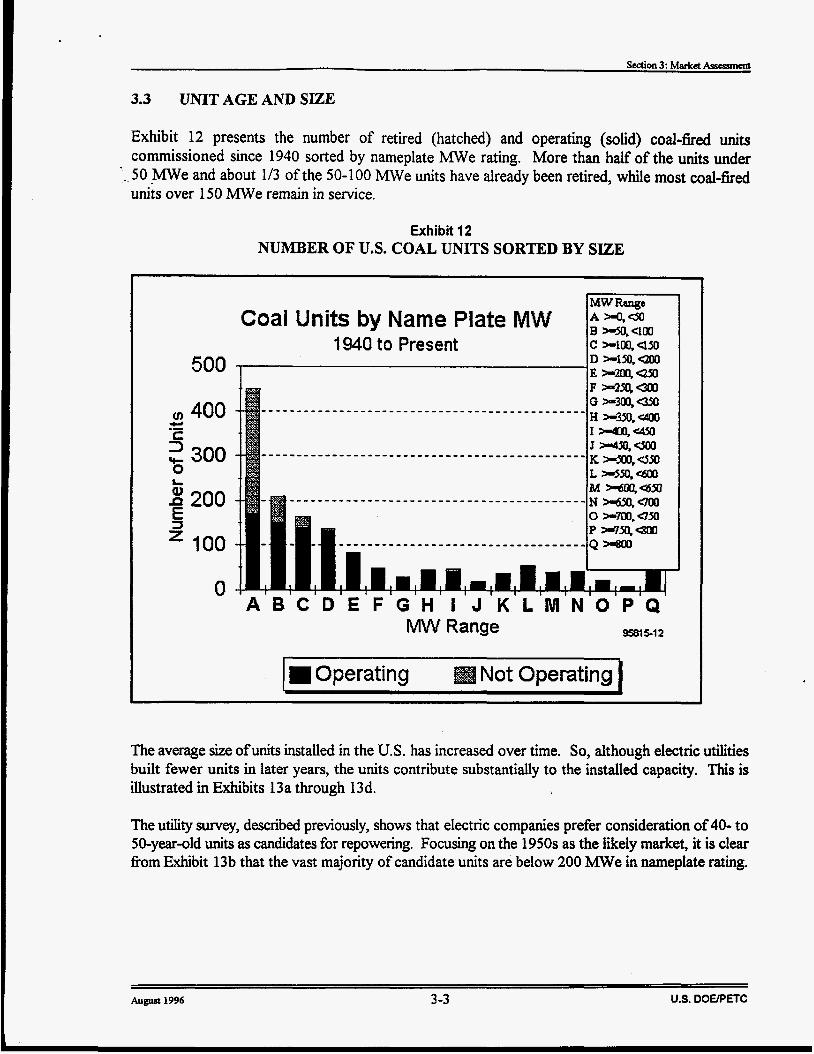
Exhibit 12 presents the number of retired (hatched) and operating (solid) coal-fired units commissioned since 1940 sorted by nameplate MWe rating. More than half of the units under
- _ 50 MWe and about 113 of the 50-100 MWe units have already been retired, while most coal-fired units over 1 SO m e remain in service.
Exhibit 12 NUMBER OF U.S. COAL UNITS SORTED BY SIZE
MWRange Coal Units by Name Plate MW ;zi:m
1940 to Present c +im,uso D >-lM.QOo
500 -E*mUXl
v) 400
2 300 w .- c 0
5 200 E 100
0 - A B C D E F
The average Size ofunits installed in the U.S. has increased over time. So, although electric utilities built fewer units in later years, the units contribute substantially to the installed capacity. This is illustrated in Exhibits 13a through 13d.
The utility survey, described previously, shows that electric companies prefer consideration of 40- to 50-year-old units as candidates for repowering. Focusing on the 1950s as the likely market, it is clear fiom Exhibit 13b that the vast majority of candidate units are below 200 W e in nameplate rating.
August 19% 3-3 U.S. DOOPETC

Section 3: Market Ass*rpmerct
Exhibit 13 NUMBER OF PRESENTLY OPERATING U.S. COALFIRED UNITS
BY AGE AND SIZE
Coal Units by Name Plate MW Commissioned 1940 through 1949
300
250
E 200 3 *-
8 150 P E 2 100
50
0
Exhibit 13a: 1940s Units
300
250
: - 200 ).
Q) 150 n z f 100
50
0
Coal Units by Name Plate MW Commissioned 1950 through 1959
Exhibit 13b: 1950s Units
August 1996 3-4 U.S. DOEPETC

Section 3: Market Assessment
Exhibit 13 (Continued) NUMBER OF PRESENTLY OPERATING U.S. COALFIRED UNITS
BY AGE AND SIZE
Coal Units by Name Plate MW Commissioned 1960 through 1969
A 8 C D MW Range
F 9581507
E
Exhibit 1%: 1960s Units
Coal Units by Name Plate MW Commissioned 1970 to Present
Exhibit 13d: Modern Units
US. DOEPETC

Section3: M d c t Assessment
3.4 REHEAT VERSUS NON-REHEAT
Exhibit 14 shows the prevalence of reheat steam cycles in units between 50 and 200 MW built after 1940. The data base was sorted on the presence (73.7%) or absence (26.3%) of a data-field value
-_ for reheat temperature. This does not necessarily mean that 26.3% of the power plant population does not have reheat. Rather, at least 73.7% of the unit population (larger than 50 MWe but smaller than 200 W e ) is configured with reheat. An absent reheat temperature in the data base could mean that reheat is not currently used or that the reheat-temperature value was simply not supplied for the data base.
Exhibit 14 PREVALENCE OF REHEAT IN U.S. POWER PLANTS
Units with no reheat temperature listed in database \ Units listed with reheat
323 units
v DH 9571 1-24b
operational U.S. units between 50 to 200 MW output built after 1940
U.S. OOElPETC August 1996 3-6

Section 3: Market Assessmmt
3.5 THROTTLE PRESSURE
Exhibit 15 presents the distribution by unit size of design-basis throttle pressures for cod-fired units commissioned after 1940. The most common throttle pressure is 1800 psig followed by 2400 psig, and then 1450 psig. The higher throttle pressures are common for larger units.
Exhibit 15 THROTTLE PRESSURE OF COALFIRED UNITS
300
250 M
E 200 3 L
150 Q) P
9 100 z 50
0
Coal Units by Throttle Pressure Commissioned 1940 to Present
- A B C D E F C H I
Steam Throttle Pressure Range 95615-09
August 1996 3 -7 U.S. DOBPETC

3.6 THROTTLE TEMPERATURE
Exhibit 16 presents the distribution of design superheat temperature of the units commissioned after 1940. A superheat of 1000 O F is the dominant design selection.
Exhibit 16 SUPERHEAT TEMPERATURE OF COALFIRED UNITS
500
400 M r 2 300 0
& g 200 1
4 00
0
Coal Units by Steam Temperature Commissioned 1940 to Present
Nominal Steam Temperature (F) 9581M0
100-150MW 150-200MW 200-3OOMW m3m4mMW a4msmMW
3.7 REPRESENTATIVE PLANT POPULATION FOR REPOWERING
Based on the market assessment that examined the characteristics of U.S. generating units, the following criteria were developed for candidate sites for repowering:
0
0
Unit Size:
- 50 to 200 W e output
Agg:
- 1950's vintage (Typically about 40 years old as of 1995)
August 1996 3-8 U.S. DOEPETC

Section 3: Market AssesJment
e Steam Conditions:
- Subcritical single reheat units: - 1450 psig/1000"F/1000"F (lower size range), - 1800 psig/1000"F/1OOOoF (mid size range), or - 2400 psig/1000"F/1000"F (larger size range) - Alternative steam conditions are 1050"F/1050"F and 1000"F/1050"F
- Presently coal-fired.
There are about 246 units in the U.S. that meet these criteria. These units currently constitute the primary potential market for coal-based repowerings. Internationally, hundreds of similar units are candidates for repowering.
August 1996 3-9 US. OOUP ETC

Section 4 References
4 REFERENCES
The following items were used as references in this section:
1. Klara, J.M., "HIPPS: Beyond State of the Art, Part I," Power Enpineering, December 1993, pp. 37-39.
2. Klara, J.M., "HIPPS Can Compete with Conventional PC Systems, Part U," Powa Engineering, January 1994, pp. 33-36.
3. LEA Coal Research News letter. No. 6, Nov. 1991.
4. Based on information listed in: Electrical World Directory of Electn 'c Utilities, 103rd Edition, 1995.
5 . Based on information listed in: Electric Power Month15 DOEEIA 0226(95/04), April 1995.
6. Utility Data Institute, Electric Plant DATAPAK Data Base Svsterq 1200 G Street, N.W., Suite 250, Washington, D.C., 20005, McGraw-Hill, Inc.
August 1996 4- 1 U.S. DOEPETC

5
- Abbreviation
AFBC avg CAAA CT DOE FWDC GT HIPPS HRSG IGCC LEBS d a MM NO, PETC PFBC
ST std dev.
sox
ST-G U.S. UTRC
ABBREVIATIONS USED IN THIS REPORT
MeaninP
atmospheric fluidized bed combustion average Clean Air Act Amendments of 1990 combustion turbine (a synonym for gas turbine) United States Department of Energy Foster Wheeler Development Corporation gas turbine (a synonym for combustion turbine) high performance power system heat recovery steam generator integrated gasification combined cycle low emission boiler system not applicable million, lo6 nitrogen oxides Pittsburgh Energy Technology Center of the U.S. DOE pressurized fluidized bed combustion sulfbr oxides steam turbine standard deviation steam turbine-generator the United States of America United Technologies Research Center
August 1996 5- 1 U.S. DOEPETC