Embed Size (px)
Citation preview

A User’s PrimerA User’s Primer
© Tapanila, 2006
version 1.1
Free software downloads available athttp://geology.isu.edu/FossilPlot/
• John J. Sepkoski Jr. (University of Chicago)
– Database of ~36,000 genera– Lists taxonomy and stratigraphic ranges– Marine animals only– Limitations:
• Few soft-bodied animals• No plants, algae, fungi, bacteria• No terrestrial animals
– Used for recognizing evolutionary patterns
The Database
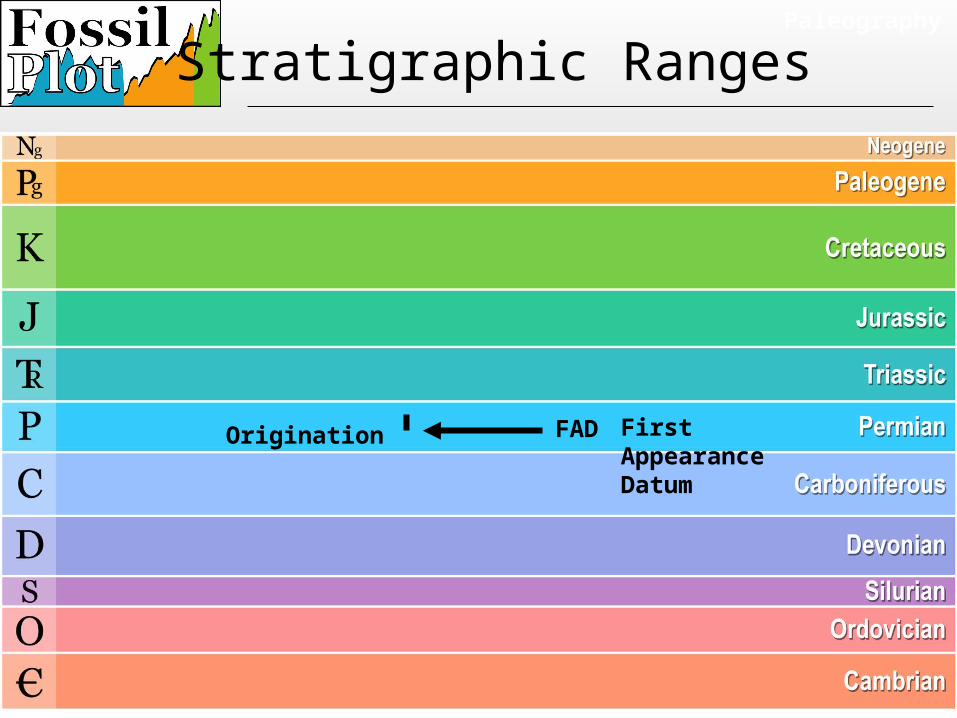
FAD FirstAppearanceDatum
Origination
Paleography
Stratigraphic Ranges
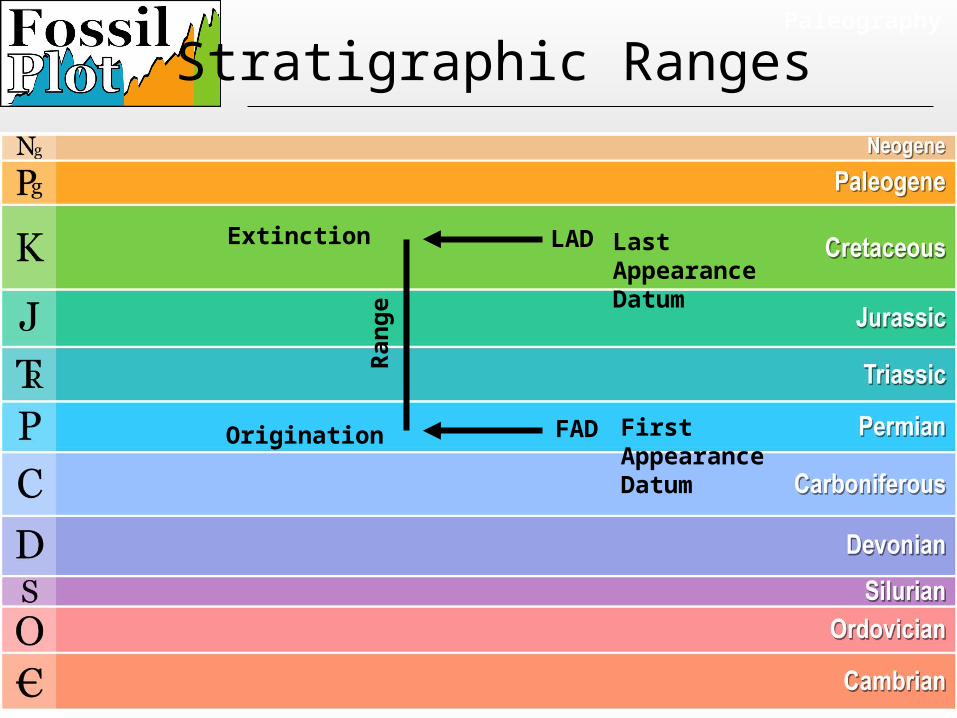
FAD
LAD
FirstAppearanceDatum
LastAppearanceDatum
Ran
ge
Extinction
Paleography
Stratigraphic Ranges
Origination
Paleography
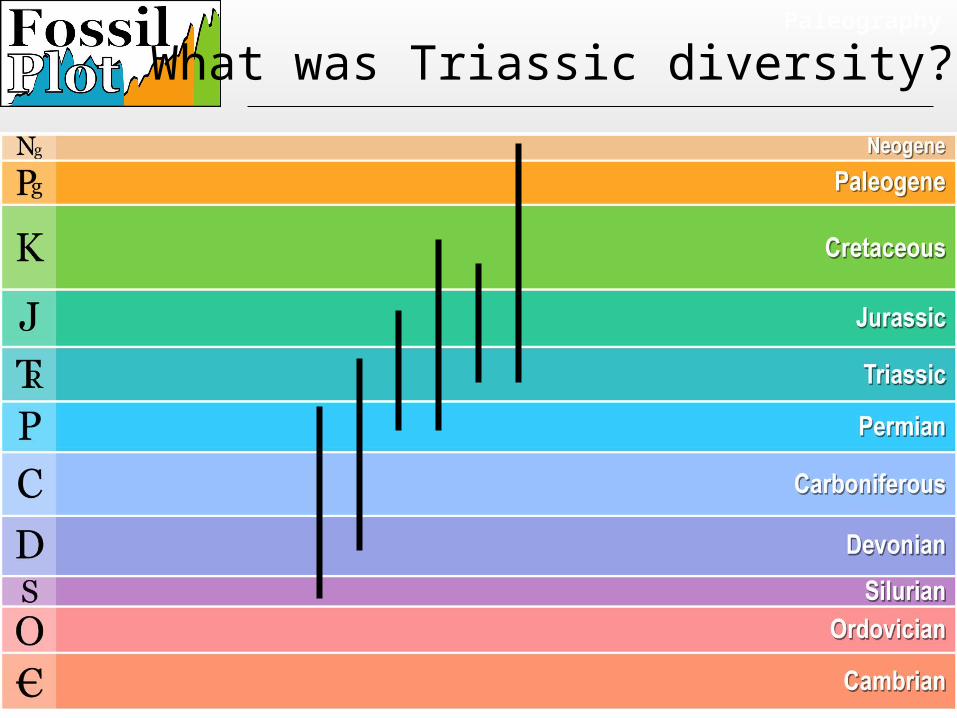
What was Triassic diversity?
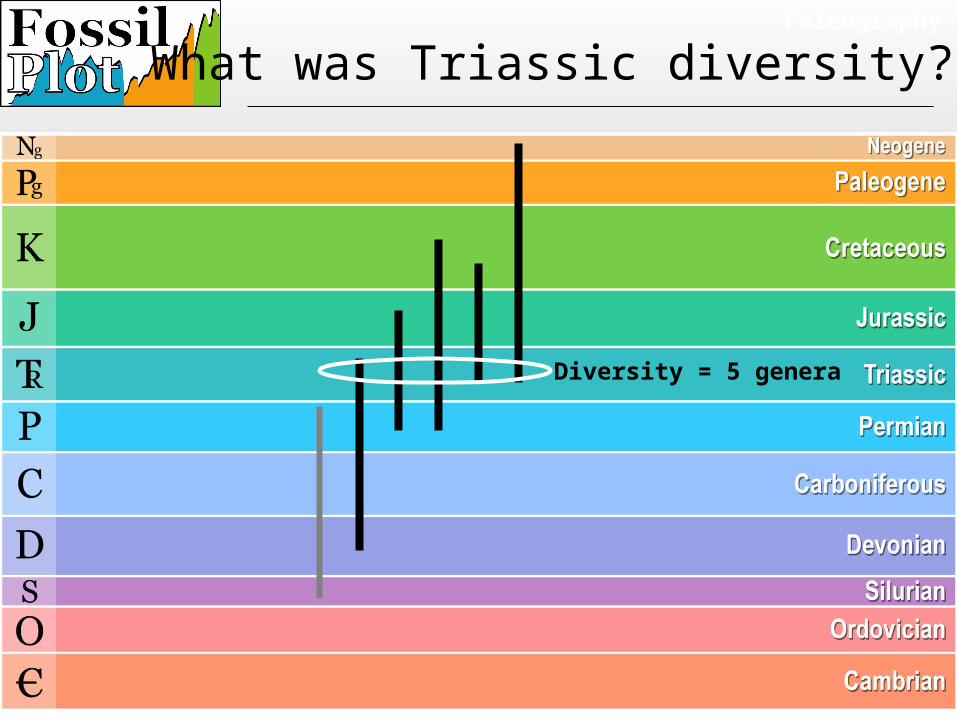
Diversity = 5 genera
Paleography
What was Triassic diversity?
Paleography
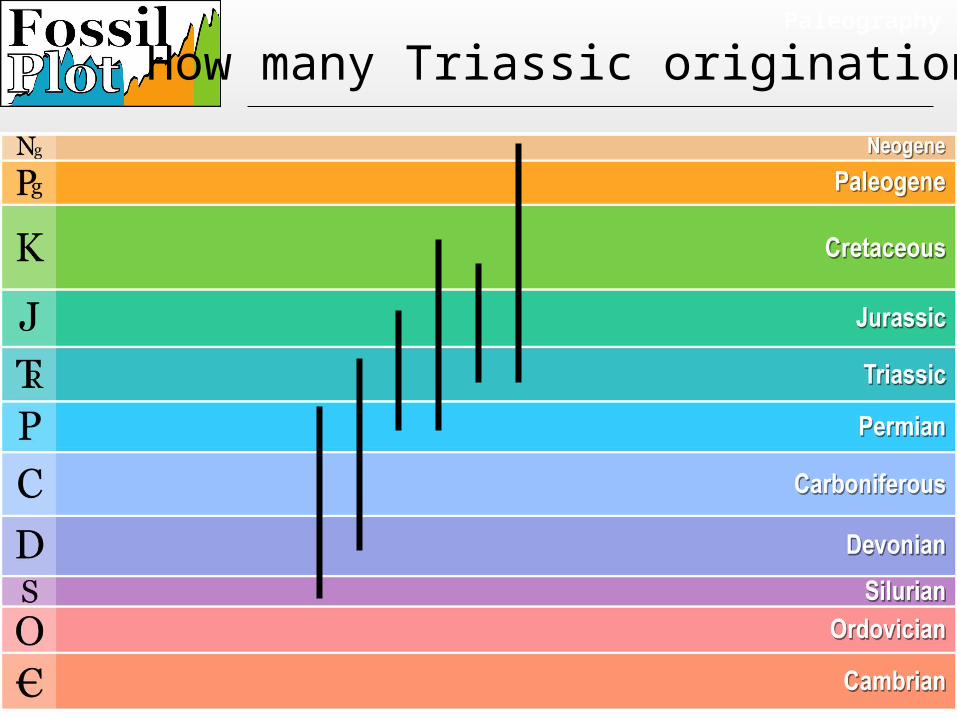
How many Triassic originations?
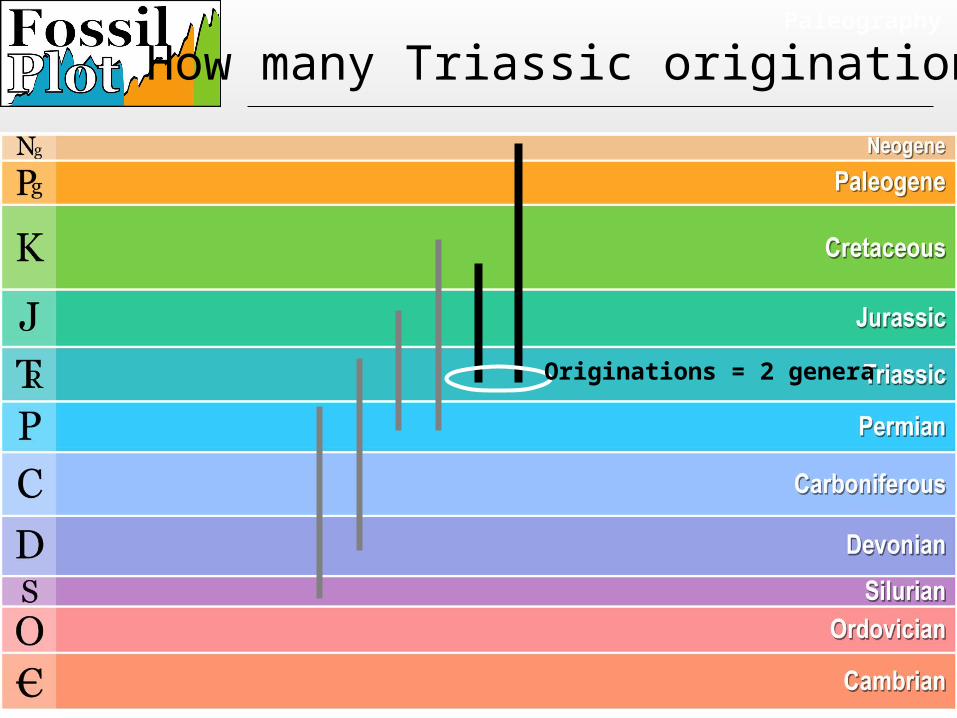
Originations = 2 genera
Paleography
How many Triassic originations?

Paleography
How many Triassic extinctions?
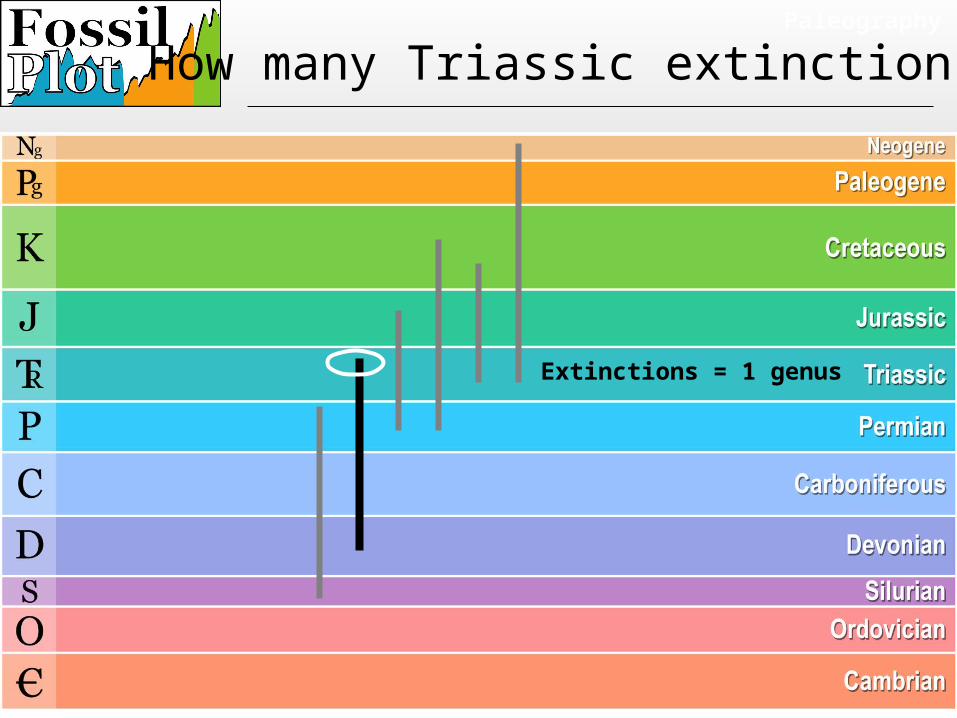
Extinctions = 1 genus
Paleography
How many Triassic extinctions?
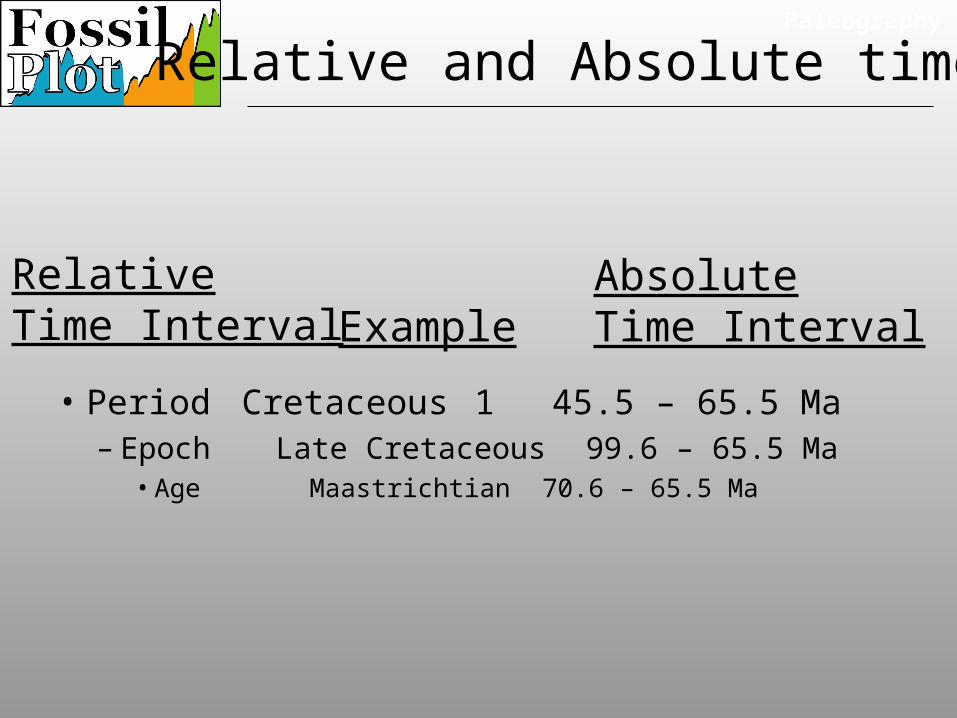
• Period Cretaceous 1 45.5 – 65.5 Ma– Epoch Late Cretaceous 99.6 – 65.5 Ma
• Age Maastrichtian 70.6 – 65.5 Ma
Example
Paleography
RelativeTime Interval
AbsoluteTime Interval
Relative and Absolute time
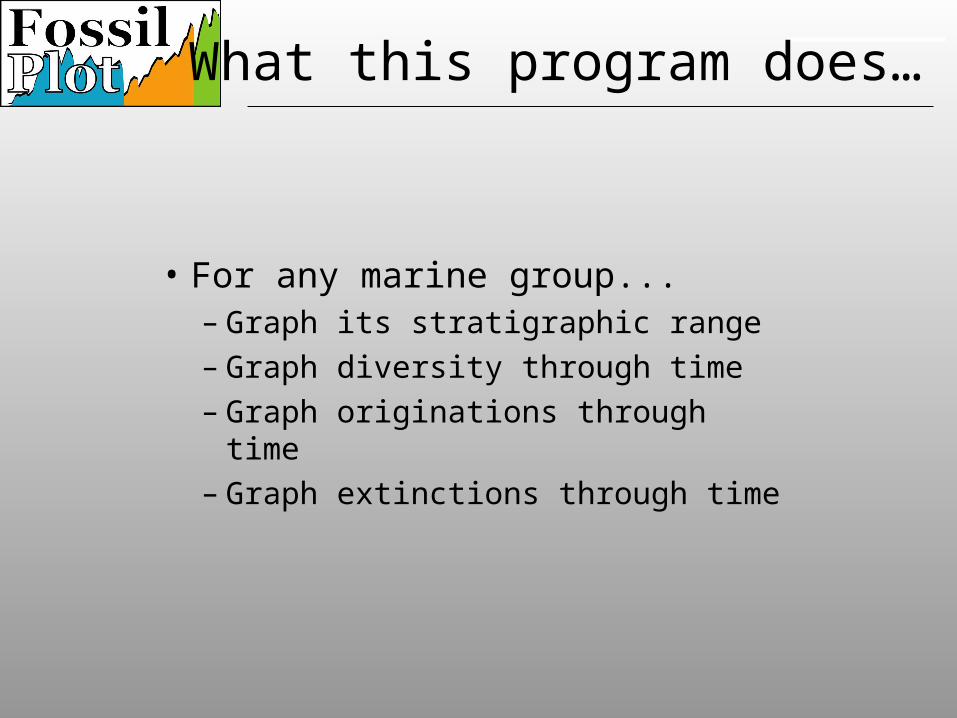
• For any marine group...– Graph its stratigraphic range– Graph diversity through time– Graph originations through
time– Graph extinctions through time
What this program does…
Paleography
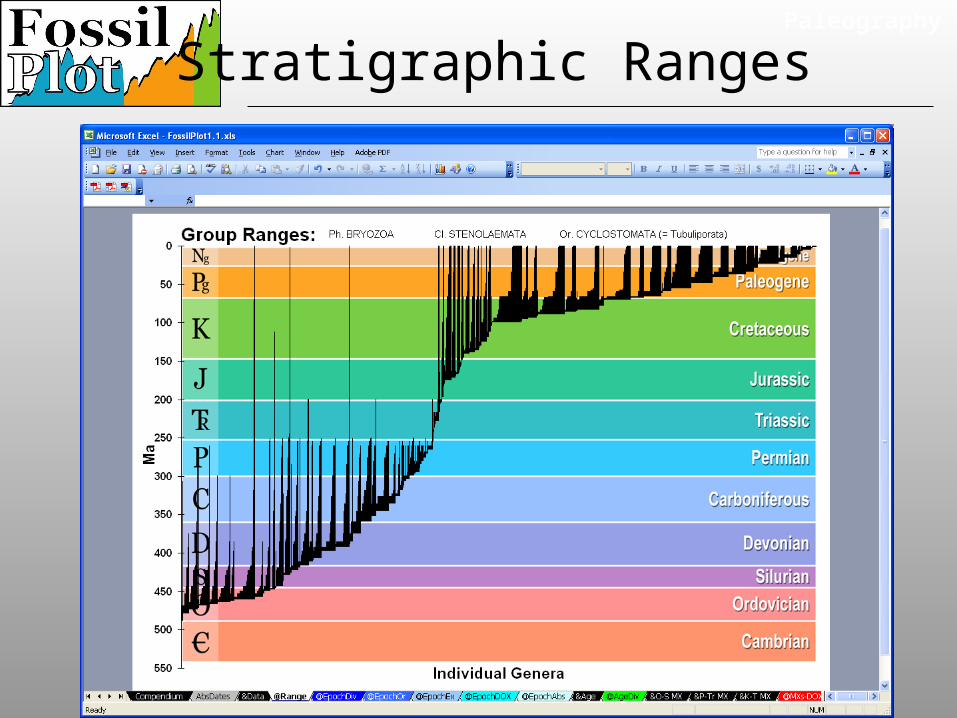
Stratigraphic Ranges
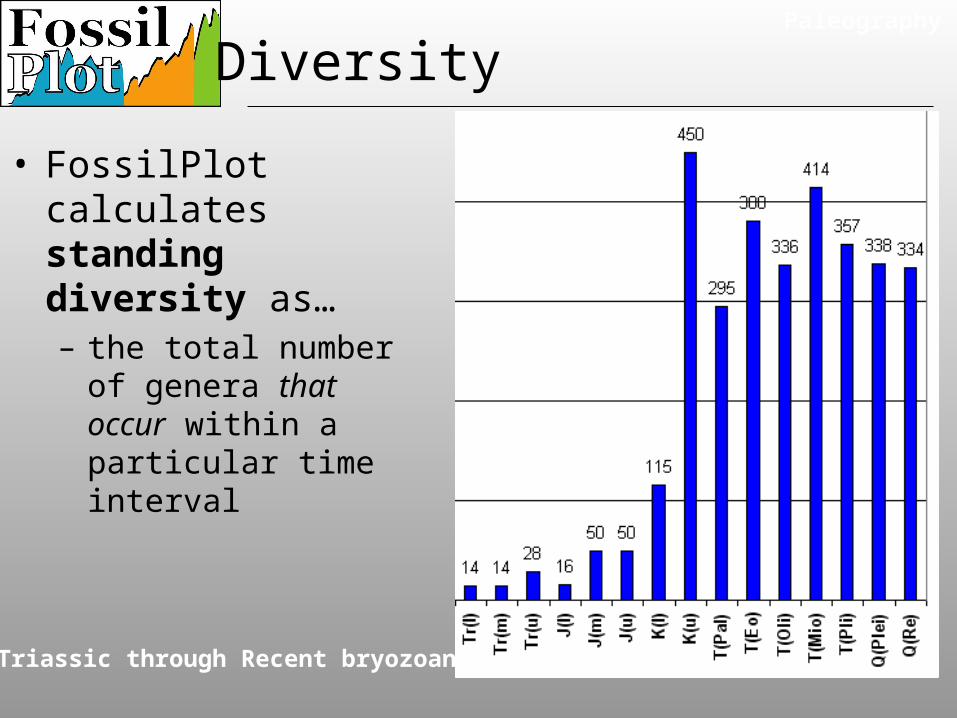
• FossilPlot calculates standing diversity as…– the total number of
genera that occur within a particular time interval
Paleography
Diversity
Triassic through Recent bryozoans
Paleography
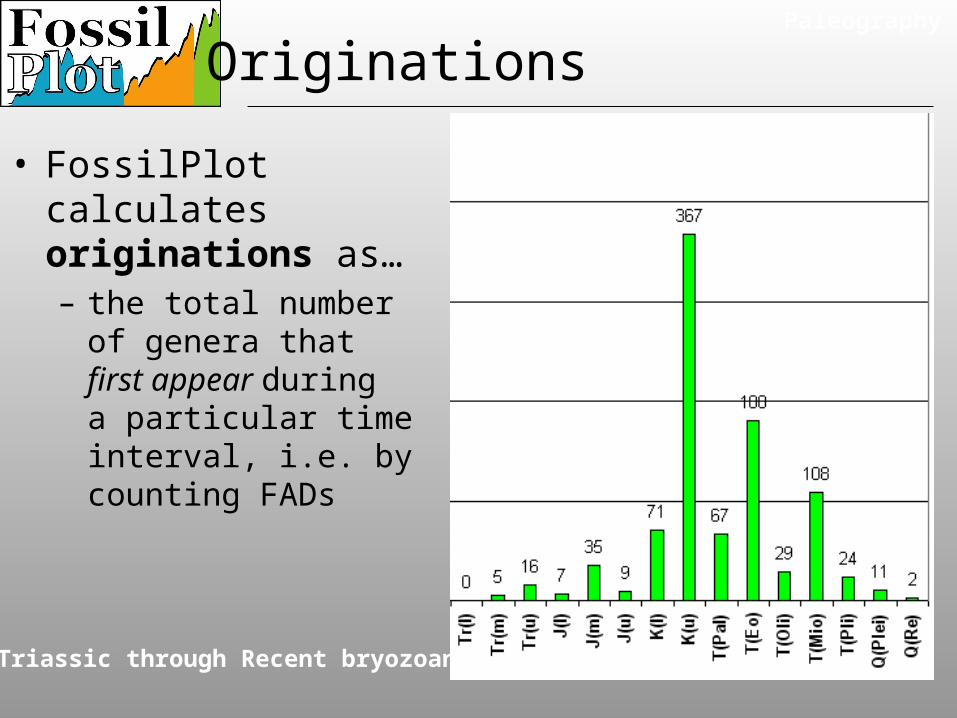
Originations
Triassic through Recent bryozoans
• FossilPlot calculates originations as…– the total number of
genera that first appear during a particular time interval, i.e. by counting FADs
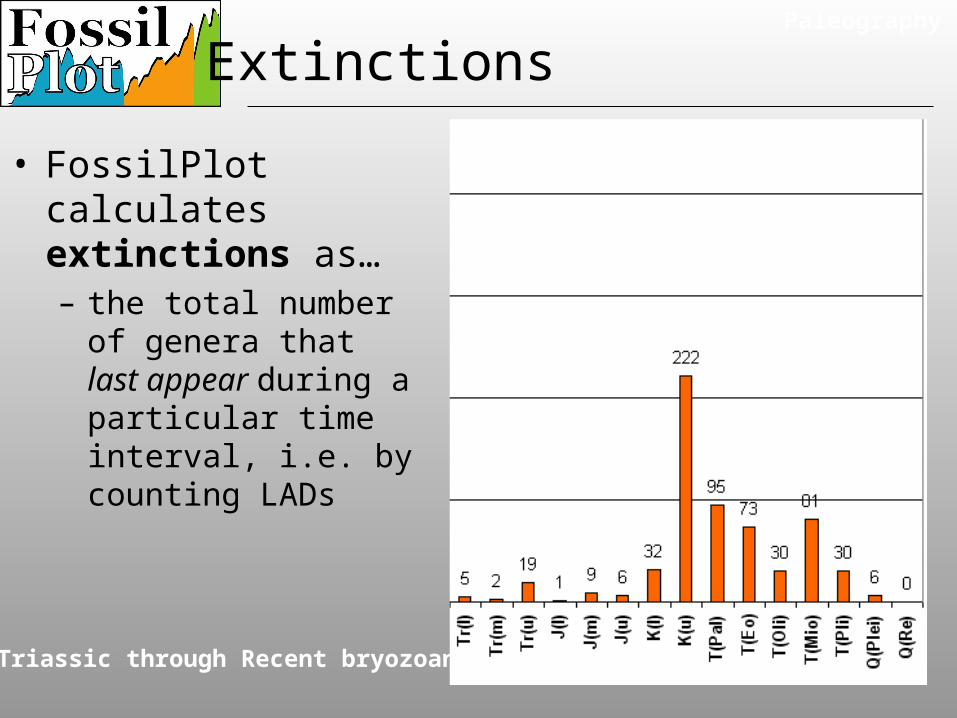
• FossilPlot calculates extinctions as…– the total number of
genera that last appear during a particular time interval, i.e. by counting LADs
Paleography
Extinctions
Triassic through Recent bryozoans
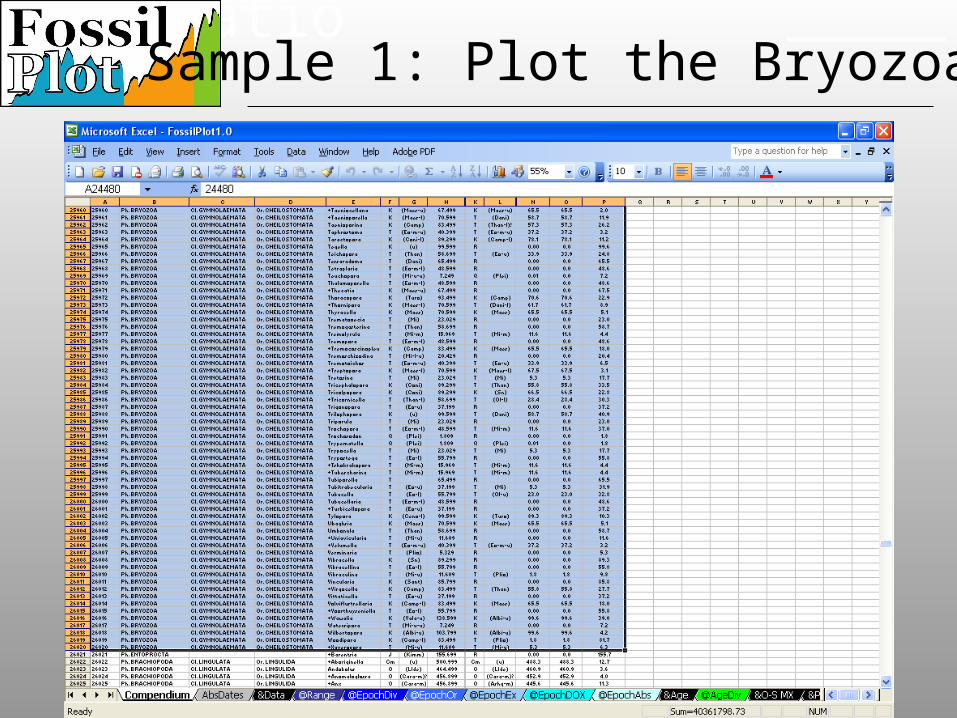
SpeciationSample 1: Plot the Bryozoans
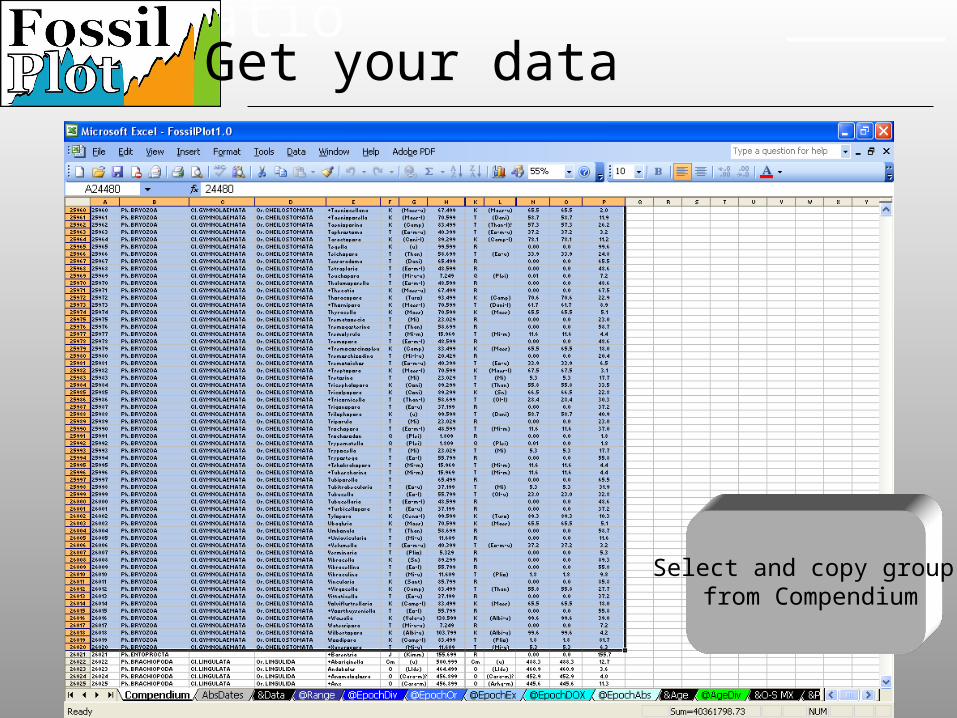
SpeciationGet your data
Select and copy group from Compendium
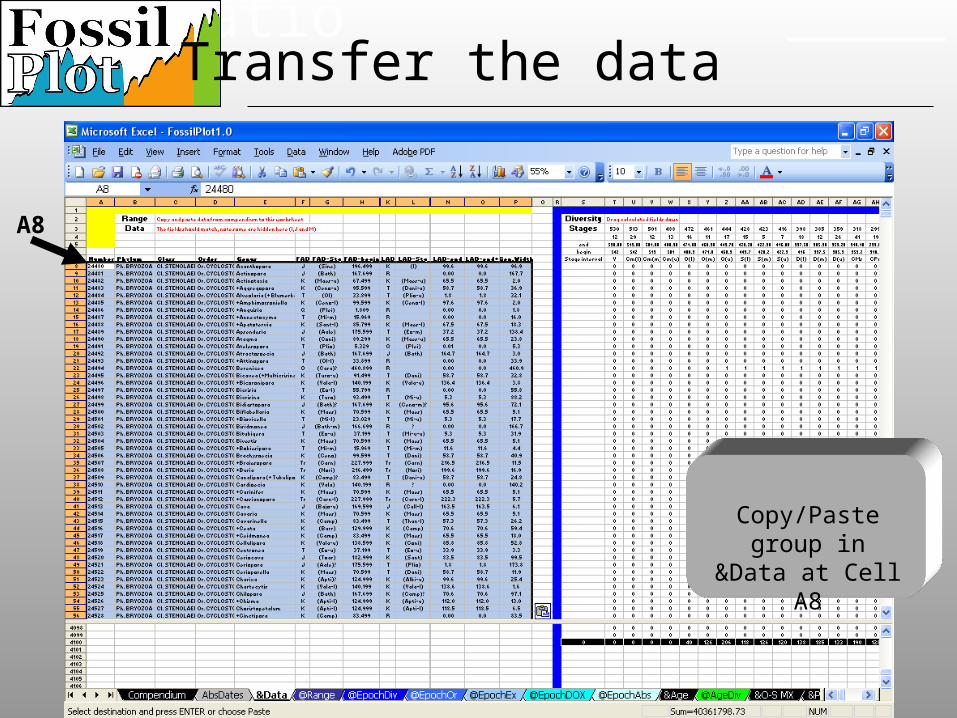
SpeciationTransfer the data
Copy/Paste group in &Data at Cell A8
A8
Speciation
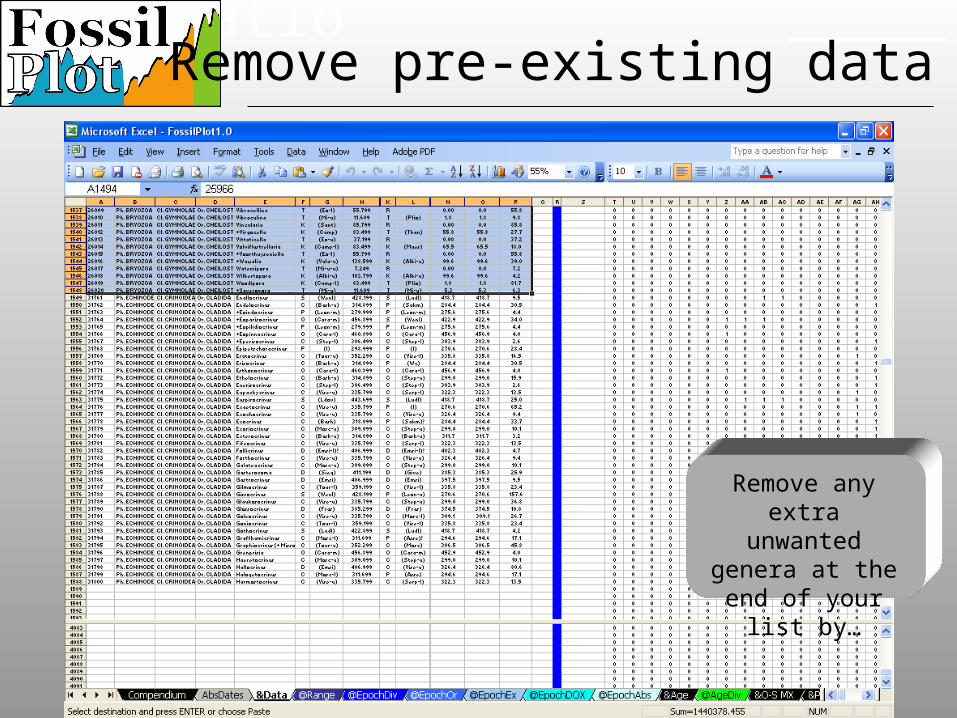
Remove any extra unwanted genera at the end of your list
by…
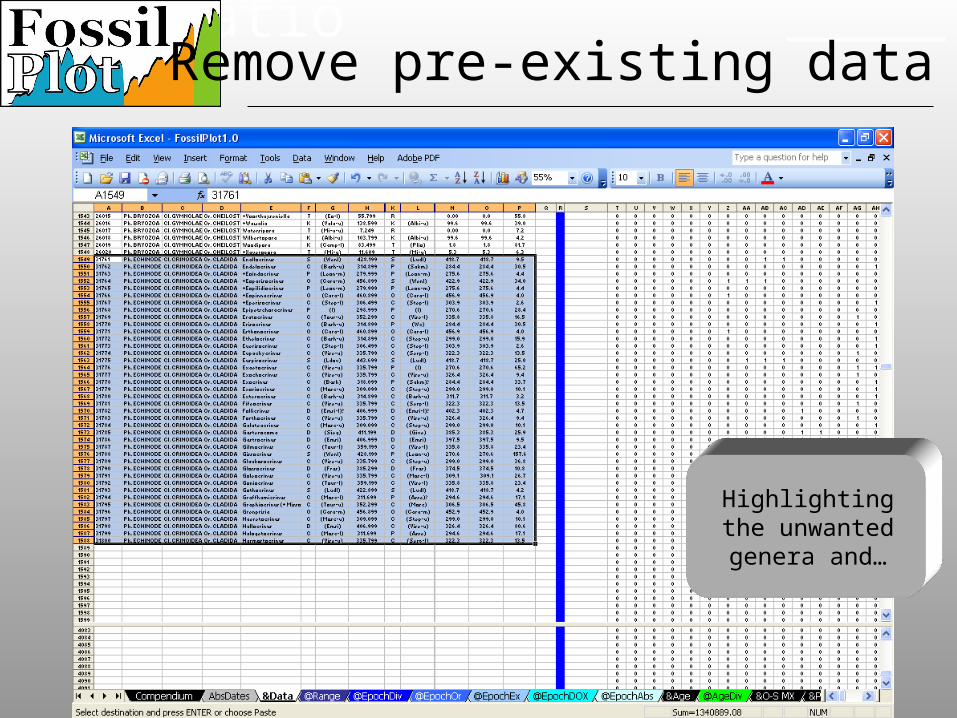
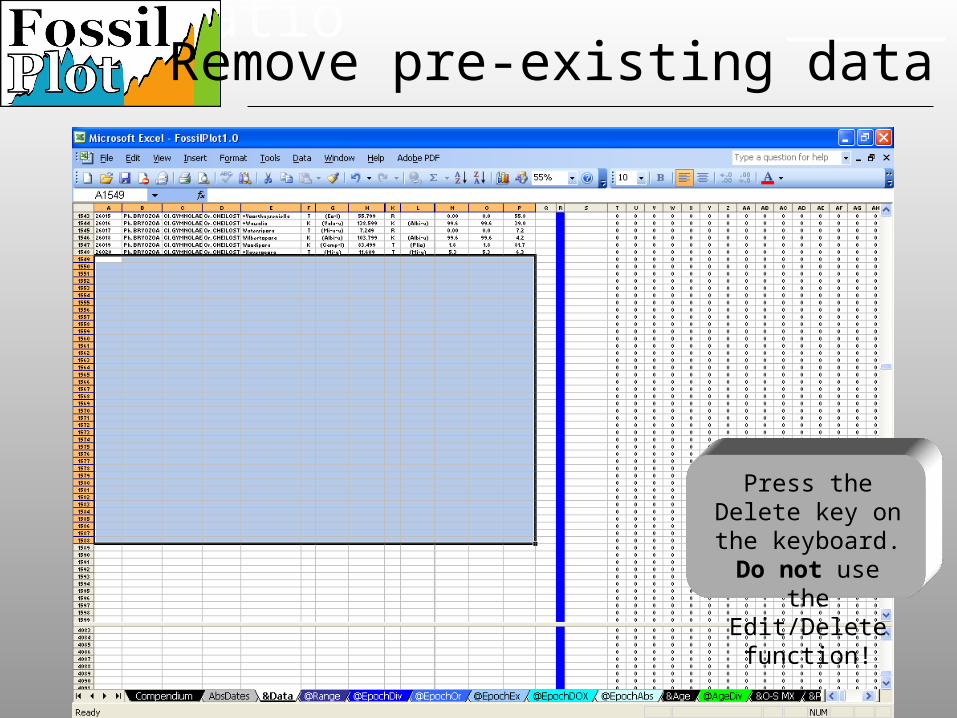
Remove pre-existing data
Speciation
Highlighting the unwanted genera
and…
Remove pre-existing data
Speciation
Press the Delete key on the keyboard.Do not use the
Edit/Delete function!
Remove pre-existing data
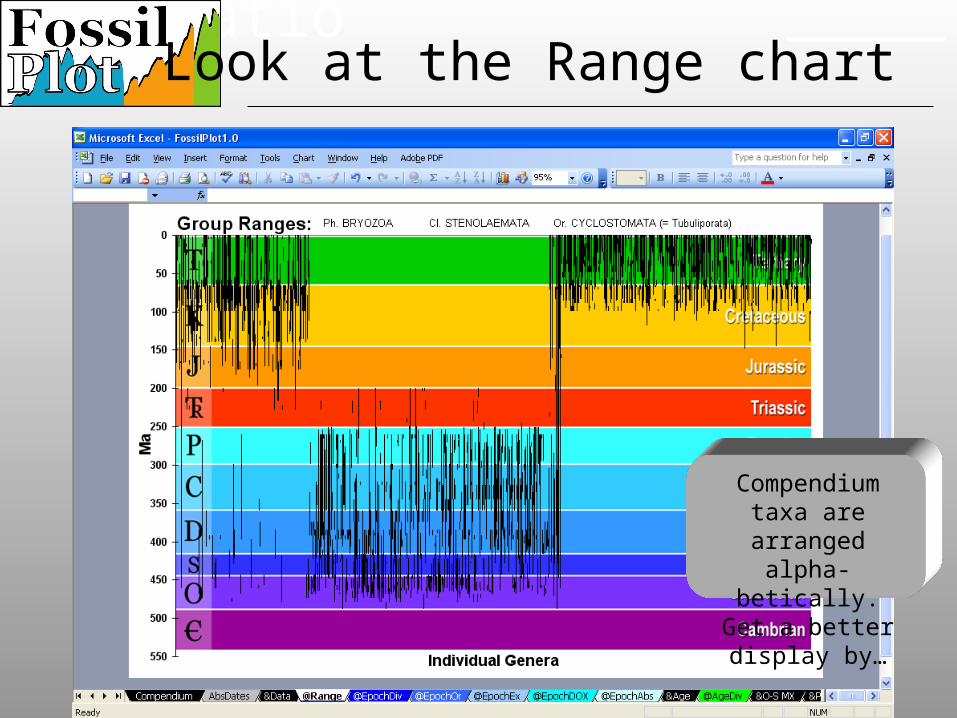
SpeciationLook at the Range chart
Compendium taxa are arranged alpha-
betically. Get a better display by…
Speciation
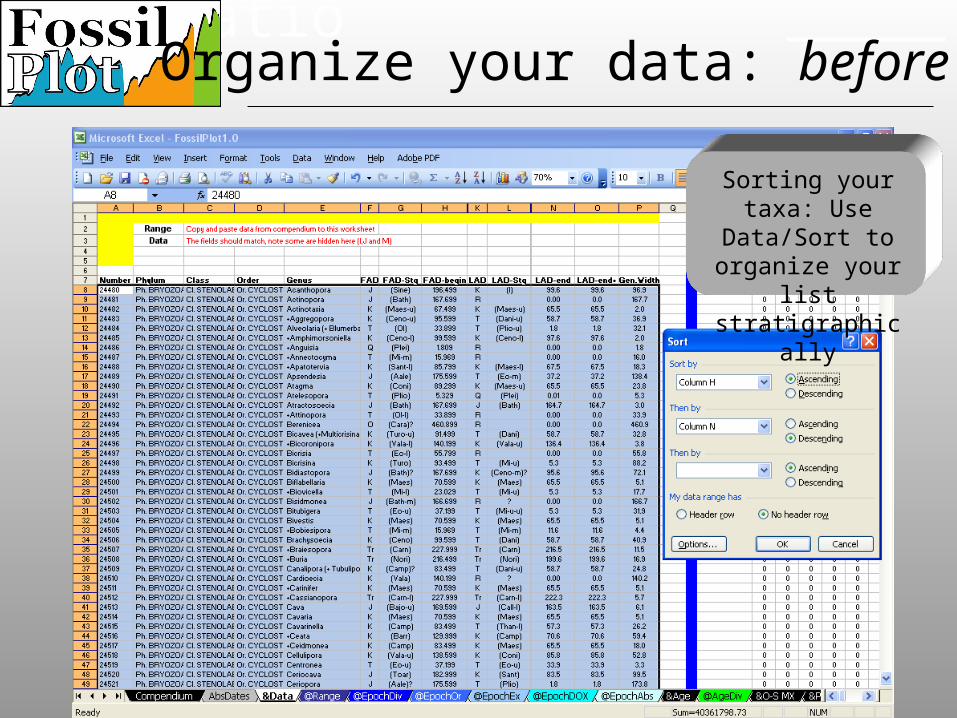
Sorting your taxa: Use Data/Sort to organize your list stratigraphically
Organize your data: before
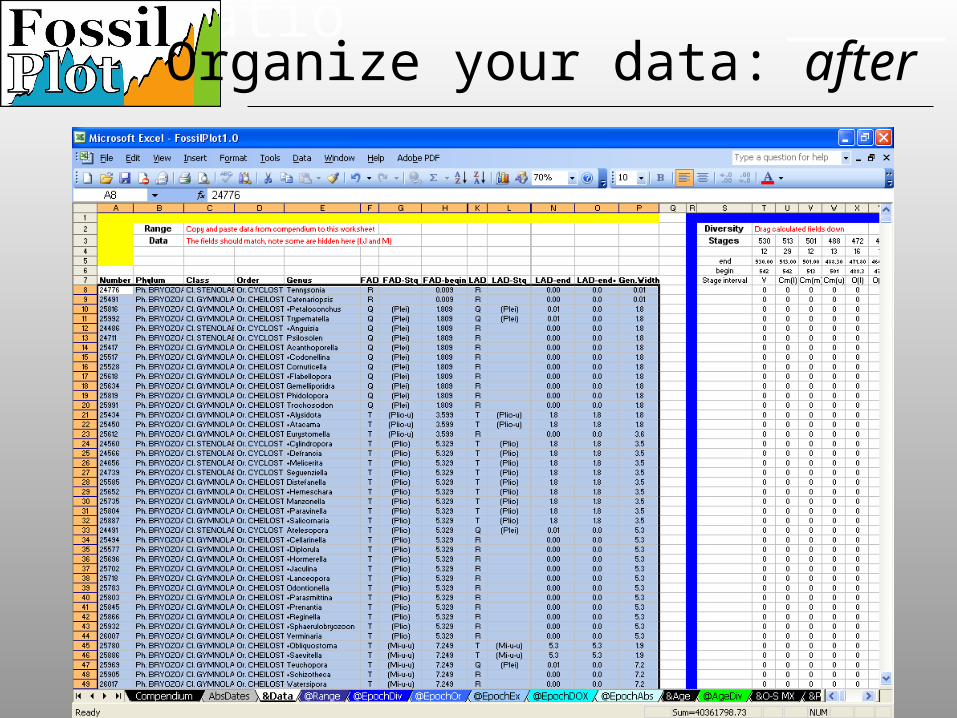
SpeciationOrganize your data: after
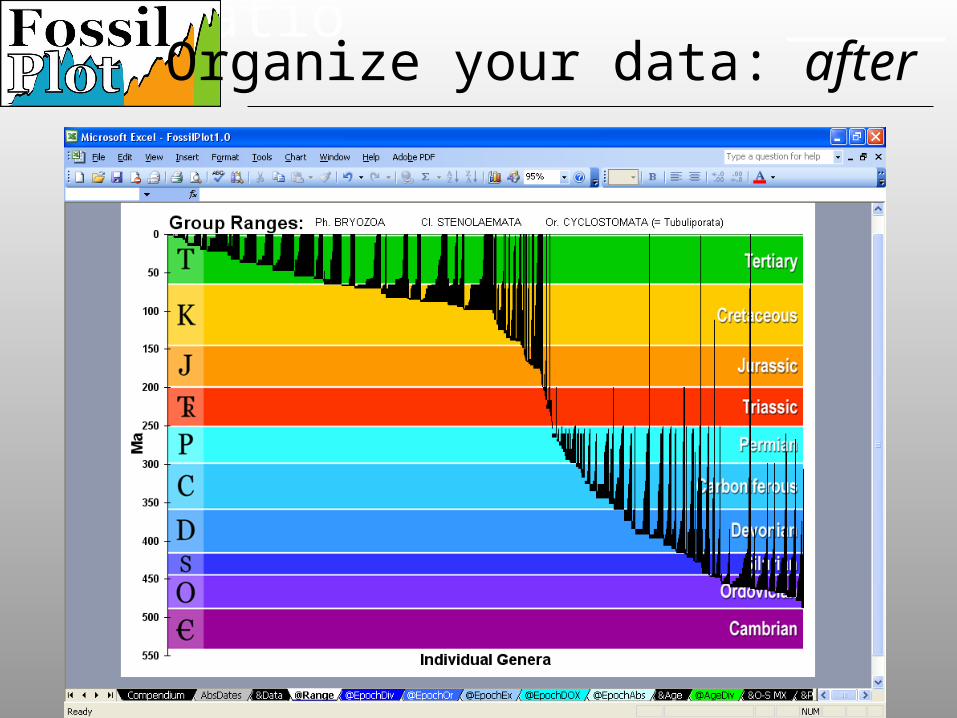
SpeciationOrganize your data: after
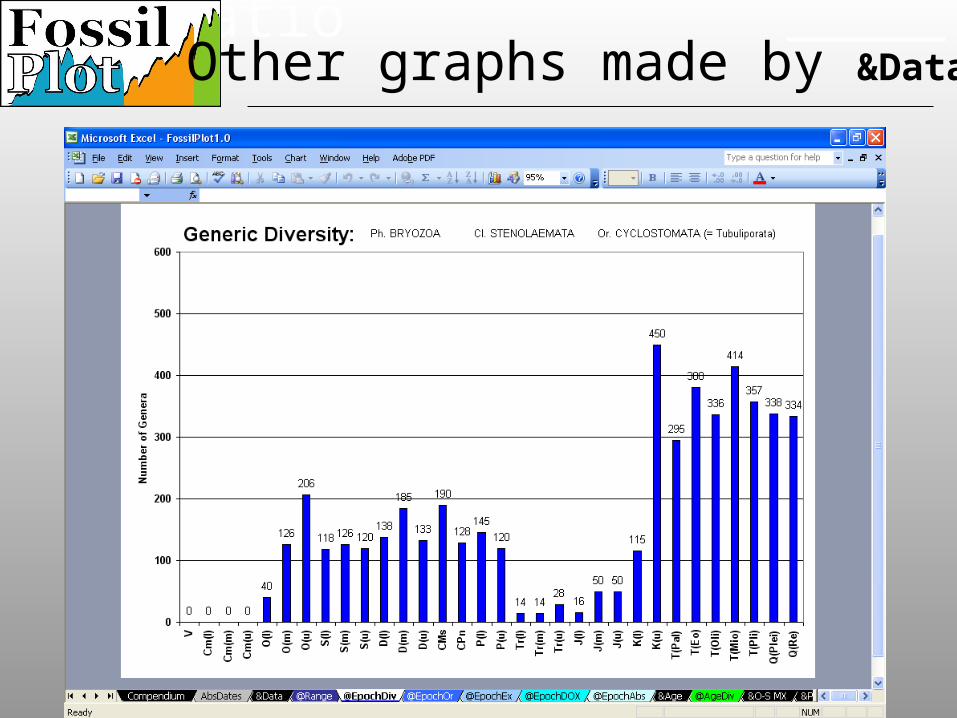
SpeciationOther graphs made by &Data
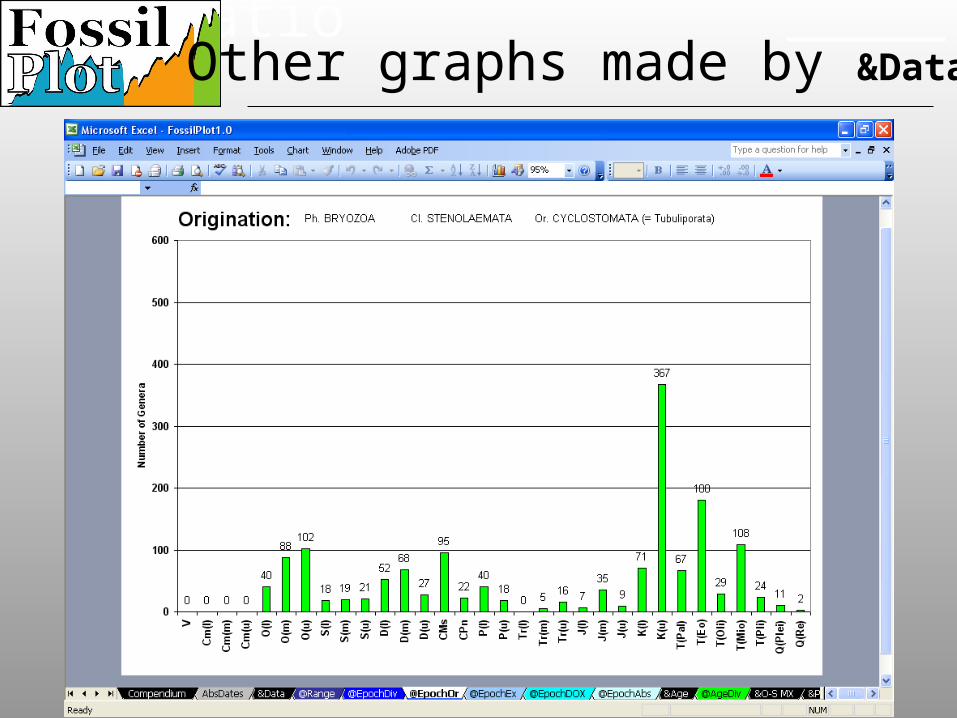
SpeciationOther graphs made by &Data
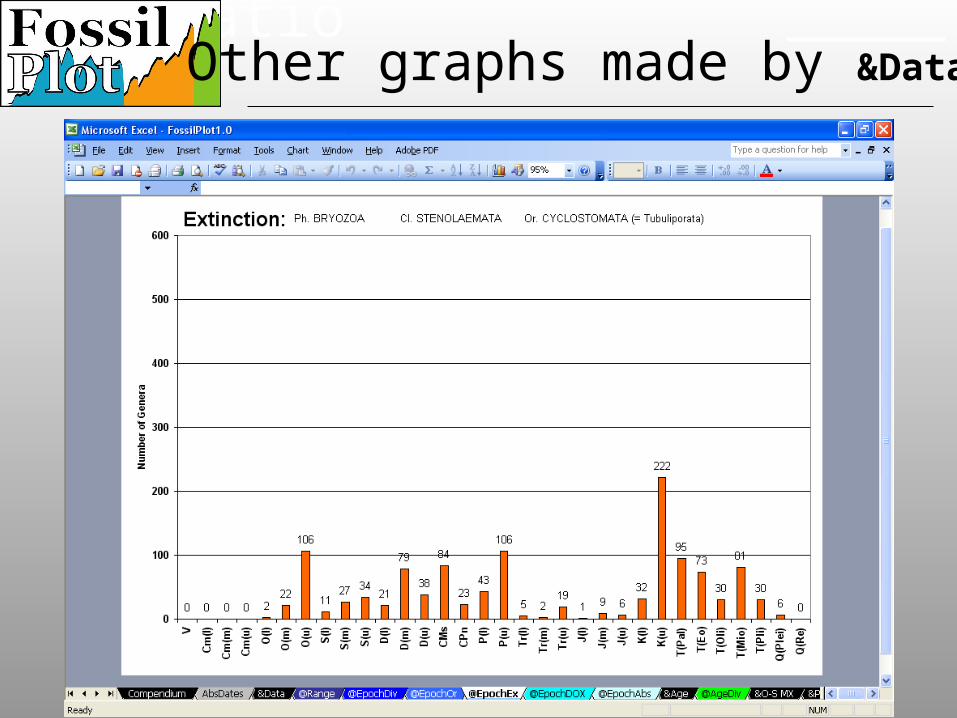
SpeciationOther graphs made by &Data
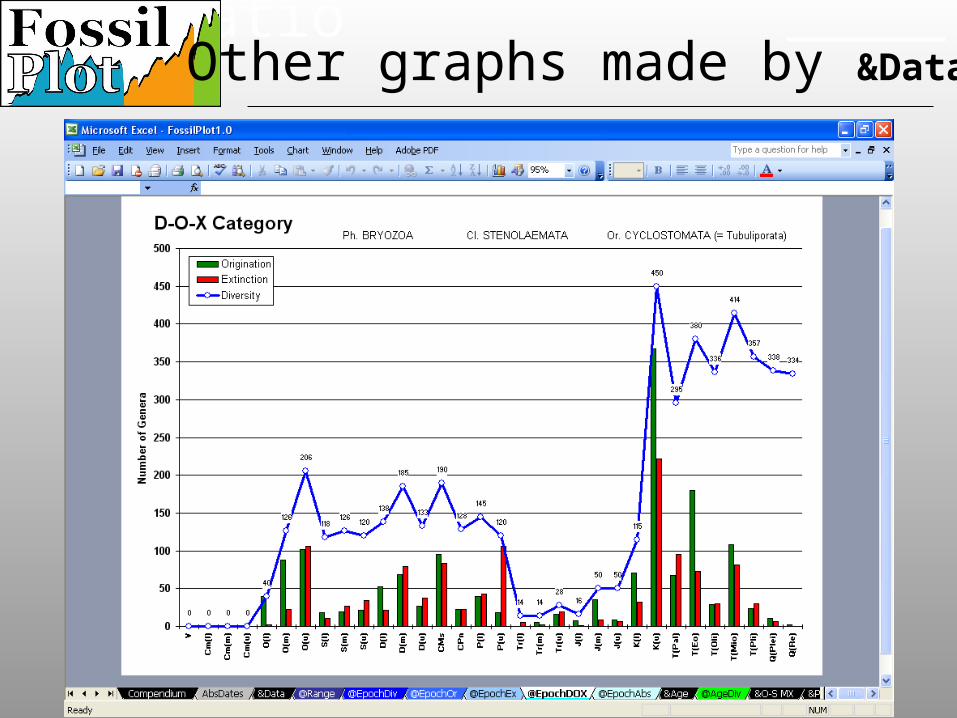
SpeciationOther graphs made by &Data
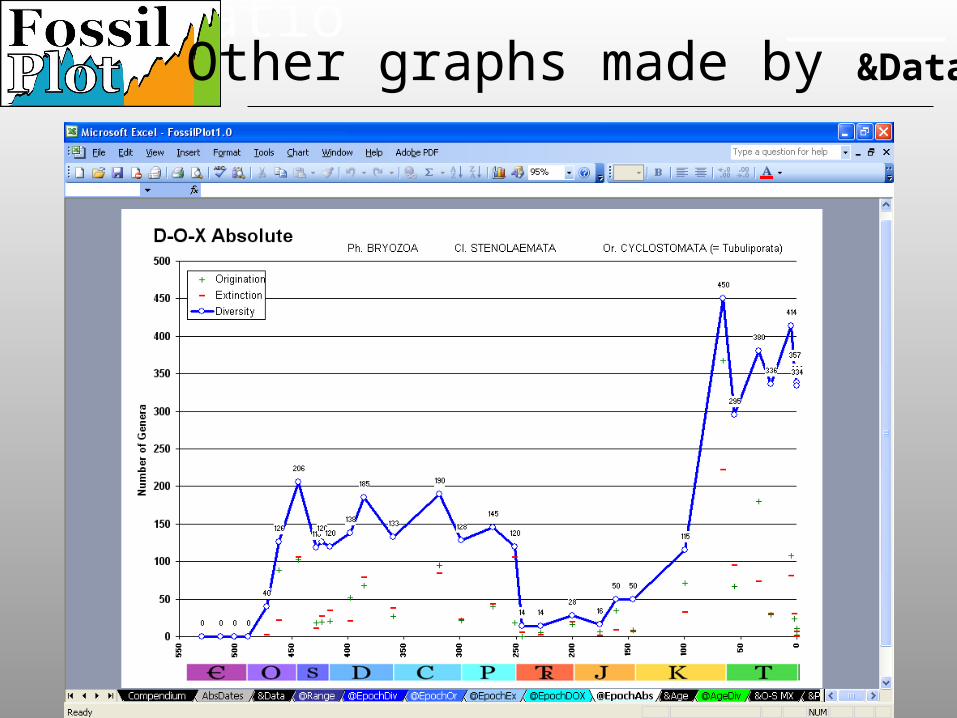
SpeciationOther graphs made by &Data
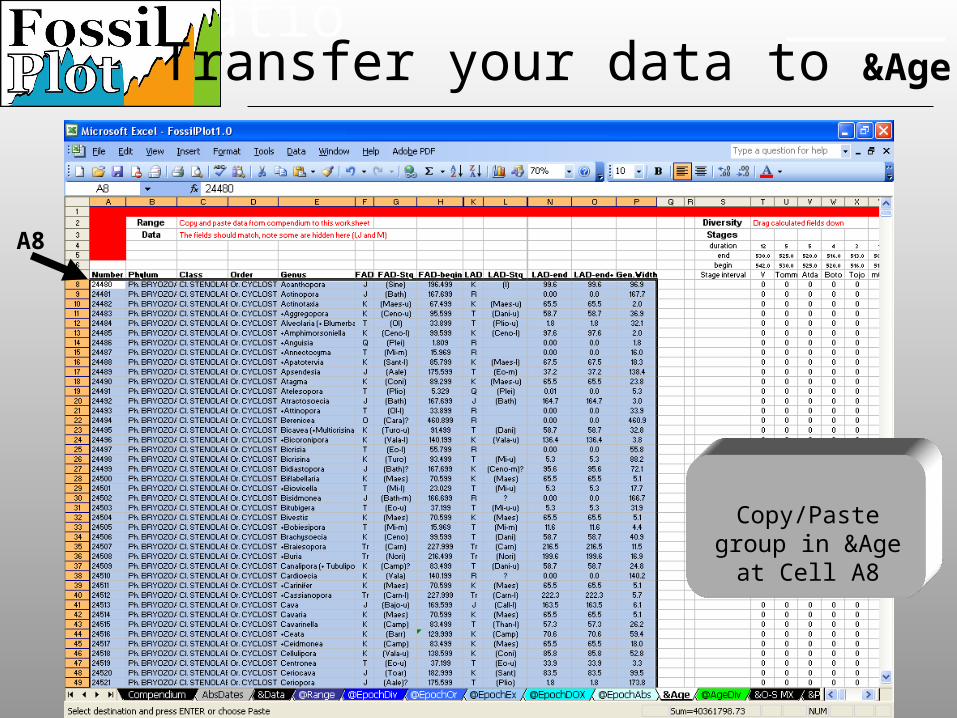
SpeciationTransfer your data to &Age
Copy/Paste group in &Age at Cell A8
A8
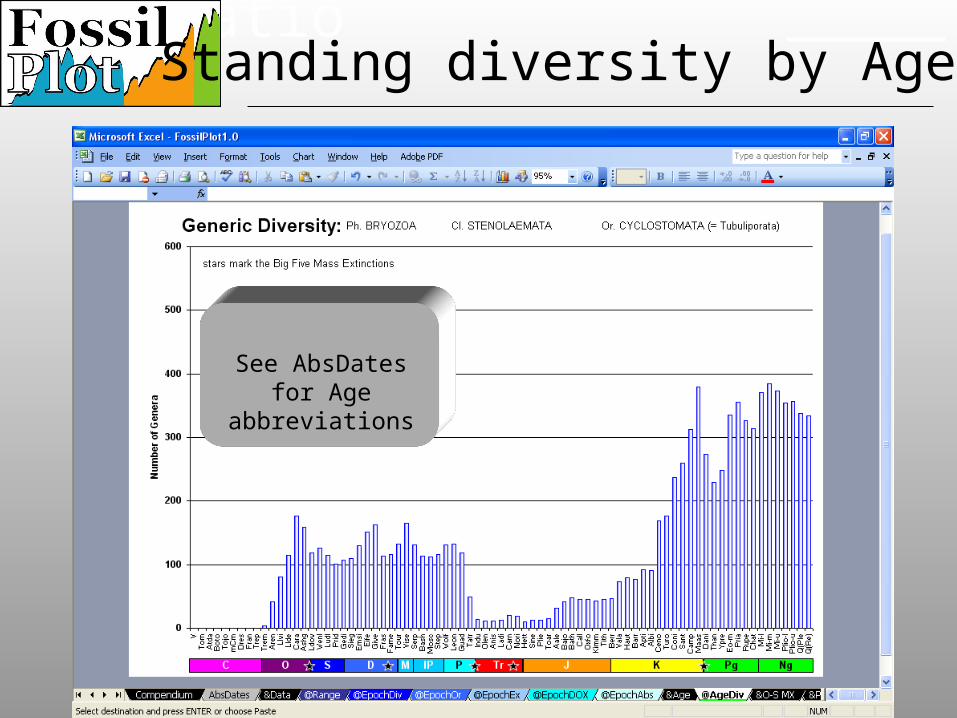
SpeciationStanding diversity by Age
See AbsDates for Age abbreviations
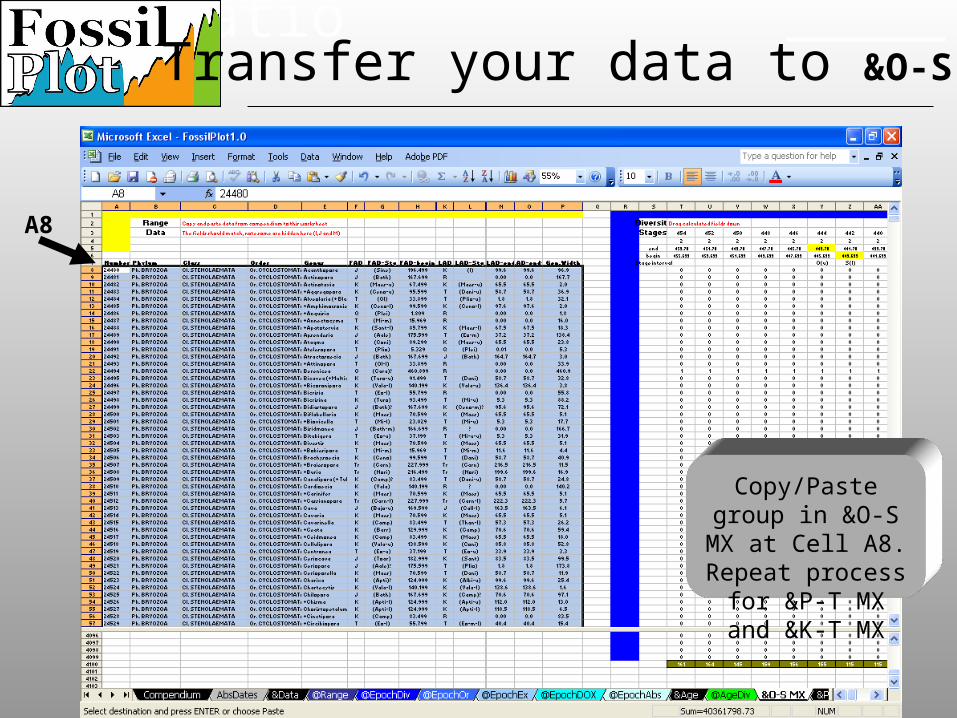
SpeciationTransfer your data to &O-S MX
Copy/Paste group in &O-S MX at Cell A8.
Repeat process for &P-T MX and &K-T MX
A8
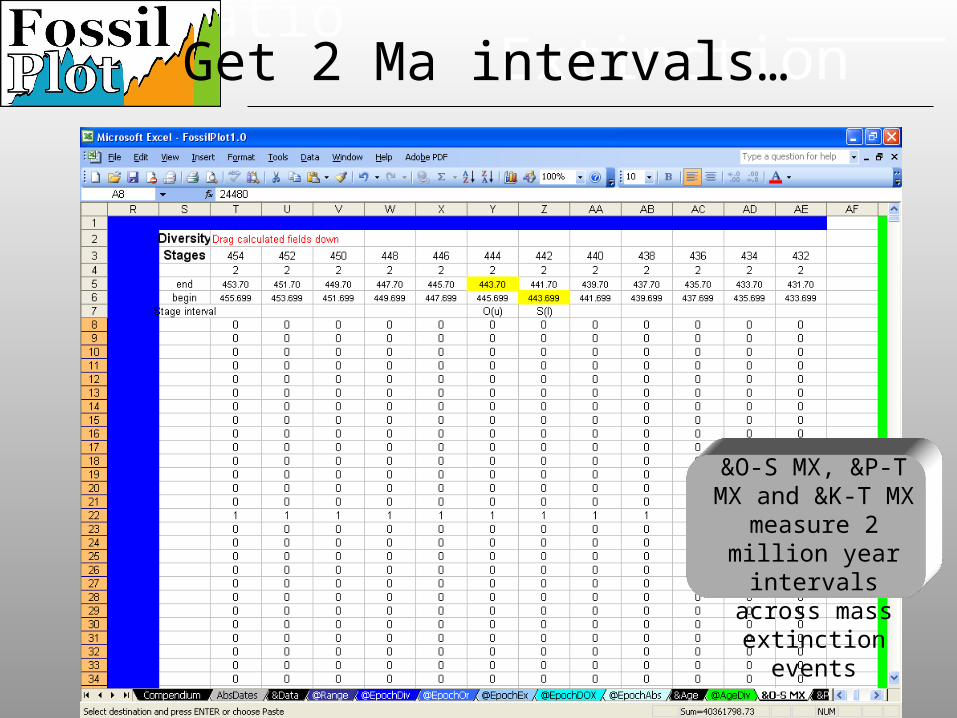
Speciation ExtinctionGet 2 Ma intervals…
&O-S MX, &P-T MX and &K-T MX measure 2 million year intervals
across mass extinction events
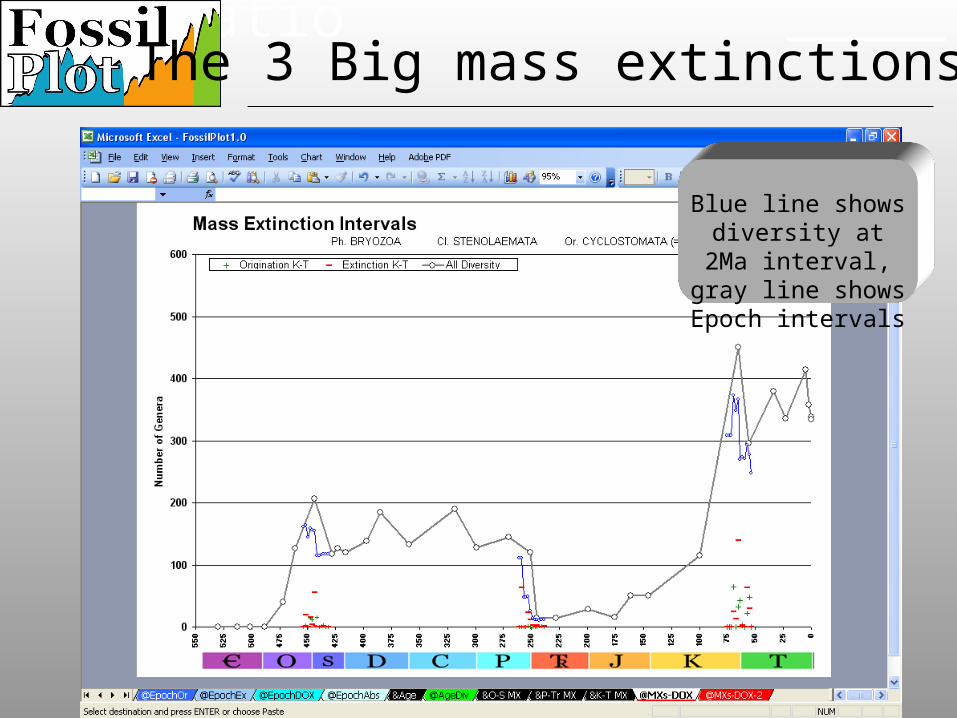
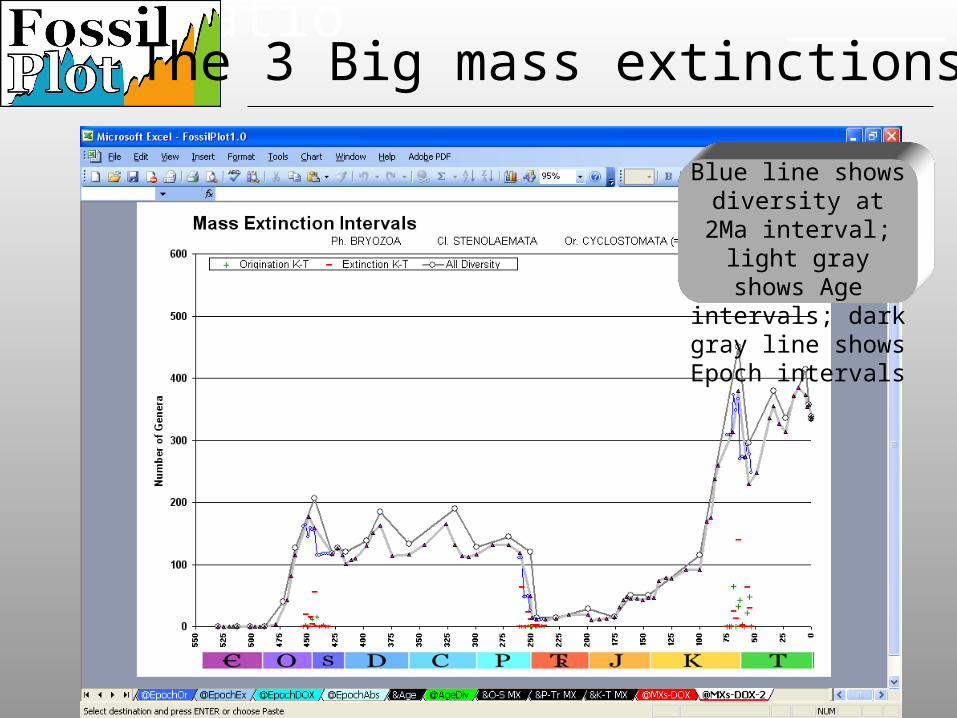
SpeciationThe 3 Big mass extinctions
Blue line shows diversity at 2Ma interval, gray line shows Epoch intervals
Speciation
Blue line shows diversity at 2Ma interval; light gray
shows Age intervals; dark gray line shows
Epoch intervals
The 3 Big mass extinctions
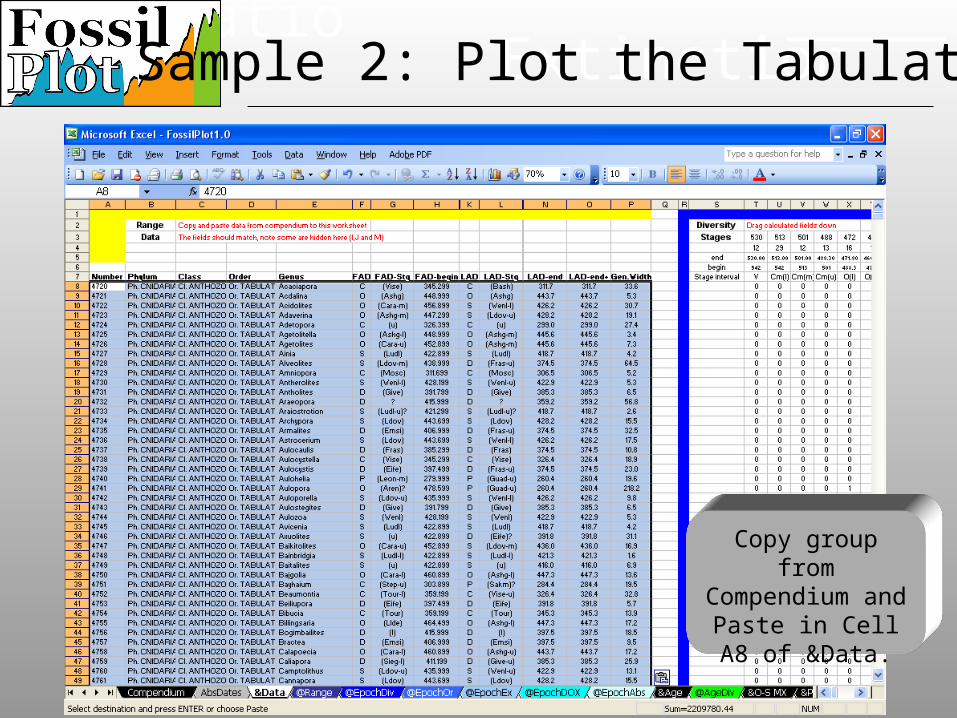
Speciation ExtinctionSample 2: Plot the Tabulates
Copy group from Compendium and Paste in Cell A8 of
&Data.
Speciation
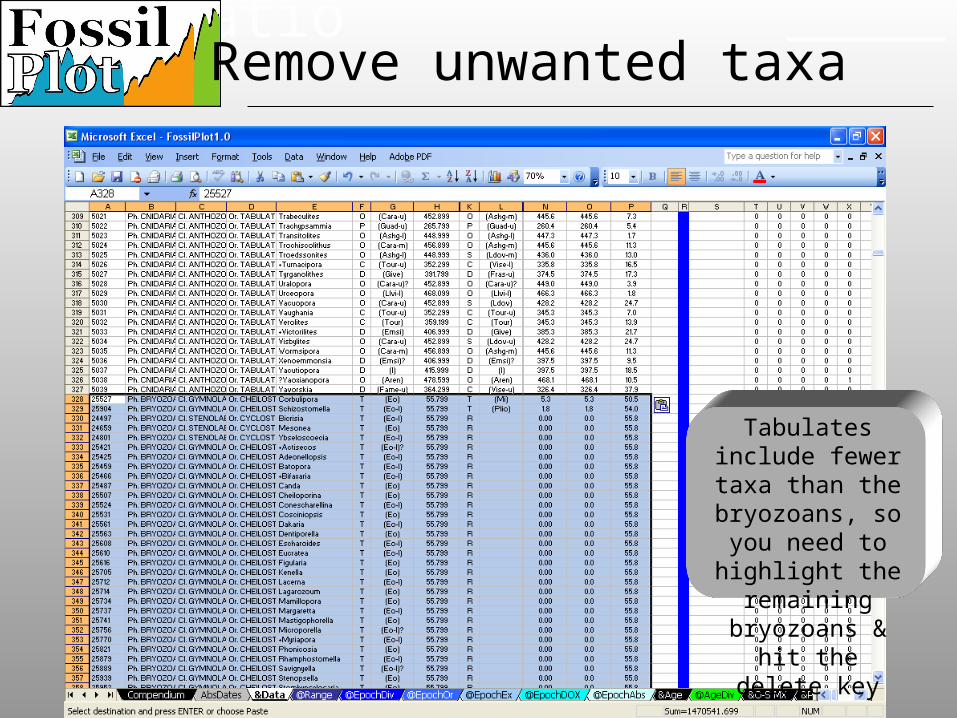
Tabulates include fewer taxa than the bryozoans, so you
need to highlight the remaining bryozoans & hit the delete key
Remove unwanted taxa

SpeciationRange chart squeezed to left
This common problem can be fixed
by changing the source data: follow
these steps…
Speciation
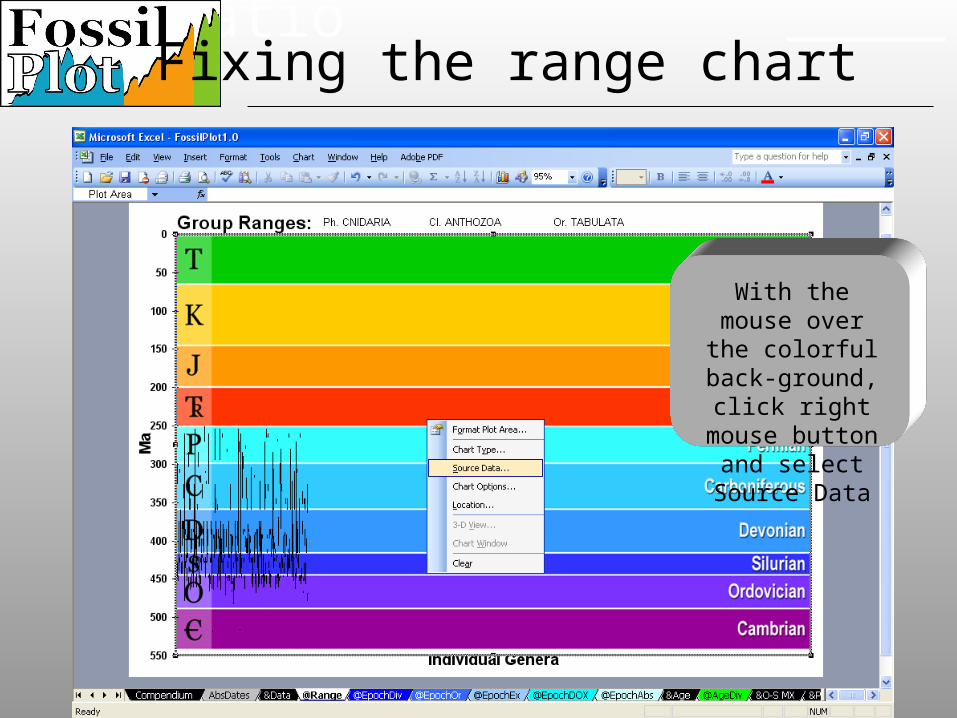
With the mouse over the colorful back-ground, click right mouse button and select Source Data
Fixing the range chart
Speciation
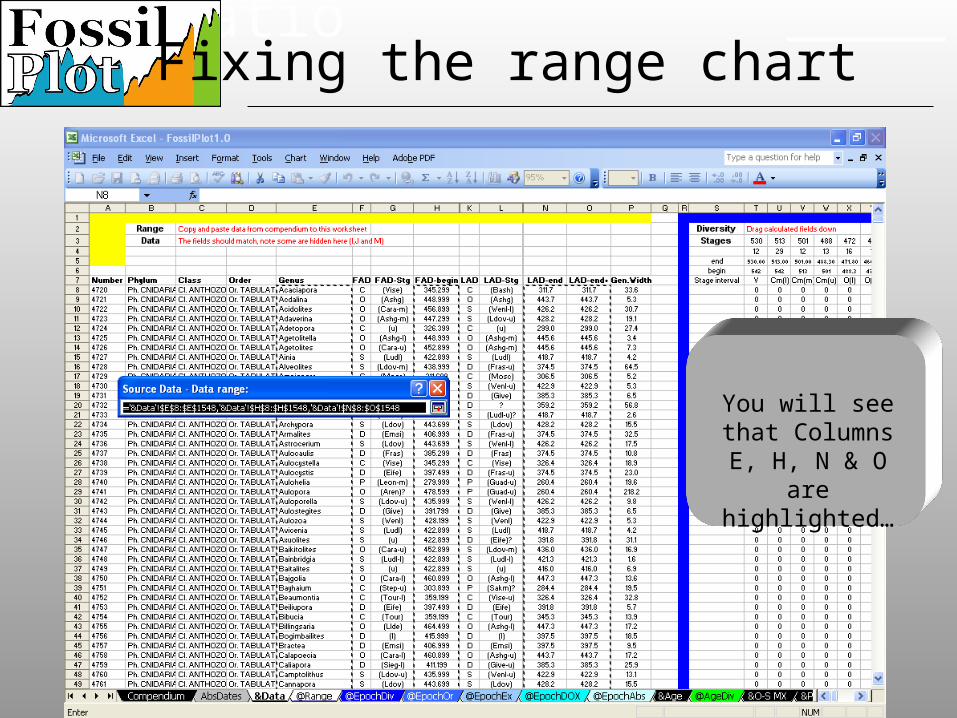
You will see that Columns E, H, N & O
are highlighted…
Fixing the range chart
Speciation
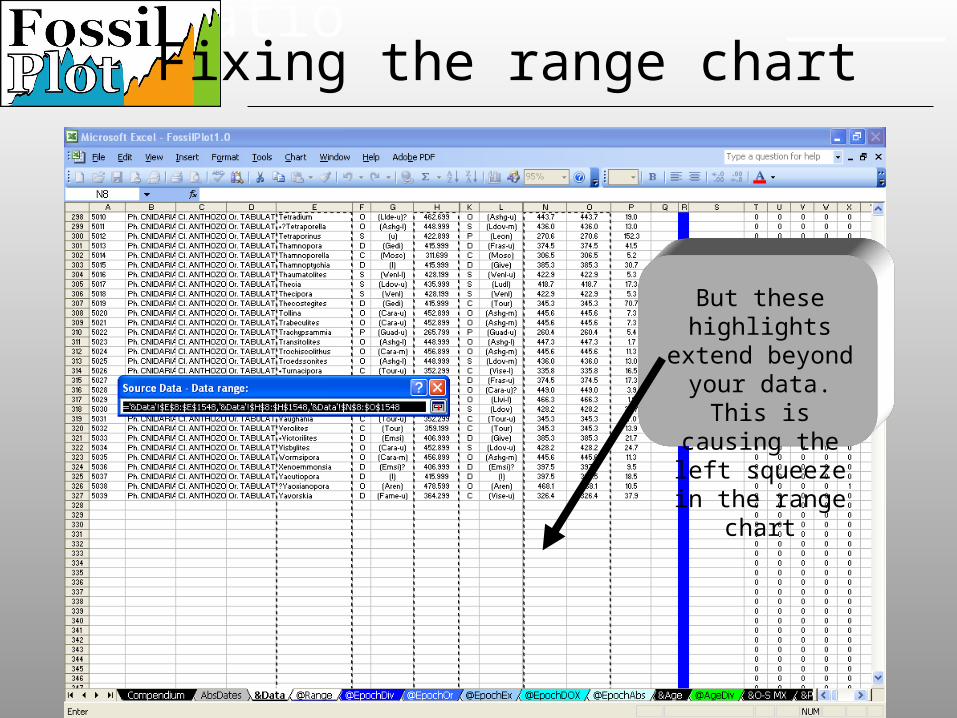
But these highlights extend beyond your data. This is causing
the left squeeze in the range chart
Fixing the range chart
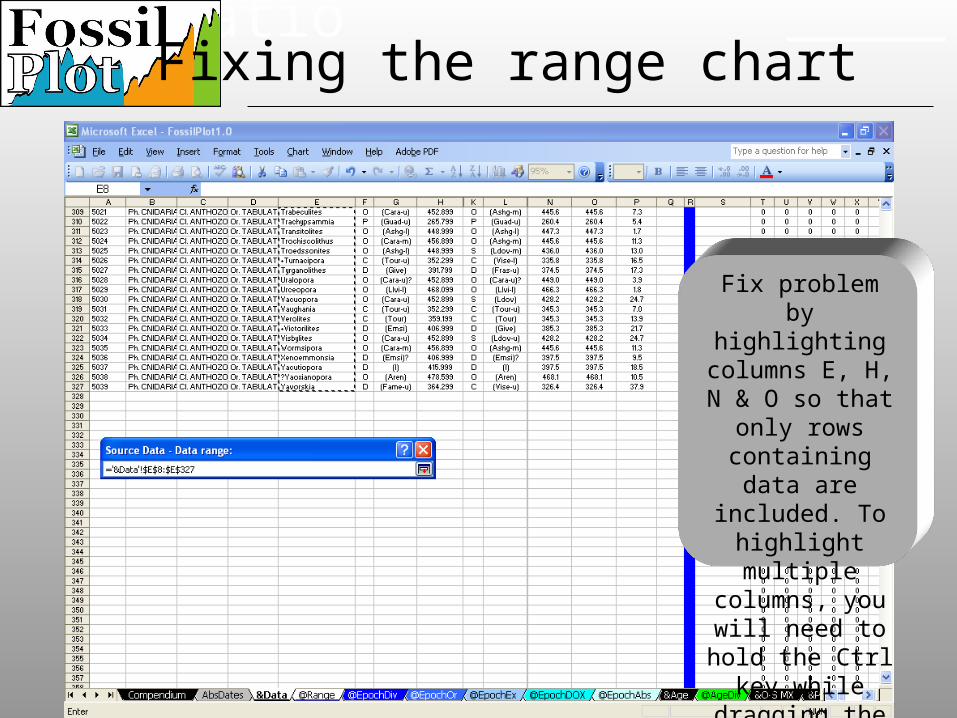
Speciation
Fix problem by highlighting columns E, H, N & O so that only rows containing data are included. To
highlight multiple columns, you will
need to hold the Ctrl key while dragging
the mouse
Fixing the range chart
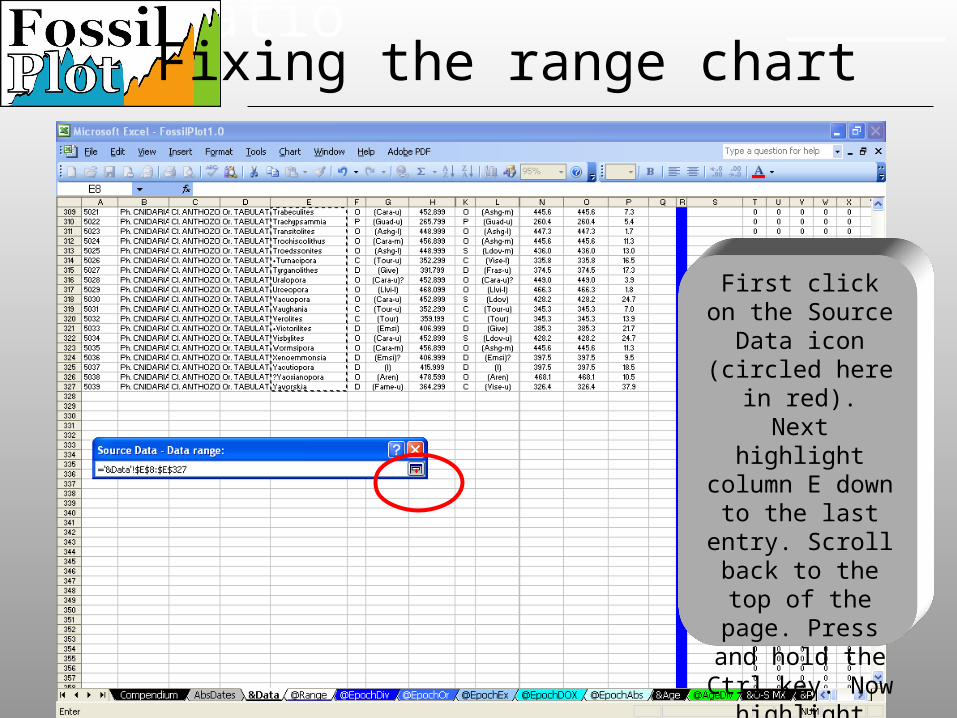
Speciation
First click on the Source Data icon
(circled here in red).Next highlight column
E down to the last entry. Scroll back to the top of the page. Press and hold the
Ctrl key. Now highlight column H.
Repeat for columns N and O (they can be
highlighted together).
Fixing the range chart
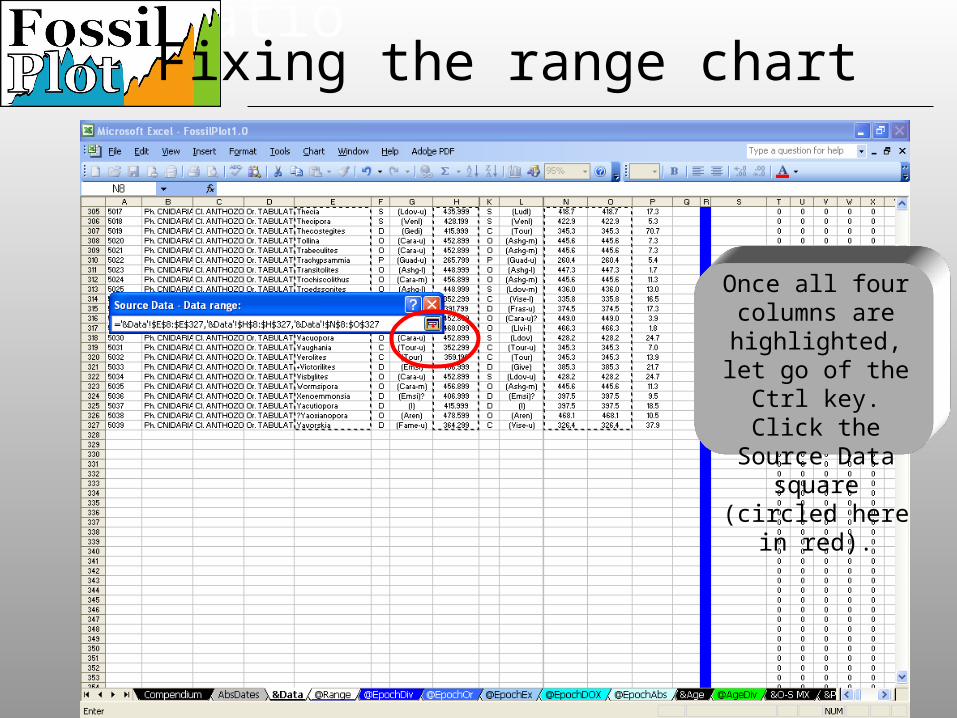
Speciation
Once all four columns are highlighted, let go
of the Ctrl key.Click the Source Data square (circled here
in red).
Fixing the range chart
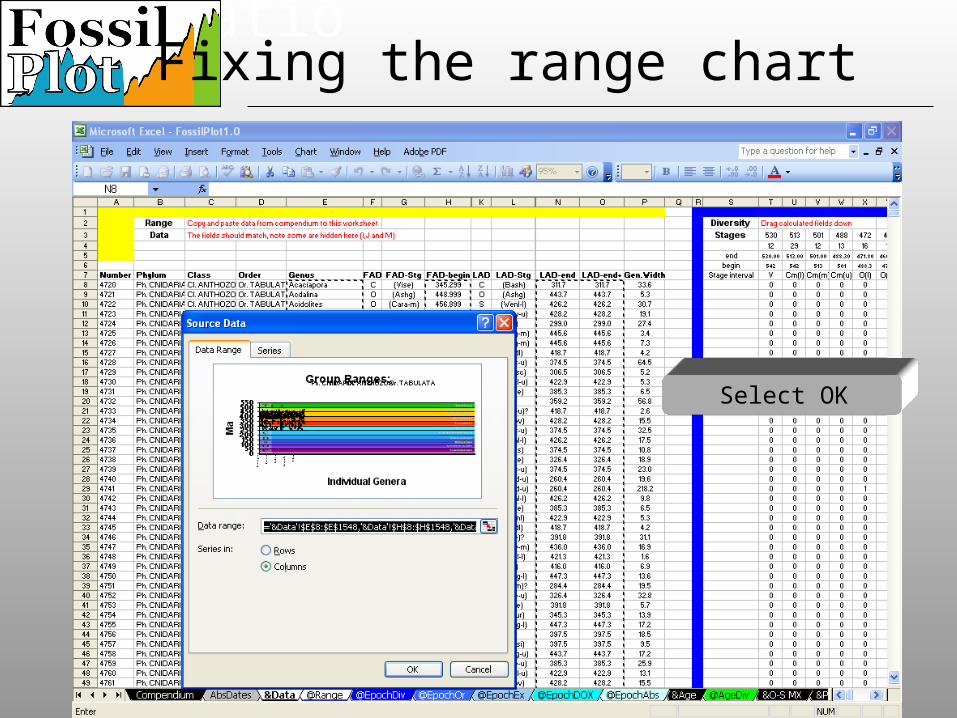
Speciation
Select OK
Fixing the range chart
Speciation
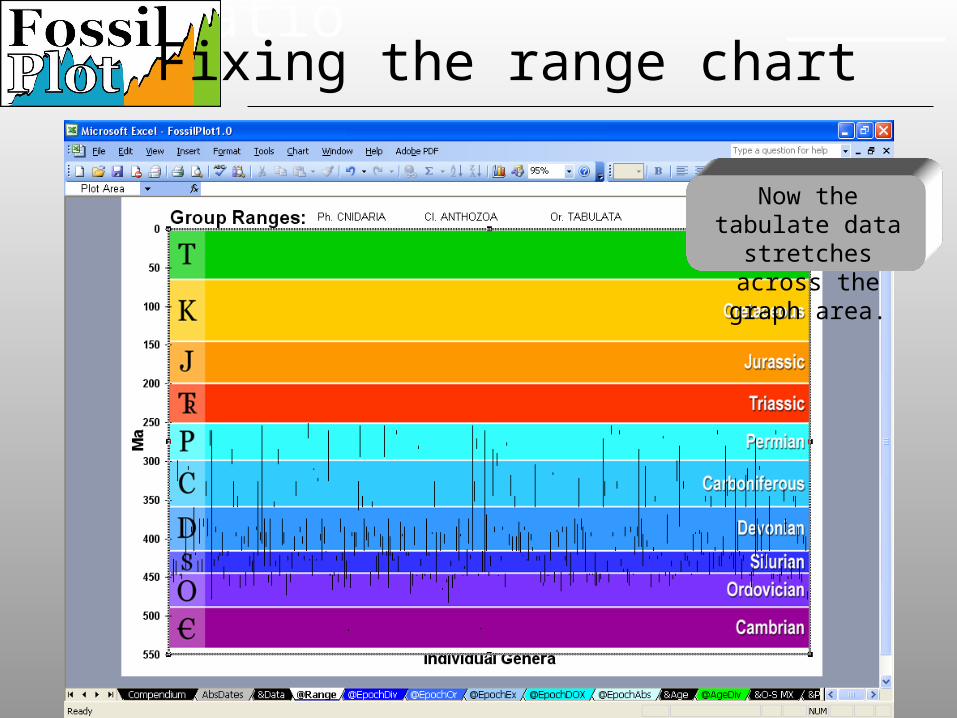
Now the tabulate data stretches across the
graph area.
Fixing the range chart
Speciation
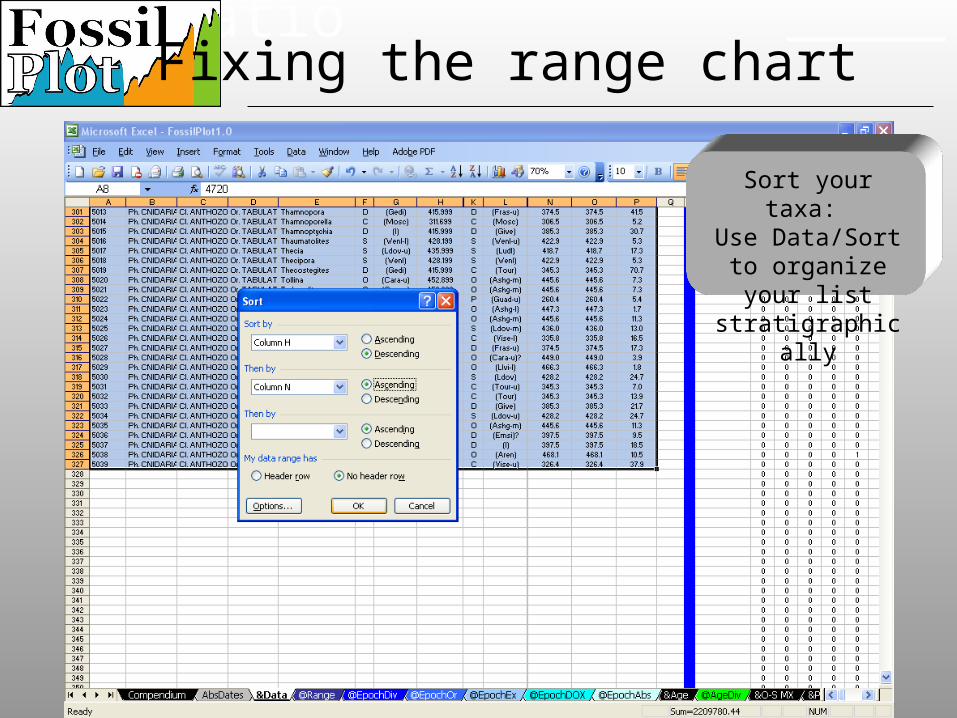
Sort your taxa: Use Data/Sort to organize your list stratigraphically
Fixing the range chart
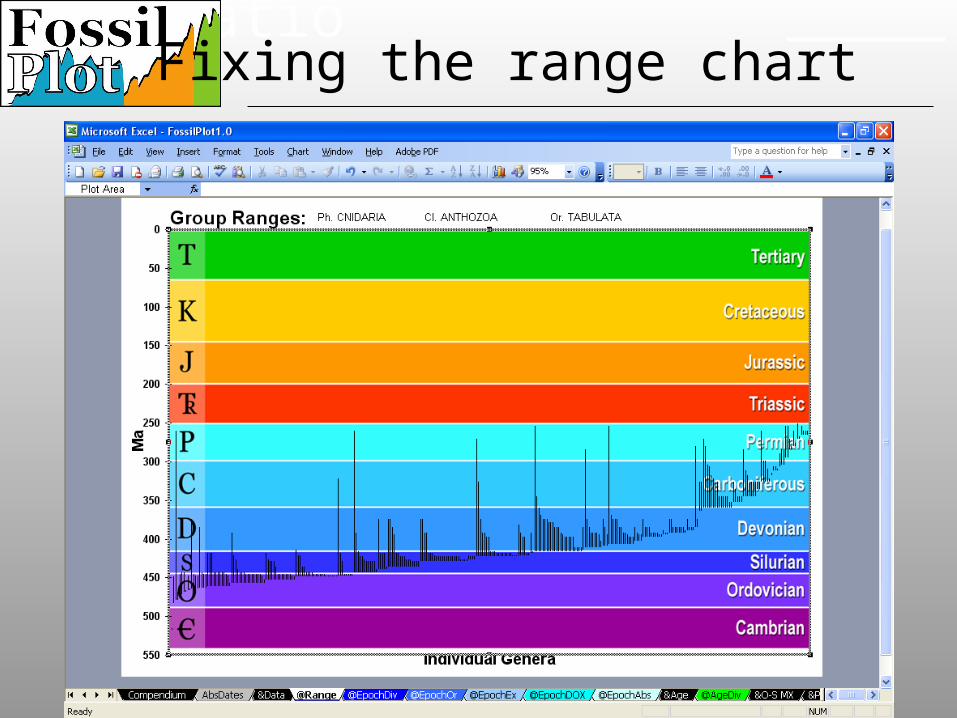
SpeciationFixing the range chart