Embed Size (px)
Citation preview

Ž .Earth and Planetary Science Letters 146 1997 659–675
ž /A U–Pb age from the Toarcian Lower Jurassic and its use fortime scale calibration through error analysis of biochronologic
dating
Jozsef Palfy a,), Randall R. Parrish b,1, Paul L. Smith a,2´ ´a Department of Earth and Ocean Sciences, UniÕersity of British Columbia, 6339 Stores Road, VancouÕer, B.C., V6T 1Z4, Canada
b Geological SurÕey of Canada, 601 Booth Street, Ottawa, Ont., K1A 0E8, Canada
Received 26 July 1996; accepted 2 December 1996
Abstract
The Early Jurassic is the most poorly constrained part of the geochronologic scale within the Mesozoic, owing to theŽ .scarcity of calibration points. We report a new U–Pb zircon age of 181.4"1.2 Ma 2s from an ash layer within the type
section of Crassicosta Zone, a North American regional standard ammonite zone in the Middle Toarcian. For time scalecalibration, the isotopically dated level needs to be tied to the Jurassic chronostratigraphic framework established in
Žnorthwest European successions. Three major contributing factors difference between local observed and true ranges,.uncertainties of correlation, and taxonomic noise are assessed to determine the maximum biochronologic dating error. The
local ammonite distribution data are robust in that 95% confidence level extensions of observed ranges of commonŽ .ammonite taxa would not significantly modify the zonal assignment. The computer-assisted unitary association UA method
is used for world-wide biochronologic correlation. Representative North and South American, western Tethyan, andnorthwest European sections were selected to establish the global maximum ranges for 103 Middle Toarcian ammonite taxaand a sequence of 40 UA. Maximum permissible correlatives of the Crassicosta Zone lie between the northwest European
Ž . Ž .standard Semipolitum Subzone late Bifrons Zone and Bingmanni Subzone early Thouarsense Zone . In particular, theŽ .dated tuff layer cannot be older than the Semipolitum Subzone or younger than the Illustris Subzone Variabilis Zone .
Taxonomic inconsistencies are present in the source data but their effect in corrupting UA-based correlation is shown to beŽ . Ž .negligible. The precise U–Pb age 2s error-"1% that is constrained at the sub zonal level furnishes a useful new time
scale calibration point. It warrants adjustments to previous Toarcian stage boundary age estimates and allows a significantreduction of their associated uncertainties.
Keywords: absolute age; UrPb; Toarcian; biochronology; calibration; Ammonites
) Corresponding author. Fax: q1 604 822 6088. E-mail: [email protected] Present address: Department of Geology, Leicester University, University Road, Leicester, LE1 7RH, UK and NERC Isotope
Geoscience Laboratory, Keyworth, Notts., NG12 5GG, UK. E-mail: [email protected] E-mail: [email protected]
0012-821Xr97r$17.00 Copyright q 1997 Elsevier Science B.V. All rights reserved.Ž .PII S0012-821X 96 00241-5

( )J. Palfy et al.rEarth and Planetary Science Letters 146 1997 659–675´660
1. Introduction
The paradox of Jurassic geochronology is that thebiochronologic framework was laid out in the mid
w x19th century 1 and has been continuously refinedŽ w x .see 2 for one of several recent reviews but its
w xcalibration with isotopic ages is still poor 3 . Re-w xcently published time scales 4–12 suggest conflict-
ing boundary age estimates and stage durations.w xWhere uncertainties are quoted 4,9,11,12 , the
boundaries of the Toarcian appear the most poorlyconstrained of all the Jurassic stages. Underlying this
Žproblem, there is a scarcity of isotopic dates eightw x.items listed in 9,11,12 , of which all except one are
Fig. 1. Location map of the Yakoun River section on GrahamIsland, Queen Charlotte Islands. Grid reference for the U–Pbsample locality is UTM Zone 9, 681500E 5921830N.
K–Ar or Rb–Sr ages with inferior precision andaccuracy. Also, most dated samples are stratigraphi-cally poorly constrained and none of them is unam-biguously confined to the Toarcian stage.
To improve the calibration of the Jurassic timescale, concerted effort is under way in the Canadian
w xCordillera 13 . U–Pb dating of volcanic units ispreferred where fossiliferous volcanosedimentary se-quences allow independent ammonite biochronologicdating at the zonal level.
ŽWe report a new, precise error is less than "1%.at 2s level U–Pb zircon age from the Queen
Charlotte Islands. The dated sample is biochronolog-ically constrained at the zonal level. Moreover, itwas obtained from the type section of three consecu-tive Middle and Upper Toarcian North American
w xstandard ammonite zones 14 . To demonstrate theusefulness of this date as a time scale calibrationpoint, we rigorously assess the ammonite fossil recordof the section using classical confidence intervals for
w xtaxon ranges 15,16 , the global biochronologicalŽ .correlations using the unitary association UA
w xmethod 17 , and the effect of fossil identificationerrors using model calculations. These methods serveto evaluate the biochronologic dating error that is noteasily quantifiable. In previous time scales it was
w xeither not entered into calculations 11,12 or overes-w xtimated 9 . Conclusions derived here can be ex-
tended to the use of other dates from the NorthAmerican Cordillera as calibration points for theJurassic time scale.
2. Geologic setting
The studied section is exposed on the left bank ofYakoun River on Graham Island, Queen Charlotte
Ž .Islands, British Columbia Fig. 1 . Jurassic rocks ofthe archipelago are assigned to Wrangellia, one ofthe major tectonostratigraphic terranes comprising
w xthe North American Cordillera 18 . The Jurassicstratigraphy of Wrangellia is characterized by arc-re-lated volcanosedimentary sequences, although theLower Jurassic Kunga and Maude groups are pre-dominantly sedimentary on the Queen Charlotte Is-lands. The Yakoun River section is the designatedtype section of the Whiteaves Formation within the
Ž w x.Maude Group Section 15 in 19 . The stratigraphy

( )J. Palfy et al.rEarth and Planetary Science Letters 146 1997 659–675´ 661
of the section is shown in Fig. 2. The WhiteavesFormation consists of dark, poorly bedded concre-tionary mudstone with minor sandstone interbedsand rare, thin bentonitic ash layers. It records deposi-
w xtion in a marine basin of moderate water depth 19 .
There is no apparent gap within the exposed section.The Whiteaves Formation is comformably overlainby thin-bedded to massive sandstone of the PhantomCreek Formation, although the basal part of that unitis largely concealed.
Ž w x.Fig. 2. Lithostratigraphy and biostratigraphy of the Toarcian of the Yakoun River section modified after 14 . Zs the level of U–Pb zirconŽ . Ž .sample. Ammonite ranges vertical lines with collection levels horizontal bars are shown for the Planulata, Crassicosta, and Hillebrandti
Ž w x.zones only after 29 . Dotted lines denote imprecisely located early collections.

( )J. Palfy et al.rEarth and Planetary Science Letters 146 1997 659–675´662
Tab
le1 Ž
.U
–Pb
zirc
onan
alyt
ical
data
and
appa
rent
ages
from
sam
ple
PCA
-YR
-1,
avo
lcan
icas
hla
yer
inth
eW
hite
aves
Form
atio
nat
Yak
oun
Riv
era
bc
206
c,e
206
238
f20
723
5f
207
206
f20
623
820
723
520
720
6Fr
actio
nW
t.U
PbPb
rPb
Thr
UPb
rU
Pbr
UPb
rPb
Pbr
UPb
rU
Cor
r.Pb
rPb
204
dg
gg
Ž.
Ž.
Ž.
Ž.
Ž.
Ž.
Ž.
mg
ppm
ppm
Pbpg
age
Ma
age
Ma
coef
.ag
eM
a)
A-1
,s2.
545
5.8
12.8
047
74.
40.
300.
0285
4"0.
340.
1973
"0.
830.
0501
4"0.
7318
1.4"
1.2
182.
8"2.
80.
4920
2"34
)
A-4
,s1.
010
2128
.73
113
18.9
0.32
0.02
839"
0.32
0.19
70"
2.56
0.05
033"
2.39
180.
5"1.
218
2.6"
8.6
0.57
210"
110
A-7
11.0
186.
45.
291
354
10.9
0.34
0.02
853"
1.18
0.19
80"
2.70
0.05
034"
2.24
181.
3"4.
218
3.4"
9.1
0.58
211"
104
)
B,s
1.0
266.
57.
567
100
5.8
0.33
0.02
862"
0.56
0.18
42"
4.02
0.04
668"
3.79
181.
9"2.
017
1.7"
12.7
0.47
33"
182
B-3
3.7
406.
911
.71
1094
2.5
0.39
0.02
853"
0.33
0.19
47"
0.49
0.04
948"
0.43
181.
4"1.
218
0.6"
1.6
0.50
171"
20)
C-2
,s1.
015
3342
.22
393
7.2
0.25
0.02
855"
0.40
0.19
55"
0.97
0.04
966"
0.86
181.
4"1.
418
1.3"
3.2
0.45
179"
40
ass
sing
legr
ain;
)s
wei
ght
estim
ated
.b
Wei
ghin
ger
ror:
0.00
1m
g.c
Rad
ioge
nic
Pb.
dM
easu
red
ratio
,co
rrec
ted
for
spik
ean
dPb
frac
tiona
tion
of0.
09%
"0.
03%
rA
MU
.e
Tot
alco
mm
onPb
inan
alys
isco
rrec
ted
for
frac
tiona
tion
and
spik
e.f
wx
Cor
rect
edfo
rbl
ank
Pban
dU
,an
dm
odel
com
mon
Pbco
mpo
sitio
n25
for
181
Ma
Pb;
erro
rsar
e1
stan
dard
erro
rof
the
mea
nin
perc
ent.
gC
orre
cted
for
blan
kan
dco
mm
onPb
;er
rors
are
2st
anda
rder
rors
ofth
em
ean
inM
a.

( )J. Palfy et al.rEarth and Planetary Science Letters 146 1997 659–675´ 663
3. U–Pb geochronometry
3.1. Methodology
Sample PCA-YR-1 was collected from a 10 cmthick, clay-rich, white gritty ash bed interbeddedwithin black mudstone of the Whiteaves Formationin the Yakoun River section. The sample was exca-vated with a knife and spoon and stored in a moiststate. In the laboratory the sample was blended into aslurry, allowed to settle, and the fines decanted. Thewashed concentrate was further ultrasonically agi-tated and cleaned, passed through heavy liquids, andseparated into aliquots with different magnetic sus-ceptibilities. Euhedral needles of zircon were identi-fied in the least magnetic material, hand picked,
w xphotographed, and abraded 20 for U–Pb analysis.Crystals selected were reasonably homogeneous but,allowing for the possibility that xenocrysts or trans-ported zircons may have been present, the first set ofanalyses were of single grains weighing only a fewmicrograms. The concordance and reproducibility ofthese analyses established a high probability of asingle population of zircon, and additional analysesconsisted of up to 10 grains to achieve somewhatsmaller U–Pb analytical errors. The methods anddecay constants used in U–Pb analyses are described
w xelsewhere 21–23 . Table 1 presents these data andw xerrors 24 , and they are shown graphically in Fig. 3.
Fig. 3. U–Pb concordia diagram for zircons from sample PCA-YR-1, a volcanic ash layer in the Whiteaves Formation at Yakoun
Ž .River. Errors are shown at 2s 95% level. Error ellipses withthick outline denote single grain analyses, grey shading indicates
Žfractions not used in final age interpretation see text for details.and Table 1 for analytical data .
U and Pb blanks were approximately 0.2 and 3 pg,respectively.
3.2. Results
Six analyses of single or multiple grains of abradedzircons all produced consistently concordant andoverlapping error ellipses on the concordia diagramŽ .Fig. 3 . In Jurassic zircons the abundance ratio of206 Pbr 207 Pb is about 20, therefore the 206 Pbr 238 Uage from single grain analyses is inherently moreprecise than the 207Pbr 235U age and it reliablyestimates the crystallization age when concordance isdemonstrated and the 206 Pbr 238 U ages form a tight
w x w xcluster 26 . The strong abrasion of the grains 20 ,their mutual concordance, and agreement in their206 Pbr 238 U ages definitively argue against any sub-sequent Pb loss in the crystals analyzed. The weightedmean of 206 Pbr 238U ages based on all six fractions
Ž .is 181.2"0.6 Ma 2s . We take a more conserva-tive approach by selecting the three most precise
Ž .analyses A-1, B-3 and C-2 and, noting their con-cordance, we use the mutual overlap of their206 Pbr 238 U ages as the best estimate of the true age
Ž .and uncertainty and assign 181.4"1.2 Ma 2s asthe crystallization age of zircons and eruption of ash.
4. Biochronology
Biochronologic dating is based on sequences ofassociations of taxa that have been shown to main-tain their stratigraphic relationships over a wide geo-graphic area. This approach is well suited to am-monoids and has been successfully used in develop-ing zonations for the North American Lower Jurassicw x14,27 . The use of the new U–Pb date as a timescale calibration point requires correlation betweenthe secondary standard North American and the pri-
Žmary standard northwest European zonations seew x .28 for discussion . Here we develop such a correla-tion and apply additional methods to test forbiochronologic error.
4.1. The ammonite fossil record
The Whiteaves Formation in the Yakoun Riversection is richly fossiliferous. The most commonmacrofossils are ammonites, with a total of 119
( )J. Palfy et al.rEarth and Planetary Science Letters 146 1997 659–675´664
collections obtained through initial reconnaissancew xwork 19 , followed by three field seasons of careful
w xsystematic sampling 29 . This collection history andthe abundance of fauna distinguishes the YakounRiver section as one of the best studied Early Juras-sic ammonite localities in North America. Well pre-served ammonites occur most commonly in non-sep-tarian calcareous concretions, the majority of whichare distributed randomly in the section, while someform distinct layers. Although rare, ammonites were
Žalso found crushed within the shale G. Jakobs, pers..commun. 1996 . The uniform lithology throughout
the Whiteaves Formation suggests that there is nosignificant preservational bias affecting the verticaldistribution of fossils, which was carefully measured
w xand documented 14,29 .Five regional standard ammonite zones were pro-
w xposed for the Toarcian of North America 14 . All ofthem are recognizable in the Yakoun River section,which serves as the stratotype for the Planulata,
w xCrassicosta, and Hillebrandti zones 14 . The ashlayer yielding the analyzed U–Pb sample is by defi-nition assigned to the lower part of Crassicosta Zone.Therefore, the following discussion is concerned withthe Crassicosta and the adjacent Planulata and Hille-brandti zones only.
4.2. Reliability of obserÕed ranges
The regional standard zonal scheme for the Toar-w xcian 14 is based on a literal reading of observed
vertical ranges of ammonites. It is widely accepted,w xhowever, that the fossil record is incomplete 30 and
w xit underestimates the true ranges 31 . Our aim inassessing the robustness of ammonite zones as de-fined in the Yakoun River section is twofold: to userigorous statistical methods to test the validity ofzones and to compare the empirical data derivedfrom successive collecting campaigns with the pre-dictions from statistical methods. The following cal-culations are based on published fossil occurrence
w xdata 14,29 .The simplest way of providing a maximum esti-
mate of the completeness of the ammonite record isto calculate a ‘‘hitrmiss’’ ratio, where the hits areconfirmed occurrences and the misses are collectionlevels with no record of a given taxon within its
Žknown vertical range also termed virtual occur-
w x.rences 17 . For the 54 levels reported within thethree zones, there are 74 hits and 110 misses, sug-gesting that the maximum average probability offinding a species in a fossiliferous horizon within itsvertical range is no better than 40%. It can be arguedthat the average probability is biased towards lowervalues by rare taxa which are given little weight indevising biozonations. Of the 22 taxa considered,
Žonly six Rarenodia planulata, Phymatoceras cras-sicosta, P. hillebrandti, P. cf. pseudoerbaense,
.Leukadiella ionica, and Denckmannia tumefactawere found at more than two levels. Indeed, these sixtaxa score a hitrmiss ratio of 51r54 giving a nearly50% chance of being found. Not surprisingly, thethree zonal index species among them score the
Žhighest hitrmisss36r20, chance of being found.s64% .
It is evident that misses would occur beyond thelowest and highest hits; that is, the observed rangesare shorter than the true local ranges. To estimate thetrue ranges, gaps separating occurrence levels must
w xalso be considered 15,30 . Fig. 2 is a re-plotting ofw xobserved ranges 14 considering all available infor-
w xmation on vertical distribution 29 . The distributionof gap lengths in the fossil record is shown to haveDirichlet distribution and classical confidence inter-vals can be calculated for estimating the true strati-
w xgraphic ranges 15,16 . These statistics are only validif the fossil distribution is assumed to be random. Aspointed out above, there is no appreciable preserva-tional bias or change in sedimentation rate in therather uniform lithologic sequence of the WhiteavesFormation. Likewise, collection bias can also bediscounted as collection intensity was constant dur-ing the first field season and collecting strategy
Žremained systematic although slightly biased to-.wards parts of the Planulata and Hillebrandti zones
Žin the following two campaigns G. Jakobs, pers..commun., 1996 .
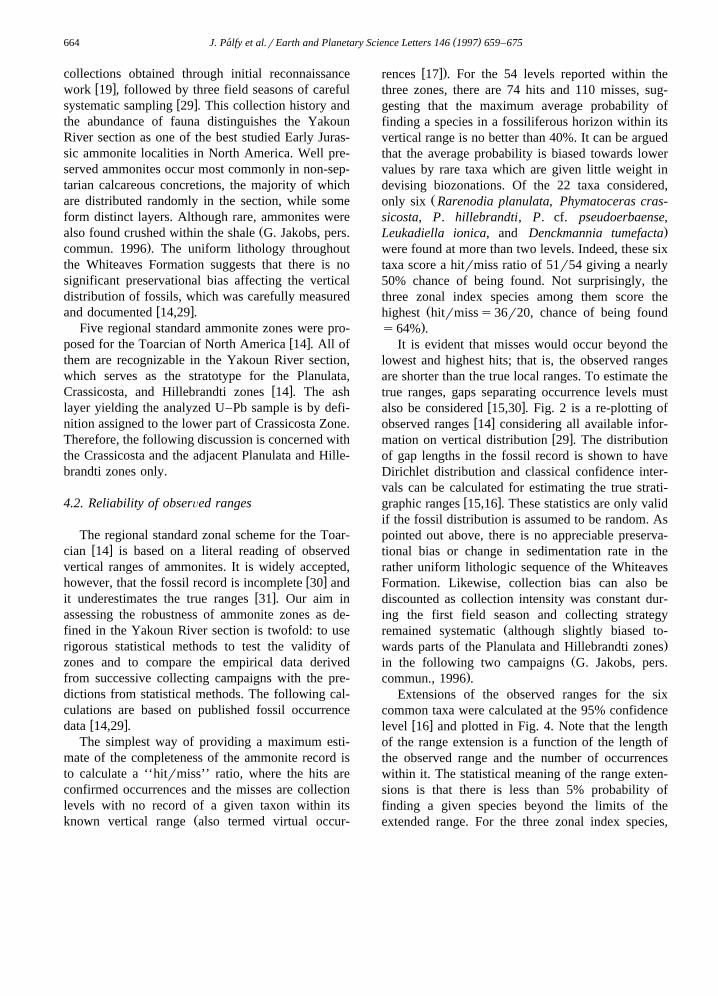
Extensions of the observed ranges for the sixcommon taxa were calculated at the 95% confidence
w xlevel 16 and plotted in Fig. 4. Note that the lengthof the range extension is a function of the length ofthe observed range and the number of occurrenceswithin it. The statistical meaning of the range exten-sions is that there is less than 5% probability offinding a given species beyond the limits of theextended range. For the three zonal index species,
( )J. Palfy et al.rEarth and Planetary Science Letters 146 1997 659–675´ 665
occurrences are separated according to the year oftheir first finding and changes in cumulative ob-served ranges are also plotted. The following obser-
Ž .vations can be made: 1 For commonly occurringammonite taxa collected through systematic collect-ing effort, range extensions at the 95% confidenceare not justifiable. A lesser degree of confidencewould better agree with range extensions realizedthrough further collecting but its approximate levelneeds to be established empirically through tests on a
Ž .larger database. 2 The Planulata, Crassicosta, andHillebrandti zones are defined as assemblage zonesw x14 . In practice, the definition of their boundaries atthe stratotype depends, to a large degree, on therange of their zonal index species. The Planulata andHillebrandti zones are based on robust evidence fromthe distribution of their respective zonal indices.Their range extension even at the 95% confidencelevel would not modify the zonation significantly.The Crassicosta Zone, on the other hand, is less welldefined by the range of its zonal index but is wellconstrained by the subjacent and superjacent zones
Ž .and the cohort of co-occurring taxa. 3 Of the sixrange end-points of other relatively common species,only one would require modification of zonal assign-ments if the range extension at the 95% confidence
Ž .level is considered. 4 The isotopically dated tuffŽlayer within the observed range of Phymatoceras
.crassicosta falls very near to the top of the extendedŽ .range at the 95% confidence level of Rarenodia
planulata, therefore its assignment to the CrassicostaZone is undoubted.
4.3. Biochronologic correlations
Traditional ammonite biochronology was foundedand proved extremely powerful within single bio-
Ž .provinces e.g., Boreal northwest Europe, Tethyswhere it is possible to establish reproducible high
Ž .resolution units faunal horizons . Limitations anddifficulties are imposed by facies dependence and
Ž . ŽFig. 4. Collection levels arrowheads , observed ranges unfilled.boxes , and estimated maximum ranges at 95% confidence level
Ž . Žshaded boxes of common ammonite species i.e., occurring at.more than two levels from the Planulata, Crassicosta, and Hille-
brandti zones in the Yakoun River section. Changes in observedand estimated ranges after successive collection years are shown
Žfor the three zonal index species Rarenodia planulata, Phymato-.ceras crassicosta, and P. hillebrandti . Occurrence data from
w x29 . Zs the level of U–Pb zircon sample. See text for discussion.

( )J. Palfy et al.rEarth and Planetary Science Letters 146 1997 659–675´666
limited paleobiogeographic distribution of taxa, re-sulting in complex timerspace distribution patterns
Žoverprinted by the vagaries of fossil record i.e.,.preservation and collection biases . Correlation across
biogeographical boundaries is often controversial, asexemplified by long-standing debates onTethyanrBoreal correlation in the Toarcian of Eu-
w xrope 32 . The traditional approach is based on expertjudgement in emphasizing the correlation value ofcertain ammonoid taxa and their associations at theexpense of others when discrepancies in the first and
Ž .last appearance datums FADrLAD are detected.A traditional solution for the correlation of North
American Toarcian ammonite zones with northwestŽ w x.European standard zones sensu 33 equates the
Planulata Zone with the Bifrons and basal Variabiliszones, the Crassicosta Zone with the rest of theVariabilis Zone, and the Hillebrandti Zone with the
w x Ž .Thouarsense Zone 14 . It is acknowledged that: 1correlation is hampered by the absence of key Euro-
Žpean taxa in North American faunas e.g., Hildo-ceras and Haugia, to which index species of the
. Ž .Bifrons and Variabilis zones belong ; 2 NorthAmerican faunas have greater similarity to Tethyanand South American ones than those of Boreal north-
Ž .west Europe; 3 in North America, the FAD androrŽLAD of several important genera e.g., Phymato-
ceras, Podagrosites, Peronoceras, and Mercat-.iceras are anomalous with respect to those found
w xelsewhere 14 . Consequently, a cautious approach tocorrelation needs to integrate global stratigraphicdistribution from all faunal provinces, should seekmaximum ranges of taxa, and is expected to result ina correlation scheme with apparent resolution sacri-ficed for increased reproducibility and confidence.The amount of available data calls for quantitativetreatment, which also provides the advantage ofeliminating potential bias introduced by subjectivejudgements.
There is a variety of quantitative biostratigraphictechniques available and the choice depends on the
w xnature of data and the expected outcome 34 . In ourcase, the data are obtained from measured sections indifferent sedimentary basins and bioprovinces, hence
Ž .the total number of taxa is high )100 while thenumber of common taxa is often low. Also, fossildistribution among sections may be non-random dueto faunal migration. As the timing of migration
events is not known independently, maximum rangesare sought to use for correlation. Among the mostwidely used and tested quantitative methods, graphiccorrelation seeks maximum ranges but is not practi-
w xcal beyond a single sedimentary basin 35 . Theprobabilistic ranking and scaling method also worksbest within a single basinrbioprovince, where itproduces average ranges with the maximum likeli-hood of FADrLAD sequence while assuming ran-
w xdom distribution of fossils 36 . The unitary associa-Ž . w xtion UA method 17 appears to be best suited to
our problem. It furnishes maximum ranges based ona deterministic approach and it does not requirerandom fossil distribution or homogeneity of sourcedata. It applies the rigor of graph theory to thefamiliar concept of Oppelian assemblage zones, thusit retains the philosophy underlying traditional am-monite biochronology. The pitfalls of intuitive corre-lation schemes are minimized. The algorithmic for-mulation of the UA method resulted in an efficient
w xcomputer program, the BioGraph 37 . The UAmethod was found to efficiently construct biochrono-logically meaningful zonations from complex dataw x38 . Notably, it was successfully used for correlation
w xbetween different bioprovinces 39 and was demon-strated to reproduce closely the ammonite zonationdeveloped by traditional methods in northwest Eu-
w xrope 40 .We used the following procedure for computer-
assisted biochronologic correlation. Conventionalcorrelation of the Planulata, Crassicosta, and Hille-
w xbrandti zones 14 was accepted as a guide. Thescanning range was set to latest Early to early LateToarcian. All established ammonite provinces wereconsidered and the available literature was culled forrepresentative sections from each province. The se-lection was based on evidence that collections weremade from measured sections spanning several zoneswith no indication of condensed horizons or rework-ing, that the ammonite fauna is abundant and di-verse, and that local ranges are well documented.
ŽSources with sound taxonomic documentation pre-.ferably with illustration were chosen if possible. No
adequate sections meeting the above criteria werelocated from the western Pacific and Arcticprovinces. Beside the Yakoun River section, datafrom one other North American, four South Ameri-can, five western Tethyan and five northwest Euro-

( )J. Palfy et al.rEarth and Planetary Science Letters 146 1997 659–675´ 667
Žpean sections were compiled see Appendix A for.details of sources and remarks . Among the taxa
occurring, only species of Ammonitina reported fromtwo or more localities were used. Polyplectus andPseudolioceras, two long-ranging genera with littlestratigraphic value, were omitted. Limited attempt
Žwas made to homogenize taxonomy see discussion.below , mainly to consider synonyms of taxa re-
w xported from the Yakoun River 29 . Composite genusranges were added for each section to mitigate theeffect of paleobiogeographic differences at thespecies level. A conservative generic classification
w xscheme 41 was adopted with the exception ofw xrecognition of Rarenodia 29 and the combining of
Porpoceras with Peronoceras to avoid confusionstemming from different opinions as to their speciescontent. The 103 taxa and the stratigraphic ranges ineach section are available as an EPSL Online Back-
3 Ž .ground dataset ‘‘appendix 2’’ .These data were entered into and processed by the
w xBioGraph program 37 . Sections within eachprovince were ordered, with priority given to themost species-rich and complete one. As the resolu-tion of contradictory stratigraphic relationships maybe affected by the order in which the data are
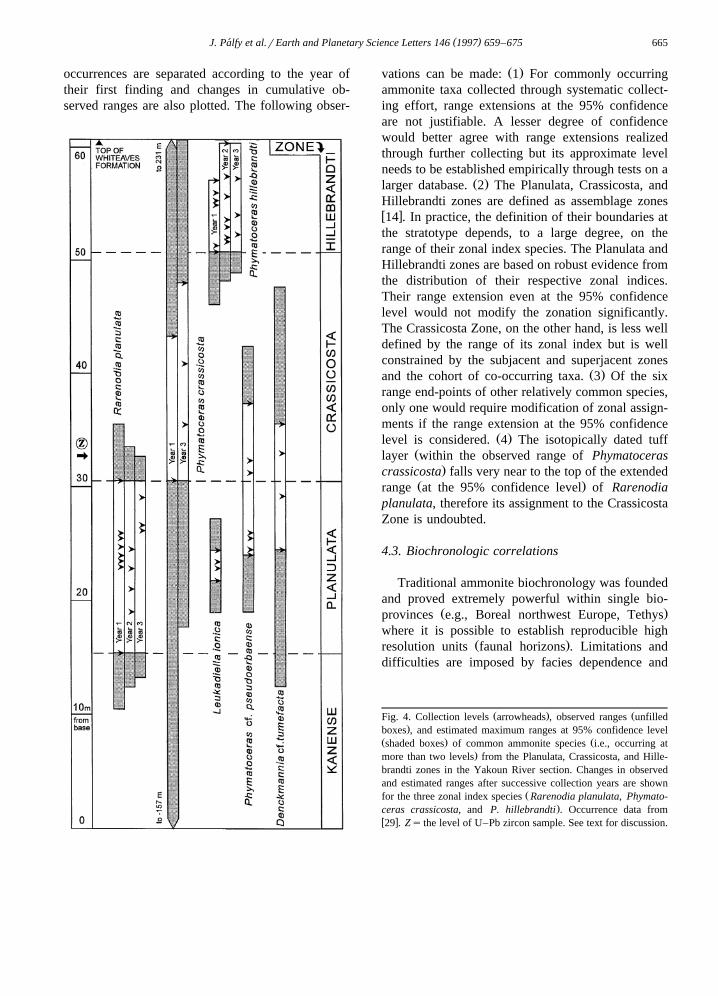
w xprocessed 17 , all six permutations of North Ameri-can, Tethyan and northwest European sections weretried with the least informative South American sec-tions consistently entered last. The output of 40
Ž .successive UA Fig. 5 , however, was not sensitiveto the permutation.
The UA assigned to specific beds or collectionlevels in the source sections were determined from
Žthe correlation tables produced by BioGraph availa-ble as EPSL Online Background Dataset, ‘‘ap-
.pendix 3’’ . Thus, at the Yakoun River, the base ofthe Crassicosta Zone corresponds to UA 22-23, thebase of the Hillebrandti Zone to UA 33, and theisotopically dated tuff layer to UA 22-25. Standardsubzonal and zonal boundaries reported from theanalyzed northwest European sections were used todetermine the maximum permissible extent of these
Ž . Žunits in terms of the UA scheme Fig. 6 . Lacking auniversally accepted Toarcian standard zonation for
3 Žhttp:rrwwwrelsevierrnlrlocaterepsl mirror site USA,.http:rrwww.elsevier.comrlocate epsl
northwest Europe, we adopt a recently updatedw xscheme 32 which differs only slightly from a more
w xtraditional zonation 33 . Notably, the subzones ofthe Bifrons Zones are based on the species sequenceof Hildoceras, the Variabilis Zone is subdivided intothree subzones, and the subzonal scheme within theThouarsense Zone is revised, increasing the correla-
w x .tion potential 32 . The most likely range, as ex-pressed by the overlap or minimum required range ofUA from the analyzed sections, was also inferred forthe standard units. It is evident from Fig. 6 thatindividual UA are seldom reproducible in more thanone or two sections and across bioprovinces. How-ever, their groupings, which correspond to traditionalzones or subzones, are commonly present in severalsections from different provinces. Only four UA areunambiguously identifiable in North America andthey are not directly correlatable with other provinces.
Fig. 6 is used to determine the most likely and themaximum permissible correlations of the Crassicosta
Ž .Zone and the isotopically dated level within it withthe northwest European standard zonation. The be-ginning of the zone appears equivalent or marginally
Ž .older but cannot be younger than that of the stan-Ž .dard Variabilis Subzone Variabilis Zone . It could
Ž .also be correlative with but not older than the laterŽ .part of Semipolitum Subzone Bifrons Zone . The
beginning of Hillebrandti Zone lies most likely withinŽ .the latest Variabilis Zone Vitiosa Subzone but it
Žcould be as old as the Illustris Subzone middle part.of Variabilis Zone or as young as the earliest Bing-
manni Subzone of the Thouarsense Zone. The iso-topically dated tuff layer is constrained to the
Ž .Semipolitum through Illustris subzones inclusive ,with the earlier part of the Variabilis Zone being itsmost likely age.
As expected, the quality of UA based correlationdecreases towards either end of the scanning rangeŽi.e., earliest Bifrons Zone and latest Thouarsense
.Zone where there is insufficient superpositional con-trol deduced from the raw data. With this caveat, the
Ž .correlative of the base of Planulata Zone UA 7-14appears to lie somewhere between the late Sublevi-
Ž .soni and early Semipolitum subzones Bifrons Zone .Ž .The top of Hillebrandti Zone UA 38 shows robust
correlation with the Thouarsense Subzone but corre-Žlation with any of the subzones Bingmanni through
.Fallaciosum of the Thouarsense Zone is permitted.
( )J. Palfy et al.rEarth and Planetary Science Letters 146 1997 659–675´668

( )J. Palfy et al.rEarth and Planetary Science Letters 146 1997 659–675´ 669
Fig. 6. Reproducibility of the 40 Unitary Associations recognized in latest Early to early Late Toarcian ammonite faunas analyzed using theŽ . Ž .BioGraph program. The left side of diagram shows the occurrences of UA solid bars in the 16 selected sections listed in Appendix A .
Ž . Ž .Plotted on the right side are minimal solid bars and maximal hatched bars groupings of UA corresponding to the northwest Europeanw x Ž .standard zones and subzones 32 and their correlation with the North American Crassicosta Zone box and the isotopically dated level
Ž .gray shaded within it.
4.4. The effect of taxonomic noise
In addition to differences between observed andtrue fossil ranges and correlation uncertainty, a thirdpotential source of error in biochronologic dating isthe uncertainty of fossil identification. Given thevariety of authors and their differing opinions on
Žspecies, taxonomic noise i.e., random inconsisten-.cies in identifications is expected in the source data
for biochronologic correlation. The following exam-ple is given to illustrate the effect of high levels oftaxonomic noise.
The stratigraphically important genus Hildocerasw xwas recently revised 42 . Four widely distributed
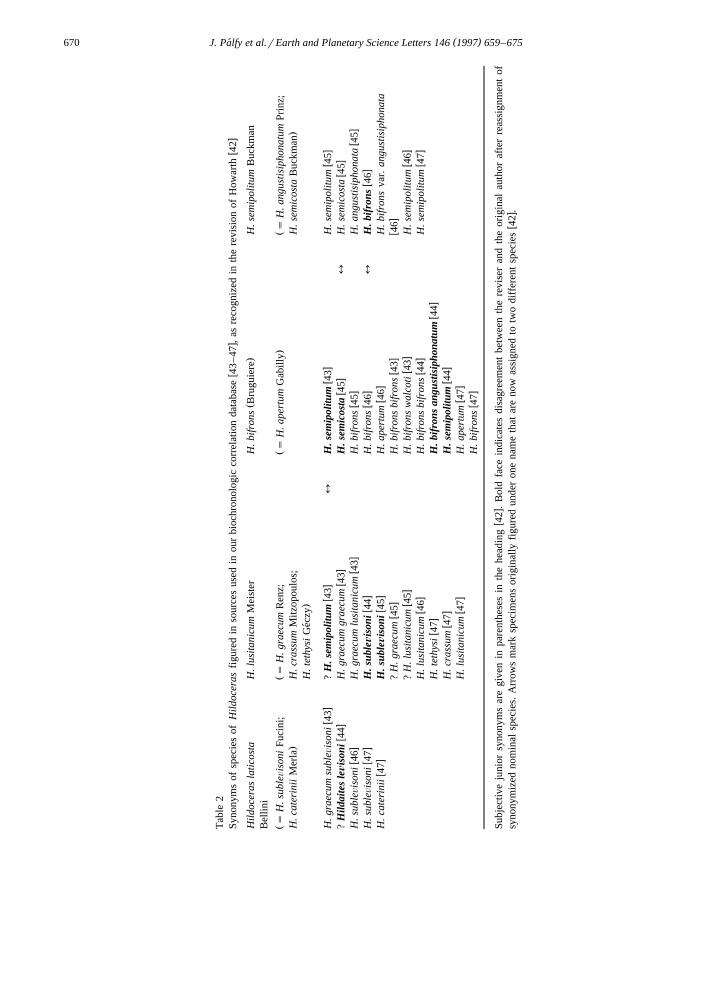
species were accepted with many other nominalŽ .species synonymized Table 2 . Tabulated are the
revisions made to figured specimens from sourcesw xused in our correlation database 43–47 . In approxi-
Fig. 5. Global latest Early to early Late Toarcian ammonoid taxon ranges relative to the 40 Unitary Associations produced by the BioGraphprogram.
( )J. Palfy et al.rEarth and Planetary Science Letters 146 1997 659–675´670
Tab
le2
wx
wx
Syno
nym
sof
spec
ies
ofH
ildo
cera
sfi
gure
din
sour
ces
used
inou
rbi
ochr
onol
ogic
corr
elat
ion
data
base
43–
47,
asre
cogn
ized
inth
ere
visi
onof
How
arth
42
Ž.
Hil
doce
ras
lati
cost
aH
.lus
itan
icum
Mei
ster
H.b
ifro
nsB
rugu
iere
H.s
emip
olit
umB
uckm
anB
ellin
i
ŽŽ
Ž.
Žs
H.s
ubleÕis
oni
Fuci
ni;
sH
.gra
ecum
Ren
z;s
H.a
pert
umG
abill
ys
H.a
ngus
tisi
phon
atum
Prin
z;.
.H
.cat
erin
iiM
erla
H.c
rass
umM
itzop
oulo
s;H
.sem
icos
taB
uckm
an.
H.t
ethy
siG
eczy
´
wx
wx
wx
wx
H.g
raec
umsu
bleÕ
ison
i43
?H
.sem
ipol
itum
43l
H.s
emip
olitu
m43
H.s
emip
olit
um45
wx
wx
wx
wx
?H
ildai
tes
lez
ison
i44
H.g
raec
umgr
aecu
m43
H.s
emic
osta
45l
H.s
emic
osta
45w
xw
xw
xw
xH
.sub
leÕis
oni
46H
.gra
ecum
lusi
tani
cum
43H
.bif
rons
45H
.ang
usti
siph
onat
a45
wx
wx
wx
wx
H.s
ubleÕis
oni
47H
.sub
lez
ison
i44
H.b
ifro
ns46
lH
.bif
rons
46w
xw
xw
xH
.cat
erin
ii47
H.s
ublez
ison
i45
H.a
pert
um46
H.b
ifro
nsva
r.an
gust
isip
hona
taw
xw
xw
x?
H.g
raec
um45
H.b
ifro
nsbi
fron
s43
46w
xw
xw
x?
H.l
usit
anic
um45
H.b
ifro
nsw
alco
ti43
H.s
emip
olit
um46
wx
wx
wx
H.l
usit
anic
um46
H.b
ifro
nsbi
fron
s44
H.s
emip
olit
um47
wx
wx
H.t
ethy
si47
H.b
ifro
nsan
gust
isip
hona
tum
44w
xw
xH
.cra
ssum
47H
.sem
ipol
itum
44w
xw
xH
.lus
itan
icum
47H
.ape
rtum
47w
xH
.bif
rons
47
wx
Subj
ectiv
eju
nior
syno
nym
sar
egi
ven
inpa
rent
hese
sin
the
head
ing
42.
Bol
dfa
cein
dica
tes
disa
gree
men
tbe
twee
nth
ere
vise
ran
dth
eor
igin
alau
thor
afte
rre
assi
gnm
ent
ofw
xsy
nony
miz
edno
min
alsp
ecie
s.A
rrow
sm
ark
spec
imen
sor
igin
ally
figu
red
unde
ron
ena
me
that
are
now
assi
gned
totw
odi
ffer
ent
spec
ies
42.
( )J. Palfy et al.rEarth and Planetary Science Letters 146 1997 659–675´ 671
mately 25% of the cases, the original author’s identi-fication is revised in addition to reassignments ofsynonymized nominal species. In three cases, speci-mens originally figured under one name are assignedto two different species by the reviser. It followsthat, even with amply illustrated material, the strati-graphic distribution data cannot be unambiguouslyrevised without a comprehensive review of all con-sidered specimens, a daunting task not attemptedhere.
If we adopt this high figure of 25% erroneousidentifications at the species level, we can thenexamine the effect of this taxonomic noise on theUA correlation method. The simplest model calcula-
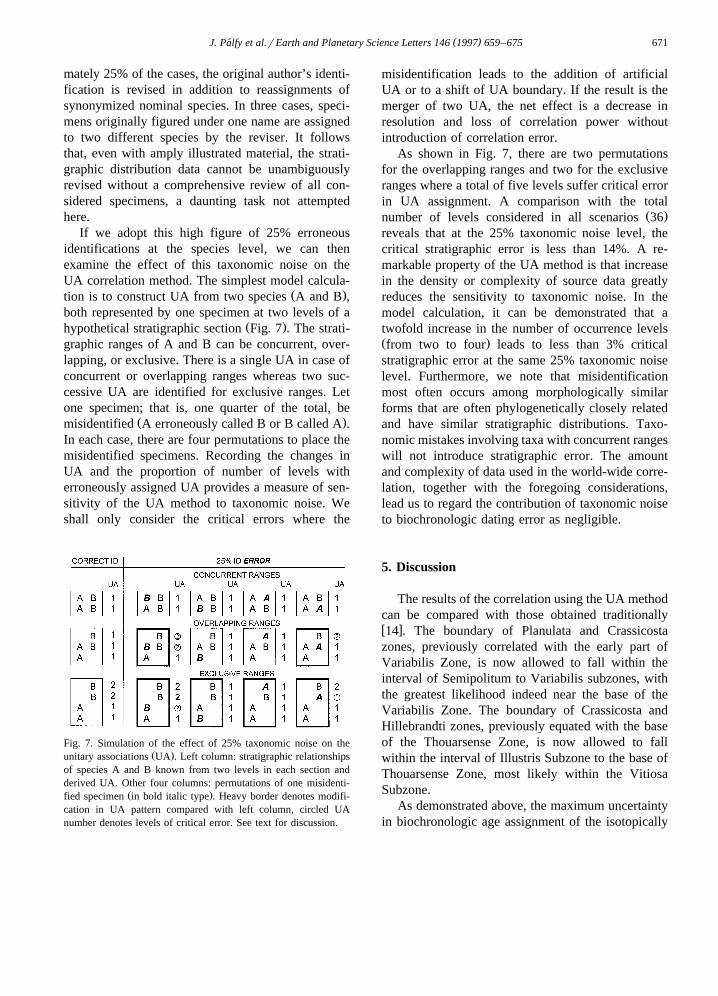
Ž .tion is to construct UA from two species A and B ,both represented by one specimen at two levels of a
Ž .hypothetical stratigraphic section Fig. 7 . The strati-graphic ranges of A and B can be concurrent, over-lapping, or exclusive. There is a single UA in case ofconcurrent or overlapping ranges whereas two suc-cessive UA are identified for exclusive ranges. Letone specimen; that is, one quarter of the total, be
Ž .misidentified A erroneously called B or B called A .In each case, there are four permutations to place themisidentified specimens. Recording the changes inUA and the proportion of number of levels witherroneously assigned UA provides a measure of sen-sitivity of the UA method to taxonomic noise. Weshall only consider the critical errors where the
Fig. 7. Simulation of the effect of 25% taxonomic noise on theŽ .unitary associations UA . Left column: stratigraphic relationships
of species A and B known from two levels in each section andderived UA. Other four columns: permutations of one misidenti-
Ž .fied specimen in bold italic type . Heavy border denotes modifi-cation in UA pattern compared with left column, circled UAnumber denotes levels of critical error. See text for discussion.
misidentification leads to the addition of artificialUA or to a shift of UA boundary. If the result is themerger of two UA, the net effect is a decrease inresolution and loss of correlation power withoutintroduction of correlation error.
As shown in Fig. 7, there are two permutationsfor the overlapping ranges and two for the exclusiveranges where a total of five levels suffer critical errorin UA assignment. A comparison with the total
Ž .number of levels considered in all scenarios 36reveals that at the 25% taxonomic noise level, thecritical stratigraphic error is less than 14%. A re-markable property of the UA method is that increasein the density or complexity of source data greatlyreduces the sensitivity to taxonomic noise. In themodel calculation, it can be demonstrated that atwofold increase in the number of occurrence levelsŽ .from two to four leads to less than 3% criticalstratigraphic error at the same 25% taxonomic noiselevel. Furthermore, we note that misidentificationmost often occurs among morphologically similarforms that are often phylogenetically closely relatedand have similar stratigraphic distributions. Taxo-nomic mistakes involving taxa with concurrent rangeswill not introduce stratigraphic error. The amountand complexity of data used in the world-wide corre-lation, together with the foregoing considerations,lead us to regard the contribution of taxonomic noiseto biochronologic dating error as negligible.
5. Discussion
The results of the correlation using the UA methodcan be compared with those obtained traditionallyw x14 . The boundary of Planulata and Crassicostazones, previously correlated with the early part ofVariabilis Zone, is now allowed to fall within theinterval of Semipolitum to Variabilis subzones, withthe greatest likelihood indeed near the base of theVariabilis Zone. The boundary of Crassicosta andHillebrandti zones, previously equated with the baseof the Thouarsense Zone, is now allowed to fallwithin the interval of Illustris Subzone to the base ofThouarsense Zone, most likely within the VitiosaSubzone.
As demonstrated above, the maximum uncertaintyin biochronologic age assignment of the isotopically

( )J. Palfy et al.rEarth and Planetary Science Letters 146 1997 659–675´672
Ž .Fig. 8. Comparison of boundary age estimates and numerical mid-point marked with arrowheads of the Toarcian in some recent timew xscales and the new U–Pb date from the mid-Toarcian of Queen Charlotte Islands. Sources of time scales quoted: DNAG 4–6 ; EXX88
w x w x w x w x7,8 ; GTS89 9 ; Odin 10 ; MTS 11,12 .
dated sample is "1 standard subzone. It is superiorto all previously available dates, which are con-strained at the stage level at best. The precision ofthe U–Pb age also surpasses that of any other iso-topic age from, or near, the Toarcian. Thus the U–Pbage from near the middle of Middle Toarcian atYakoun River serves as an important new calibrationpoint for the Jurassic time scale. When plotted againstthe major recently published and widely used timescales, the new U–Pb date of 181.4"1.2 Ma falls
w xwithin the Toarcian in all except the DNAG 4–6Ž .scale Fig. 8 . The mid-point of Toarcian is within
w xthe error of our date in the EXX88 7,8 and GTS89w x9 scales only. The new date is significant in that it,together with other newly obtained Early Jurassicisotopic ages, will help greatly reduce the largeuncertainty associated with previous stage boundaryestimates. Rigorous error estimates are only given in
w x w xGTS89 9 and MTS 11,12 . Considering the errorw xranges, in GTS89 9 the base of the Toarcian can be
as young as 172 Ma and the top as old as 188.5 Ma,both outside the error limits of the new U–Pb date.
w xIn MTS 11,12 , the top of the Toarcian can be as oldas 184.1 Ma, which is in conflict with the U–Pb datereported here.
6. Conclusions
We report a newly obtained U–Pb zircon age ofŽ .181.4"1.2 Ma 2s from the Queen Charlotte Is-
lands. The interpreted age is based on concordantand overlapping analyses of single-crystal as well asmulti-grain fractions. The dated sample was col-lected from a bentonitic ash layer within the Toar-cian Whiteaves Formation in the Yakoun River sec-
tion. The ash layer lies within the North Americanstandard Crassicosta Zone as defined by ammonite
w xbiostratigraphy 14 .The Yakoun River is the designated type section
of the Crassicosta Zone as well as the subjacentw xPlanulata and superjacent Hillebrandti zones 14 .
We statistically analyzed the quality of the ammonitefossil record in this section. All three zones areassemblage zones by definition but, in practice, aredelimited at the stratotype by their respective indexspecies. The collection density of Rarenodia planu-lata and Phymatoceras hillebrandti is adequate inthat their range extension using 95% confidenceintervals would not modify the placement of thezonal boundaries significantly. Collection data from
w xthree successive field seasons 29 suggest that gen-erally much less than 95% confidence level is re-quired when proposing range extensions for com-monly occurring ammonite taxa. The assignment ofthe dated tuff layer to the lower part of CrassicostaZone would not change even when range extensionsat the 90% confidence level are considered.
Biochronologic correlation was done using theŽ .computer-assisted unitary association UA method
w x17 . Ammonite local range data from representativeNorth American, western Tethyan, northwest Euro-pean, and South American sections were processedto provide unbiased estimates of global maximumtaxon ranges and a sequence of UA. The UA frame-work was then used to establish the maximum extentof permissible correlation between the secondarystandard North American and the primary standardnorthwest European zonations. Correlation of theCrassicosta Zone is bracketed by the Semipolitum
Ž .Subzone late Bifrons Zone and Bingmanni Sub-Ž .zone early Thouarsense Zone . In particular, the

( )J. Palfy et al.rEarth and Planetary Science Letters 146 1997 659–675´ 673
dated tuff layer cannot be older than the Semipoli-tum Subzone or younger than the Illustris SubzoneŽ .Variabilis Zone .
Random misidentifications are known to occur inthe world-wide dataset used for correlation. How-ever, the UA method is shown to respond to taxo-nomic noise by loss of resolution rather than erro-neous correlation. Thus we regard the proposed cor-relation as conservative best estimates.
Ž .With less than "1% 2s error in the isotopicage and a maximum of "1 standard subzone uncer-tainty in biochronologic correlation, the U–Pb agefrom the Yakoun River section serves as an impor-tant calibration point for the Early Jurassic timescale. A comparison with recently proposed timescales reveals that only minor adjustments are re-quired for the Toarcian stage boundary age estimatesbut the associated uncertainties can be greatly re-duced. U–Pb dating of volcanic horizons withinfossiliferous sequences in the North AmericanCordillera holds promise for providing more usefulcalibration points for the Jurassic time scale.
Acknowledgements
Giselle Jakobs is thanked for sharing her exten-sive knowledge of the Yakoun River locality andToarcian ammonite faunas in general, answering ourmany questions, and allowing access to her unpub-lished data. Anne Kinsman provided expert assis-tance in producing a heavy mineral concentrate andin aspects of U–Pb chemistry. Klaus Santowski per-formed expert mass spectrometry on these tiny zir-con samples. Thoughtful comments by James Ogg,Robert Anderson, and an anonymous reviewer helpedimprove the manuscript. Financial support throughan NSERC grant to PLS and a Killam pre-doctoral
[ ]fellowship to JP is gratefully acknowledged. RV
Appendix A. List of stratigraphic sections andsources of BioGraph input
A.1. North America
Ž . w x1 Yakoun River, British Columbia 14,29Ž . w x2 Joan Lake, British Columbia 14,29
A.2. Western Tethys
Ž . w x Ž3 Valdorbia, Umbria, Italy 44,48 As bed-by-bed correlation between the two sources are ambigu-ous at some levels, data from the two sources wasfirst processed by BioGraph and the resulting taxaranges with UA treated as levels were entered into
.the main BioGraph input file.Ž . Ž .4 Djebel-es-Saffeh Section 3B , Djebel Nador
w xarea, Algeria 46Ž . Ž .5 Djebel-es-Saffeh Section 2 , Djebel Nador
w x Žarea, Algeria 46 Supplementary section to Djebel-es-Saffeh 3B, mainly to better document the am-
.monite fauna from the lower part of the succession.Ž . w x6 Paghania, Greece 43Ž . w x7 Monte di Civitella, Umbria, Italy 49
A.3. Northwest Europe
Ž . w x Ž8 St-Paul des Fonts, Aveyron, France 45 Am-monite faunas of horizons, said to represent one to
.three beds, are given and entered here as levels.Ž . w x9 Camplong, Aveyron, France 50Ž .10 Ricla and La Almunia, Iberian Range, Spain
w x51Ž . w x11 Anse Saint-Nicolas, Vendee, France 47´
ŽFrom the vicinity of Thouars, the classical type areafor the Toarcian, this section contains the best docu-
.mented and most diverse ammonoid fauna.Ž .12 Ravenscar and Whitby, Yorkshire, England
w x Ž42,52,53 Data compiled following the bed-by-bedw x .correlation between the two sections 42 .
A.4. South America
Ž . w x13 Quebrada El Bolito, northern Chile 54Ž . w x14 Quebrada Yerbas Buenas, northern Chile 54Ž . w x15 Quebrada Larga, northern Chile 54Ž . w x Ž16 Rio del Toro, northern Chile 54 For all
South American sections emended taxonomy wasw x .used 55 .
References
w x1 A. Oppel, Die Juraformation Englands, Frankreichs undsudwestlichen Deutschlands, 857 pp., Ebner & Seubert,¨Stuttgart, 1856–1858.
w x2 S.S. Buckman and J.H. Callomon, Time from fossils: Juras-

( )J. Palfy et al.rEarth and Planetary Science Letters 146 1997 659–675´674
sic high-resolution geochronology, in: Milestones in Geol-ogy, M.J. Le Bas, ed., Geol. Soc. London Mem. 16, 127–150,1995.
w x3 J. Palfy, Development of the Jurassic geochronologic scale,´Hantkeniana 1, 13–25, 1995.
w x4 A.R. Palmer, The Decade of the North American Geology1983 geologic time scale, Geology 11, 503–504, 1983.
w x5 D.V. Kent and F.M. Gradstein, A Cretaceous and Jurassicgeochronology, GSA Bull. 96, 1419–1427, 1985.
w x6 D.V. Kent and F.M. Gradstein, A Jurassic to recent chronol-ogy, in: The Western North Atlantic Region, P.R. Vogt andB.E. Tucholke, eds., The Geology of North America, M, pp.45–50, GSA, Boulder, CO, 1986.
w x7 B.U. Haq, J. Hardenbol and P.R. Vail, Chronology of fluctu-ating sea levels since the Triassic, Science 235, 1156–1167,1987.
w x8 B.U. Haq, J. Hardenbol and P.R. Vail, Mesozoic and Ceno-zoic chronostratigraphy and cycles of sea level change, SEPMSpec. Publ. 42, 71–108, 1988.
w x9 W.B. Harland, R.L. Armstrong, A.V. Cox, L.E. Craig, A.G.Smith and D.G. Smith, A Geologic Time Scale 1989, 263pp., Cambridge Univ. Press, Cambridge, 1990.
w x10 G.S. Odin, Geological time scale, C.R. Acad. Sci. Ser. 2 318,59–71, 1994.
w x11 F.M. Gradstein, F.P. Agterberg, J.G. Ogg, J. Hardenbol, P.van Veen, J. Thierry and Z. Huang, A Mesozoic time scale,J. Geophys. Res. B 99, 24,051–24,074, 1994.
w x12 F.M. Gradstein, F.P. Agterberg, J.G. Ogg, J. Hardenbol, P.van Veen, J. Thierry and Z. Huang, A Triassic, Jurassic, andCretaceous time scale, in: Geochronology, Time Scales andGlobal Stratigraphic Correlation, W.A. Berggren, D.V. Kent,M.-P. Aubry and J. Hardenbol, eds., SEPM Spec. Publ. 54,95–126, 1995.
w x13 J. Palfy, P.L. Smith, J.K. Mortensen, R.M. Friedman, V.J.´McNicoll, R.R. Parrish and R.G. Anderson, Progress onCordilleran Jurassic time scale calibration, Geol. Assoc. Can.Progr. Abs. 20, A-79, 1995.
w x14 G.K. Jakobs, P.L. Smith and H.W. Tipper, An ammoniteŽ .zonation for the Toarcian Lower Jurassic of the North
American Cordillera, Can. J. Earth Sci. 31, 919–942, 1994.w x15 M. Springer and A. Lilje, Biostratigraphy and gap analysis;
the expected sequence of biostratigraphic events, J. Geol. 96,228–236, 1988.
w x16 C.R. Marshall, Confidence intervals on stratigraphic ranges,Paleobiology 16, 1–10, 1990.
w x17 J. Guex, Biochronological Correlations, 252 pp., Springer,Berlin, 1991.
w x18 J.W.H. Monger, J.O. Wheeler, H.W. Tipper, H. Gabrielse, T.Harms, L.C. Struik, R.B. Campbell, C.J. Dodds, G.E. Gehrelsand J. O’Brien, Cordilleran terranes, in: Upper Devonian toMiddle Jurassic assemblages, in: Geology of the CordilleranOrogen in Canada, H. Gabrielse and C.J. Yorath, eds.,
ŽGeology of Canada 4 also The Geology of North America. Ž .G-2 , pp. 281–327, Geol. Surv. Can. also GSA , 1991.
w x19 B.E.B. Cameron and H.W. Tipper, Jurassic stratigraphy ofthe Queen Charlotte Islands, British Columbia, Geol. Surv.Can. Bull. 365, 1–49, 1985.
w x20 T.E. Krogh, Improved accuracy of U–Pb zircon ages by thecreation of more concordant systems using an air abrasiontechnique, Geochim. Cosmochim. Acta 46, 637–649, 1982.
w x21 R.R. Parrish, J.C. Roddick, W.D. Loveridge and R.W. Sulli-van, Uranium–lead analytical techniques at the geochronol-ogy laboratory, Geological Survey of Canada, Geol. Surv.Can. Pap. 87-2, 3–7, 1987.
w x22 J.C. Roddick, W.D. Loveridge and R.R. Parrish, PreciseU–Pb dating of zircon at the sub-nanogram Pb level, Chem.Geol. Isot. Geosci. Sect. 66, 111–121, 1987.
w x23 R.H. Steiger and E. Jager, Subcommission on geochronol-¨ogy: Convention on the use of decay constants in geo- andcosmochronology, Earth Planet. Sci. Lett. 36, 359–362, 1977.
w x24 J.C. Roddick, Generalized numerical error analysis with ap-plications to geochronology and thermodynamics, Geochim.Cosmochim. Acta 51, 2129–2135, 1987.
w x25 J.S. Stacey and J.D. Kramers, Approximation of terrestriallead isotope evolution by a two-stage model, Earth Planet.Sci. Lett. 26, 207–221, 1975.
w x26 R. Mundil, P. Brack, M. Meier, H. Rieber and F. Oberli,High resolution U–Pb dating of Middle Triassic volcaniclas-tics: Time-scale calibration and verification of tuning param-eters for carbonate sedimentation, Earth Planet. Sci. Lett.141, 137–151, 1996.
w x27 P.L. Smith, H.W. Tipper, D.G. Taylor and J. Guex, Anammonite zonation for the Lower Jurassic of Canada and theUnited States: the Pliensbachian, Can. J. Earth Sci. 25,1503–1523, 1988.
w x28 J.H. Callomon, Biostratigraphy, chronostratigraphy and allthat — again!, in: Int. Symp. on Jurassic Stratigraphy,Erlangen, O. Michelsen and A. Zeiss, eds., pp. 611–624,Geol. Surv. Den., 1984.
w x29 G.K. Jakobs, Toarcian ammonite faunas from the NorthAmerican Cordillera, Geol. Surv. Can. Bull. 428, in press,1997.
w x30 C.R.C. Paul, The adequacy of the fossil record, in: Problemsof Phylogenetic Reconstruction, K.A. Joysey and A.E. Fri-day, eds., Syst. Assoc. Spec. Vol. 21, 75–117, 1982.
w x31 P.W. Signor and J.H. Lipps, Sampling bias, gradual extinc-tion patterns and catastrophes in the fossil record, in: Geolog-ical Implications of Impacts of Large Asteroids and Cometson the Earth, L.T. Silver and P.H. Schiltz, eds., GSA Spec.Pap. 190, 291–296, 1982.
w x32 S. Elmi, J. Gabilly, R. Mouterde, L. Rulleau and R.B. Rocha,L’etage Toarcien de l’Europe et de la Tethys; Divisions et´ ´correlations, Geobios Mem. Spec. 17, 149–159, 1994.´ ´
w x33 W.T. Dean, D.T. Donovan and M.K. Howarth, The Liassicammonite zones and subzones of the northwest Europeanprovince, Bull. Brit. Mus. Nat. Hist. Geol. 4, 438–505, 1961.
w x34 L.E. Edwards, Quantitative biostratigraphy: The methodshould suit the data, in: Quantitative Stratigraphic Correla-tion, J.M. Cubitt and R.A. Reyment, eds., pp. 45–60, Wiley,Chichester, 1982.
w x35 K.O. Mann and H.R. Lane, Graphic Correlation, 263 pp.,SEPM, Tulsa, OK, 1995.
w x36 F.P. Agterberg, Automated Stratigraphic Correlation, 424pp., Elsevier, New York, NY, 1990.

( )J. Palfy et al.rEarth and Planetary Science Letters 146 1997 659–675´ 675
w x37 J. Savary and J. Guex, BioGraph: un nouveau programme deconstruction des correlations biochronologiques basees sur´ ´les associations unitaires, Bull. Geol. Lausanne 313, 317–340,´1991.
w x38 P.O. Baumgartner, Comparison of unitary associations andprobabilistic ranking and scaling as applied to Mesozoicradiolarians, Comput. Geosci. 10, 167–183, 1984.
w x39 P.O. Baumgartner, Early Cretaceous radiolarians of theŽNortheast Indian Ocean Leg 123: Sites 765, 766 and DSDP
.site 261 : The Antarctic–Tethys connection, Mar. Micropale-ontol. 21, 329–352, 1993.
w x40 J.-L. Dommergues and C. Meister, La biostratigraphie desŽ .ammonites du Carixien Jurassique inferieur d’Europe occi-´
dentale: un test de la methode des associations unitaires,´Eclog. Geol. Helv. 80, 919–938, 1987.
w x41 D.T. Donovan, J.H. Callomon and M.K. Howarth, Classifica-tion of the Jurassic Ammonitina, in: The Ammonoidea, M.R.House and J.R. Senior, eds., Syst. Assoc. Spec. Publ. 18,101–155, 1981.
w x42 M.K. Howarth, The ammonite family Hildoceratidae in theLower Jurassic of Britain, Palaeontogr. Soc. Monogr. Lon-don 145–146, Publ. No. 586 and 590, 1–200, 1992.
w x43 A.V. Kottek, Die Ammonitenabfolge des griechischen Toar-cium, Ann. Geol. Pays Hell. 17, 1–157, 1966.´
w x44 M.F. Gallitelli Wendt, Ammoniti e stratigrafia del ToarcianoŽ .umbro-marchigiano Appennino centrale , Boll. Soc. Paleon-
tol. Ital. 8, 11–62, 1970.w x45 J. Guex, Repartition biostratigraphique des ammonites du´
Ž .Toarcien moyen de la bordure sud des Causses France etrevision des ammonites decrites et figurees par Monestier´ ´ ´Ž .1931 , Eclog. Geol. Helv. 65, 611–645, 1972.
w x46 S. Elmi, F. Atrops and C. Mangold, Les zones d’ammonites
du Domerien–Callovien de l’Algerie occidentale — Premiere´ ´ `partie: Domerien–Toarcien, Docum. Lab. Geol. Fac. Sci.´ ´Lyon 61, 1–84, 1974.
w x47 J. Gabilly, Le Toarcien a Thouars et dans le centre-ouest de`la France, 217 pp., Centre Natl. Rech. Sci., Paris, 1976.
w x48 S. Cresta, G. Pallini and F. Venturi, Jurassic ammoniteassemblages in the Valdorbia section, Mem. Descr. CartaGeol. Ital. 39, 89–94, 1989.
w x49 F. Venturi, Rapporti filetici e stratigrafici dei generi toarcianiMercaticeras, Brodieia, Hildoceras, Phymatoceras,Chartronia dell’Appennino Centrale, Riv. Ital. Paleontol.Stratigr. 81, 195–246, 1975.
w x50 J. Guex, Description biostratigraphique du Toarcien superieur´Ž .de la bordure sud des Causses France , Eclog. Geol. Helv.
68, 97–129, 1975.w x51 A. Goy and G. Martınez, Biozonacion del Toarciense en el´ ´
Žarea de La Almunia de Dona Godina-Ricla Sector Central´ ˜.de la Cordillera Iberica , Cuad. Geol. Iber. 14, 11–53, 1990.´
w x52 W.T. Dean, Notes on part of the Upper Lias succession atBlea Wyke, Yorkshire, Proc. Yorkshire Geol. Soc. 29, 161–179, 1954.
w x53 M.K. Howarth, The Jet Rock Series and the Alum ShaleSeries of the Yorkshire Coast, Proc. Yorkshire Geol. Soc. 33,381–422, 1962.
w x54 A. von Hillebrandt and R. Schmidt-Effing, Ammoniten ausŽ . Ž .dem Toarcium Jura von Chile Sudamerika , Zitteliana 6,¨
1–74, 1981.w x55 A. von Hillebrandt, Liassic ammonite zones of South Amer-
ica and correlations with other provices, with descriptions ofnew genera and species of ammonites, in: Biostratigrafia delos Sistemas Regionales del Jurasico y Cretacico en America´ ´ ´del Sur 1, pp. 111–157, Mendoza, 1987.