Embed Size (px)
Citation preview
Ed Charmley
Richard Williams
Peter Moate
Murray Hannah
Roger Hegarty
A universal equation to predict methane production of forage-fed cattle in Australia
Robert Herd
Hutton Oddy
Penny Reyenga
Kyran Staunton
Angela Anderson
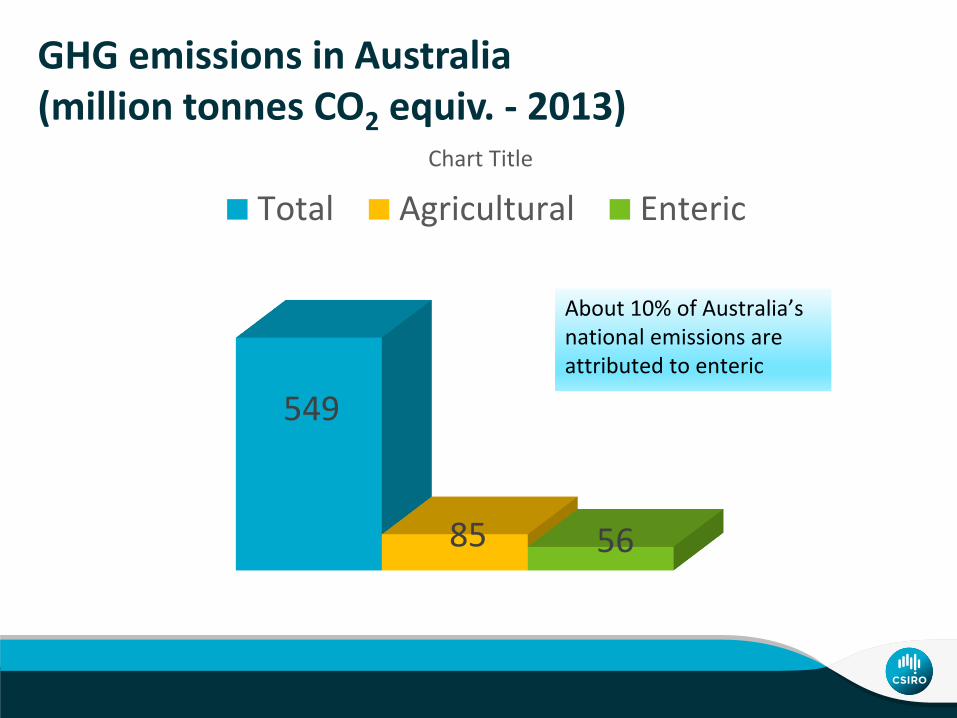
GHG emissions in Australia (million tonnes CO2 equiv. - 2013)
549
85 56
Chart Title
Total Agricultural Enteric
About 10% of Australia’s national emissions are attributed to enteric
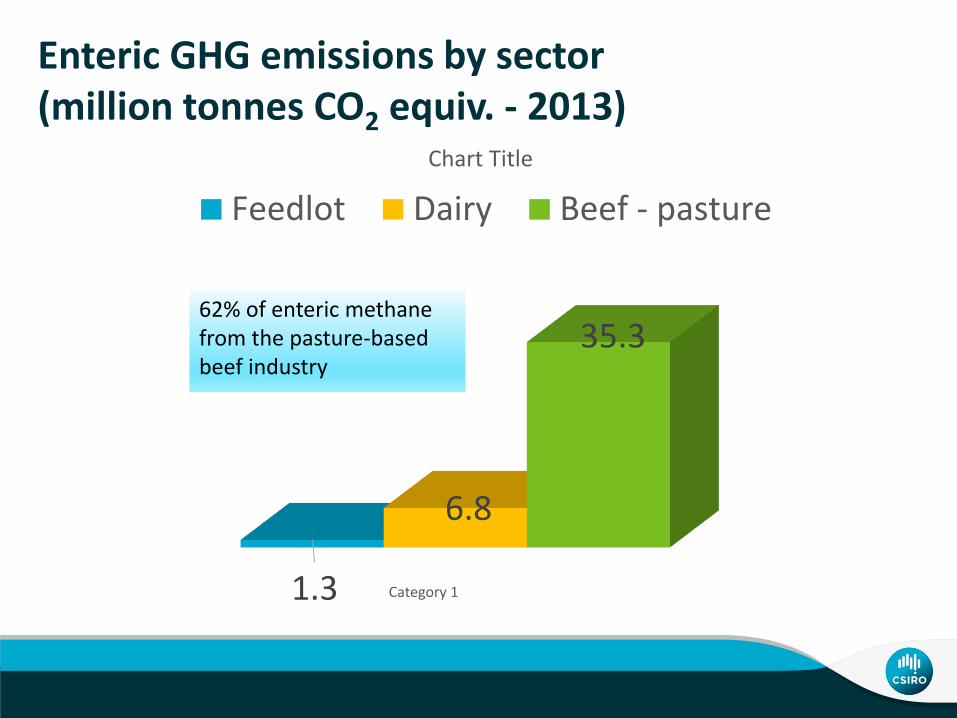
Enteric GHG emissions by sector(million tonnes CO2 equiv. - 2013)
Category 11.3
6.8
35.3
Chart Title
Feedlot Dairy Beef - pasture
62% of enteric methane from the pasture-based beef industry
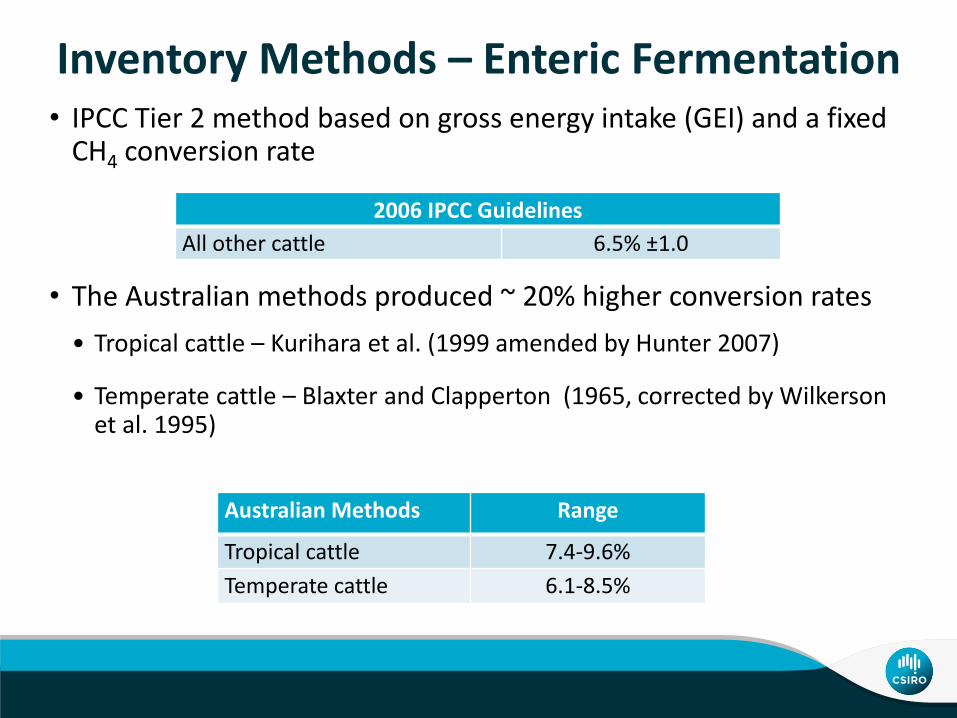
Inventory Methods – Enteric Fermentation• IPCC Tier 2 method based on gross energy intake (GEI) and a fixed
CH4 conversion rate
• The Australian methods produced ~ 20% higher conversion rates
• Tropical cattle – Kurihara et al. (1999 amended by Hunter 2007)
• Temperate cattle – Blaxter and Clapperton (1965, corrected by Wilkerson et al. 1995)
2006 IPCC Guidelines
All other cattle 6.5% ±1.0
Australian Methods Range
Tropical cattle 7.4-9.6%
Temperate cattle 6.1-8.5%
Tropical Cattle method
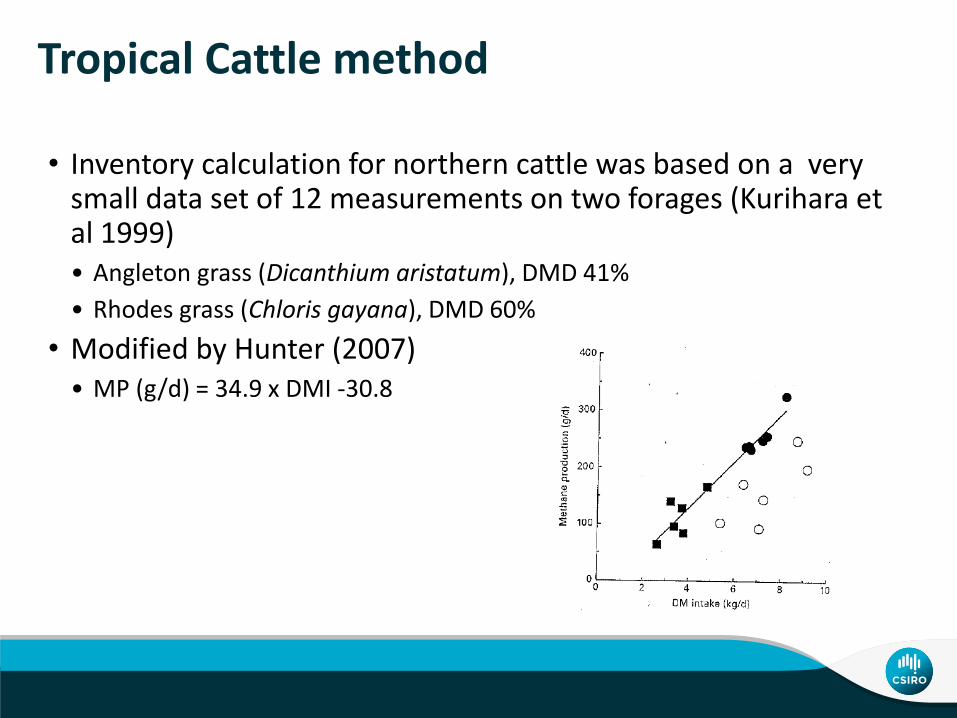
• Inventory calculation for northern cattle was based on a very small data set of 12 measurements on two forages (Kurihara et al 1999)• Angleton grass (Dicanthium aristatum), DMD 41%
• Rhodes grass (Chloris gayana), DMD 60%
• Modified by Hunter (2007) • MP (g/d) = 34.9 x DMI -30.8
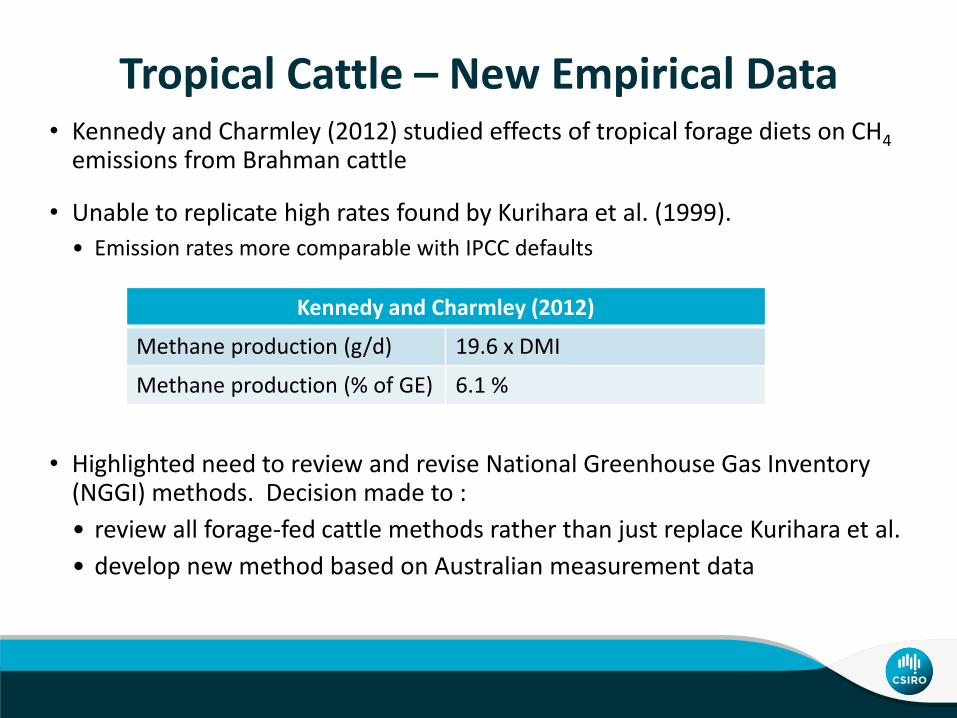
Tropical Cattle – New Empirical Data• Kennedy and Charmley (2012) studied effects of tropical forage diets on CH4
emissions from Brahman cattle
• Unable to replicate high rates found by Kurihara et al. (1999).
• Emission rates more comparable with IPCC defaults
• Highlighted need to review and revise National Greenhouse Gas Inventory (NGGI) methods. Decision made to :
• review all forage-fed cattle methods rather than just replace Kurihara et al.
• develop new method based on Australian measurement data
Kennedy and Charmley (2012)
Methane production (g/d) 19.6 x DMI
Methane production (% of GE) 6.1 %
Developing a New Cattle Method• Substantial CH4 dataset available for dairy and beef cattle
through recent research programs• Reducing Emissions from Livestock Research Program
• National Livestock Methane Program.
• Department of Environment convened working group to reanalyse the available measurement data and to prepare a paper for publication
• Working Group set following data boundaries:• Look for the simplest relationship that adequately described the data
• Only diets with <30% concentrate
• Only data from methane chambers
• Only data from diets known not to inhibit methanogenesis
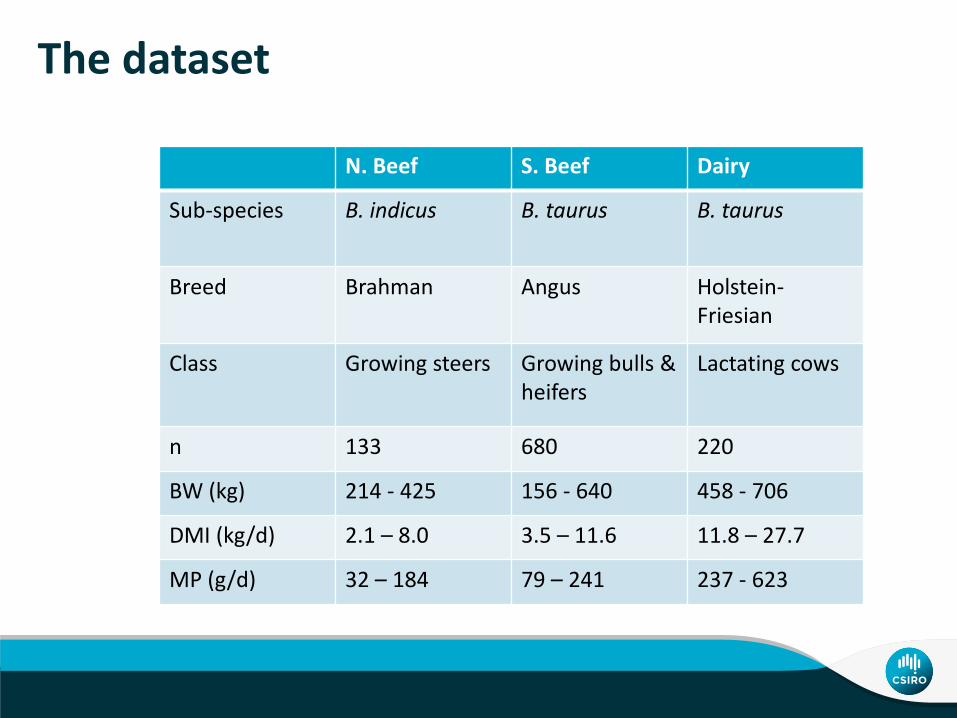
The dataset
N. Beef S. Beef Dairy
Sub-species B. indicus B. taurus B. taurus
Breed Brahman Angus Holstein-Friesian
Class Growing steers Growing bulls & heifers
Lactating cows
n 133 680 220
BW (kg) 214 - 425 156 - 640 458 - 706
DMI (kg/d) 2.1 – 8.0 3.5 – 11.6 11.8 – 27.7
MP (g/d) 32 – 184 79 – 241 237 - 623

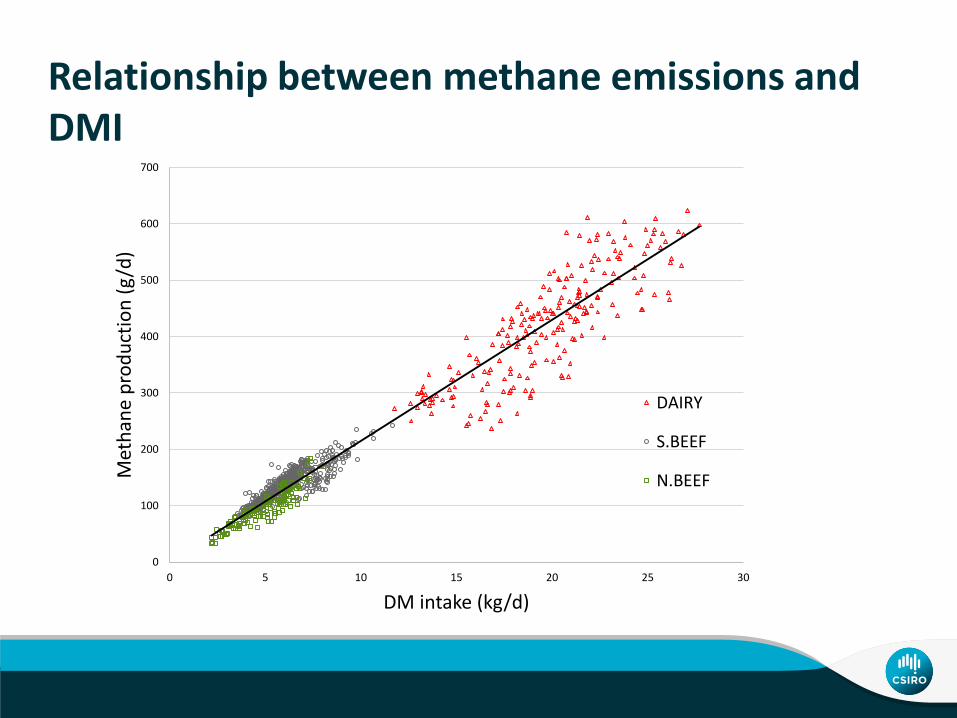
Relationship between methane emissions and DMI
0
100
200
300
400
500
600
700
0 5 10 15 20 25 30
Met
han
e p
rod
uct
ion
(g
/d)
DM intake (kg/d)
DAIRY
S.BEEF
N.BEEF
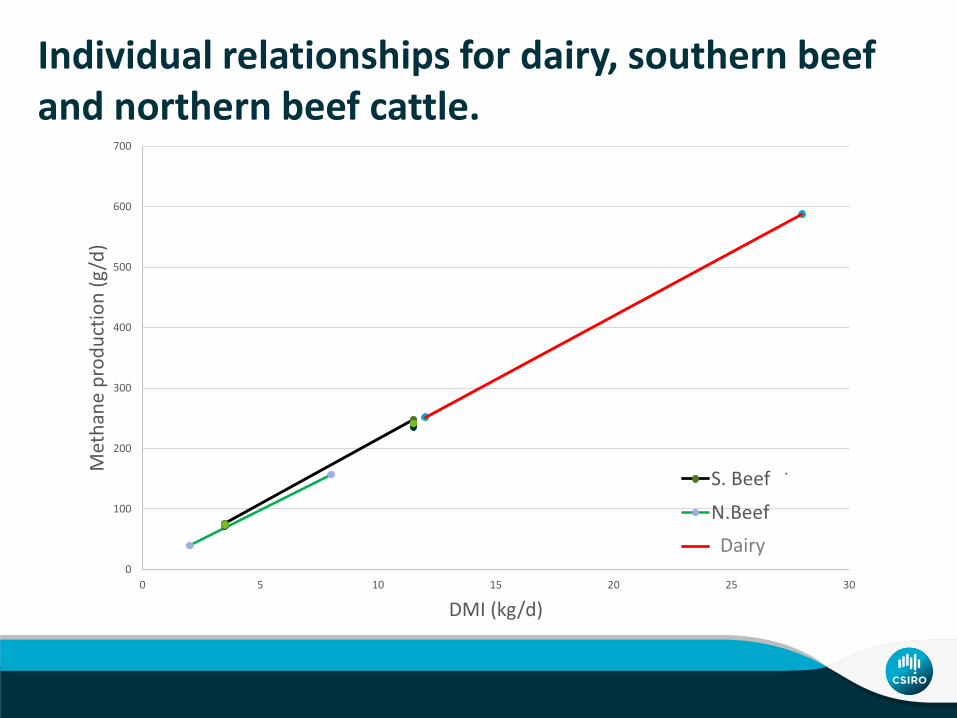
Individual relationships for dairy, southern beef and northern beef cattle.
0
100
200
300
400
500
600
700
0 5 10 15 20 25 30
Met
han
e p
rod
uct
ion
(g
/d)
DMI (kg/d)
S. Beef steer
N.Beef
Linear (Dairy)Dairy
Relationship between methane emissions and DMI
0
100
200
300
400
500
600
700
0 5 10 15 20 25 30
Met
han
e p
rod
uct
ion
(g
/d)
DM intake (kg/d)
DAIRY
S.BEEF
N.BEEF
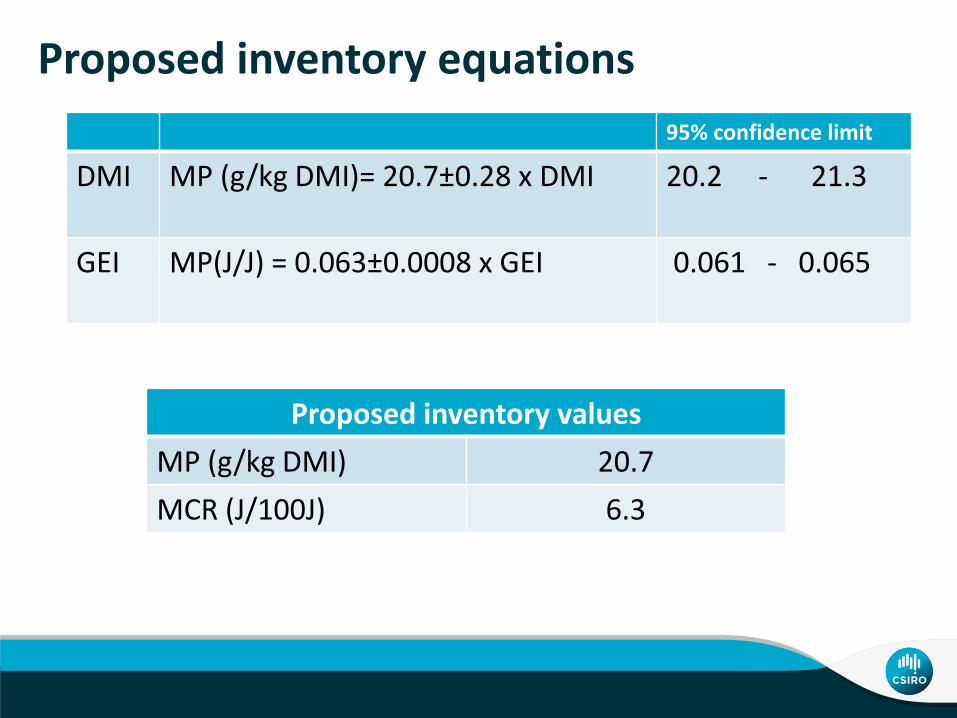
Proposed inventory equations
Proposed inventory values
MP (g/kg DMI) 20.7
MCR (J/100J) 6.3
95% confidence limit
DMI MP (g/kg DMI)= 20.7±0.28 x DMI 20.2 - 21.3
GEI MP(J/J) = 0.063±0.0008 x GEI 0.061 - 0.065
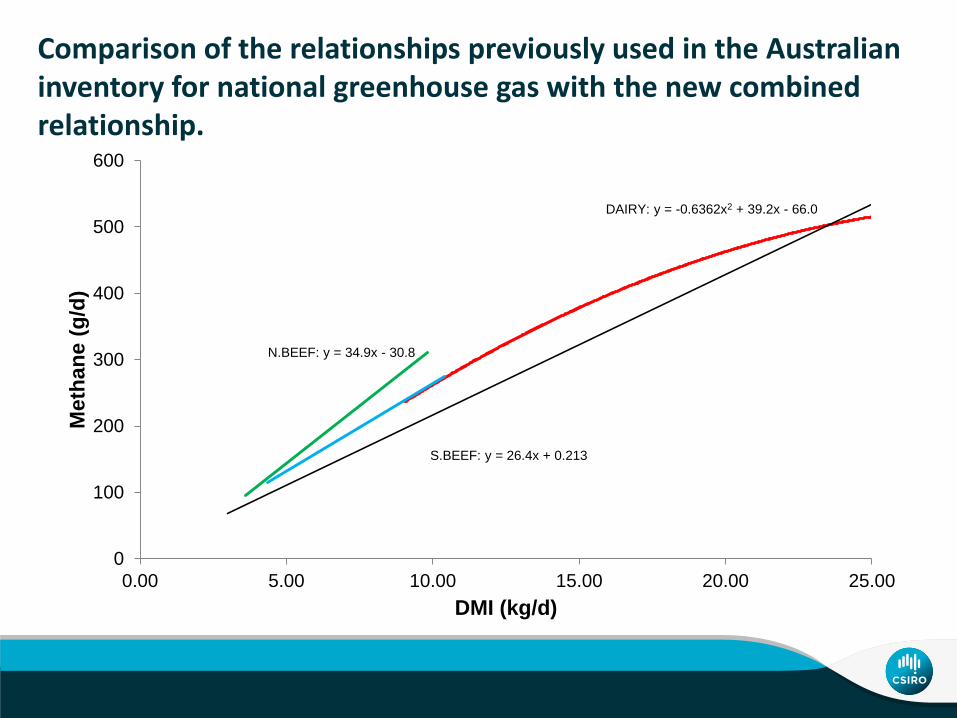
Comparison of the relationships previously used in the Australian inventory for national greenhouse gas with the new combined relationship.
DAIRY: y = -0.6362x2 + 39.2x - 66.0
S.BEEF: y = 26.4x + 0.213
N.BEEF: y = 34.9x - 30.8
0
100
200
300
400
500
600
0.00 5.00 10.00 15.00 20.00 25.00
Meth
an
e (
g/d
)
DMI (kg/d)
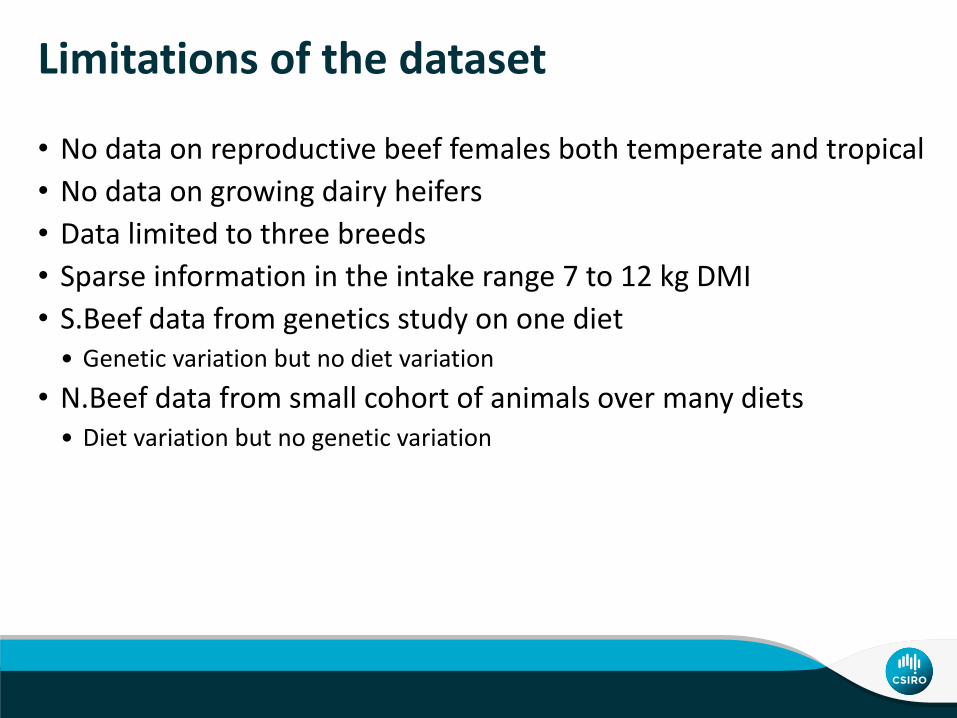
Limitations of the dataset
• No data on reproductive beef females both temperate and tropical
• No data on growing dairy heifers
• Data limited to three breeds
• Sparse information in the intake range 7 to 12 kg DMI
• S.Beef data from genetics study on one diet• Genetic variation but no diet variation
• N.Beef data from small cohort of animals over many diets• Diet variation but no genetic variation
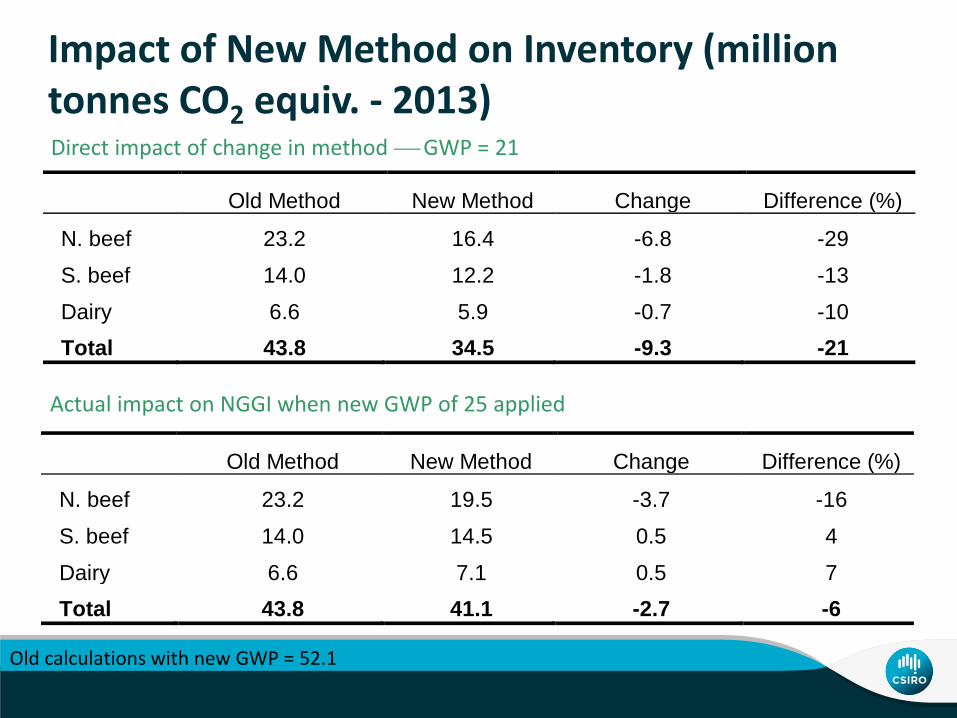
Impact of New Method on Inventory (million tonnes CO2 equiv. - 2013)
Old Method New Method Change Difference (%)
N. beef 23.2 16.4 -6.8 -29
S. beef 14.0 12.2 -1.8 -13
Dairy 6.6 5.9 -0.7 -10
Total 43.8 34.5 -9.3 -21
1
Direct impact of change in method GWP = 21
Old Method New Method Change Difference (%)
N. beef 23.2 19.5 -3.7 -16
S. beef 14.0 14.5 0.5 4
Dairy 6.6 7.1 0.5 7
Total 43.8 41.1 -2.7 -6
1
Actual impact on NGGI when new GWP of 25 applied
Old calculations with new GWP = 52.1
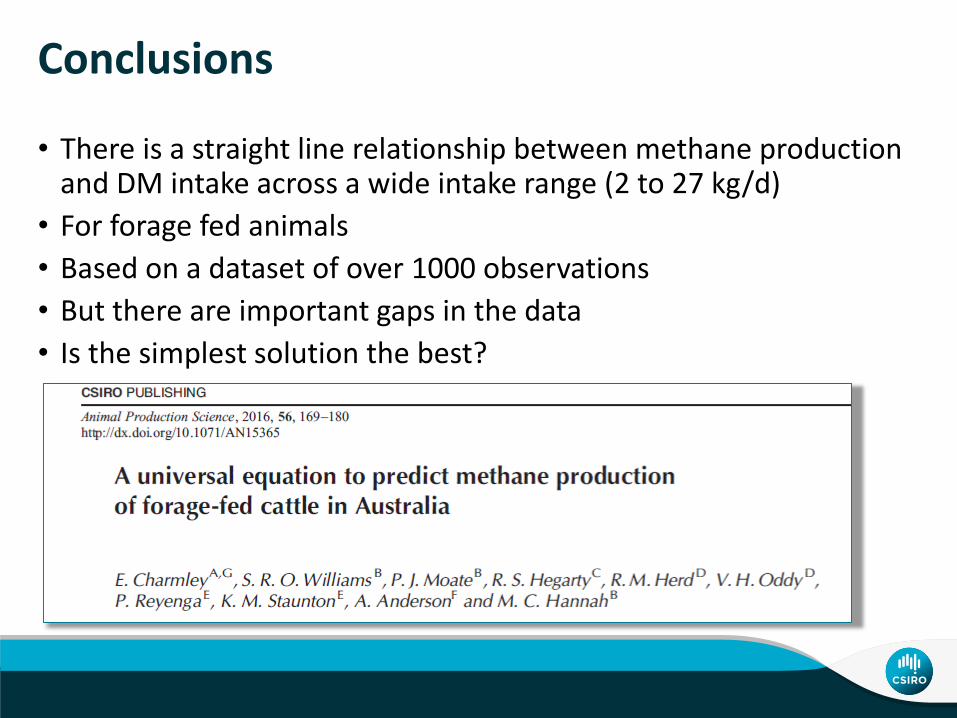
Conclusions
• There is a straight line relationship between methane production and DM intake across a wide intake range (2 to 27 kg/d)
• For forage fed animals
• Based on a dataset of over 1000 observations
• But there are important gaps in the data
• Is the simplest solution the best?