Embed Size (px)
Citation preview
A unifying view of climate change in the Sahel linking intra-seasonal, interannual and longer
time scales
This content has been downloaded from IOPscience. Please scroll down to see the full text.
Download details:
IP Address: 140.247.0.38
This content was downloaded on 26/09/2013 at 20:30
Please note that terms and conditions apply.
2013 Environ. Res. Lett. 8 024010
(http://iopscience.iop.org/1748-9326/8/2/024010)
View the table of contents for this issue, or go to the journal homepage for more
Home Search Collections Journals About Contact us My IOPscience
IOP PUBLISHING ENVIRONMENTAL RESEARCH LETTERS
Environ. Res. Lett. 8 (2013) 024010 (8pp) doi:10.1088/1748-9326/8/2/024010
A unifying view of climate change in theSahel linking intra-seasonal, interannualand longer time scales
A Giannini1, S Salack2,3,7, T Lodoun4, A Ali5, A T Gaye2 and O Ndiaye6
1 International Research Institute for Climate and Society (IRI), The Earth Institute at ColumbiaUniversity, 61 Rt 9W, Palisades, NY 10964-8000, USA2 Laboratoire de Physique de l’Atmosphere et de l’Ocean—Simeon Fongang, ESP, Universite CheikhAnta Diop, Dakar, Senegal3 Centre d’Etude Regional pour l’Amelioration de l’Adaptation a la Secheresse (CERAAS), BP 3320,Thies Escale, Thies, Senegal4 Institut de l’Environnement et de Recherches Agronomiques (INERA), PO Box 476, Ouagadougou,Burkina Faso5 Centre Regional AGRHYMET, BP 11011, Niamey, Niger6 Agence Nationale de l’Avion Civile et de la Meteorologie du Senegal (ANACIM), Senegal
E-mail: [email protected] (A Giannini)
Received 17 January 2013Accepted for publication 28 March 2013Published 18 April 2013Online at stacks.iop.org/ERL/8/024010
AbstractWe propose a re-interpretation of the oceanic influence on the climate of the African Sahel that isconsistent across observations, 20th century simulations and 21st century projections, and that resolvesthe uncertainty in projections of precipitation change in this region: continued warming of the globaltropical oceans increases the threshold for convection, potentially drying tropical land, but this ‘uppedante’ can be met if sufficient moisture is supplied in monsoon flow. In this framework, the reversal towarming of the subtropical North Atlantic, which is now out-pacing warming of the global tropicaloceans, provides that moisture, and explains the partial recovery in precipitation since persistentdrought in the 1970s and 1980s. We find this recovery to result from increases in daily rainfall intensity,rather than in frequency, most evidently so in Senegal, the westernmost among the three Saheliancountries analyzed. Continuation of these observed trends is consistent with projections for an overallwetter Sahel, but more variable precipitation on all time scales, from intra-seasonal to multi-decadal.
Keywords: regional climate change, precipitation projections, Sahel, drought, character ofprecipitation, daily precipitation, frequency of precipitation, intensity of precipitation, Senegal, BurkinaFaso, Niger
1. Introduction
The Sahel, the semi-arid southern edge of the Sahara desert,has long focused the attention of climate scientists and
Content from this work may be used under the terms ofthe Creative Commons Attribution 3.0 licence. Any further
distribution of this work must maintain attribution to the author(s) and thetitle of the work, journal citation and DOI.7 Present address: Centre Regional AGRHYMET, BP 11011, Niamey, Niger.
development practitioners. Only 30 years ago in the grip ofmulti-decadal drought [1] and recurrent food insecurity [2],it is now rebounding by building resilient ecosystems andlivelihoods [3–5]. However, persistent poverty and insufficientinvestment in agricultural development recurrently raiseconcerns about the impact of drought [6], while disagreementin projections of regional precipitation change [7–9], asituation common throughout the tropics [10, 11], limits thepractical use of climate information in charting developmenton adaptation time scales.
11748-9326/13/024010+08$33.00 c© 2013 IOP Publishing Ltd Printed in the UK
Environ. Res. Lett. 8 (2013) 024010 A Giannini et al
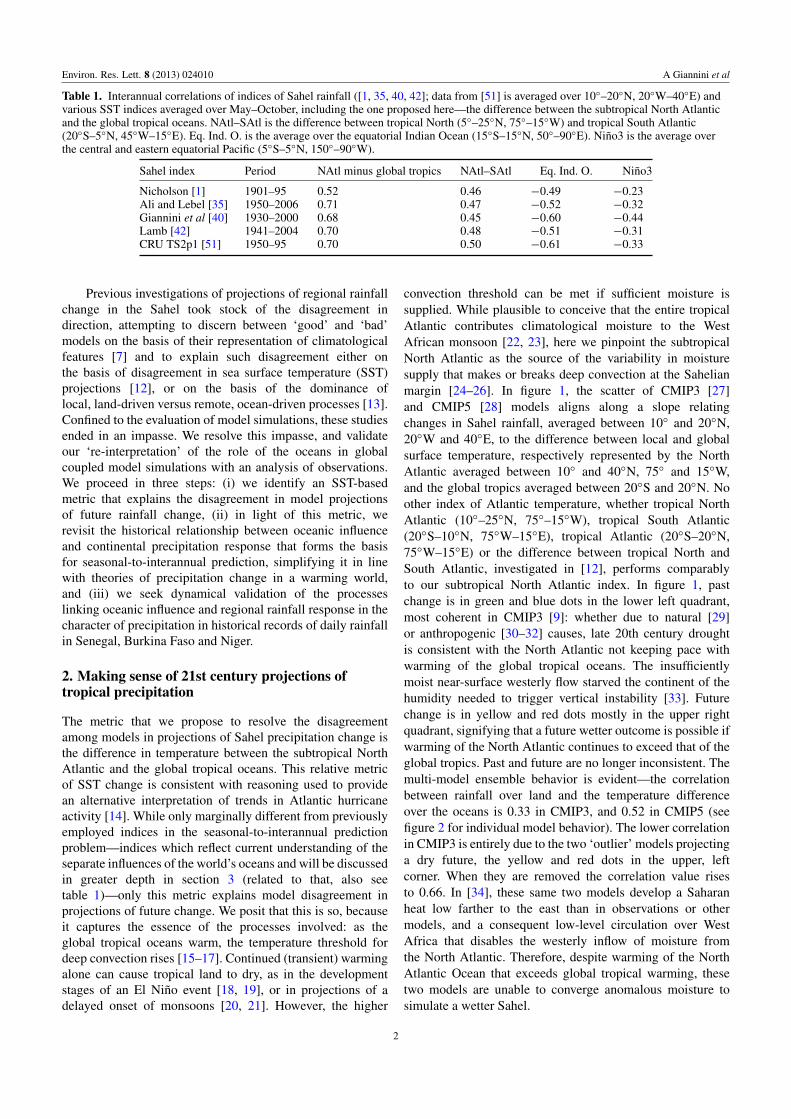
Table 1. Interannual correlations of indices of Sahel rainfall ([1, 35, 40, 42]; data from [51] is averaged over 10◦–20◦N, 20◦W–40◦E) andvarious SST indices averaged over May–October, including the one proposed here—the difference between the subtropical North Atlanticand the global tropical oceans. NAtl–SAtl is the difference between tropical North (5◦–25◦N, 75◦–15◦W) and tropical South Atlantic(20◦S–5◦N, 45◦W–15◦E). Eq. Ind. O. is the average over the equatorial Indian Ocean (15◦S–15◦N, 50◦–90◦E). Nino3 is the average overthe central and eastern equatorial Pacific (5◦S–5◦N, 150◦–90◦W).
Sahel index Period NAtl minus global tropics NAtl–SAtl Eq. Ind. O. Nino3
Nicholson [1] 1901–95 0.52 0.46 −0.49 −0.23Ali and Lebel [35] 1950–2006 0.71 0.47 −0.52 −0.32Giannini et al [40] 1930–2000 0.68 0.45 −0.60 −0.44Lamb [42] 1941–2004 0.70 0.48 −0.51 −0.31CRU TS2p1 [51] 1950–95 0.70 0.50 −0.61 −0.33
Previous investigations of projections of regional rainfallchange in the Sahel took stock of the disagreement indirection, attempting to discern between ‘good’ and ‘bad’models on the basis of their representation of climatologicalfeatures [7] and to explain such disagreement either onthe basis of disagreement in sea surface temperature (SST)projections [12], or on the basis of the dominance oflocal, land-driven versus remote, ocean-driven processes [13].Confined to the evaluation of model simulations, these studiesended in an impasse. We resolve this impasse, and validateour ‘re-interpretation’ of the role of the oceans in globalcoupled model simulations with an analysis of observations.We proceed in three steps: (i) we identify an SST-basedmetric that explains the disagreement in model projectionsof future rainfall change, (ii) in light of this metric, werevisit the historical relationship between oceanic influenceand continental precipitation response that forms the basisfor seasonal-to-interannual prediction, simplifying it in linewith theories of precipitation change in a warming world,and (iii) we seek dynamical validation of the processeslinking oceanic influence and regional rainfall response in thecharacter of precipitation in historical records of daily rainfallin Senegal, Burkina Faso and Niger.
2. Making sense of 21st century projections oftropical precipitation
The metric that we propose to resolve the disagreementamong models in projections of Sahel precipitation change isthe difference in temperature between the subtropical NorthAtlantic and the global tropical oceans. This relative metricof SST change is consistent with reasoning used to providean alternative interpretation of trends in Atlantic hurricaneactivity [14]. While only marginally different from previouslyemployed indices in the seasonal-to-interannual predictionproblem—indices which reflect current understanding of theseparate influences of the world’s oceans and will be discussedin greater depth in section 3 (related to that, also seetable 1)—only this metric explains model disagreement inprojections of future change. We posit that this is so, becauseit captures the essence of the processes involved: as theglobal tropical oceans warm, the temperature threshold fordeep convection rises [15–17]. Continued (transient) warmingalone can cause tropical land to dry, as in the developmentstages of an El Nino event [18, 19], or in projections of adelayed onset of monsoons [20, 21]. However, the higher
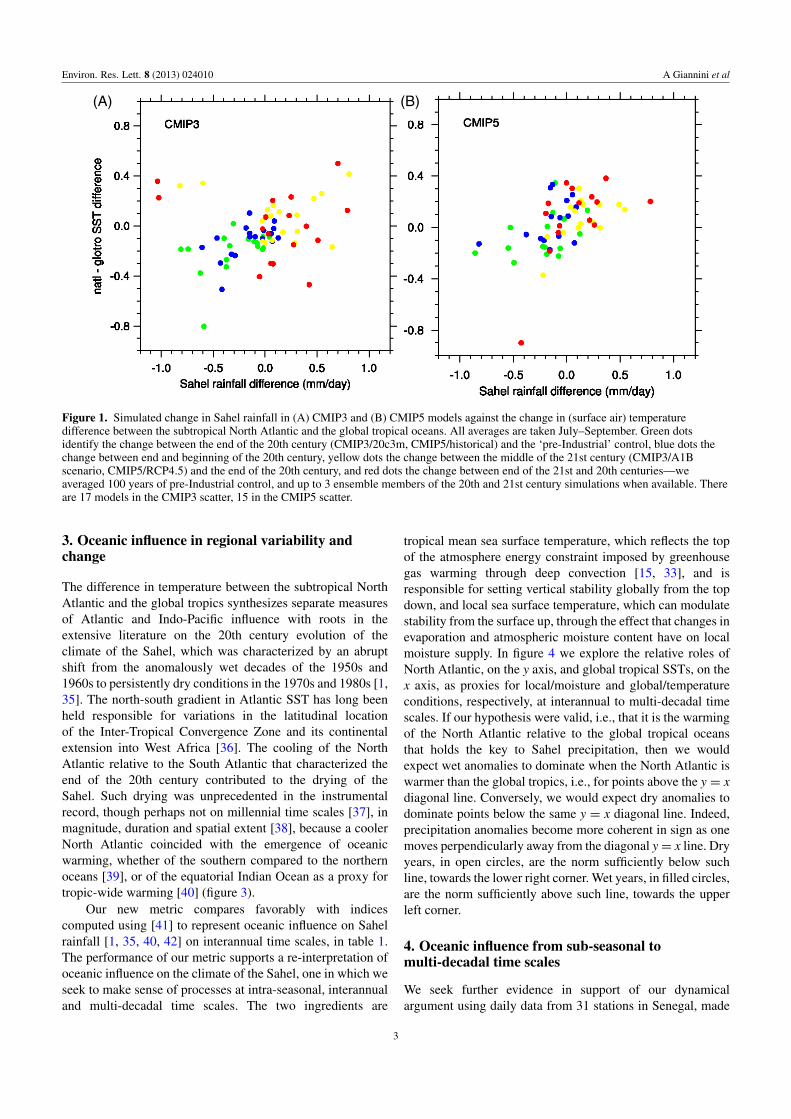
convection threshold can be met if sufficient moisture issupplied. While plausible to conceive that the entire tropicalAtlantic contributes climatological moisture to the WestAfrican monsoon [22, 23], here we pinpoint the subtropicalNorth Atlantic as the source of the variability in moisturesupply that makes or breaks deep convection at the Sahelianmargin [24–26]. In figure 1, the scatter of CMIP3 [27]and CMIP5 [28] models aligns along a slope relatingchanges in Sahel rainfall, averaged between 10◦ and 20◦N,20◦W and 40◦E, to the difference between local and globalsurface temperature, respectively represented by the NorthAtlantic averaged between 10◦ and 40◦N, 75◦ and 15◦W,and the global tropics averaged between 20◦S and 20◦N. Noother index of Atlantic temperature, whether tropical NorthAtlantic (10◦–25◦N, 75◦–15◦W), tropical South Atlantic(20◦S–10◦N, 75◦W–15◦E), tropical Atlantic (20◦S–20◦N,75◦W–15◦E) or the difference between tropical North andSouth Atlantic, investigated in [12], performs comparablyto our subtropical North Atlantic index. In figure 1, pastchange is in green and blue dots in the lower left quadrant,most coherent in CMIP3 [9]: whether due to natural [29]or anthropogenic [30–32] causes, late 20th century droughtis consistent with the North Atlantic not keeping pace withwarming of the global tropical oceans. The insufficientlymoist near-surface westerly flow starved the continent of thehumidity needed to trigger vertical instability [33]. Futurechange is in yellow and red dots mostly in the upper rightquadrant, signifying that a future wetter outcome is possible ifwarming of the North Atlantic continues to exceed that of theglobal tropics. Past and future are no longer inconsistent. Themulti-model ensemble behavior is evident—the correlationbetween rainfall over land and the temperature differenceover the oceans is 0.33 in CMIP3, and 0.52 in CMIP5 (seefigure 2 for individual model behavior). The lower correlationin CMIP3 is entirely due to the two ‘outlier’ models projectinga dry future, the yellow and red dots in the upper, leftcorner. When they are removed the correlation value risesto 0.66. In [34], these same two models develop a Saharanheat low farther to the east than in observations or othermodels, and a consequent low-level circulation over WestAfrica that disables the westerly inflow of moisture fromthe North Atlantic. Therefore, despite warming of the NorthAtlantic Ocean that exceeds global tropical warming, thesetwo models are unable to converge anomalous moisture tosimulate a wetter Sahel.
2
Environ. Res. Lett. 8 (2013) 024010 A Giannini et al
Figure 1. Simulated change in Sahel rainfall in (A) CMIP3 and (B) CMIP5 models against the change in (surface air) temperaturedifference between the subtropical North Atlantic and the global tropical oceans. All averages are taken July–September. Green dotsidentify the change between the end of the 20th century (CMIP3/20c3m, CMIP5/historical) and the ‘pre-Industrial’ control, blue dots thechange between end and beginning of the 20th century, yellow dots the change between the middle of the 21st century (CMIP3/A1Bscenario, CMIP5/RCP4.5) and the end of the 20th century, and red dots the change between end of the 21st and 20th centuries—weaveraged 100 years of pre-Industrial control, and up to 3 ensemble members of the 20th and 21st century simulations when available. Thereare 17 models in the CMIP3 scatter, 15 in the CMIP5 scatter.
3. Oceanic influence in regional variability andchange
The difference in temperature between the subtropical NorthAtlantic and the global tropics synthesizes separate measuresof Atlantic and Indo-Pacific influence with roots in theextensive literature on the 20th century evolution of theclimate of the Sahel, which was characterized by an abruptshift from the anomalously wet decades of the 1950s and1960s to persistently dry conditions in the 1970s and 1980s [1,35]. The north-south gradient in Atlantic SST has long beenheld responsible for variations in the latitudinal locationof the Inter-Tropical Convergence Zone and its continentalextension into West Africa [36]. The cooling of the NorthAtlantic relative to the South Atlantic that characterized theend of the 20th century contributed to the drying of theSahel. Such drying was unprecedented in the instrumentalrecord, though perhaps not on millennial time scales [37], inmagnitude, duration and spatial extent [38], because a coolerNorth Atlantic coincided with the emergence of oceanicwarming, whether of the southern compared to the northernoceans [39], or of the equatorial Indian Ocean as a proxy fortropic-wide warming [40] (figure 3).
Our new metric compares favorably with indicescomputed using [41] to represent oceanic influence on Sahelrainfall [1, 35, 40, 42] on interannual time scales, in table 1.The performance of our metric supports a re-interpretation ofoceanic influence on the climate of the Sahel, one in which weseek to make sense of processes at intra-seasonal, interannualand multi-decadal time scales. The two ingredients are
tropical mean sea surface temperature, which reflects the topof the atmosphere energy constraint imposed by greenhousegas warming through deep convection [15, 33], and isresponsible for setting vertical stability globally from the topdown, and local sea surface temperature, which can modulatestability from the surface up, through the effect that changes inevaporation and atmospheric moisture content have on localmoisture supply. In figure 4 we explore the relative roles ofNorth Atlantic, on the y axis, and global tropical SSTs, on thex axis, as proxies for local/moisture and global/temperatureconditions, respectively, at interannual to multi-decadal timescales. If our hypothesis were valid, i.e., that it is the warmingof the North Atlantic relative to the global tropical oceansthat holds the key to Sahel precipitation, then we wouldexpect wet anomalies to dominate when the North Atlantic iswarmer than the global tropics, i.e., for points above the y = xdiagonal line. Conversely, we would expect dry anomalies todominate points below the same y = x diagonal line. Indeed,precipitation anomalies become more coherent in sign as onemoves perpendicularly away from the diagonal y= x line. Dryyears, in open circles, are the norm sufficiently below suchline, towards the lower right corner. Wet years, in filled circles,are the norm sufficiently above such line, towards the upperleft corner.
4. Oceanic influence from sub-seasonal tomulti-decadal time scales
We seek further evidence in support of our dynamicalargument using daily data from 31 stations in Senegal, made
3
Environ. Res. Lett. 8 (2013) 024010 A Giannini et al
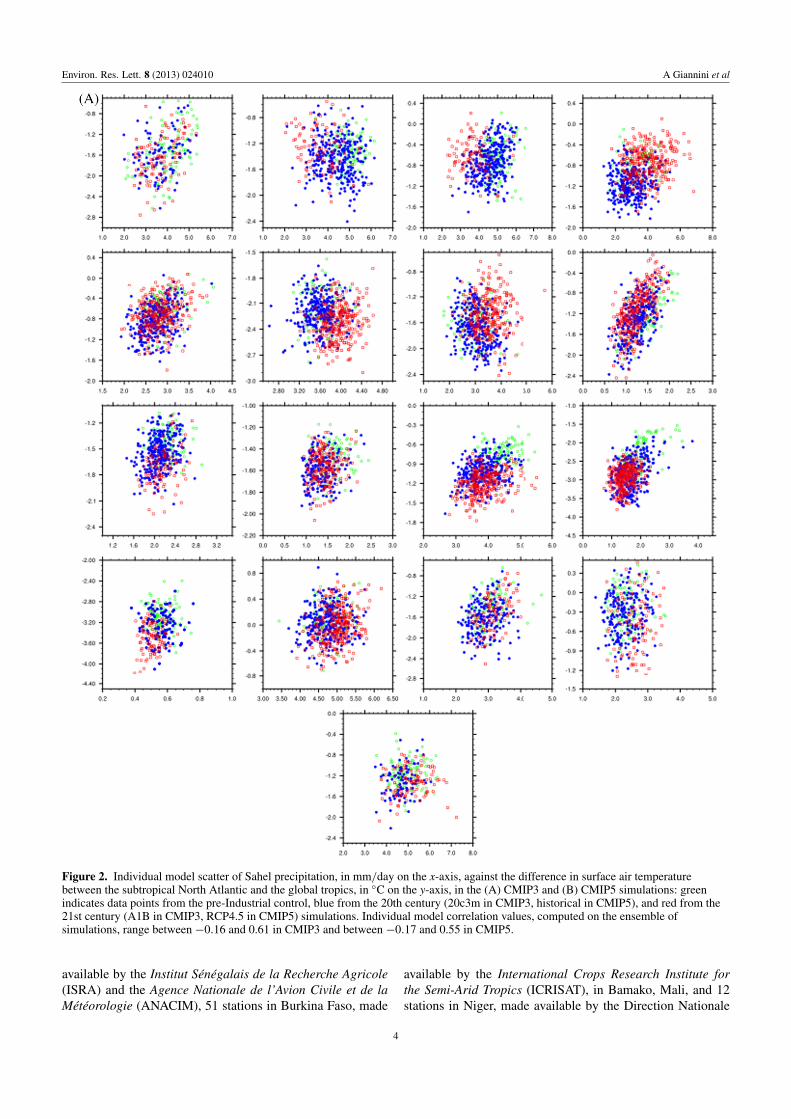
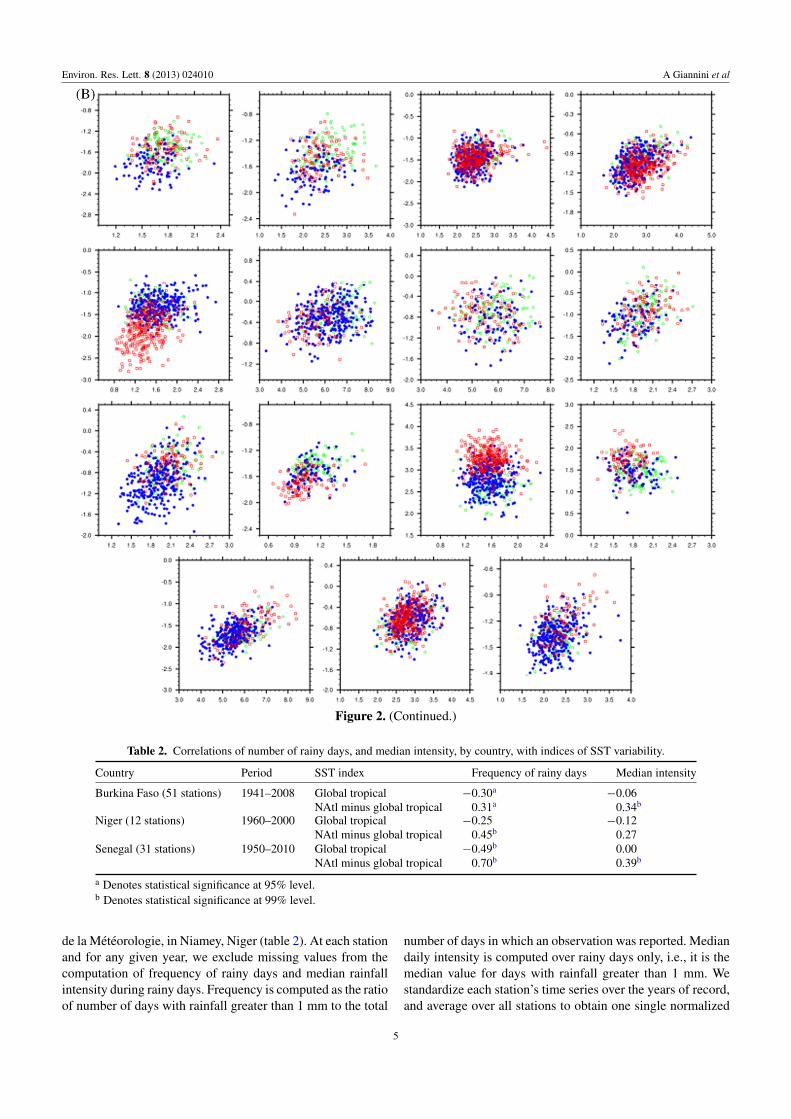
Figure 2. Individual model scatter of Sahel precipitation, in mm/day on the x-axis, against the difference in surface air temperaturebetween the subtropical North Atlantic and the global tropics, in ◦C on the y-axis, in the (A) CMIP3 and (B) CMIP5 simulations: greenindicates data points from the pre-Industrial control, blue from the 20th century (20c3m in CMIP3, historical in CMIP5), and red from the21st century (A1B in CMIP3, RCP4.5 in CMIP5) simulations. Individual model correlation values, computed on the ensemble ofsimulations, range between −0.16 and 0.61 in CMIP3 and between −0.17 and 0.55 in CMIP5.
available by the Institut Senegalais de la Recherche Agricole(ISRA) and the Agence Nationale de l’Avion Civile et de laMeteorologie (ANACIM), 51 stations in Burkina Faso, made
available by the International Crops Research Institute forthe Semi-Arid Tropics (ICRISAT), in Bamako, Mali, and 12stations in Niger, made available by the Direction Nationale
4
Environ. Res. Lett. 8 (2013) 024010 A Giannini et al
Figure 2. (Continued.)
Table 2. Correlations of number of rainy days, and median intensity, by country, with indices of SST variability.
Country Period SST index Frequency of rainy days Median intensity
Burkina Faso (51 stations) 1941–2008 Global tropical −0.30a−0.06
NAtl minus global tropical 0.31a 0.34b
Niger (12 stations) 1960–2000 Global tropical −0.25 −0.12NAtl minus global tropical 0.45b 0.27
Senegal (31 stations) 1950–2010 Global tropical −0.49b 0.00NAtl minus global tropical 0.70b 0.39b
a Denotes statistical significance at 95% level.b Denotes statistical significance at 99% level.
de la Meteorologie, in Niamey, Niger (table 2). At each stationand for any given year, we exclude missing values from thecomputation of frequency of rainy days and median rainfallintensity during rainy days. Frequency is computed as the ratioof number of days with rainfall greater than 1 mm to the total
number of days in which an observation was reported. Mediandaily intensity is computed over rainy days only, i.e., it is themedian value for days with rainfall greater than 1 mm. Westandardize each station’s time series over the years of record,and average over all stations to obtain one single normalized
5
Environ. Res. Lett. 8 (2013) 024010 A Giannini et al
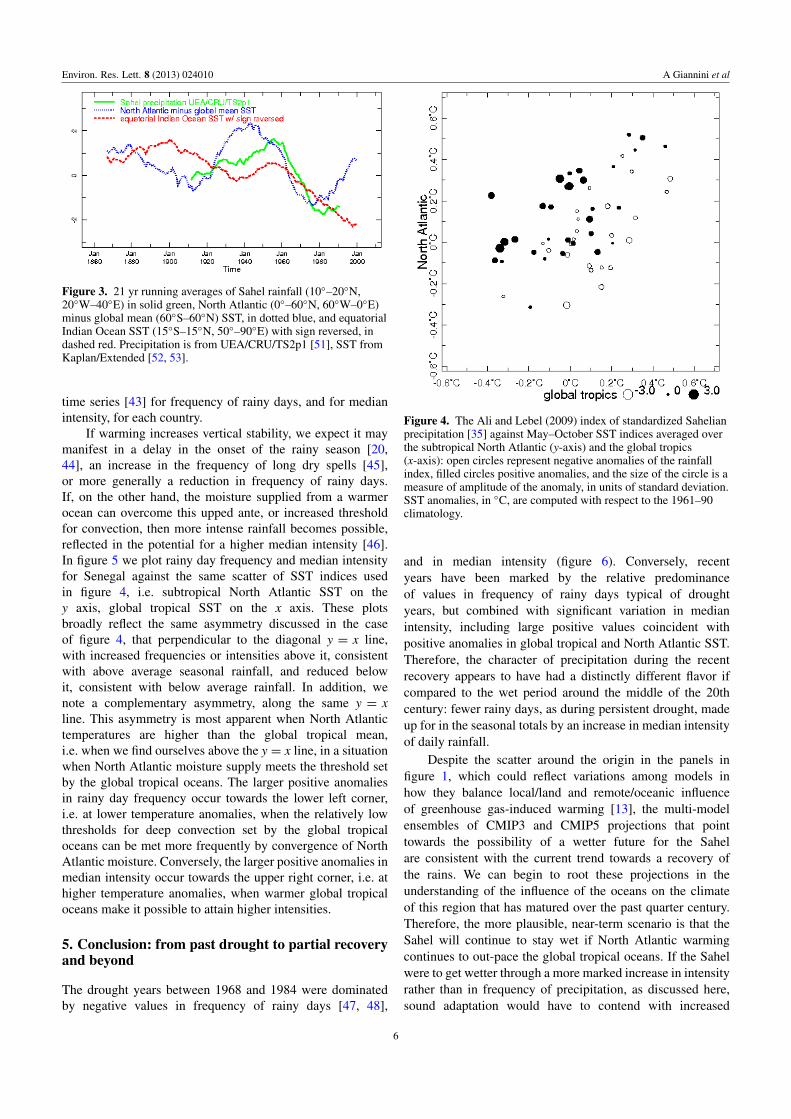
Figure 3. 21 yr running averages of Sahel rainfall (10◦–20◦N,20◦W–40◦E) in solid green, North Atlantic (0◦–60◦N, 60◦W–0◦E)minus global mean (60◦S–60◦N) SST, in dotted blue, and equatorialIndian Ocean SST (15◦S–15◦N, 50◦–90◦E) with sign reversed, indashed red. Precipitation is from UEA/CRU/TS2p1 [51], SST fromKaplan/Extended [52, 53].
time series [43] for frequency of rainy days, and for medianintensity, for each country.
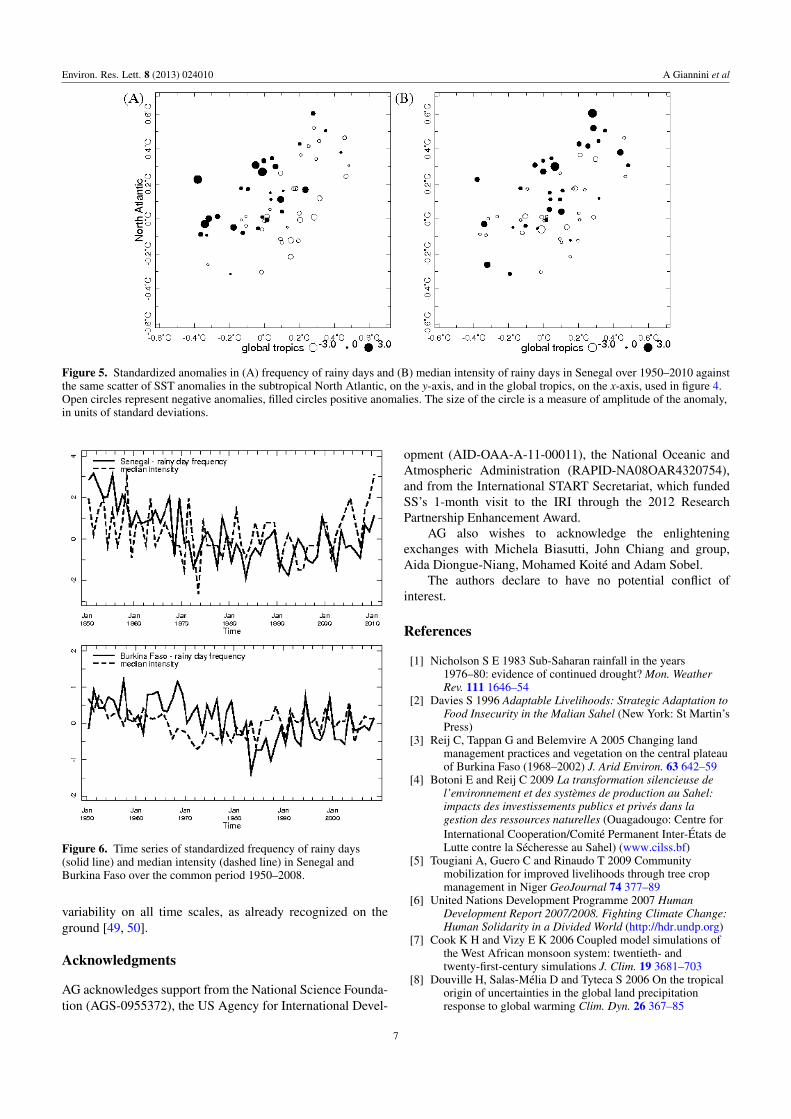
If warming increases vertical stability, we expect it maymanifest in a delay in the onset of the rainy season [20,44], an increase in the frequency of long dry spells [45],or more generally a reduction in frequency of rainy days.If, on the other hand, the moisture supplied from a warmerocean can overcome this upped ante, or increased thresholdfor convection, then more intense rainfall becomes possible,reflected in the potential for a higher median intensity [46].In figure 5 we plot rainy day frequency and median intensityfor Senegal against the same scatter of SST indices usedin figure 4, i.e. subtropical North Atlantic SST on they axis, global tropical SST on the x axis. These plotsbroadly reflect the same asymmetry discussed in the caseof figure 4, that perpendicular to the diagonal y = x line,with increased frequencies or intensities above it, consistentwith above average seasonal rainfall, and reduced belowit, consistent with below average rainfall. In addition, wenote a complementary asymmetry, along the same y = xline. This asymmetry is most apparent when North Atlantictemperatures are higher than the global tropical mean,i.e. when we find ourselves above the y = x line, in a situationwhen North Atlantic moisture supply meets the threshold setby the global tropical oceans. The larger positive anomaliesin rainy day frequency occur towards the lower left corner,i.e. at lower temperature anomalies, when the relatively lowthresholds for deep convection set by the global tropicaloceans can be met more frequently by convergence of NorthAtlantic moisture. Conversely, the larger positive anomalies inmedian intensity occur towards the upper right corner, i.e. athigher temperature anomalies, when warmer global tropicaloceans make it possible to attain higher intensities.
5. Conclusion: from past drought to partial recoveryand beyond
The drought years between 1968 and 1984 were dominatedby negative values in frequency of rainy days [47, 48],
Figure 4. The Ali and Lebel (2009) index of standardized Sahelianprecipitation [35] against May–October SST indices averaged overthe subtropical North Atlantic (y-axis) and the global tropics(x-axis): open circles represent negative anomalies of the rainfallindex, filled circles positive anomalies, and the size of the circle is ameasure of amplitude of the anomaly, in units of standard deviation.SST anomalies, in ◦C, are computed with respect to the 1961–90climatology.
and in median intensity (figure 6). Conversely, recentyears have been marked by the relative predominanceof values in frequency of rainy days typical of droughtyears, but combined with significant variation in medianintensity, including large positive values coincident withpositive anomalies in global tropical and North Atlantic SST.Therefore, the character of precipitation during the recentrecovery appears to have had a distinctly different flavor ifcompared to the wet period around the middle of the 20thcentury: fewer rainy days, as during persistent drought, madeup for in the seasonal totals by an increase in median intensityof daily rainfall.
Despite the scatter around the origin in the panels infigure 1, which could reflect variations among models inhow they balance local/land and remote/oceanic influenceof greenhouse gas-induced warming [13], the multi-modelensembles of CMIP3 and CMIP5 projections that pointtowards the possibility of a wetter future for the Sahelare consistent with the current trend towards a recovery ofthe rains. We can begin to root these projections in theunderstanding of the influence of the oceans on the climateof this region that has matured over the past quarter century.Therefore, the more plausible, near-term scenario is that theSahel will continue to stay wet if North Atlantic warmingcontinues to out-pace the global tropical oceans. If the Sahelwere to get wetter through a more marked increase in intensityrather than in frequency of precipitation, as discussed here,sound adaptation would have to contend with increased
6
Environ. Res. Lett. 8 (2013) 024010 A Giannini et al
Figure 5. Standardized anomalies in (A) frequency of rainy days and (B) median intensity of rainy days in Senegal over 1950–2010 againstthe same scatter of SST anomalies in the subtropical North Atlantic, on the y-axis, and in the global tropics, on the x-axis, used in figure 4.Open circles represent negative anomalies, filled circles positive anomalies. The size of the circle is a measure of amplitude of the anomaly,in units of standard deviations.
Figure 6. Time series of standardized frequency of rainy days(solid line) and median intensity (dashed line) in Senegal andBurkina Faso over the common period 1950–2008.
variability on all time scales, as already recognized on theground [49, 50].
Acknowledgments
AG acknowledges support from the National Science Founda-tion (AGS-0955372), the US Agency for International Devel-
opment (AID-OAA-A-11-00011), the National Oceanic andAtmospheric Administration (RAPID-NA08OAR4320754),and from the International START Secretariat, which fundedSS’s 1-month visit to the IRI through the 2012 ResearchPartnership Enhancement Award.
AG also wishes to acknowledge the enlighteningexchanges with Michela Biasutti, John Chiang and group,Aida Diongue-Niang, Mohamed Koite and Adam Sobel.
The authors declare to have no potential conflict ofinterest.
References
[1] Nicholson S E 1983 Sub-Saharan rainfall in the years1976–80: evidence of continued drought? Mon. WeatherRev. 111 1646–54
[2] Davies S 1996 Adaptable Livelihoods: Strategic Adaptation toFood Insecurity in the Malian Sahel (New York: St Martin’sPress)
[3] Reij C, Tappan G and Belemvire A 2005 Changing landmanagement practices and vegetation on the central plateauof Burkina Faso (1968–2002) J. Arid Environ. 63 642–59
[4] Botoni E and Reij C 2009 La transformation silencieuse del’environnement et des systemes de production au Sahel:impacts des investissements publics et prives dans lagestion des ressources naturelles (Ouagadougo: Centre forInternational Cooperation/Comite Permanent Inter-Etats deLutte contre la Secheresse au Sahel) (www.cilss.bf)
[5] Tougiani A, Guero C and Rinaudo T 2009 Communitymobilization for improved livelihoods through tree cropmanagement in Niger GeoJournal 74 377–89
[6] United Nations Development Programme 2007 HumanDevelopment Report 2007/2008. Fighting Climate Change:Human Solidarity in a Divided World (http://hdr.undp.org)
[7] Cook K H and Vizy E K 2006 Coupled model simulations ofthe West African monsoon system: twentieth- andtwenty-first-century simulations J. Clim. 19 3681–703
[8] Douville H, Salas-Melia D and Tyteca S 2006 On the tropicalorigin of uncertainties in the global land precipitationresponse to global warming Clim. Dyn. 26 367–85
7
Environ. Res. Lett. 8 (2013) 024010 A Giannini et al
[9] Biasutti M and Giannini A 2006 Robust Sahel drying inresponse to late 20th century forcings Geophys. Res. Lett.33 L11706
[10] Christensen J H et al 2007 Regional climate projectionsClimate Change 2007: The Physical Science Basis.Contribution of Working Group I to the Fourth AssessmentReport of the Intergovernmental Panel on Climate Changeed S Solomon et al (Cambridge: Cambridge UniversityPress)
[11] Shin S I and Sardeshmukh P D 2011 Critical influence of thepattern of Tropical Ocean warming on remote climatetrends Clim. Dyn. 36 1577–91
[12] Biasutti M, Held I M, Sobel A H and Giannini A 2008 SSTforcings and Sahel rainfall variability in simulations of thetwentieth and twenty-first centuries J. Clim. 21 3471–86
[13] Giannini A 2010 Mechanisms of climate change in thesemi-arid African Sahel: the local view J. Clim. 23 743–56
[14] Vecchi G A, Swanson K L and Soden B J 2008 Whitherhurricane activity? Science 322 687–9
[15] Neelin J D, Chou C and Su H 2003 Tropical drought regionsin global warming and El Nino teleconnections Geophys.Res. Lett. 30 2275
[16] Held I and Soden B 2006 Robust responses of the hydrologicalcycle to global warming J. Clim. 19 5686–99
[17] Johnson N C and Xie S-P 2010 Changes in the sea surfacetemperature threshold for tropical convection NatureGeosci. 3 842–5
[18] Chiang J C H and Sobel A H 2002 Tropical tropospherictemperature variations caused by ENSO and their influenceon the remote tropical climate J. Clim. 15 2616–31
[19] Lyon B 2004 The strength of El Nino and the spatial extent oftropical drought Geophys. Res. Lett. 31 L21204
[20] Biasutti M and Sobel A H 2009 Delayed Sahel rainfall andglobal seasonal cycle in a warmer climate Geophys. Res.Lett. 36 L23707
[21] Seth A, Rauscher S A, Rojas M, Giannini A andCamargo S J 2011 Enhanced spring convective barrier formonsoons in a warmer world? Clim. Change 104 403–14
[22] Druyan L M and Koster R D 1989 Sources of Sahelprecipitation for simulated drought and rainy seasonsJ. Clim. 2 1438–46
[23] Ndiaye O, Ward M N and Thiaw W M 2011 Predictability ofseasonal Sahel rainfall using GCMs and lead-timeimprovements through the use of a coupled model J. Clim.24 1931–49
[24] Lintner B R and Neelin J D 2010 Tropical SouthAmerica/Atlantic sector convective margins and theirrelationship to low-level inflow J. Clim. 23 2671–85
[25] Pu B and Cook K H 2012 Role of the West African WesterlyJet in Sahel rainfall variations J. Clim. 25 2880–90
[26] Liu Y and Chiang J C H 2012 Coordinated abrupt weakeningof the Eurasian and North African monsoons in the 1960sand links to extratropical North Atlantic cooling J. Clim.25 3532–48
[27] Meehl G A et al 2007 The WCRP CMIP3 multi-modeldataset: a new era in climate change research Bull. Am.Meteorol. Soc. 88 1383–94
[28] Taylor K E, Stouffer R J and Meehl G A 2012 An overview ofCMIP5 and the experiment design Bull. Am. Meteorol. Soc.93 485–98
[29] Knight J R, Folland C K and Scaife A A 2006 Climate impactsof the Atlantic multidecadal oscillation Geophys. Res. Lett.33 L17706
[30] Rotstayn L and Lohmann U 2002 Tropical rainfall trends andthe indirect aerosol effect J. Clim. 15 2103–16
[31] Chang C-Y, Chiang J C H, Wehner M F, Friedman A andRuedy R 2011 Sulfate aerosol control of tropical Atlanticclimate over the 20th century J. Clim. 24 2540–55
[32] Booth B B B, Dunstone N J, Halloran P R, Andrews T andBellouin N 2012 Aerosols implicated as a prime driver oftwentieth-century North Atlantic climate variability Nature484 228–32
[33] Chou C and Neelin J D 2004 Mechanisms of global warmingimpacts on regional tropical precipitation J. Clim.17 2688–701
[34] Biasutti M, Sobel A H and Camargo S J 2009 The role of theSaharan heat low in summertime Sahel rainfall variabilityand change in the CMIP3 models J. Clim. 22 5755–71
[35] Ali A and Lebel T 2009 The Sahelian standardized rainfallindex revisited Int. J. Climatol. 29 1705–14
[36] Lamb P J 1978 Large-scale Tropical Atlantic surfacecirculation patterns associated with sub-Saharan weatheranomalies Tellus 30 240–51
[37] Shanahan T M et al 2009 Atlantic forcing of persistentdrought in West Africa Science 324 377–80
[38] Greene A M, Giannini A and Zebiak S E 2009 Drought returntimes in the Sahel: a question of attribution Geophys. Res.Lett. 36 L12701
[39] Folland C K, Palmer T N and Parker D E 1986 Sahel rainfalland worldwide sea temperatures, 1901–85 Nature320 602–7
[40] Giannini A, Saravanan R and Chang P 2003 Oceanic forcingof Sahel rainfall on interannual to interdecadal time scalesScience 302 1027–30
[41] Rayner N A et al 2003 Global analyses of sea surfacetemperature, sea ice, and night marine air temperature sincethe late nineteenth century J. Geophys. Res. 108 4407
[42] Lamb P J 1982 Persistence of sub-Saharan drought Nature299 46–8
[43] Katz R W and Glantz M H 1986 Anatomy of a rainfall indexMon. Weather Rev. 114 764–71
[44] Traore S B and Laouali A M 2011 Analyzing and predictingthe onset and cessation dates of the rainy season in the WestAfrican Sahel WCRP Workshop on Drought Predictabilityand Prediction in a Changing Climate (Barcelona, March2011)
[45] Salack S, Giannini A, Diakhate M, Gaye A T andMuller B 2013 Oceanic influence on the sub-seasonal tointerannual timing and frequency of extreme dry spells overthe West African Sahel Clim. Dyn. doi:10.1007/s00382-013-1673-4
[46] Lodoun T, Giannini A, Traore P S, Some L, Sanon M,Vaksmann M and Rasolodimby J M 2013 Changes in thecharacter of precipitation in Burkina Faso associated withlate 20th century drought and recovery in the SahelEnviron. Dev. 5 96–108
[47] Le Barbe L, Lebel T and Tapsoba D 2002 Rainfall variabilityin West Africa during the years 1950–90 J. Clim.15 187–202
[48] Moron V, Robertson A W and Ward M N 2006 Seasonalpredictability and spatial coherence of rainfallcharacteristics in the tropical setting of Senegal Mon.Weather Rev. 134 3246–60
[49] West C T, Roncoli C and Ouattara F 2008 Local perceptionsand regional climate trends on the Central Plateau ofBurkina Faso Land Degrad. Develop. 19 289–304
[50] Mbow C, Diop A, Diaw A T and Niang C I 2008 Urbansprawl development and flooding at Yembeul suburb(Dakar, Senegal) Afr. J. Env. Sci. Technol. 2 75–88
[51] Mitchell T D and Jones P D 2005 An improved method ofconstructing a database of monthly climate observationsand associated high-resolution grids Int. J. Climatol.25 693–712
[52] Kaplan A 1998 Analyses of global sea surface temperature1856–1991 J. Geophys. Res. 103 18567–89
[53] Reynolds R W and Smith T M 1994 Improved global seasurface temperature analyses J. Clim. 7 929–48
8

![Desertification in the Sahel - Vanderbilt University€¦ · Desertification in the Sahel 9/4/2015 1:33:22 PM] Map of the sahel in north Africa](https://img.pdfslide.us/doc/110x75/602cf1f134913e1a72530cc6/desertification-in-the-sahel-vanderbilt-university-desertification-in-the-sahel.jpg)