Embed Size (px)
Citation preview

Eric-Michel ASSAMOI* and Catherine LIOUSSE** *[email protected] ; **[email protected] Laboratoire d’Aérologie, CNRS, Toulouse, France
A two-wheel emission inventory for West Africa for the year 2002
Anthropogenic pollution : a real concern in West African megacities…
though still largely undocumented…

BC (!gC/m3) at Bamako (Mali)
0
50
100
150
10:50
16:20
21:20
2:20
7:20
14:15
19:15
0:25
5:25
10:25
17:55
22:55
4:35
9:40
14:40
19:40
0:40
5:45
10:45
16:15
22:10
5:20
22:30
5:20
16:00
22:25
5:25
10:40
16:40
0:35
6:15
2:45
8:30
14:15
19:25
1:05
6:15
12:00
17:30
23:40
5:00
April, 09, 2008 April, 23, 2008
From Liousse, Galy, Diop, Ndiaye et al., POLCA program
Bamako 25
Beijing 12
Paris 3
BLACK CARBON (BC) MEASUREMENTS : High concentrations at Bamako, Mali

• 2 wheel vehicles highly contribute to such high air pollution in Western Africa
Why ? - Low road quality. - Adulterated petrol sold in Nigeria, Benin and Togo. - Deregulation of the public transport sector. - Economic solution : increasing number of Asian
motorcycles «Jakartas» 2 stroke engines twice cheaper than motorcycles from Europe.
Are these emissions really accounted for in present inventories? :
Data are quite few, not consistent and sometimes not « official » (specially in Benin with smuggled oil...)
=> In this work, we propose a first inventory based on several assumptions with maximum and minimum hypotheses.
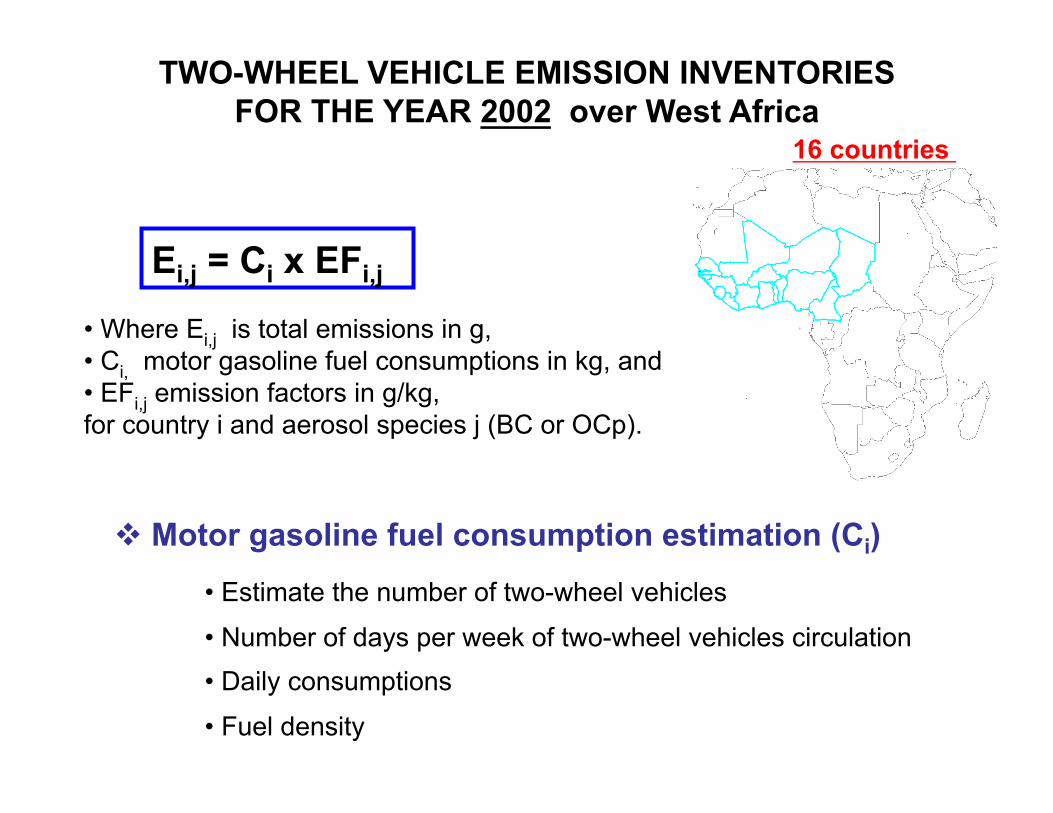
• Where Ei,j is total emissions in g, • Ci, motor gasoline fuel consumptions in kg, and • EFi,j emission factors in g/kg, for country i and aerosol species j (BC or OCp).
TWO-WHEEL VEHICLE EMISSION INVENTORIES FOR THE YEAR 2002 over West Africa
• Estimate the number of two-wheel vehicles
• Number of days per week of two-wheel vehicles circulation • Daily consumptions
• Fuel density
Motor gasoline fuel consumption estimation (Ci)
Ei,j = Ci x EFi,j
16 countries

1- Estimate the number of two-wheel vehicles
COUNTRIES NUMBER OF TWO-WHEEL
VEHICLES
BENIN 320,000
BURKINA FASO 300,000
CAMEROON 53,000
CHAD 16,000
MALI 300,000
NIGER 5,000
NIGERIA 1,309,000
TOGO 90,000
COUNTRIES ESTIMATED NUMBER OF TWO-WHEEL VEHICLES
GAMBIA** 1,026 – 12,578
GHANA** 11,892 – 145,758
GUINEA** 1,827 – 22,392
GUINEA-BISSAU** 948 – 11,625
IVORY-COAST** 41,460 – 508,177
LIBERIA** 1,159 – 14,205
SENEGAL** 13,685 – 167,739
SIERRA-LEONE** 1,319 – 16,170
Minimum assumption = Niger RATIO (minimum of number of two-wheel vehicles) : 0.12
Maximum assumption = Nigeria RATIO (maximum of number of two-wheel vehicles) : 1.44
RATIO = number of two-wheel vehicles / number of four-wheel vehicles
whether published data (left) or fully evaluated(**) from RATIO (right)

Minimum assumption Maximum assumption
“clean” two wheels
« motorcycle-taxis »
“clean” two wheels
« motorcycle-taxis »
Number of traffic day(s) per week 5 days per week 7 days per week
Daily consumptions (in litres) 0.5 2 1 4
Fuel density (kg/m3) 2% oil : ρ = 750.1 8% oil : ρ = 757.8
2) Characteristics in the minimum and maximum assumptions
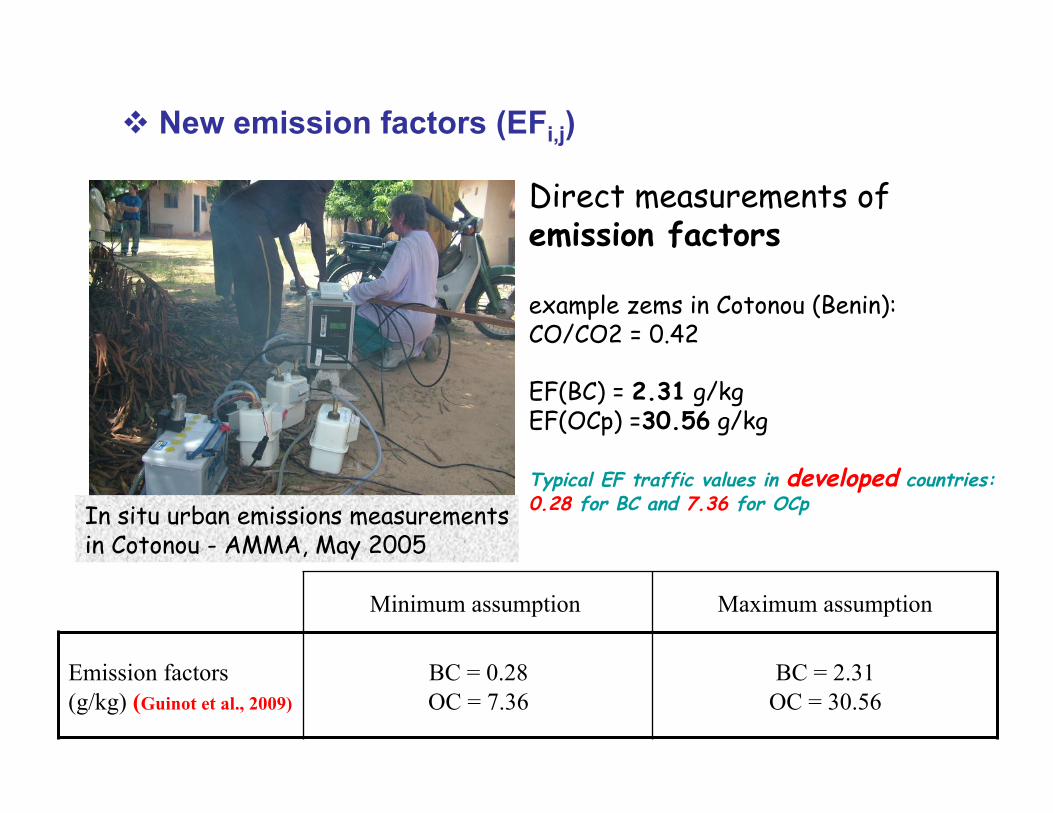
In situ urban emissions measurements in Cotonou - AMMA, May 2005
Direct measurements of emission factors
example zems in Cotonou (Benin): CO/CO2 = 0.42
EF(BC) = 2.31 g/kg EF(OCp) =30.56 g/kg
Typical EF traffic values in developed countries: 0.28 for BC and 7.36 for OCp
Emission factors (g/kg) (Guinot et al., 2009)
BC = 0.28 OC = 7.36
BC = 2.31 OC = 30.56
Minimum assumption Maximum assumption
New emission factors (EFi,j)

Differences between the maxi. and mini. assumptions variable : • in Niger = 2,220 tons • in Nigeria = 581,110 tons
IMPORTANCE OF FUEL CONSUMPTION DUE TO TWO-WHEEL VEHICLES : mini./maxi. (in tons per year)
Relative differences (maxi. – mini. / maxi.) • 97% in countries with estimated number of two-wheel vehicles • 64% in countries with available number of two-wheel vehicles
324,006 | 905,116

CONTRIBUTIONS TO BC EMISSIONS DUE TO TWO-WHEEL VEHICLES :
mini. / maxi. (in tons per year)
EF(MO) in the maxi. assumption is ~8 times greater than in the mini. assumption
Differences between the maxi. and mini. assumptions variable : • in Niger = 7.6 tons • in Nigeria = 1,998.3 tons
Relative differences (maxi. – mini. / maxi.)
• 96% in countries with available numbers of two-wheel vehicles
2,089

EF(MO) in the maxi. assumption is ~4 times greater than in the mini. assumption
Much higher impact for OCp than for BC for 2 stroke motorbikes
Differences between the maxi. and mini. assumptions variable : • in Niger = 96.5 tons • in Nigeria = 25,273.1 tons
Relative differences (maxi. – mini. / maxi.)
• 91% in countries with available numbers of two-wheel vehicles
CONTRIBUTIONS TO OCp EMISSIONS DUE TO TWO-WHEEL VEHICLES :
mini. / maxi. (in tons per year)
27,657 6,761

Bond et al., 2004 Junker and Liousse, 2008 vs. mini.
assumption vs. maxi.
assumption vs. mini.
assumption vs. maxi.
assumption (%) (%) (%) (%)
Consumption 5.7 18.4 6.0 19.5 BC emissions 12.9 344.8 11.2 300.6
OCp emissions 23.0 310.1 60.7 817.7
COMPARISON OF ALL TRAFFIC (BOND et al., 2004 and JUNKER and LIOUSSE, 2008) VS. OUR ASSUMPTIONS FOR MOTOR GASOLINE
Example for OCp comparisons for all West African countries

JL, 2008
JL,2008
JL,2008 + our maximum assumption
JL,2008 + our maximum assumption
maximum : 39 tons/year
tons/year
tons/year
1,265 tons/year 5,067 tons/year
6,157 tons/year 56,502 tons/year
maximum : 122 tons/year
maximum : 1281 tons/year maximum : 191 tons/year
New spatialization at 0.25° x 0.25° resolution (vs. normalized population densities, SEDAC 2005)

CONCLUSION Large underestimates of fuel consumptions in West Africa within the global database.
This work, focused on two-wheel emissions, shows the urgent need to integrate African specificities in BC and OCp emissions (both on fuel consumptions and emission factors).
But, high uncertainties (cf. the min. and max. assumptions) => strong message to improve official data in each country.
More generally, all traffic emissions need to be constantly updated not only two-wheel vehicles but also trucks, buses,… for motor gasoline and also for diesel.
From this work we can stress a new emission «hot spot» along the coast of the Guinean Gulf and north of Nigeria this «hot spot» is expected to increase in future projections in case of no traffic regulation.