Embed Size (px)
Citation preview
1
INTRODUCTIONFlying insects depend on unsteady fluid dynamic effects to generatelift in their flapping flights. The majority of the experimental(Ellington et al., 1996; Dickinson et al., 1999; Usherwood andEllington, 2002; Birch and Dickinson, 2003) and numerical (Liu etal., 1998; Wang, 2000; Sun and Tang, 2002; Rammamurti andSandberg, 2002; Wang et al., 2004; Luo and Sun, 2005; Miller andPeskin, 2005) investigations have been performed with the rigidwing models that are given combined active flapping and pitchingmotions. These investigations have found that the unsteady fluiddynamic effects are significantly affected by the kinematicalcharacteristics of the pitch motions such as the phase lag betweenpitching and flapping (Dickinson et al., 1999). On the other hand,many observations have reported the flexibility of the insect wingsduring flapping flights with various modes of deformation. The mostsignificant among them is the high torsional flexibility in Dipterawhich is concentrated on the narrow wing basal and short rootregions. The consequences of this are twofold: (1) it is hard totransmit the active torsion applied by the muscle to the outer wingand (2) the wing can twist easily to provide a passive change in theangle of attack (Ennos, 1987) or passive pitch motion.
In general, the passive pitch motion of the wings that solves theequation of motion balances three forces: wing inertial, elastic andfluid forces. According to Ennos (Ennos, 1988b), the wing inertialforce accounts for much of the wing rotation at the stroke reversalsin dipteran flapping flight. Although the wing inertial force mightbe dominant at the stroke reversals, where the acceleration is large,it is not enough to explain the passive pitch motion during the partsof the stroke other than the wing reversals. Investigation of thepassive pitch motion during the entire stroke should be performedby taking into account all three of these forces. From the view pointof the fluid surrounding the wings, these forces exerted on the wingsact back on the fluid, producing a cycle of interaction between the
fluid and the wings, termed the fluid–structure interaction (FSI),through the equilibrium on their interface.
The aim of this paper was to reveal the details of the passivepitch motion due to wing torsional flexibility and its effects on liftgeneration by using (a) the non-linear FSI finite element method toanalyze the precise motion of the wing passive pitching and thesurrounding fluid flow, (b) characterization of the insect flight usinga FSI similarity law, (c) the lumped torsional flexibility model asa simplified dipteran wing and (d) the analytical wing model.
The finite element method (Ishihara and Yoshimura, 2005;Ishihara et al., 2008) was used to solve the motion of the wing modelwhich undergoes active sinusoidal flapping motion and passivepitching in the two-dimensional fluid. The numerical simulationsare guided by the FSI similarity law (D.I., M.D. and T.H., manuscriptsubmitted), which was used to correctly incorporate data from theselected real insect, the crane fly Tipula obsolete (Ellington, 1984a;Ellington, 1984b), and the robotic fly (Wang et al., 2004) into ourwing model. The lumped torsional flexibility model consists of aplate with unit extent in the z-direction and an attached spring. Theformer models the wing cross-section averaged over the wing span.The latter models the concentrated torsional flexibility of the wingand allows the wing to twist around its torsional axis. We alsointroduced the analytical wing model, a single degree of freedommass–spring–dashpot system, to explain characteristics of thepassive pitching motion in the simulation.
The passive pitching motion of our wing model simulates wellthe real insect’s pitching motion. The model wing keeps the highattack angle during its translation and rotates at the strokereversals. The resulting pitch angle is approximately equal to thatof the selected insect, the crane fly. It is especially important thatthe model wing begins to twist before it changes its flappingdirection. Such advanced pitch motion is necessary in order forthe insect flight to increase the lift force (Dickinson et al., 1999)
The Journal of Experimental Biology 212, 1-10Published by The Company of Biologists 2009doi:10.1242/jeb.020404
A two-dimensional computational study on the fluid–structure interaction cause ofwing pitch changes in dipteran flapping flight
Daisuke Ishihara1,*, T. Horie1 and Mitsunori Denda2
1Kyushu Institute of Technology, 680-4 Kawazu, Iizuka, Fukuoka 8208502, Japan and 2Rutgers University, 98 Brett Road,Piscataway, NJ 08854-8058, USA
*Author for correspondence (e-mail: [email protected])
Accepted 21 October 2008
SUMMARYIn this study, the passive pitching due to wing torsional flexibility and its lift generation in dipteran flight were investigated using(a) the non-linear finite element method for the fluid–structure interaction, which analyzes the precise motions of the passivepitching of the wing interacting with the surrounding fluid flow, (b) the fluid–structure interaction similarity law, whichcharacterizes insect flight, (c) the lumped torsional flexibility model as a simplified dipteran wing, and (d) the analytical wingmodel, which explains the characteristics of the passive pitching motion in the simulation. Given sinusoidal flapping with afrequency below the natural frequency of the wing torsion, the resulting passive pitching in the steady state, under fluid damping,is approximately sinusoidal with the advanced phase shift. We demonstrate that the generated lift can support the weight of someDiptera.
Key words: dipteran flight, dynamic similarity law, finite element method, fluid–structure interaction, wing torsional flexibility.
THE JOURNAL OF EXPERIMENTAL BIOLOGY

2
and is widely observed in insect flight. The analytical wing modelexplains the advanced pitch motion of the passive pitching as wellas the torsion wave observed in the dipteran wing (Ennos, 1988b).The lift force generated by such passive pitching almost meets theforce required to support the weight of the crane fly, but it is notquite enough. This could be attributed to the loosely attachedleading edge vortex on the wing due to the long wing chord travelof the crane fly for the two-dimensional simulation. Indeed thelift of the fictitious insect flight, whose Reynolds number andstroke–wing chord ratio are much closer to those of the fruit flymodel (Wang et al., 2004), shows a 35% increase compared withthat of the crane fly flight due to the more tightly attached leadingedge vortex on the wing.
MATERIALS AND METHODSNon-linear finite element FSI analysis
To analyze wing motion, the surrounding fluid motion and theirinteraction, we used the finite element FSI analysis method(Ishihara and Yoshimura, 2005; Ishihara et al., 2008) based on themonolithic algorithm (Zhang and Hisada, 2001; Rugonyi andBathe, 2001), which simultaneously solves the followingequations.
(a) Navier–Stokes equations for the incompressible viscous fluid:
and
where ρ, vi and σij are the mass density, velocity and stress withthe superscript f indicating the fluid. The fluid is assumed to beNewtonian. The stress σf
ij=pδij+μ(�vi/�xj+�vj/�xi) is used, whereδij is the Kronecker delta, μ is the fluid viscosity and p is thefluid pressure. Body forces acting on the fluid are ignored forsimplicity.
(b) Equation of motion for the elastic body:
where the superscript s refers to the structural quantity. We ignorethe body forces acting on the elastic body. Let us consider theequation of motion of a flapping insect wing. Assuming that theinsect is hovering perfectly, the net upward aerodynamic forceacting on the wing will be equal in magnitude and opposite indirection to the gravitational force on the insect. Note that thewing weight is 2–4% of the body weight in the crane flyaccording to Ellington (Ellington, 1984a), whose data are usedin this study. Thus the gravitational force on the wing can beignored and the body force term is dropped in Eqn 2 describingthe wing motion. In this study, the second Piola–Kirchhoff stressand the Green–Lagrange strain tensors are used. The latter isdefined by es
ij=1/2[�ui/�xj+�uj/�xi+(�uk/�xi)(�uk/�xj)]. We assumethat the increments of these tensors are related by Hooke’s lawand the material non-linearity observed in biomaterials is ignored.This assumption is justified by the torsional test for the dipteranwing by Ennos (Ennos, 1988a). The test result for the wingwithout immobilization of its basal and root regions has shownthat the relationship between the applied torque and the resultingangular displacement is approximately linear in pronation orsupination.
ρs dvis
dt=
∂σ jis
∂x j , (2)
∂vif
∂xi= 0 , (1b)
ρf ∂∂vi
f
t+ ρ f v j
f ∂vif
∂x j=
∂σ jif
∂x j (1a)
(c) Geometrical compatibility and equilibrium conditions on thefluid–structure interface:
vfi = vs
i , (3a)
σfijnf
j + σsijns
j = 0 , (3b)
where nfi and ns
i denote the outward unit normal vectors to the fluidand structure, respectively.
The arbitrary Lagrangian–Eulerian (ALE) method (Hughes et al.,1981) is used in order to take into account the deformablefluid–structure interface. For the elastic body, the total Lagrangianformulation is used in order to take into account the geometricalnon-linearity due to the large deformation. The finite elements usedfor the fluid are the stabilized continuous linear velocity and pressureelements (Tezduyar et al., 1992), while those for the elastic plateare the mixed interpolation of the tensor component elements (Batheand Dvorkin, 1985; Noguchi and Hisada, 1993). The details of thealgorithm of the FSI method used in this study as well as itsverification for the basic FSI problems are given by Ishihara andYoshimura (Ishihara and Yoshimura, 2005).
We have selected the two-dimensional wing model similar to thatused by Wang and colleagues (Wang et al., 2004) as a benchmarkto test the validity of our method. Miller and Peskin (Miller andPeskin, 2005) have used a similar wing model to demonstrate thevalidity of their numerical technique. The wing is modeled by athin rigid elastic plate of thickness h with chord length c; in ourelastic model a large Young’s modulus is assigned to simulate therigid body behavior. The model is two-dimensional having a unitextent in the z-direction (out-of-plane direction) without variationin this direction. Following Wang et al. (Wang et al., 2004), an x-displacement U(t) and an angular displacement around the z-direction a(t):
are actively applied to the center of the wing, where A0, β and bare the stroke amplitude, the amplitude of the pitching angle of attackand the phase shift, respectively. The common frequency f of theflapping and pitching is set to produce the Reynolds numberRe=ρfVmaxc/μ=75, where ρf is the fluid mass density, μ is the fluidviscosity and Vmax=πfA0 is the maximum wing velocity. The detailsof this test are described in the Appendix, where the time historiesof force coefficients given by our method agree well with the resultsof Wang and colleagues (Wang et al., 2004).
FSI similarity lawIn this study, we introduced a dynamic similarity law for the FSI(D.I., M.D. and T.H., manuscript submitted) using the dimensionalanalysis of the equations of motion of the FSI system, Eqns 1a, 2and 3b. Let U, V, L, f and P be the characteristic displacement,velocity, length, frequency and pressure, respectively. The similaritylaw consists of six non-dimensional numbers: Re=ρfVL/μ (theReynolds number, the ratio between the inertial force due to theconvective acceleration and the viscous force), St=fL/V (the Strouhalnumber, the ratio between the inertial force due to the Eulerian timederivative acceleration and the inertial force due to the convectiveacceleration), Rs=ρsL2f2/E (the ratio between the inertial force dueto the Lagrangian time derivative acceleration and the elastic force),RM=ρf/ρs (the mass number, the ratio between the fluid inertial forcedue to the Eulerian time derivative acceleration and the structural
(ta ) = β sin(2π ft + b) , (4b)
U (t) =A0
2cos 2π ft , (4a)
D. Ishihara, T. Horie and M. Denda
THE JOURNAL OF EXPERIMENTAL BIOLOGY

3FSI cause of dipteran wing pitch changes
inertial force due to the Lagrangian time derivative acceleration),RIs=fμ/E (the ratio between the fluid viscous and elastic forces) andRIp=ρfVLf/E (the ratio between the fluid dynamic pressure and theelastic force), where the characteristic pressure P is evaluated bythe magnitude of the dynamic pressure ρfV2. Only four of them areindependent due to the relationships RIp/RIs=Re and RM=Rs�St�RIp.The numbers Rs, RIs and RIp are new as far as we know.
Two systems that are geometrically similar are alsodynamically similar if the non-dimensional numbers introducedabove are equal. The FSI similarity law was verified through thenumerical examples of (a) the forced vibration of an elasticcantilever plate in the quiescent fluid (the problem analyzed inthis paper in the context of flapping flight), and (b) the flow-induced vibration of an elastic cantilever plate situated in the wakeof a rectangular prism in the uniform flow (D.I., M.D. and T.H.,manuscript submitted). In each example, five dynamically similarsystems with different fluid and/or reference length were analyzedby our finite element FSI method. In order to verify the validityof the present law, all the governing equations were cast in thedimensional form deliberately. The dynamic similarity of thesesystems was successfully verified, with the relative error of theresults being less than 1% in all cases.
In the dimensional analysis of the equations of the motion of the FSI system, we assumed the linear strain tensores
ij=1/2(�ui/�xj+�uj/�xi) and a linear relationship (Hooke’s law)between the stress and strain tensors. We also used an alternativeapproach to the dimensional analysis of the general FSI systemincluding, but not limited to, the linear elastic equation. We definedthe following fundamental variables of the FSI system on whichthe system motion is dependent: L, U, V, P, ρs, ρf, E (Young’smodulus) and μ. Applying the standard procedure of the dimensionalanalysis to these variables, we found the same non-dimensionalnumbers as before. The former analysis ensures that our law is thegeneral framework of the dynamic similarity law. The latter analysisensures that our law can be applied to the FSI system with largedeformation of the elastic body.
The numerical simulations are guided by the FSI similarity law,which was used to correctly incorporate data from a selected realinsect, the crane fly (Ellington, 1984a; Ellington, 1984b), and arobotic fly (Wang et al., 2004) into our wing model. It is veryinteresting how these parameters vary for a variety of flying insectsand their flight performances change as each number is varied. Inthe numerical experiments of this study, comparison of the leadingedge vortex behaviors between the crane fly and fictitious insect
flight deals to some extent with these questions. The leading edgevortex becomes more tightly attached to the wing as Re and St aredecreased while RM and RIs are preserved. In future work, we willtackle these interesting questions.
Lumped torsional flexibility modelMost of the wing torsional flexibility in Diptera is concentratedon the narrow basal and short root regions of the wings as shownin Fig. 1A, and allows the wing to twist around its torsional axisin a span-wise direction as shown in Fig. 2 (Ennos, 1987; Ennos,1988a). Based on these facts, (1) we modeled the wing two-dimensionally by a rectangular plate, with chord length c and aunit extent in the out-of-plane direction (z-direction), which is thespan-wise average of the varying cross-section, and (2) wemodeled the torsional flexibility of the wing as an elastic spring,i.e. the torsional flexibility of the wing is lumped into the springand its torsional stiffness is characterized by the spring constant(the lumped torsional flexibility model). The concept of the lumpedtorsional flexibility model is shown in Fig. 1B. Initially, the wingis at rest with the angular displacement or pitch angle a=0 in thetwo-dimensional fluid and then the sinusoidal flapping motion inthe x-direction (Eqn 4a) is applied at its leading edge, where it issupported by a roller. The flapping motion is approximated by thesinusoidal function in this study because the actual kinematics offlies and bees are similar to this simple motion (Ellington, 1984b).We used a continuum plate model as shown in Fig. 1C. This isbecause the plate spring is easily discretized by using finiteelements. This model consists of two parts: the upper narrow partof length ls and the rest with low and high bending rigidities tosimulate the spring (s) and the rigid body (r), respectively. Thethickness and Young’s modulus of the former are hs and Es andthose for the latter are hr and infinity, respectively. The infiniteYoung’s modulus is approximated by setting a value far largerthan Es. The mass density is set to a uniform value ρs over the
A B C
Plate
Spring Plate spring
Rigid plate
Continuum plate model
U(t) U(t)
Dipteran wing (crane fly) a
U(UU t)t
Spring model
Fig. 1. Lumped torsional flexibility models. The original insect wing (A) withthe arrows indicating the region of high torsional flexibility is drawn afterEnnos (Ennos, 1988a). The spring model (B) shows the concept of thepresent lumped torsional flexibility model, and the continuum plate model(C) shows its computational implementation using the continuum plate.Note that the span-wise direction or the torsional axis is perpendicular tothe plane in B and C. The pitching motion is evaluated using the angulardisplacement or pitch angle a, which is the slope angle of the trailing edgeof the wing as shown in C. U(t), x-displacement of the wing base.
A B
Fig. 2. Wing torsion during the downstrokes (A) and upstrokes (B) drawnafter Ennos (Ennos, 1988a). Most of the wing torsional flexibility in Dipterais concentrated on the narrow basal and short root regions of the wings,and allows the wing to twist around its torsional axis in a span-wisedirection.
O
ksmw
c/2F
M
a
U(t)
u(t)
Fig. 3. A single degree of freedom mass–spring–dashpot system of thewing. U(t) and u(t), x-displacement of the wing base and center,respectively; mw, wing mass; ks, spring constant; F, force; c, chord length;M, moment.
THE JOURNAL OF EXPERIMENTAL BIOLOGY
4
entire plate. Few data concerning the wing torsional flexibility areavailable. Ennos (Ennos, 1988a) has investigated the wing torsionalstiffness of some Diptera such as crane, drone and blow flies. TheReynolds number of crane fly flight (Re≈290) is near to that of therobotic fly flight (Re≈100) (Wang et al., 2004), while the Reynoldsnumbers of the flights of drone and blow flies are over 1000. Weselected the crane fly in this study because the applicability of ournumerical method to the flapping wing has been verified in theflow regime of low Reynolds number using the robotic fly data(see Appendix). The high torsional flexibility region around thewing base of the crane fly is schematically denoted by the arrowsin Fig.1A. The chord length of this region is approximately 10–30%of the maximum chord length that occurs at mid-span. Since theupper narrow part of the continuum plate model corresponds to thehigh torsional flexibility region, we define the length ls of thecontinuum plate model as 0.2c. Under this setting, we obtain thefollowing non-dimensional numbers in the FSI similarity law.
Dynamic numbers:
Geometric numbers:
The parameters of the continuum plate model are determined sothat the non-dimensional numbers (Eqns 5 and 6) agree with those forthe real insect. The real insect selected was the crane fly (Ellington,1984a; Ellington, 1984b), with span length of one wing R=1.27cm,total area of the wing pair S=0.59cm2, stroke angle ϕ=123deg., flappingfrequency f=45.5Hz and mass of the wing pair mw=0.000245g. Thetotal mass of the insect is m=0.0114g. The averaged chord length c isgiven by S/(2R)=0.23cm. Let ρs=1.2gcm–3 be the wing mass density(Jensen and Weis-Fogh, 1962; Wainwright et al., 1982); the averagedthickness is then h=mw/(ρsS)=0.00069cm, which is identified as thethickness hr of the hypothetical rigid part of the real insect. The strokeamplitude A0 of this flapping is estimated by the arc length traveledby the chord at the mid-span and is given by 0.5R(ϕ/180)π=1.36cm.The value of the Young’s modulus Es is 6.1GPa (Wainwright et al.,1982) and those for the fluid mass density ρf and viscosity μ areρf=0.0012gcm–3 (air) and μ=0.00018g(cms)–1 (air), respectively. Thenon-dimensional numbers St, Re, RIs, RM and γr are determined to be0.054, 290, 1.4�10–13, 1.0�10–3 and 340, respectively, using the aboveproperties. On the other hand, the number γs is determined based onthe expectation that it is of the same order as γr; among the numericallytested values of γs in the region of γr=340, we have found that γs=900maximizes the averaged lift. To test the validity of this selection ofγs=900, consider the bending of the continuum plate spring with itsupper end fixed and the moment M applied at the lower end. The slopeof the plate at its lower end, using the Euler–Bernoulli beam
St =
fc
Vmax=
c
π A0 , (5a)
Re =ρ fVmaxc
μ , (5b)
γ s =
c
hs . (6b)
γ r =
c
hr , (6a)
RM =ρf
ρs , (5d)
RIs =f μEs
, (5c)
assumption, is given by a=Mls/(EsI), where I=hs3/12 is the second
moment of area for the plate spring. Thus the spring constant of theplate is given by ks=EsI/ls=Eshs
3/(12ls), which is set to the macroscopictorsional stiffness Gw of the insect wing. Notice that the selected valueof γs=c/hs=900 gives ks=1.9gcm2(s2rad)–1, which lies in the range ofvalues for Gw=0.8–15.4gcm2(s2rad)–1 (Ennos, 1988a) obtained forthe crane fly.
The torsional axis of our model is located within the upper 20%of the wing chord and that of the real insect is located near the leadingedge. We investigate the effects of the location of the rotational axisin the Appendix, where we show that they can be neglected withslight perturbation in the force amplitude and phase shift.
Analytical wing modelIn order to explain the characteristics of the passive pitching of thecontinuum plate model, we introduced a single degree of freedommass–spring–dashpot system of the wing (Fig.3) for the theoreticalanalysis. The wing is modeled by a rigid rod of length c and itsangular displacement a(t) is assumed to be small enough that it canbe measured by the relative x-displacement δ(t)=u(t)–U(t) of thewing center according to a(t)=δ(t)/(c/2) (assumption of linearization),
D. Ishihara, T. Horie and M. Denda
–60
–30
0
30
60
90
10 2
Frequency ratio f/fn
Pha
se s
hift
b (d
eg.)
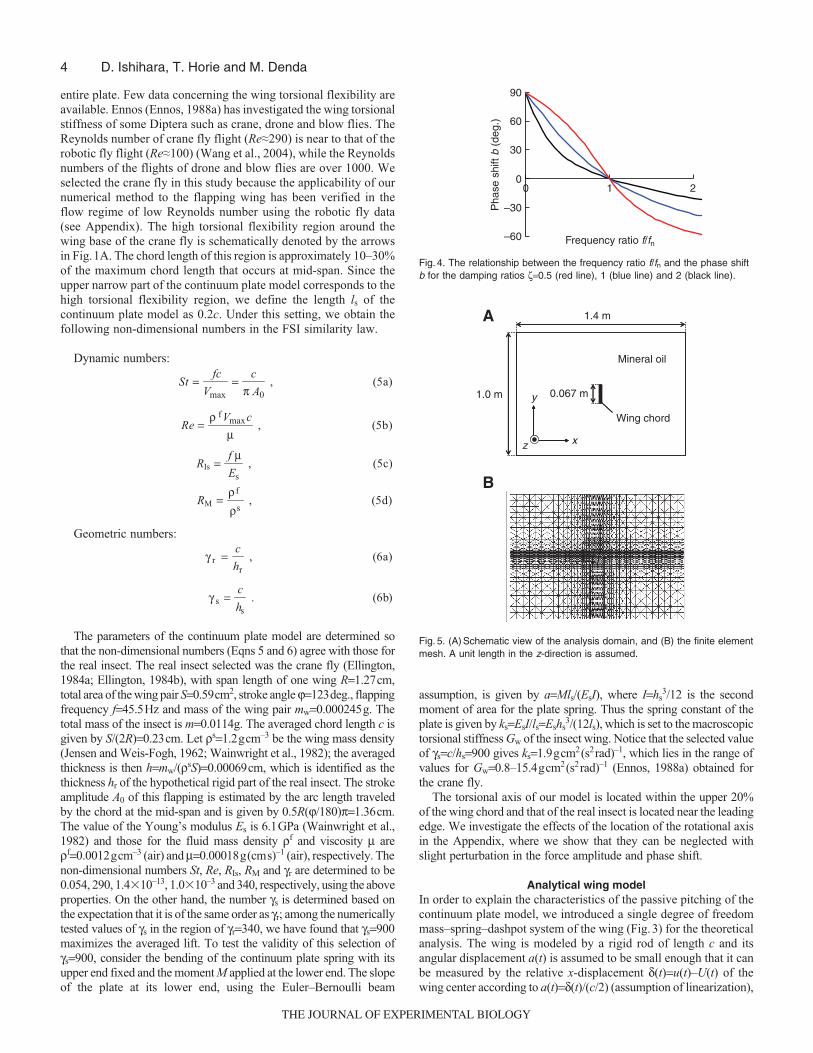
Fig. 4. The relationship between the frequency ratio f/fn and the phase shiftb for the damping ratios ζ=0.5 (red line), 1 (blue line) and 2 (black line).
A
B
1.4 m
Wing chord
Mineral oil
0.067 m1.0 m y
xz
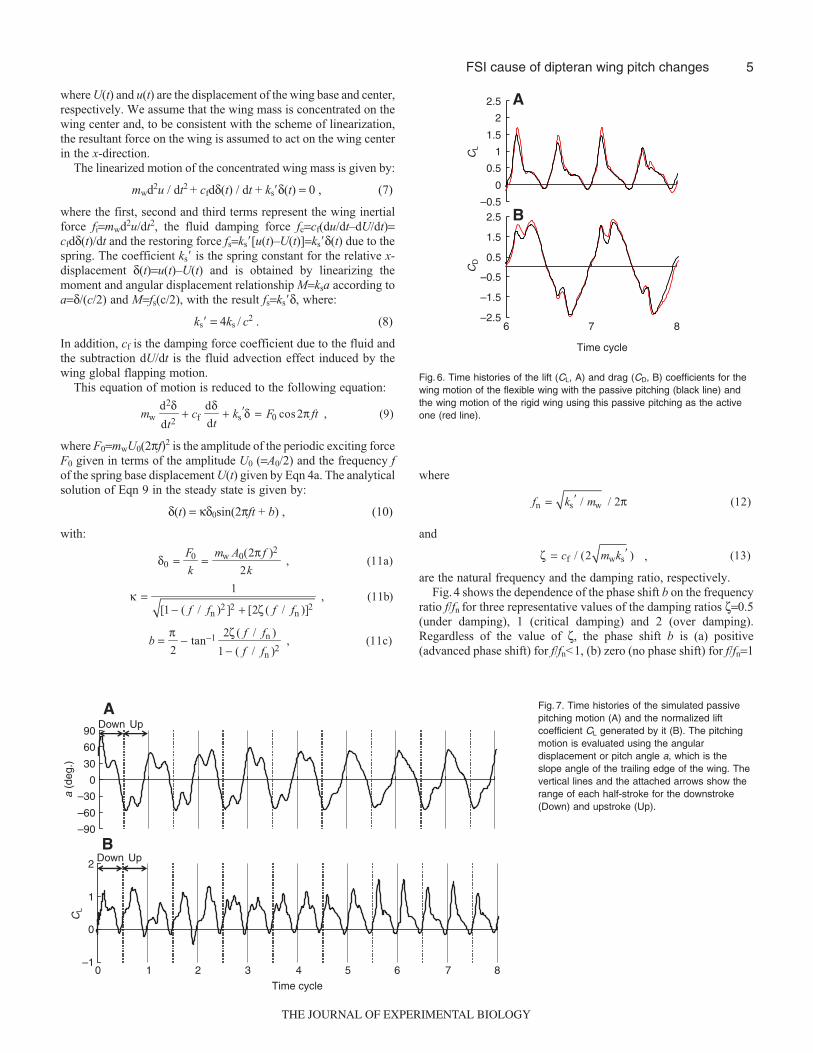
Fig. 5. (A) Schematic view of the analysis domain, and (B) the finite elementmesh. A unit length in the z-direction is assumed.
THE JOURNAL OF EXPERIMENTAL BIOLOGY
5FSI cause of dipteran wing pitch changes
where U(t) and u(t) are the displacement of the wing base and center,respectively. We assume that the wing mass is concentrated on thewing center and, to be consistent with the scheme of linearization,the resultant force on the wing is assumed to act on the wing centerin the x-direction.
The linearized motion of the concentrated wing mass is given by:
mwd2u / dt2 + cfdδ(t) / dt + ks�δ(t) = 0 , (7)
where the first, second and third terms represent the wing inertialforce fi=mwd2u/dt2, the fluid damping force fc=cf(du/dt–dU/dt)=cfdδ(t)/dt and the restoring force fs=ks�[u(t)–U(t)]=ks�δ(t) due to thespring. The coefficient ks� is the spring constant for the relative x-displacement δ(t)=u(t)–U(t) and is obtained by linearizing themoment and angular displacement relationship M=ksa according toa=δ/(c/2) and M=fs(c/2), with the result fs=ks�δ, where:
ks� = 4ks / c2 . (8)
In addition, cf is the damping force coefficient due to the fluid andthe subtraction dU/dt is the fluid advection effect induced by thewing global flapping motion.
This equation of motion is reduced to the following equation:
where F0=mwU0(2πf)2 is the amplitude of the periodic exciting forceF0 given in terms of the amplitude U0 (=A0/2) and the frequency fof the spring base displacement U(t) given by Eqn 4a. The analyticalsolution of Eqn 9 in the steady state is given by:
δ(t) = κδ0sin(2πft + b) , (10)
with:
b =π2
− tan−1 2ζ ( f / fn )
1 − ( f / fn )2 , (11c)
mwd2δdt2
+ cfdδdt
+ ks�δ = F0 cos 2π ft , (9)
δ0 =F0
k=
mw A0(2π f )2
2k , (11a)
κ =1
[1 − ( f / fn )2 ]2 + [2ζ ( f / fn )]2 , (11b)
where
and
are the natural frequency and the damping ratio, respectively.Fig.4 shows the dependence of the phase shift b on the frequency
ratio f/fn for three representative values of the damping ratios ζ=0.5(under damping), 1 (critical damping) and 2 (over damping).Regardless of the value of ζ, the phase shift b is (a) positive(advanced phase shift) for f/fn<1, (b) zero (no phase shift) for f/fn=1
fn = ks� / mw / 2π (12)
,ζ = cf / (2 mwks� ) (13)
A
–0.5
0
0.5
1
1.5
2
2.5
876
B
–2.5
–1.5
–0.5
0.5
1.5
2.5
Time cycle
CD
CL
Fig. 6. Time histories of the lift (CL, A) and drag (CD, B) coefficients for thewing motion of the flexible wing with the passive pitching (black line) andthe wing motion of the rigid wing using this passive pitching as the activeone (red line).
A
–90
–60
–30
0
30
60
90
a (d
eg.)
UpB
–1
0
1
2
Time cycle
Down
UpDown
876543210
CL
Fig. 7. Time histories of the simulated passivepitching motion (A) and the normalized liftcoefficient CL generated by it (B). The pitchingmotion is evaluated using the angulardisplacement or pitch angle a, which is theslope angle of the trailing edge of the wing. Thevertical lines and the attached arrows show therange of each half-stroke for the downstroke(Down) and upstroke (Up).
THE JOURNAL OF EXPERIMENTAL BIOLOGY
6
and (c) negative (delayed phase shift) for f/fn>1, respectively. Notethat the amount of the advanced phase shift increases as the valueof f/fn (<1) gets smaller.
RESULTS AND DISCUSSIONOnce the chord length c and the fluid material properties ρf andμ are specified in our continuum plate model, all the otherproperties, the flapping frequency f, stroke amplitude A0, platethicknesses hr and hs, plate material properties ρs and Es, aredetermined to match the non-dimensional numbers of the FSIsimilarity law Re, St, RM, RIs, γr and γs obtained from the realinsect. We used c=6.7 cm and the material properties of mineraloil ρf=0.88 g cm–3 and μ=0.715 g (cm s)–1 in the scaledcomputation, following the dynamically scaled model ofDickinson and colleagues (Dickinson et al., 1999). Since our plateis flexible at the upper narrow part, unlike the rigid wing modelof Dickinson and colleagues (Dickinson et al., 1999), not onlythe fluid motion but also the plate motion and their interactionare dynamically scaled to the real insect flapping flight. Fig. 5shows the schematic view of the analysis domain and the finiteelement mesh employed, in which the no-slip condition isassumed on the outer boundary of the fluid domain and the wingchord. A convergence test where the fluid grid is refined isprovided in the Appendix. The center of the wing is located atthe center of the fluid domain initially. We first apply the
D. Ishihara, T. Horie and M. Denda
A
B
Fig. 8. The frame-by-frame advance of the wing motion from 7 to 8 cycles.The time interval between each frame is 0.01 cycles. The wing chordmoves from right to left in the downstroke 7 to 7.5 cycles (A) and left toright in the upstroke 7.5 to 8 cycles (B). The arrows indicate the flappingdirection.
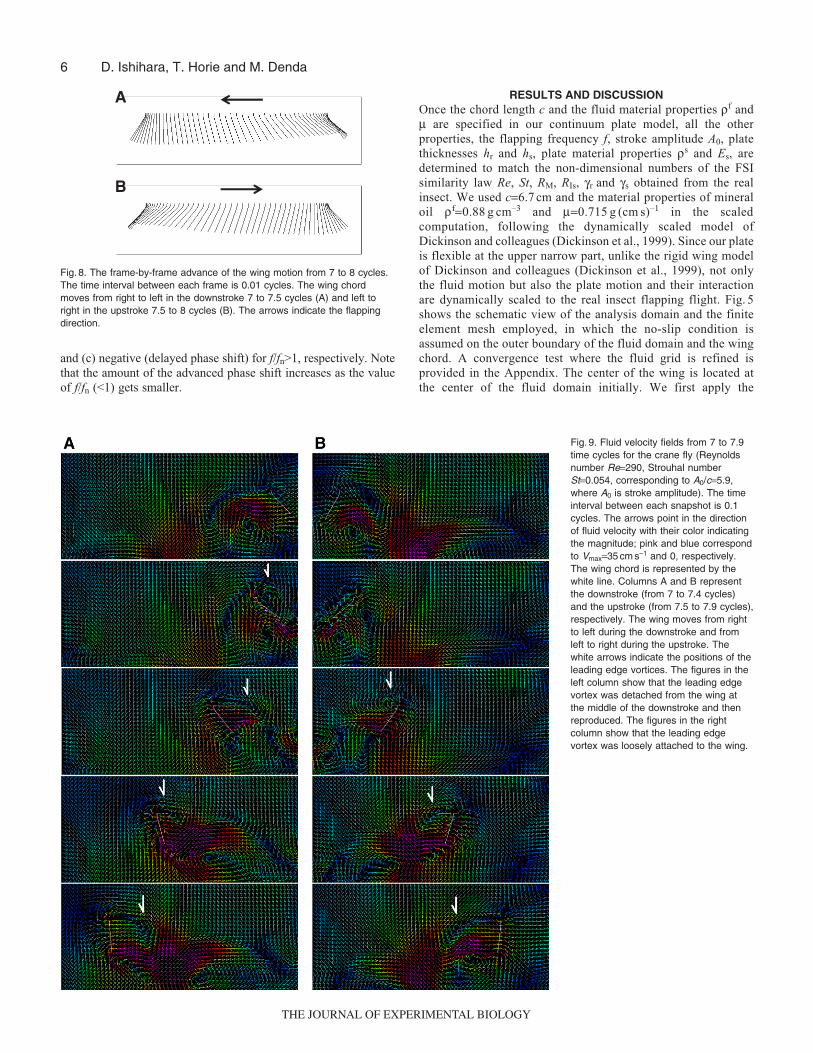
Fig. 9. Fluid velocity fields from 7 to 7.9time cycles for the crane fly (Reynoldsnumber Re=290, Strouhal numberSt=0.054, corresponding to A0/c=5.9,where A0 is stroke amplitude). The timeinterval between each snapshot is 0.1cycles. The arrows point in the directionof fluid velocity with their color indicatingthe magnitude; pink and blue correspondto Vmax=35 cm s–1 and 0, respectively.The wing chord is represented by thewhite line. Columns A and B representthe downstroke (from 7 to 7.4 cycles)and the upstroke (from 7.5 to 7.9 cycles),respectively. The wing moves from rightto left during the downstroke and fromleft to right during the upstroke. Thewhite arrows indicate the positions of theleading edge vortices. The figures in theleft column show that the leading edgevortex was detached from the wing atthe middle of the downstroke and thenreproduced. The figures in the rightcolumn show that the leading edgevortex was loosely attached to the wing.
THE JOURNAL OF EXPERIMENTAL BIOLOGY

7FSI cause of dipteran wing pitch changes
sinusoidal flapping motion Eqn 4a in the x-direction at the leadingedge of the flexible wing to measure the induced passive pitchingin terms of the angular displacement or pitch angle a(t) of thetrailing edge of the wing. The angular displacement a(t) ismeasured from the rest position of the wing as shown in Fig. 1C.The anti-clockwise direction is positive. Note that no angulardisplacement a(t) is applied actively. Next, we consider a rigidwing model and apply both the sinusoidal flapping motion Eqn4a and the measured angular displacement a(t) actively tocalculate the fluid forces. As shown in Fig. 6, the fluid forcesobtained in the two cases are in fine agreement. Since the abilityof our method to simulate the two-dimensional wing motion underthe combined active flapping and pitching for the rigid wing hasbeen verified in the Appendix, this agreement serves as abenchmark to validate our method for the flexible wing thatinduces passive pitching under active flapping.
Passive pitching motionFigs 7 and 8 summarize the passive pitching motion of ourcontinuum plate model wing. Fig.7 also shows the generated lifthistory. After the initial transient phase, the angular displacementor pitch angle a oscillates regularly after around four cycles as shown
in Fig.7. The initial transient phase can be explained by theequation of motion (Eqn 9) of the analytical wing model. Theanalytical solution of Eqn 9 consists of the free and forced vibrationmodes initially. However, the free vibration mode disappears dueto the damping effect after multiple strokes and the forced vibrationmode remains. Note that the analytical solution of the forcedvibration mode is given by Eqn 10. The same phenomenon occursin the pitching motion of the continuum plate model wing. Followingthe stabilization of the wing motion, the lift coefficient also oscillatesregularly.
The passive pitching motion shown in Fig.8 seems to simulatewell the real insect’s pitching motion. The model wing keeps thehigh attack angle during its translation and rotates at the strokereversals. In addition, our wing model gives a maximum pitch angleof 50–60deg., which lies in the range of values for the crane fly,45–65deg. (Ellington, 1984b). Note that the pitch angle is a non-dimensional variable. It is especially important that the model wingbegins to twist before it changes its flapping direction as shown inFigs7 and 8. Such advanced pitch motion is important for the insectflight to increase the lift force by intercepting the wake of theprevious stroke (wake capture) (Dickinson et al., 1999) and is widelyobserved in insect flight.
Fig. 10. Fluid velocity fields from 4 to4.9 time cycles for the fictitious insect(Re=200, St=0.1 corresponding toA0/c=3.2). The time interval betweeneach snapshot is 0.1 cycles. Thearrows point in the direction of the fluidvelocity with their color indicating themagnitude; pink and blue correspond toVmax=24 cm s–1 and 0, respectively. Thewing chord is represented by the whiteline. Columns A and B represent thedownstroke (from 4 to 4.4 cycles) andthe upstroke (from 4.5 to 4.9 cycles),respectively. The wing moves from rightto left during the downstroke and fromleft to right during the upstroke.
THE JOURNAL OF EXPERIMENTAL BIOLOGY

8
The advanced pitch motion observed in Figs7 and 8 can beexplained by the analytical wing model as follows. The time historyof the pitch angle a(t) takes a form similar to a sinusoidal functionwith the same frequency f as flapping in the regular oscillation afteraround four cycles. Thus, the time history of pitching in the steadystate is approximately expressed by Eqn 4b with the positive phaseshift b. The fact that our analytical model, excited by the sinusoidalforce in Eqn 9 and subject to damping, attains the sinusoidaloscillation (Eqn 10) for the relative displacement δ(t)=ca(t)/2 in thesteady state provides convincing support for the presence of thesinusoidal passive pitching a(t) in our continuum plate model. Asshown in Fig.4, regardless of the value of ζ, the phase shift b is (a)positive (advanced phase shift) for f/fn<1, (b) zero (no phase shift)for f/fn=1 and (c) negative (delayed phase shift) for f/fn>1,respectively. For our model wing the spring constant ks�, given byEqn 8 with ks=1.9gcm2(s2rad)–1 and c=0.23cm, is equal to 144 gs–2,while the wing mass mw=ρsc(0.2hs+0.8h)=0.000166g. Thus thenatural frequency calculated by Eqn 12 is fn=148Hz which gives theratio f/fn=0.31<1, where f=45.5Hz. This shows that our continuumplate model wing satisfies the condition f/fn<1 for advanced pitching.
The analytical wing model also provides an insight into the tip tobase torsion wave observed in dipteran flight (Ennos, 1988b). Asshown in Fig.4, the value of the advanced phase shift b increases asthe value of f/fn (<1) gets smaller. Since the natural frequency fn givenby Eqn 12 increases when the wing mass mw is reduced, the phaseshift is bigger for the lighter wing mass. Consequently, when we movefrom the base to the tip of the wing, the wing mass becomes lighter(Ennos, 1989) and the phase shift becomes larger. Such a phase shiftgradient along the span-wise direction appears as the torsion wave inthe three-dimensional wing. We need to be careful, however, withthe limitations of our continuum plate model of the wing for whichthe chord length is obtained as an average over the span-wise directionand the motion represented is an average over the span. Nevertheless,our simple analytical model provides an insight into the tip to basetorsion wave observed in dipteran flight (Ennos, 1988b).
Lift generated by wing motion including passive pitchingWe found that the lift force generated by passive pitching almostmeets the required force to support the weight of the crane fly. Fig.7Bshows the time history of the lift coefficient CL (normalized by0.5ρfcVmax
2) in the wing motion with passive pitching. Its mean valueCL,mean=0.46 gives the mean combined lift force fL,mean=6.8�10–5Nfor both wings of the crane fly, which is comparable to but smallerthan the weight of the crane fly w=11�10–5N. This could beattributed to the loosely attached leading edge vortex on the wingdue to the long wing chord travel of the crane fly for the two-dimensional simulation. In the two-dimensional simulation withRe=75–115 and the stroke–wing chord ratio A0/c=2.8–4.8 for thefruit fly, the wing reverses before the leading edge vortex has timeto separate during each stroke. Thus in these cases the additional
mechanism is not required to stabilize the leading edge vortex andthe lift generated provides a good approximation of the correspondinglift in the three-dimensional experiment (Wang et al., 2004). In ourtwo-dimensional simulation with Re=290 and A0/c=5.9 (St=0.054)for the crane fly, the leading edge vortex appears to be slightlyseparated from the wing as shown in Fig.9. Due to the larger wingtravel length or the larger stroke–wing chord ratio and the smallerStrouhal number than those of Wang and colleagues (Wang et al.,2004), the leading edge vortex separates from the wing before thewing reverses in our two-dimensional simulation with no additionalstabilization mechanism such as the span-wise flow effect. If weadopt a fictitious insect with Re=200 and A0/c=3.2 (St=0.1), whosecharacteristics are closer to those of the model of Wang andcolleagues (Wang et al., 2004) than to those of the crane fly, theleading edge vortex is more tightly attached to the wing as shownin Fig.10. Consequently, the lift coefficient of the fictitious insectis higher than that of the crane fly as shown in Fig.11 with anapproximately 35% increase in the mean lift coefficient(CL,mean=0.62) compared with that of the crane fly. Pitching in thiscase is also advanced, as in the case of the crane fly.
It is important to remember here that it is hard to transmit theactive torsion applied by the muscle to the outer wing due to thewing torsional flexibility in Diptera (Ennos, 1987), while the wingpitch is adequately controlled to produce the lift to enable the insectto hover. Our wing model meets these criteria and explains themechanism of insect flight with passive pitching. It seems to benatural for insects to select such a passive mechanism to minimizethe effort required to move their wings. This passive mechanismmight be useful as the design principle for developing micro-airvehicles, i.e. engineers can avoid the need to develop the activemechanism to drive and control the wing pitch adequately.
APPENDIXTesting the validity of our FSI analysis method
We have selected the two-dimensional wing model similar to thatused by Wang and colleagues (Wang et al., 2004) as a benchmark
D. Ishihara, T. Horie and M. Denda
x
y
O
Wing center
Wing
a(t)
U(t)
Fig. A1. The two-dimensional wing model similar to that used by Wang andcolleagues (Wang et al., 2004) as a benchmark to test the capability of ourmethod. The x-displacement U(t) and an angular displacement around thez-direction a(t) are actively applied to the wing center.
–1
0
1
2
3 Up
Time cycle
Down
543210
CL
Fig. 11. Time histories of the lift coefficient CL for thefictitious insect (red line) and the crane fly (blackline). Note that both traces show simulations (notexperimental data), and that in the fictitious insectcase the leading edge vortex does not separatebecause of the short length of translation. Thevertical lines and the attached arrows show therange of each half-stroke for the downstroke (Down)and upstroke (Up).
THE JOURNAL OF EXPERIMENTAL BIOLOGY

9FSI cause of dipteran wing pitch changes
to test the capability of our method. The wing is modeled by a thinrigid elastic plate of thickness h with chord length c; in our elasticmodel a large Young’s modulus is assigned to simulate the rigidbody behavior. The model is two-dimensional having the unit extentin the z-direction (out-of-plane direction) without variation inthis direction. Following Wang et al. (Wang et al., 2004), anx-displacement U(t) and an angular displacement around thez-direction a(t):
are actively applied to the center of the wing as shown in Fig.A1,where A0=2.8c, β=π/4 and b=0 are the stroke amplitude, the
(ta ) = β sin(2π ft + b) , (A1b)
U (t) =A0
2cos 2π ft , (A1a)
amplitude of the pitching angle of attack and the phase shift,respectively. The common frequency f of the flapping and pitchingis set to produce the Reynolds number Re=ρfVmaxc/μ=75, where ρf
is the fluid mass density, μ is the fluid viscosity and Vmax=πfA0 isthe maximum wing velocity. The wing starts its downstroke withthe initial angular displacement a(0)=a0=0. Notice that this wingmotion agrees with that used by Wang and colleagues (Wang et al.,2004) with symmetrical pitching. Miller and Peskin (Miller andPeskin, 2005) have used a similar wing model with symmetricalpitching to demonstrate the validity of their numerical technique.Fig.A2 gives the time history of lift coefficient CL and dragcoefficient CD, normalized by 0.5ρfcVmax
2, which shows very goodagreement with the results of Wang and colleagues (Wang et al.,2004). As, in both simulations, the leading edge vortex is attachedto the wing during the wing stroke, the lift coefficient agrees wellwith that obtained from the three-dimensional experiment eventhough the three-dimensional axial flow is absent.
In the benchmark problem described above, where comparisonwith the results of Wang and colleagues (Wang et al., 2004) wasmade, the position of the axis of rotation is located at the center ofthe wing. In contrast, the position of the rotational axis of our lumpedflexibility model is located within the upper 20% of the wing, whilethat of the real insects is located near the leading edge. Thus theeffects of the location of the axis of rotation need to be investigated.We applied U(t) and a(t) at four positions; center (O), top (A), upper1/10 (B) and upper 1/3 (C). Fig.A3 shows the time history of CL
and CD for these positions, and Fig.A4 shows the relationshipbetween the rotational axis positions and the second peak value ofthe force coefficients from 3.5 to 4 cycles in Fig.A3. As shown in
–1
0
1
2
–2–101234
43.532.52
Time cycle
CL
CD
Fig. A2. Comparisons of the time histories of CL and CD. The red and bluelines show the results given by the present method and that of Wang andcolleagues (Wang et al., 2004), respectively, while the black line representsthe experimental data given by Wang and colleagues (Wang et al., 2004).
–1
0
1
2
–2
0
2
4
3.5 3.75 43 3.25
Time cycle
CL
CD
Fig. A3. Time histories of CL and CD for the different positions of the axis ofrotation. The black, red, blue and green lines correspond to positions O(centre), A (top), B (upper 1/10) and C (upper 1/3), respectively.
1.2
1.3
1.4
1.5
1.6
1.7
1.8
Sec
ond
peak
of C
LS
econ
d pe
ak o
f CD
1.8
2
2.2
2.4
2.6
2.8
3
52.50–2.5y-coordinate of rotational axis (cm)
Fig. A4. The relationship between the rotational axis positions and thesecond peak values of the force coefficients from 3.5 to 4 cycles in Fig. A3.
Mesh O Mesh A Mesh B
Fig. A5. Convergence test where the fluid grid isrefined. Mesh O (the number of nodes andelements is 3417 and 6600, respectively) is usedto give the results in Figs A2, A3 and A4. Therefined meshes A (the number of nodes andelements is 3905 and 7560, respectively) and B(the number of nodes and elements is 4697 and9120, respectively) have 1.4 and 2 times finerspace resolutions, respectively, around the wing.
THE JOURNAL OF EXPERIMENTAL BIOLOGY

10
Fig.A3, the time histories of CL and CD for the four positions aresimilar. As shown in Fig.A4, the force coefficients vary linearly.CL varies from 1.46 to 1.65 and CD varies from 2.26 to 2.71 as therotational axis position varies from positions C (upper 30% of thewing) to A (top of the wing). The rotational axis of our model islocated within the upper 20% of the wing chord and that of realinsects is located near the leading edge. As a consequence, the effectof the location of the rotational axis is negligible as long as therotational axis is located near the top of the wing chord or the leadingedge.
A convergence test in which the fluid grid is refined is alsoprovided here. Fig.A5 shows the three fluid grids (meshes O, Aand B) employed. Mesh O (the number of nodes and elements is3417 and 6600, respectively) is used to give the results in FigsA2,A3 and A4. The refined meshes A (the number of nodes andelements is 3905 and 7560, respectively) and B (the number of nodesand elements is 4697 and 9120, respectively) have 1.4 and 2 timesfiner space resolutions, respectively, around the wing. As shown inFig.A6, the force coefficients given by using these meshes showvery good agreement. As a consequence, we employed mesh Othroughout this study.
D.I. is grateful for support from a Grant-in-Aid from Japan Ministry of Education,Culture, Sports, Science and Technology (No. 17760088).
REFERENCESBathe, K. J. and Dvorkin, E. N. (1985). A four-node plate bending element based on
Mindlin/Reissner plate theory and a mixed interpolation. Int. J. Numer. Methods Eng.21, 367-383.
Birch, J. M. and Dickinson, M. H. (2003). The influence of wing-wake interactions onthe production of aerodynamic forces in flapping flight. J. Exp. Biol. 206, 2257-2272.
Dickinson, M. H., Lehmann, F.-O. and Sane, P. S. (1999). Wing rotation and theaerodynamic basis of insect flight. Science 284, 1954-1960.
Ellington, C. P. (1984a). The aerodynamics of hovering insect flight. II. Morphologicalparameters. Philos. Trans. R. Soc. Lond. B, Biol. Sci. 305, 17-40.
Ellington, C. P. (1984b). The aerodynamics of hovering insect flight. III. Kinematics.Philos. Trans. R. Soc. Lond. B, Biol. Sci. B 305, 41-78.
Ellington, C. P., Van den Berg, C., Willmott, A. P. and Thomas, L. R. (1996).Leading-edge vortices in insect flight. Nature 384, 626-630.
Ennos, A. R. (1987). A comparative study of the flight mechanism of Diptera. J. Exp.Biol. 127, 355-372.
Ennos, A. R. (1988a). The importance of torsion in the design of insect wings. J. Exp.Biol. 140, 137-160.
Ennos, A. R. (1988b). The inertial cause of wing rotation in Diptera. J. Exp. Biol. 140,161-169.
Ennos, A. R. (1989). Inertial and aerodynamic torques on the wings of Diptera in flight.J. Exp. Biol. 142, 87-95.
Hughes, T. J. R., Liu, W. K. and Zimmerman, T. K. (1981). Lagrangian–Eulerianfinite element formulation for incompressible viscous flows. Comput. Meth. Appl.Mech. Eng. 29, 329-349.
Ishihara, D. and Yoshimura, S. (2005). A monolithic approach for interaction ofincompressible viscous fluid and an elastic body based on fluid pressure Poissonequation. Int. J. Numer. Methods Eng. 64, 167-203.
Ishihara, D., Kanei, S., Yoshimura, S. and Horie, T. (2008). Efficient parallel analysisof shell-fluid interaction problem by using monolithic method based on consistentpressure Poisson equation. J. Comput. Sci. Technol. 2, 185-196.
Jensen, M. and Weis-Fogh, T. (1962). Biology and physics of locust flight. V.Strength and elasticity of locust cuticle. Philos. Trans. R. Soc. Lond. B, Biol. Sci.245, 137-169.
Liu, H., Ellington, C. P., Kawachi, K., Van den Berg, C. and Willmott, A. P. (1998).A computational fluid dynamic study of hawkmoth hovering. J. Exp. Biol. 201, 461-477.
Luo, G. and Sun, M. (2005). The effects of corrugation and wing planform on theaerodynamic force production of sweeping model insect wings. Acta Mech. Sinica.21, 531-541.
Miller, L. A. and Peskin, C. S. (2005). A computational fluid dynamics of ‘clap andfling’ in the smallest insects. J. Exp. Biol. 208, 195-212.
Noguchi, H. and Hisada, T. (1993). Sensitivity analysis in post-buckling problems ofshell structure. Comput. Struct. 47, 699-710.
Ramamurti, R. and Sandberg, W. C. (2002). A three-dimensional computational studyof the aerodynamic mechanisms of insect flight. J. Exp. Biol. 205, 1507-1518.
Rugonyi, S. and Bathe, K. J. (2001). On finite element analysis of fluid flows fullycoupled with structural interactions. Comput. Model. Eng. Sci. 2, 195-212.
Sun, M. and Tang, J. (2002). Unsteady aerodynamic force generation by a model fruitfly wing in flapping motion. J. Exp. Biol. 205, 55-70.
Tezduyar, T. E., Mital, S., Ray, S. E. and Shih, R. (1992). Incompressible flowcomputations with stabilized bilinear and linear equal-order-interpolation velocity-pressure elements. Comput. Methods Appl. Mech. Eng. 95, 221-242.
Usherwood, J. R. and Ellington, C. P. (2002). The aerodynamics of revolving wings.I. Model hawkmoth wings. J. Exp. Biol. 205, 1547-1564.
Wainwright, S. A., Biggs, W. D., Currey, J. D. and Gosline, J. M. (1982).Mechanical Design in Organisms. Princeton, NJ: Princeton University Press.
Wang, Z. J. (2000). Vortex shedding and frequency selection in flapping flight. J. FluidMech. 410, 323-341.
Wang, Z. J., Birch, J. M. and Dickinson, M. J. (2004). Unsteady forces and flows inlow Reynolds number hovering flight: two-dimensional computation vs robotic wingexperiments. J. Exp. Biol. 207, 449-460.
Wooton, R. J., Herbert, R. C., Young, P. G. and Evans, K. E. (2003). Approaches tothe structural modeling of insect wings. Philos. Trans. R. Soc. B, Biol. Sci. 358,1517-1587.
Zhang, Q. and Hisada, T. (2001). Analysis of fluid-structure interaction problems withstructural buckling and large domain changes by ALE finite element method.Comput. Methods Appl. Mech. Eng. 190, 6341-6357.
D. Ishihara, T. Horie and M. Denda
–0.20
0.20.40.60.8
11.21.4
–2–1.5
–1–0.5
00.5
11.5
22.5
3.5 3.75 4
Time cycle
CL
CD
Fig. A6. Comparison of the time histories of CL and CD. The black, blue andred lines show the results obtained using meshes O, A and B, respectively.
THE JOURNAL OF EXPERIMENTAL BIOLOGY