Embed Size (px)
Citation preview

Ice in the Environment: Proceedings of the 16th IAHR International Symposium on Ice Dunedin, New Zealand, 2nd–6th December 2002 International Association of Hydraulic Engineering and Research A TWIN WAVE TANK PANCAKE ICE GROWTH EXPERIMENT
Karl-Ulrich Evers1, Hayley H. Shen2, Mingrui Dai2, Yong Yuan2, Tomasz Kolerski3 and Jeremy Wilkinson4
ABSTRACT An indoor experiment to study pancake ice growth in a wave field has been conducted in November 2001 at the ARCTECLAB of the Hamburgische Schiffbau-Versuchsanstalt (HSVA). This unique facility was equipped with two distinct wave tanks in the same cold room. Two wave makers were operated independent of each other in two identical flumes. The purpose of this study was to separate the dynamic effect from the thermodynamic effect. A total of six tests were made with varying durations. In addition to the two wave tank tests, we also grew ice under calm water condition in the same room using a box with insulated walls and bottom. We collected hourly data on wave conditions: wave number and amplitude, ice conditions: surface temperature, thickness and pancake size, environmental conditions: air and water temperature, and salinity. This paper describes details of this experiment. INTRODUCTION Pancake ice growth has been observed in many marginal ice zones as well as polynyas and large open leads (e.g. Martin and Kauffman, 1981; Lange et al., 1989; Wadhams, 1991). The areal coverage of pancake ice in the Southern Ocean is estimated at six million square kilometers (Wadhams, 1991). Its formation has been linked to the presence of waves. Several laboratory experiments have been conducted to demonstrate the importance of waves on the frazil/pancake ice cover formation (Newyear and Martin, 1997, 1999; Leonard et al., 1999a,b; and Ackley et al., this Proceedings). Although water-ice phase transition is a thermodynamic phenomenon, mechanical processes can affect the distribution of the existing ice thereby influence the final production of ice cover. As part of an ongoing US National Science Foundation project led by the second author, a unique test was conducted at HSVA to isolate the mechanical actions of the waves from the thermodynamic effects. A twin wave tank facility was built by the HSVA team. The twin tanks with identical geometry generated two different waves inside the same cold room at the ARCTECLAB of HSVA. Waves ranging from 0.5–0.9Hz were tested. This paper describes the facility, test procedure,
1 Hamburgische Schiffbau-Versuchsanstalt (HSVA), Hamburg Germany 2 Clarkson University, Potsdam, NY USA 3 Institute of Hydroengineering, Gdansk Poland 4 Scott Polar Research Institute, Cambridge UK

and the type of data collected. SUMMARY OF DATA TYPE AND INSTRUMENTATION The following table summarizes the data and instrumentation of this experiment. In addition to the quantitative data in the table, digital photos, short digital movies, as well as regular videos were also taken throughout the experiment.
Data Type Instrumentation Wave Characteristics Pressure Transducers Water Current Characteristics Acoustic Doppler Velocimeter Ice Characteristics Surface Temperature Infrared Camera (Inframetrics model 760) Thickness Wire scoop/Caliper Pancake Diameter Ruler Porosity Wire scoop/Beaker/Caliper Salinity Salinity/Conductivity Meter (WTW LF196) Crystal Structure Band Saw/Microtone/Digital Camera Air/Water Temperature Thermometers (WTW LF196/Testo 110) Water Salinity Salinity-Temperature meter (WTW LF196) Precision Air/Ice/Water Temperature Profile PT100
TEST FACILITY The Arctic Environmental Test Basin is part of the European infrastucture ARCTECLAB. The experiment was conducted in a basin of 30 m long, 6 m wide and about 1.5 m deep where the air temperature can be reduced to about –20 C. This basin was divided equally lengthwise into two 3 m wide flumes, filled with tap water containing sodium chloride at around 35 PPT salinity in the beginning of the test. Two totally separated wave makers were installed at about 9 m mark of the flume. Two circular profiled stainless steel beaches were installed at the 24 m mark location of the flume. The layout of the wave tanks and the location of the instruments are shown in Fig. 1. The wave makers, beach, and overview of the wave tanks are shown in Fig. 2.
Figure 1: Layout of the wave tanks and the locations of instrumentations.

Figure 2: The wave makers, the beach, and the wave tank overview.
The wave maker at the near side (starboard) was a single stroke flap type paddle. It generated clean monochromatic waves. The wave maker at the far side (port) was a double stroke piston/flap combination paddle. In our tests, this paddle was operating at the single stroke flap mode. TEST PROCEDURE Each day the test started from the open water condition. The room was maintained at around –3 C during the night. The water was at supercooled condition with temperature around –2.1 C and covered with ice from the previous test. After clearing the ice off from the surface every morning, maximum cooling started. In each test, within two hours, the room temperature dropped to –15 C~ –16 C until the end of the day. Pressure sensors took readings at intervals of 5 min and 25 min alternately for the whole duration of the test. The sensors were located at a nominal depth of 30 cm below the calm water level. Velocity meter took readings every hour at the depth of 30 cm below the calm water level. The velocity meter was manually moved back and forth from the starboard side to the port side each time. Additionally, in the beginning and at the end of each test, profiles of the velocity at depths of 20 cm, 30 cm, 40 cm, and 60 cm were taken. In situ water temperature and salinity were taken each hour at two locations in each wave tank. The depth at which these data were taken was about 20 cm. Collection of water sample at these locations was done at 1–2 hour intervals depending on the ice growth rate. These samples were analyzed for salinity in room temperature afterwards. Ice thickness and pancake size were determined every hour after the growth became sufficient for measurement. Ice surface temperature was taken with an infrared camera. For most cases, images were taken at three locations: 15 m, 17 m, and 19 m marks over each wave tank. At the end of each day, ice thickness profile was obtained by measuring the ice cover thickness from the paddle to the beach at 2 m intervals. After the ice profiling, pancake or slush ice samples were collected. After draining the pore water, the samples were stored in a freezer at –30 C for crystal, salinity, and porosity measurements. Whenever possible, ice samples were collected at three locations: 15 m, 19 m, and 23 m marks from each wave tank. Some days due to the wave condition and the duration of the test, at locations near the paddle there was no ice to be collected. Air temperature was taken each hour manually with a thermometer hanging about 2 m above the water level at the 15 m mark on the starboard side. Air temperature and water temperature were also taken automatically using fixed location thermometers at 1 min
intervals. Precision temperature profiling was done automatically with a PT100 string at 1 min interval. There were 10 sensors on each of these PT100 string located in each of the wave tanks. In the following section, we will describe the data collection and measurement procedures. MEASUREMENT DETAILS The water temperature together with the salinity was obtained with a hand-held Salinity-Temperature meter WTW LF196. More precise Air/Ice/Water temperature profiles were obtained by the PT100 temperature meter. The accuracy of the PT100 meter was 0.06 C. The resolution was 0.01 C. Sample in situ salinity data are shown in Fig. 3. The corresponding air/ice/water temperature profiles are given in Fig. 4. In Fig. 4 the basin temperatures curves were obtained with thermometers 2 m above the mean water level at four different locations in the room. Each PT100 string had 10 sensors located at, from the bottom curve up, 12, 4, 2, 0 cm above the mean water level, followed by 2, 4, 6, 12, 20, and 30 cm below the mean water level respectively.
Water salinity for 11/23/2001
35.835.9
3636.136.236.336.436.536.6
8:00 12:00 16:00 20:00
Time(hr:mn)
Salin
ity(P
PT)
Beach StarboardBeach PortsidePaddle StarboardPaddle Portside
Figure 3: A sample salinity data.
Basin temperature of 11/23/2001
-20
-15
-10
-5
0
5
0:00 8:00 16:00 0:00Time(hr:mn)
Tem
pera
ture
(oc)
PT100 record of 11/23/2001-Port
-16-14-12-10-8-6-4-20
0 500 1000 1500Time (min)
Tem
pera
ture
(oc)
Figure 4: Sample temperature data. Time started from midnight. There were 8 pressure transducers along each wave tank at the location centered around the 17 m mark. The spacing of the pressure transducers was varied according to the wave frequency. The total length between the first and the last transducers was less than

one wavelength. Because the beach reflection characteristics and the dispersion relations could change during the experiment, as a result of the ice growth, we needed to determine the wavelength, the reflection coefficient, the phase shift of the reflected wave, and the incoming wave amplitude throughout each test. The redundancy provided by the eight pressure readings will allow for more accurate wave measurements. Additional hydrodynamic conditions were monitored by researchers from the Polish Institute of Hydroengineering and Clarkson University. They jointly collected water velocity data using SonTec’s Acoustic Doppler Velocimeter. The ice surface temperature was measured with the Infrared Camera (Inframetrics 760) from US Army Cold Regions Research and Engineering Laboratory (CRREL). The IR camera was mounted on the ceiling and free to slide along the tracks as shown in Fig. 5. The camera lens was at 2.1 m above mean water level. IR pictures were taken every hour at three positions: 15 m, 17 m and 19 m locations for each channel. A sample ice surface temperature is given in Fig. 6.
Figure 5: The mounting system of the IR camera and a sample picture taken by the camera. Darker color means lower temperature.
Ice surface temperature change 11/23/2001
-2.6
-2.4
-2.2
-2
-1.8
-1.6
-1.4
4:00 8:00 12:00 16:00
Time (hr:mn)
Tem
pera
ture
(oc) SM15
PM15SM17PM17SM19PM19
Figure 6: Ice surface temperature obtained with the IR camera. S is the starboard side and P is the port side. M15 means at mark 15m, etc.
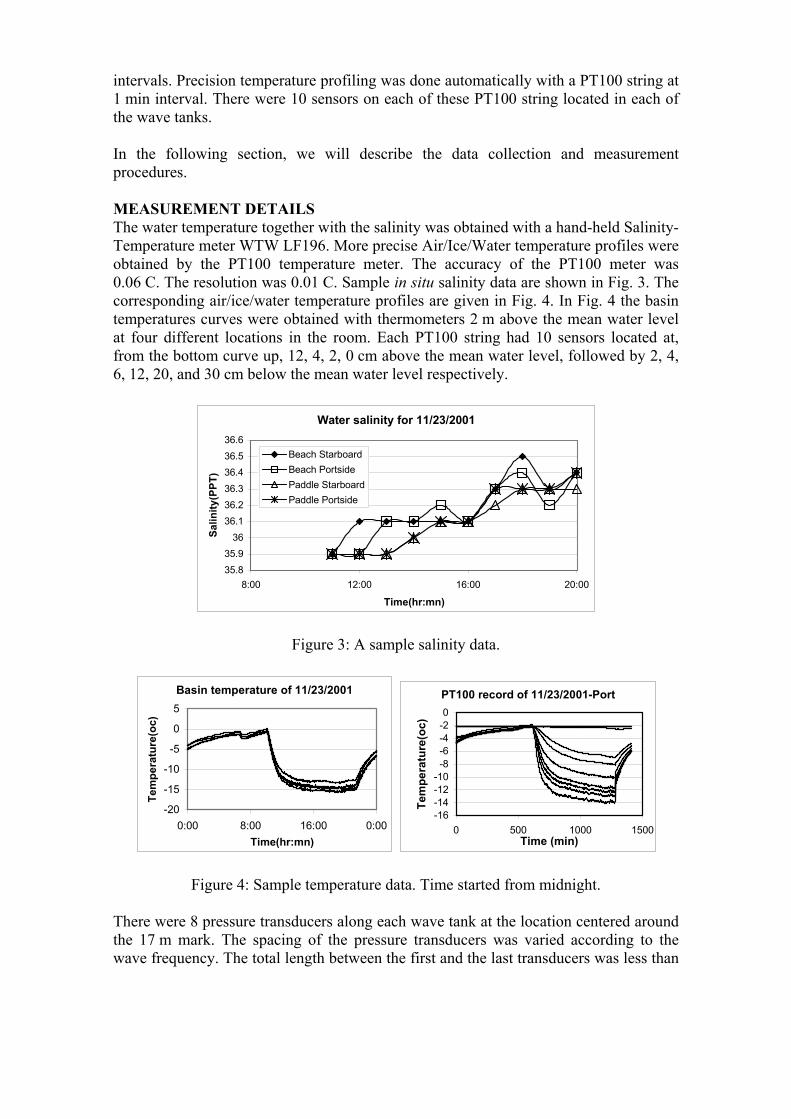
The ice thickness was measured with a wire scoop. Pancake ice size was measured with a ruler lying flat on the ice cover. Because the pancakes were not exactly uniform in size, a ‘representative’ pancake with the medium size as judged by visual evaluation was selected. The ‘diameter’ of a pancake was defined as the dimension along the wave tank. This was because when the pancakes grew larger, in the planar wave case as we had, they grew into long ‘sausage’ shape instead of maintaining circular as when they were smaller. The length of these ‘sausage’ shapes was a function of the width of the wave tank rather than the wave characteristics. Hence we chose the direction along the wave propagation for the definition of ‘diameter’. Ice cover thickness profile was obtained at the end of the experiment every day. From 9 m mark to 23 m mark, we measured the ice thickness every 2 meters. The wire scoop was inserted carefully into the ice cover deep below its slush bottom. The scoop was lifted straight up to take a square sample of the ice cover together with the slush. After the water had drained out, the vertical handle (which was made of a meter stick) was used to determine the ice cover thickness. Results of the ice thickness and pancake diameter from three locations: 15 m, 19 m, and 23 m throughout the tests await further analysis. A sample final thickness profile at 2 m intervals is given in Fig. 7.
Final Ice Thickness Profile 11/23/2001
0
10
20
30
40
50
60
9 11 13 15 17 19 21 23Location (m)
Thic
knes
s (m
m)
StarboardPort
Figure 7: A sample ice profile at the end of a test.
Whenever possible at the end of each test pancake ice samples were taken from three positions: 15 m, 19 m, 23 m, separately for each channel. These samples were used to determine the salinity and porosity of the ice. These ice samples were first stored in the freezer at –30 C until ready for measurement. A portion of the sample was cut and put into the sampling bottle. The sealed bottle was gradually warmed to room temperature and the salinity reading was obtained at room temperature for the melted pancakes. Due to the temperature dependence of the WTW LF196 meter, these salinity readings were increased by 0.6 PPT in order to compare with the water salinity at –2 C. The average salinity value obtained this way was 22 PPT.

Another method was used by researchers from the Scott Polar Research Institute to measure the salinity of the ice. First a transparent cylindrical cup was used to collect ice from the ice cover. A vertical section of the ice cover was captured by closing the bottom of the cylinder after the cylinder completely penetrated the ice cover. The entire sample, water and ice together, was then poured into the strainer to drain out the water. Ice crystals were separated as much as possible by hand in this strainer to remove adhered water. The remaining ice crystals were then carefully scraped into a small sampling bottle to be melted. After the ice was melted, a conductivity meter was inserted to obtain the reading. This conductivity reading was then converted to salinity using the UNESCO standard seawater formula. The result of this measurement is very close to the previously mentioned method, at 23.5 PPT. Ice porosity was also measured whenever possible. We tried two different ways to measure the porosity. The first method was by melting a piece of ice sample, from the ratio of the volume before and after melting, and the specific gravity of the ice, one could determine the porosity of the ice sample. However, using this method nearly all samples rendered negative porosity, indicating significant error in estimating the ice thickness using calipers. A second method used was more precise (Hammar, personal communication). The steps are as follows: 1. Put a small amount of motor oil in a measuring cup and record the original volume
0v . 2. Cut a small piece of ice from the ice sample, put it into the measuring cup with oil.
Make sure the ice was submerged completely. 3. Read the volume quickly to avoid ice melt or the oil seeping into the ice. This
volume is 1v . The porous ice volume is therefore 01 vv − . 4. Put the measuring cup in warm water and wait until the ice melted completely. 5. Measure the volume of the melted liquid 2v . The difference 02 vv − is the volume of
the water from the melted ice. 6. Convert water volume to ice volume: 917.0/)( 02 vv − where 0.917 is the specific
gravity of solid ice. This is the solid ice volume from the melt water.
7. The porosity can be obtained using the above three volumes 2 0
1 0
10.917( )
v vpv v−
= −−
.
This method yielded reasonable values. The porosity values were surprisingly low, ranging from 2 % to 23 % depending on the growth condition of the samples. Vertical thin sections of pancake ice samples were made and digital images of these thin sections through cross-polarized lenses were taken. These images indicated that all these pancakes started with a random orientation, but after the first 1 cm the orientation of the crystals became horizontal. Three samples are shown in Fig. 8. These structures are the same as young pancake ice found in the Sea of Okhotsk (Toyota, personal communication). Ice salinity and porosity from the calm water test were measured at the end of the tests using the same methods as mentioned above. The salinity of the ice was lower and the porosity was higher than the wave-grown counterpart. The ice thickness converted to

solid ice from the calm water case was less than half of the wave grown case.
Figure 8: Vertical thin sections of pancake ice. Left: Nov.23 port side near the paddle, middle: Nov. 27 port side near the paddle, right: Nov. 28 starboard side near the beach. The grid in these images is 1 cm by 1 cm. CONCLUSIONS The twin tank facility provides unique opportunities to isolate dynamic wave effects from thermodynamic effects in pancake ice growth. Data obtained in the reported experiment will be used to 1. identify the ice production rate that may be attributed to wave actions and 2. determine the relation between the ice cover morphology and the wave characteristics. ACKNOWLEDGEMENT The authors would like to thank the Hamburg Ship Model Basin (HSVA), especially the ice tank crew, for the hospitality, technical support and professional execution of the test programme in the ARCTECLAB. We also acknowledge the training on operating the IR camera provided by J. Lacombe and G. Phetteplace of USACRREL. The research activities carried out at the Major Research Infrastructure ARCTECLAB were financially supported by the Human Potential and Mobility Programme from the European Union through contract HPRI-CT-1999-00035. Travel of the US participants were funded by the US National Science Foundation-International program through a supplement of the NSF-Office of the Polar Program grant #9814968, under which the Clarkson team was founded to conduct wave-ice interaction research. REFERENCES Lange, M.A., Ackley, S.F., Wadhams, P., Dieckmann, G.S. and Eicken, H. Develop-
ment of sea ice in the Weddell Sea Antarctica. Ann. Glaciol. 12: 92–96 (1989). Leonard, G., Shen, H.H. and Ackley, S.F. Initiation and Evolution of Pancake Ice in a
Wave Field. Antarctic Journal 32(5), Review 1997: 53–55 (1999a). Leonard, G.H., Shen, H.H. and Ackely, S.F. Dynamic growth of a pancake ice cover.
Ice in Surface Waters, Proc. 14th IAHR Ice Symp., Vol. 2, H.T. Shen., ed., A.A.Balkema, Rotterdam (1999b) 891–896.
Martin, S. and Kauffman, P. A field and laboratory study of wave damping by grease ice. J. Glaciol. 27(96): 283–313 (1981).
Newyear, K. and Martin, S. A comparison of theory and laboratory measurements of wave propagation and attenuation in grease ice. J. Geophys. Res. 102(C11): 25091–25099 (1997).
Newyear, K. and Martin, S. Comparison of laboratory data with a viscous two-layer model of wave propagation in grease ice. J. Geophys. Res. 104(C4): 7837–7840 (1999).
Wadhams, P. Atmosphere-ice-ocean interactions in the Antarctic. Antarctica and Global Climatic Change (ed. C Harris, B Stonehouse), Belhaven, London: 65–81 (1991).