Embed Size (px)
Citation preview

© 2017. Elisa K. Chan. This is a research/review paper, distributed under the terms of the Creative Commons Attribution-Noncommercial 3.0 Unported License http://creativecommons.org/licenses/by-nc/3.0/), permitting all non-commercial use, distribution, and reproduction in any medium, provided the original work is properly cited.
Global Journal of Management and Business Research: G Interdisciplinary Volume 17 Issue 4 Version 1.0 Year 2017 Type: Double Blind Peer Reviewed International Research Journal Publisher: Global Journals Inc. (USA)
Online ISSN: 2249-4588 & Print ISSN: 0975-5853
A Tutorial on Scale Development: The Experiential Value Scale By Elisa K. Chan
University of Applied Sciences Western Switzerland
Introduction- Businesses are increasingly concerned about deriving actionable insights from data they obtained either from primary or secondary sources. One aspect that has been neglected in this discussion is the importance of using the right measure for the intended subject (or what academics refer to as constructs). Many in the industry either rely on marketing research companies or internally generated questionnaires to collect consumer’s evaluation about their consumption experience. More often than not, questions used in consumer surveys are single-item measures which are not only prone to error and bias, they are also not sufficient for more stringentstatistical analyses. Following the well-established scale development methods developed in the field of business research (c.f., Churchill 1979; Gerbing and Anderson 1988), the objective of this paper is to provide a step-by-step guideline to demonstrate how accurate and effective measures are developed. Moreover, it also provides a sound and comprehensive measure for experiential value (i.e., consumer value derived from a consumer experience).
GJMBR-G Classification: JEL Code: M10
A Tutorial on Scale Development The Experiential Value Scale
Strictly as per the compliance and regulations of:
A Tutorial on Scale Development: The Experiential Value Scale
Elisa K. Chan
I. Introduction
usinesses are increasingly concerned about deriving actionable insights from data they obtained either from primary or secondary
sources. One aspect that has been neglected in this discussion is the importance of using the right measure for the intended subject (or what academics refer to as constructs). Many in the industry either rely on marketing research companies or internally generated questionnaires to collect consumer’s evaluation about their consumption experience. More often than not, questions used in consumer surveys are single-item measures which are not only prone to error and bias, they are also not sufficient for more stringentstatistical analyses. Following the well-established scale development methods developed in the field of business research (c.f., Churchill 1979; Gerbing and Anderson 1988), the objective of this paper is to provide a step-by-step guideline to demonstrate how accurate and effective measures are developed. Moreover, it also provides a sound and comprehensive measure for experiential value (i.e., consumer value derived from a consumer experience).
Creating and managing consumer experience has become one of the central objectives for companies (Verhoef et al 2009). Practitioner-oriented publications have advocated that some companies or brands (i.e. Starbucks) achieved business successes because of the distinctive consumption experience they delivered to consumers (Michelli 2007). An IBM report claimed that customer experience is essential to building loyalty to its brands, channels and services (Badgett, Boyce, and Kleinberger 2007).But most companies solely rely on customer satisfaction survey or qualitative reviews and testimonies to assess consumer experience. The current study argue that consumer experience essentially consists of internal responses that consumer have during their interaction with the company at all touchpoints. As a result, in order to gain a better understanding about a consumer experience, it is important to ask questions which can reflect internal emotion and cognition of an individual. In this paper, these internal emotion and cognition are collectively defined as experiential value. Author: Assistant Professor, Ecolehôtelière de Lausanne, HES-SO // University of Applied Sciences Western Switzerland, Route de Cojonnex 18, 1000 Lausanne, Switzerland. e-mail: [email protected]
In the remainder of this paper, I will first present a literature review and conceptual development of the experiential value construct. Following that, in the methodology section, an elaborative, step-by-step discussion is provided to illustrate how accurate and proper scale measures should be developed to yield better knowledge and insight for businesses.
II. Literature Review
a) Experiential Value Based on review of past literature, experiential value in consumption in this study is defined as the psychological benefits (i.e. thoughts and feelings) resulted from a consumer’s interaction with the environment related to consumption which are only assessable by the individual. Consumption here is referred broadly to different stages in the whole consumption process: from anticipatory consumption to product or service acquisition, as well as from post-purchase possession to the actual usage of the product or service (Richins 1997). Experiential value is derived directly from the interplay of the consumer, product, service, and environment. This conceptualization is in line with that for art consumption which is “characterized as emotional and mental pulling” (Belk, Ger, and Askegaard 2003). Interestingly, researchers of contemporary painting have extensively admitted that the consumption of such ‘requires the intellectual and affective participation of consumers’ (Chen 2009; Moureau 2000). The current study extends this contention about contemporary art to include any experience in consumption. Specifically, the value which consumers gain from an experience in consumption would possess an emotional and an intellectual aspect. In addition, the current study also includes interaction among consumer, product, service, and environment as potential sources for experiential value rather than solely from an object (i.e. a piece of artwork) as suggested by researchers of art consumption (Chen 2009; Sherry and Joy 2003).
b) Emotional Value Emotional value referred to the utility acquired
as a result of a product’s [or a service’s ability] to arouse feelings or affective states (Seth, Newman and Gross 1991). Specifically, this value reflects the emotional outcome of a person’s interaction with the immediate surroundings, which is an emotive internal
B
© 2017 Global Journals Inc. (US)
19
Globa
l Jo
urna
l of M
anag
emen
t an
d Bu
siness Resea
rch
Volum
e XVII
Issu
e IV
Ver
sion
IYe
ar
()
2017
G
experience. Emotion has a prominent role in consumer behavior research and is an important component in consumer responses (Cohen and Areni 1991). Different consumption context may derive a diversified, distinctive set of emotion which is likely to differ in intensity. Two consumptions that are perceived to possess emotional values could have aroused different specific emotions, but still bear on the same underlying emotional states. For example, a theme park or an art museum visitor can both experience pleasure as a result of different activities and interactions. For example, a study examined the emotional components of eight specific consumption experiences, one in each of the followings: esthetics, athletics, entertainment, dining, hobbies, fashion, religion, and security (Halvena and Holbrook 1986). The authors measured emotional experience of the different consumption contexts aforementioned with two emotion typologies: the pleasure- arousal-dominance (PAD) paradigm developed by Mehrabian and Russell (1974) and the eight basic emotion indices established by Plutchik (1980). The former is found to be a more useful framework for capturing consumption related emotional experience. Despite its adequacy and generaliability in manifesting consumption related emotional experience, the PAD scale is not without shortcoming. The scale was intended for measuring “emotional responses to environmental stimuli such as architechtural space [; therefore] its validity in assessing emotional responses to the interpersonal aspects of…consumption cannot be assumed” (Richins 1997).
c) Intellectual Value Intellectual value referred to the utility acquired
as a result of a product’s, a service’s or experience’s ability to arouse exercise of the intellect. The word intellectual is defined as something that is given to activities or pursuits that require exercise of the intellect (i.e. ability to learn and reason; capacity for knowledge and understanding) and something that is associated with or requiring the use of the mind rather than emotions (The American Heritage Dictionary). Moreover, cognitive activities such as cognition, memory, convergent thinking, divergent thinking and evaluation are referred to as intellectual operations (Guilford 1959). The intellectual value reflects the cognitive outcome of a person’s interaction with the immediate surroundings, which is a cognitive internal experience. This value has not been conceptualized by past literature. But examples of intellectual value are ample in the qualitative account of experience-rich consumption: museum goers getting information of a piece of art or the history of art (Chen 2009; Joy and Sherry 2003), river-rafting participants gaining a sense of personal growth through learning new jargons of the boatmen (Arnould and Price 1993), and shoppers gaining general knowledge about fashion (Haytko and Baker 2004), just to name a few. Nevertheless, intellectual value has not
been formally introduced as an experiential outcome that consumer would gain from consumption. The one exception is that Arnould and Price (1993) implicitly reported in their findings that personal growth, which is measured by items such as learning new things and mastering new skills, is an important determinant for an extraordinary experience (i.e. river-rafting). The construct of personal growth, however, is specific to river-rafting and may be to other extreme sports. The intellectual value suggested in the current study is intended to be generalizable to a variety of consumption.
d) Existing Experiential Value Scale Mathwick, Malhotra and Rigdon (2001) came up with the EVS to describe the perceived value associated with virtual shopping experience (i.e. catalog and internet shopping). They typified experiential value into four types along two of the three dimensions proposed by Holbrook (1999). They are source of value (intrinsic versus extrinsic) and degree of individual participation (active versus reactive). Subsequently, four distinct types of experiential values are identified: playfulness (intrinsic and active), aesthetics (intrinsic and reactive), consumer return on investment (extrinsic and active), and service excellence (extrinsic and reactive). Note that both consumer return on investment and service excellence seem to be along the line with functional value obtained from the experience. As a result, the experiential aspect this study accounted for is tied to the context of the consumption (i.e. virtual shopping) as opposed to the kind of value (i.e. experiential versus functional) obtained from the consumption experience. For instance, the aesthetics value has two dimensions, namely visual appeal and entertainment. The items measuring visual appeal (i.e. “The way XYZ displays its products is attractive,” “XYZ’s Internet site is aesthetically appealing,” and “I like the way XYZ’s Internet site looks”) and entertainment value (i.e. “I think XYZ’s Internet site is very entertaining,” “The enthusiasm of XYZ’s Internet site is catching, it picks me up,” and “XYZ doesn’t just sell products-it entertains me”) seemed to be assessing the playfulness and aesthetics value of the website, but not the internal response that the individual had while browsing or shopping through the it. Arguably, visual appeal of the website is an assessment of the external factors. These external factors would in turn lead to an internal response of an individual that consist of emotive and cognitive components. Likewise, the playfulness construct is proposed to be having an escapism and intrinsic enjoyment dimension. Items measuring escapism (i.e. “Shopping from XYZ’s Internet site “gets me away from it all,” “Shopping from XYZ makes me feel like I am in another world,” and “I get so involved when I shop from XYZ that I forget everything else”) reflected a kind of consumption experience that would bring about complete immersion.
20
Globa
l Jo
urna
l of M
anag
emen
t an
d Bu
siness Resea
rch
Volum
e XVII
Issu
e IV
Ver
sion
IYe
ar
()
2017
© 2017 Global Journals Inc. (US)1
GA Tutorial on Scale Development: The Experiential Value Scale
What it does not tell us is how does this sense of escape arise? For instance, was it the information provided by the website that got the person “away from it all”? Or was it the graphic design that led to the immersion? Finally, while intrinsic enjoyment (i.e. “I enjoy shopping from XYZ’s Internet site for its own sake, not just for the items I may have purchased” and “I shop from XYZ’s Internet site for the pure enjoyment of it”) can manifest the value of the activity, it could also be reflecting the individual’s motivation or purpose of the activity. As a result, what this construct is measuring is somewhat ambiguous.
III. Methodology
In this section, the process used to develop the content of each dimension and to validate the scale psychometrically is elaborated in detail. The procedure employed is based on accepted methods of scale development in psychology and consumer research (Churchill 1979; Gerbing and Anderson 1988). The aim is to establish a useful and practical scale that is parsimonious and generalizable across consumption domains.
a)
Step 1: Item Generation and Selection
To generate items which will capture the
experiential value in consumption, two steps as suggested by
Churchill (1979) were followed: 1) a
literature review and 2) a focused group.
i.
Literature Review
A literature review on past studies which
examined and or identified emotional or cognitive consequences consumers regarded to as preferential was carried out. In the initial emotional value set, there were 1 item from Chen (i.e. access value, 2009), 24 items from Havlena and Holbrook (i.e. consumption emotions, 1986), 3 items from Mathwick, Malhotra and Rigdon (i.e. entertainment value, 2001), 3 items from Shoham, Rose and Kahle (i.e. thrill, 1998), and 5 items from Sweeney and Soutar (i.e. emotional value, 2001). In the initial set of intellectual value, there were 6 items from Arnould and Price (i.e. personal growth and renewal, 1993), 4 items from Chen (i.e. 3 for access value and 1 for possession value, 2009), 12 items from Novak, Hoffman and Yung (i.e. 4 for challenge and 8 for exploratory behavior, 2000), 6 items from Shoham, Rose and Kahle (i.e. 3 each for curiosity-arousal and adventure, 1998), and 8 items from Unger and Kernan (i.e. 4 each for mastery and arousal, 1983). Altogether, 72 items were obtained.
First, all items were re-written in a first-person, past tense form because both emotional value and intellectual value are self-experienced value obtained from consumption. Second, redundant items from both the emotional and intellectual value sets were removed. Finally, those items that can not be generalized to
different consumption contexts or were not describing benefits from consumption were also taken out from the list. For examples, the item “This product would make me want to use it” which measures emotional value in Sweeney and Soutar (2001) is a product-related value. The experience-related value proposed in the current study, however, does not necessarily involve a product. Similarly, the item “Surfing the Web to see what’s new is a waste of time” is intended to measure exploratory behavior in Novak, Hoffman and Yung (2000) but it pertains to the attitude toward the behavior of “surfing” for something new rather than describing some value obtained. After this screening, 32 emotional value items and 25 intellectual value items were included in the set for further analysis.
ii. Focus Group A focus group was also engaged to tap the experiential value consumers are getting out of their consumption activities. A group of 8 undergraduate students (50% female) from one university in Hong Kong were recruited to attend a one hour discussion session. Participants were first divided into four groups (i.e. 2 in each group) and each group was given a picture of either a local, non-chained restaurant or an upscale hotel restaurant. They were then asked to imagine themselves going to the respective restaurant and express in turn what value they would obtain from dinning there. The purpose of using the two types of restaurant is to ensure that items generated to characterize experiential value would capture consumption contexts with different price range, patronage frequency, familiarity, and company reputation. Then, participants were asked to respond to the question: “What values do you get from shopping in different contexts (i.e. in street markets or shopping malls)?” Again, each participant was first given time to share their opinions followed by an open discussion. From the focus group, 8 additional items were generated - 2 for emotional value and 6 for intellectual value – and were added to the aforementioned set of items for the next phrase of analysis.
b) Step 2: Item Reduction and Dimensionality of the Scale
Altogether, 65 scale items were gathered from the literature review and focus group (see Table 1). Four judges (including two faculty members and two doctoral students) evaluated the items for representativeness of the scale dimensions. Each judge was provided with a definition of both emotional value and intellectual value. Emotional value was defined as “the utility acquired as a result of a product’s, a service’s or an experience’s ability to arouse feelings or affective states. It reflects the emotional outcome of a person’s interaction with the immediate surroundings, which is an emotive internal experience.” Intellectual value was defined as “the utility acquired as a result of a product’s, a service’s or
© 2017 Global Journals Inc. (US)
21
Globa
l Jo
urna
l of M
anag
emen
t an
d Bu
siness Resea
rch
Volum
e XVII
Issu
e IV
Ver
sion
IYe
ar
()
2017
G
A Tutorial on Scale Development: The Experiential Value Scale
experience’s ability to arouse the exercise of the intellect. This value reflects the cognitive outcome of a person’s interaction with the immediate surroundings, which is a cognitive internal experience.” Judges were asked to categorize each item into one of three groups, namely emotional value, intellectual value, or neither. First, 21 emotional value items and 10 intellectual value items were classified as their intended category by all four judges. These were kept for further analysis. Second, those items (6 for emotional value and 7 for intellectual value) that were agreed on by at least three judges were also retained because this met the acceptable agreement index of 75% (Hinkins 1985). Thus, a total of 44 items, 27 representing emotional value and 17 representing intellectual value, were included and submitted to further pscychometric analyses (see Table 2).
i. Scale Purification with Exploratory Factor Analysis Initial quantitative analyses were conducted to
purify the measures and provide an initial examination of the scale’s psychometric properties. Respondents were undergraduate students in three universities in Hong Kong. They were given one of two versions of the survey in which they were either asked to write a brief description about their most recent theme park visit or their most recent shopping mall visit. Then, they responded to the 44 experiential value items. The objective of the description was to refresh the respondents’ memory about their theme park or shopping experience before assessing the scale items. A total of 384 surveys were collected.
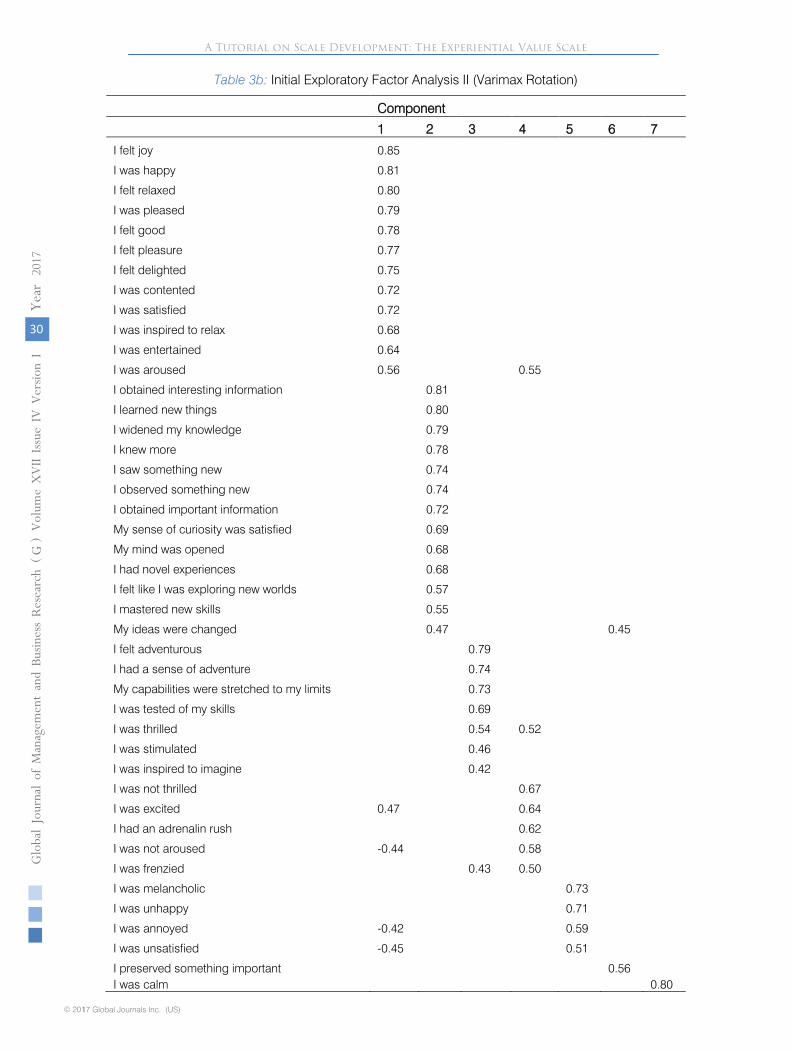
Respondents who missed out any one of the 44 experiential value items were eliminated from the sample. This resulted in a final sample size of 378 of which 184 recalled a theme park experience and 194 a shopping mall (51% female). A factor analysis using Varimax rotation was conducted. The factor analysis revealed a seven-factor solution with eigenvalues greater than 1 (eigenvalues were 14.96, 6.07, 3.55, 1.49, 1.15, 1.02, and 1.01; variance explained = 66.5%, see Table 3a), but only the first three factors were significant based on a scree plot (variance explained = 47.5%). Incidentally, 30 items (68.2%) had a loading greater than .4 on at least one of the three factors. The three-factor analysis on the 30 items revealed two factors that were easy to interpret: Factor 1 (emotional value) and Factor 2 (intellectual value). Factors 3, however, included a mix of emotional and capability-related items (see Table 3b). To assess whether the three-factor solution is stable across groups and contexts, factor analyses were conducted by splitting the sample up according to the following criteria: by gender (male vs. female) and by context (theme park vs. shopping). According to the scree plot tests, a three-factor solution was resulted across groups. A close inspection revealed, however,
that only the first two factors were consistent. Specifically, Factor 1 contained items that tapped emotional value and Factor 2 consisted of those that reflected intellectual value. Factor 3 varied from arousal-related statements such as “I was excited” and “I had an adrenalin rush” among male to capability-related statements such as “My capabilities were stretched” and “I was tested of my skills” among female. Likewise, whereas the theme park visitors sample yielded a Factor 3 that included arousal-related statements such as “I had an adrenalin rush” and “I was frenzied”, the shoppers sample had negative emotional statements such as “I was unhappy” and “I was melancholic” for that factor. The forgoing analyses provided empirical evidence to support the followings: although experiential values are largely context-specific, the two fundamental experiential values would reflect the cognitive and emotive aspects of the interactive outcomes of people and their surroundings; thus, these very components should be evident and persistent across individual differences (i.e. gender) and contexts (i.e. type of entertainment). A direct interpretation of the aforementioned analyses is that the emotional (Factor 1) and intellectual (Factor 2) values, which are consistent across groups, are the fundamental experiential values people obtained from their interaction with the environment in spite of the type of activities or individual differences. On the contrary, a particular activity or individual may encompass distinctive aspects of experiential values, such as capability-related or negative affective-related values, which contribute to the overall assessment of the experience.
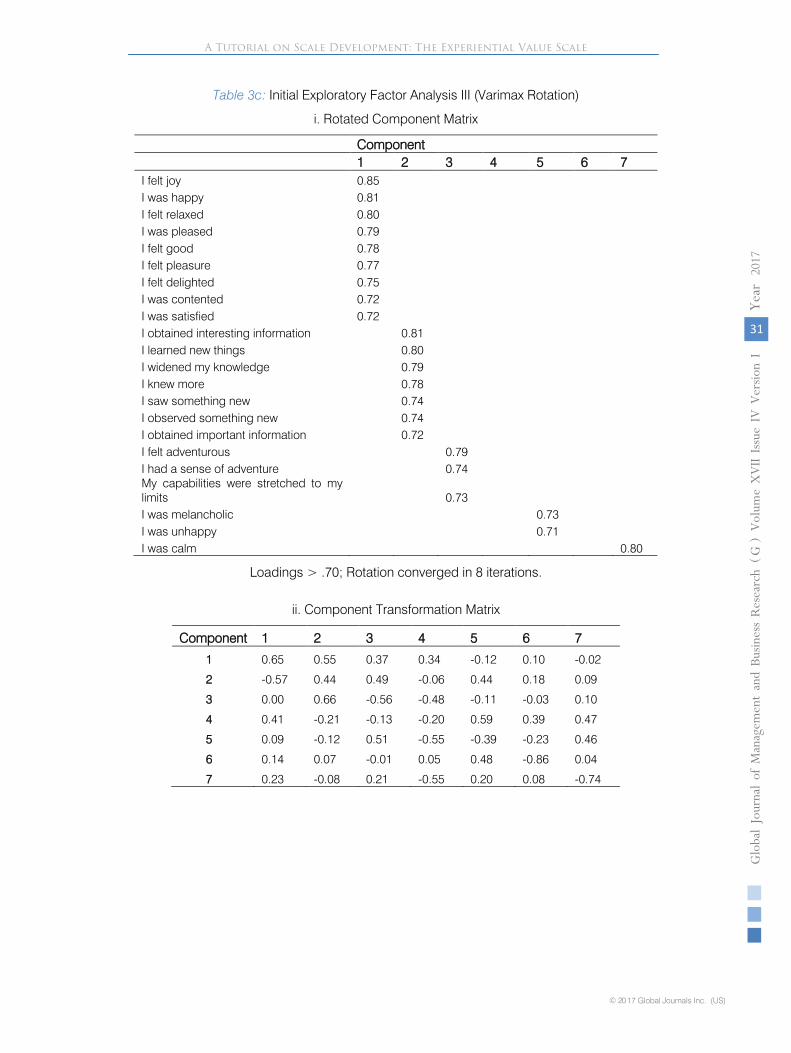
Since the objective of the current study is to identify the components of experiential values that can be generalized across domains, a two-factor structure is adopted for further analysis. Moreover, to further reduce the number of items, a stricter loading criterion of greater than .7 (as opposed to greater than .4) was used to filter items representative of each factor (see Table 3c). Sixteen items fulfilled this criterion for the two factors together. Precisely, nine items characterizing the emotional value (Factor 1) were retained. Likewise, seven items depicting the intellectual value (Factor 2) were kept.
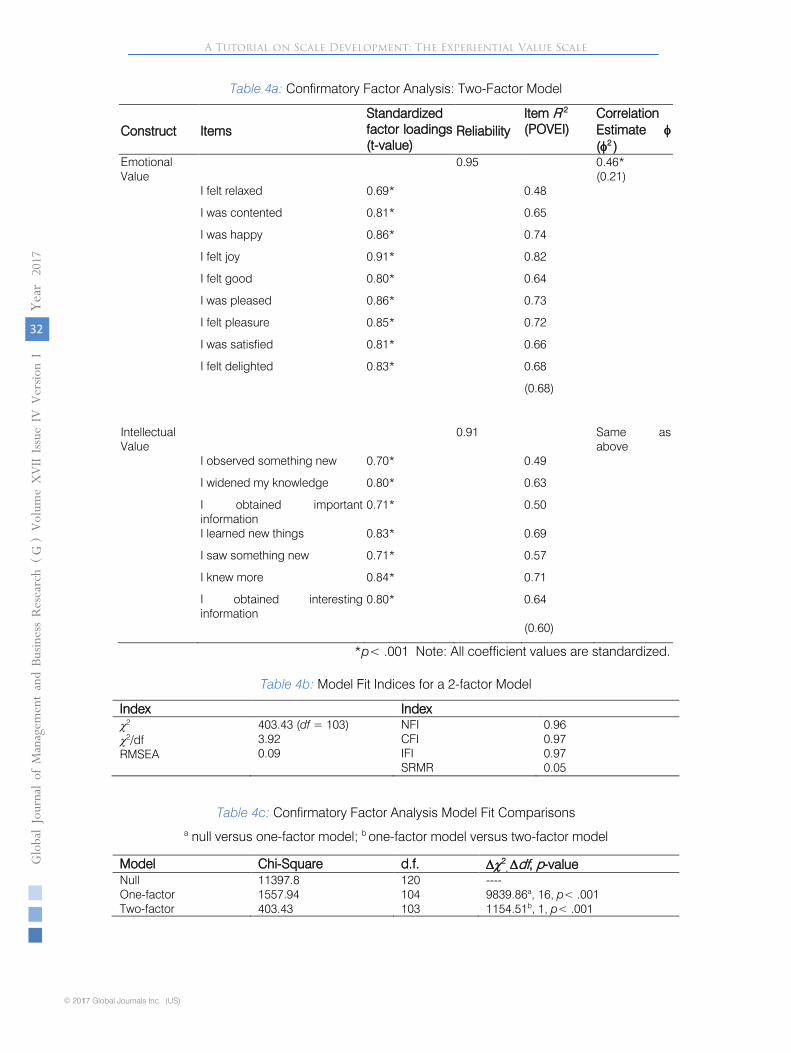
ii. Initial Confirmatory Factor Analysis Next, an initial confirmatory factor analysis (see Table 4a and 4b) using the 16 items in two dimensions produced a chi-square of 403.43 (df = 103, p< .001), a goodness-of-fit statistic (GFI) of .88, a root-mean-square-error of approximation (RMSEA) of .09. Further, the normed fit index (NFI = .96) and comparative fit index (CFI = .97) indicate a significant fit compared to the null model (χ2 = 11397.80, df = 120). A two-factor solution also represented a significant improvement in fit compared to a one-factor solution (χ2 = 1557.94, df =
22
Globa
l Jo
urna
l of M
anag
emen
t an
d Bu
siness Resea
rch
Volum
e XVII
Issu
e IV
Ver
sion
IYe
ar
()
2017
© 2017 Global Journals Inc. (US)1
GA Tutorial on Scale Development: The Experiential Value Scale
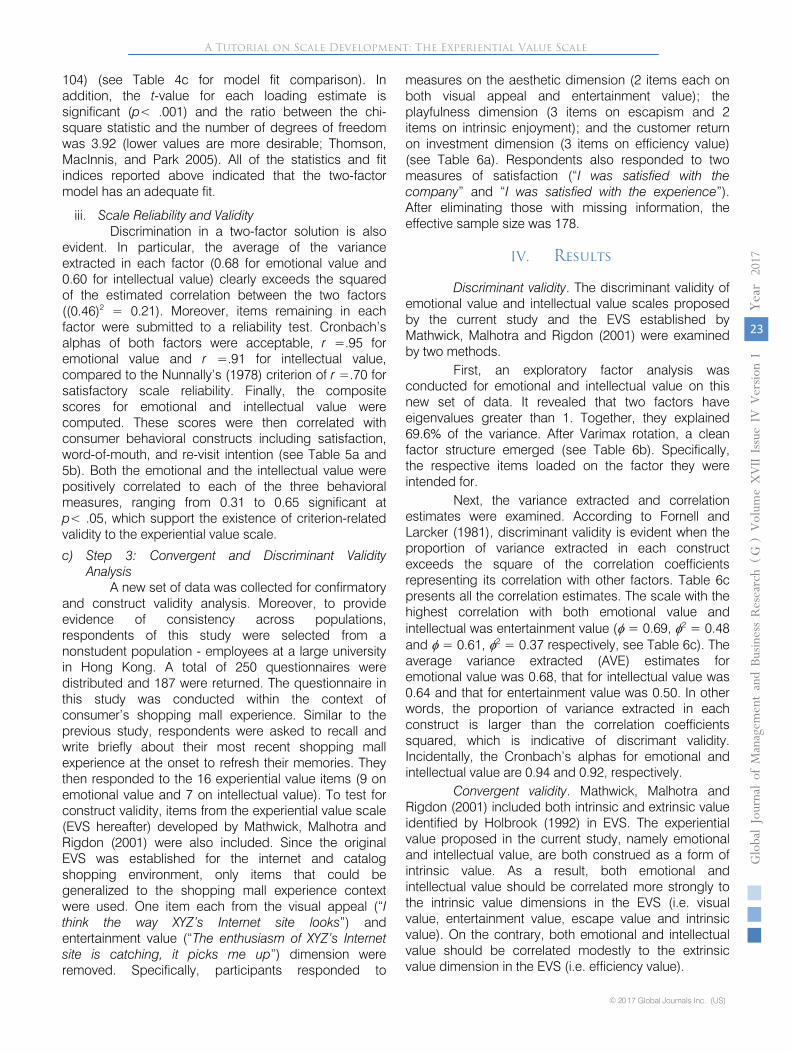
104) (see Table 4c for model fit comparison). In addition, the t-value for each loading estimate is significant (p< .001) and the ratio between the chi-square statistic and the number of degrees of freedom was 3.92 (lower values are more desirable; Thomson, MacInnis, and Park 2005). All of the statistics and fit indices reported above indicated that the two-factor model has an adequate fit.
iii. Scale Reliability and Validity Discrimination in a two-factor solution is also
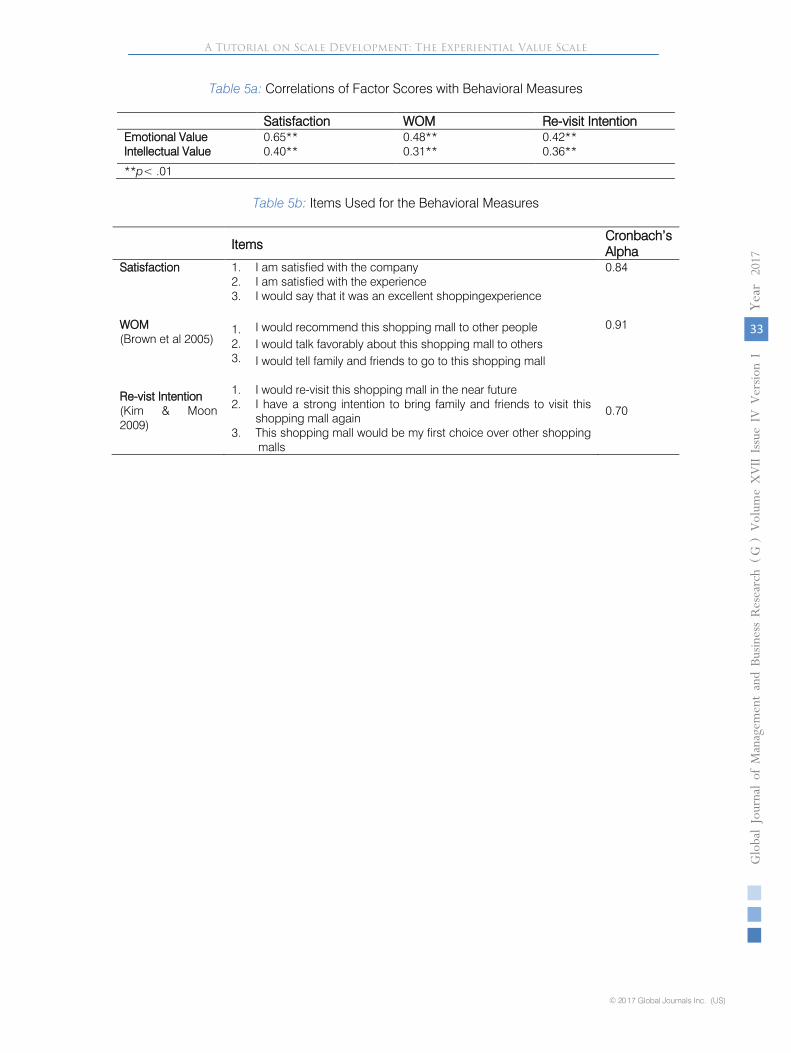
evident. In particular, the average of the variance extracted in each factor (0.68 for emotional value and 0.60 for intellectual value) clearly exceeds the squared of the estimated correlation between the two factors ((0.46)2 = 0.21). Moreover, items remaining in each factor were submitted to a reliability test. Cronbach’s alphas of both factors were acceptable, r =.95 for emotional value and r =.91 for intellectual value, compared to the Nunnally’s (1978) criterion of r =.70 for satisfactory scale reliability. Finally, the composite scores for emotional and intellectual value were computed. These scores were then correlated with consumer behavioral constructs including satisfaction, word-of-mouth, and re-visit intention (see Table 5a and 5b). Both the emotional and the intellectual value were positively correlated to each of the three behavioral measures, ranging from 0.31 to 0.65 significant at p< .05, which support the existence of criterion-related validity to the experiential value scale.
c) Step 3: Convergent and Discriminant Validity Analysis
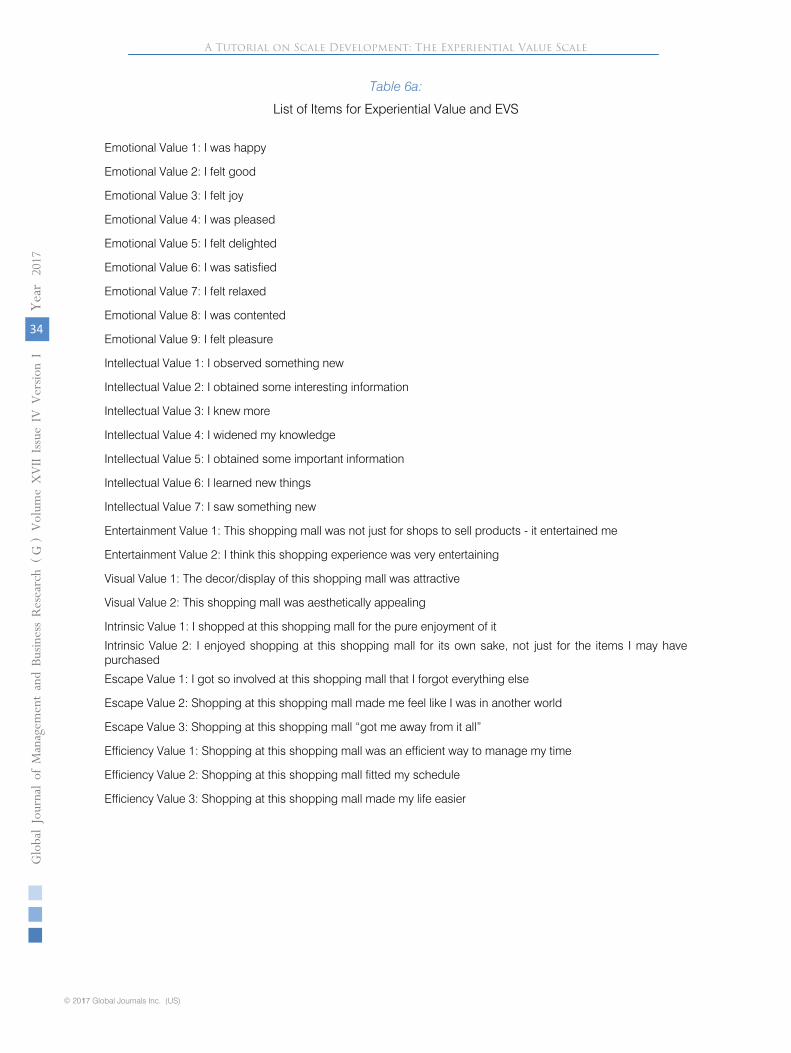
A new set of data was collected for confirmatory and construct validity analysis. Moreover, to provide evidence of consistency across populations, respondents of this study were selected from a nonstudent population - employees at a large university in Hong Kong. A total of 250 questionnaires were distributed and 187 were returned. The questionnaire in this study was conducted within the context of consumer’s shopping mall experience. Similar to the previous study, respondents were asked to recall and write briefly about their most recent shopping mall experience at the onset to refresh their memories. They then responded to the 16 experiential value items (9 on emotional value and 7 on intellectual value). To test for construct validity, items from the experiential value scale (EVS hereafter) developed by Mathwick, Malhotra and Rigdon (2001) were also included. Since the original EVS was established for the internet and catalog shopping environment, only items that could be generalized to the shopping mall experience context were used. One item each from the visual appeal (“I think the way XYZ’s Internet site looks”) and entertainment value (“The enthusiasm of XYZ’s Internet site is catching, it picks me up”) dimension were removed. Specifically, participants responded to
measures on the aesthetic dimension (2 items each on both visual appeal and entertainment value); the playfulness dimension (3 items on escapism and 2 items on intrinsic enjoyment); and the customer return on investment dimension (3 items on efficiency value) (see Table 6a). Respondents also responded to two measures of satisfaction (“I was satisfied with the company” and “I was satisfied with the experience”). After eliminating those with missing information, the effective sample size was 178.
IV. Results
Discriminant validity. The discriminant validity of
emotional value and intellectual value scales proposed by the current study and the EVS established by Mathwick, Malhotra and Rigdon (2001) were examined by two methods.
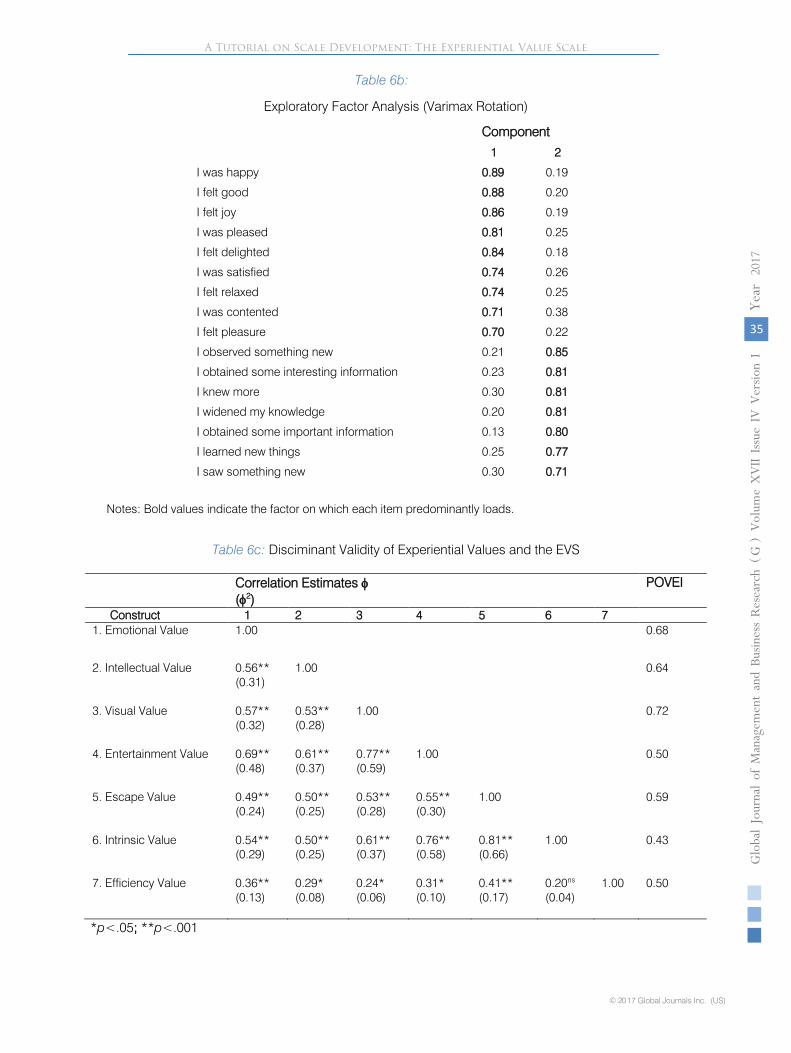
First, an exploratory factor analysis was conducted for emotional and intellectual value on this new set of data. It revealed
that two factors have
eigenvalues greater than 1. Together, they explained 69.6% of the variance. After Varimax rotation, a clean factor structure emerged (see Table 6b). Specifically, the respective items loaded on the factor they were intended for.
Next, the variance extracted and correlation estimates were examined. According to Fornell and Larcker (1981), discriminant validity is evident when the proportion of variance extracted in each construct exceeds the square of the correlation coefficients representing its correlation with other factors. Table 6c presents all the correlation estimates. The scale with the highest correlation with both emotional value and intellectual was entertainment value (φ
= 0.69, φ2
= 0.48
and φ = 0.61, φ2
= 0.37 respectively, see Table 6c). The
average variance extracted (AVE) estimates for emotional value was 0.68, that for intellectual value was 0.64 and that for entertainment value was 0.50. In other words, the proportion of variance extracted in each construct is larger than the correlation coefficients squared, which is indicative of discrimant validity. Incidentally, the Cronbach’s alphas for emotional and intellectual value are 0.94 and 0.92, respectively.
Convergent validity. Mathwick, Malhotra and
Rigdon (2001) included both intrinsic and extrinsic value identified by Holbrook (1992) in EVS. The experiential value proposed in the current study, namely emotional and intellectual value, are both construed as a form of intrinsic value. As a result, both emotional and intellectual value should be correlated more strongly to the intrinsic value dimensions in the EVS (i.e. visual value, entertainment value, escape value and intrinsic value). On the contrary, both emotional and intellectual value should be
correlated modestly to the extrinsic value dimension in the EVS (i.e. efficiency value).
© 2017 Global Journals Inc. (US)
23
Globa
l Jo
urna
l of M
anag
emen
t an
d Bu
siness Resea
rch
Volum
e XVII
Issu
e IV
Ver
sion
IYe
ar
()
2017
G
A Tutorial on Scale Development: The Experiential Value Scale
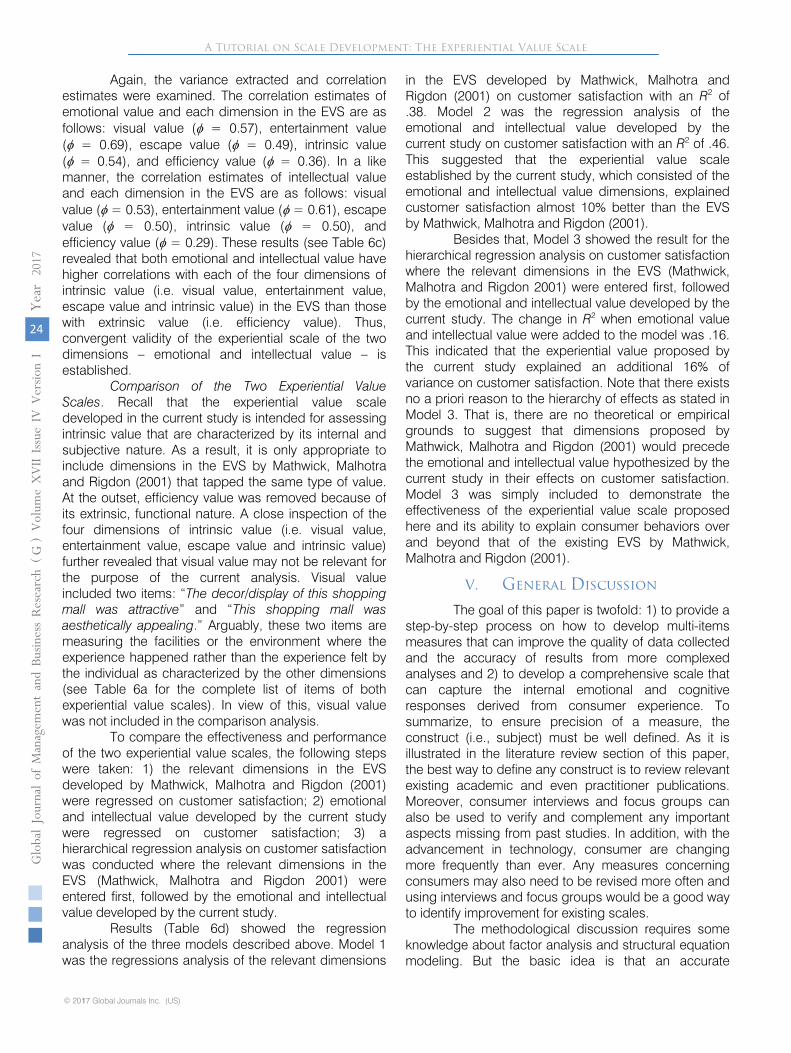
Again, the variance extracted and correlation estimates were examined. The correlation estimates of emotional value and each dimension in the EVS are as follows: visual value (φ = 0.57), entertainment value (φ = 0.69), escape value (φ = 0.49), intrinsic value (φ = 0.54), and efficiency value (φ = 0.36). In a like manner, the correlation estimates of intellectual value and each dimension in the EVS are as follows: visual value (φ = 0.53), entertainment value (φ = 0.61), escape value (φ = 0.50), intrinsic value (φ = 0.50), and efficiency value (φ = 0.29). These results (see Table 6c) revealed that both emotional and intellectual value have higher correlations with each of the four dimensions of intrinsic value (i.e. visual value, entertainment value, escape value and intrinsic value) in the EVS than those with extrinsic value (i.e. efficiency value). Thus, convergent validity of the experiential scale of the two dimensions – emotional and intellectual value – is established. Comparison of the Two Experiential Value Scales. Recall that the experiential value scale developed in the current study is intended for assessing intrinsic value that are characterized by its internal and subjective nature. As a result, it is only appropriate to include dimensions in the EVS by Mathwick, Malhotra and Rigdon (2001) that tapped the same type of value. At the outset, efficiency value was removed because of its extrinsic, functional nature. A close inspection of the four dimensions of intrinsic value (i.e. visual value, entertainment value, escape value and intrinsic value) further revealed that visual value may not be relevant for the purpose of the current analysis. Visual value included two items: “The decor/display of this shopping mall was attractive” and “This shopping mall was aesthetically appealing.” Arguably, these two items are measuring the facilities or the environment where the experience happened rather than the experience felt by the individual as characterized by the other dimensions (see Table 6a for the complete list of items of both experiential value scales). In view of this, visual value was not included in the comparison analysis. To compare the effectiveness and performance of the two experiential value scales, the following steps were taken: 1) the relevant dimensions in the EVS developed by Mathwick, Malhotra and Rigdon (2001) were regressed on customer satisfaction; 2) emotional and intellectual value developed by the current study were regressed on customer satisfaction; 3) a hierarchical regression analysis on customer satisfaction was conducted where the relevant dimensions in the EVS (Mathwick, Malhotra and Rigdon 2001) were entered first, followed by the emotional and intellectual value developed by the current study. Results (Table 6d) showed the regression analysis of the three models described above. Model 1 was the regressions analysis of the relevant dimensions
in the EVS developed by Mathwick, Malhotra and Rigdon (2001) on customer satisfaction with an R2 of .38. Model 2 was the regression analysis of the emotional and intellectual value developed by the current study on customer satisfaction with an R2 of .46. This suggested that the experiential value scale established by the current study, which consisted of the emotional and intellectual value dimensions, explained customer satisfaction almost 10% better than the EVS by Mathwick, Malhotra and Rigdon (2001).
Besides that, Model 3 showed the result for the hierarchical regression analysis on customer satisfaction where the relevant dimensions in the EVS (Mathwick, Malhotra and Rigdon 2001) were entered first, followed by the emotional and intellectual value developed by the current study. The change in R2 when emotional value and intellectual value were added to the model was .16. This indicated that the experiential value proposed by the current study explained an additional 16% of variance on customer satisfaction. Note that there exists no a priori reason to the hierarchy of effects as stated in Model 3. That is, there are no theoretical or empirical grounds to suggest that dimensions proposed by Mathwick, Malhotra and Rigdon (2001) would precede the emotional and intellectual value hypothesized by the current study in their effects on customer satisfaction. Model 3 was simply included to demonstrate the effectiveness of the experiential value scale proposed here and its ability to explain consumer behaviors over and beyond that of the existing EVS by Mathwick, Malhotra and Rigdon (2001).
V. General Discussion
The goal of this paper is twofold: 1) to provide a step-by-step process on how to develop multi-items measures that can improve the quality of data collected and the accuracy of results from more complexed analyses and 2) to develop a comprehensive scale that can capture the internal emotional and cognitive responses derived from consumer experience. To summarize, to ensure precision of a measure, the construct (i.e., subject) must be well defined. As it is illustrated in the literature review section of this paper, the best way to define any construct is to review relevant existing academic and even practitioner publications. Moreover, consumer interviews and focus groups can also be used to verify and complement any important aspects missing from past studies. In addition, with the advancement in technology, consumer are changing more frequently than ever. Any measures concerning consumers may also need to be revised more often and using interviews and focus groups would be a good way to identify improvement for existing scales. The methodological discussion requires some knowledge about factor analysis and structural equation modeling. But the basic idea is that an accurate
24
Globa
l Jo
urna
l of M
anag
emen
t an
d Bu
siness Resea
rch
Volum
e XVII
Issu
e IV
Ver
sion
IYe
ar
()
2017
© 2017 Global Journals Inc. (US)1
GA Tutorial on Scale Development: The Experiential Value Scale

measurement scale needs to be valid. Internal validity is established by asking different questions that will tap the same (i.e., construct). External validity is achieved by making sure that each set of questions tap distinct subjects. In other words, there should be very little overlap between two different subjects. Finally, to examine the usefulness of measurement scales, the scales must be able to predict outcomes which are important. For example, in business research, customer satisfaction, loyalty, and even market performance are all important outcome measures. If the measurement scale for a subject does not predict these important outcomes, it is also not going to provide anything useful for the company. Finally, the experiential value scale developed in this paper fills a research gap. Extant literature on consumer experience and consumer value has acknowledged that people do not only derive emotional responses but also cognitive ones when they interact with their surroundings. Yet past research which addresses the cognitive aspect of experience have not provided any psychometrically sound measures to empirically examine its effects on key consumer outcomes. The experiential value scale presented in this paper captures both the emotional and cognitive dimensions of value derived from experience and showed that they are related to key consumer outcomes, namely, satisfaction, word-of-mouth, and re-visit intention.
References References Referencias
1. Anderson, J. C., & Gerbing, D. W. (1988), “Structural Equation Modeling in Practice – a Review and Recommended 2-Step Approach,” Psychological Bulletin, 103(3), 411-423.
2. Anderson, James C. and James A. Narus (1984), "A Model of the Distributor's Perspective of Distributor-Manufacturer Working Relationships," Journal of Marketing, 48 (Fall), 62-74.
3. Arnould, Eric J. and Linda L. Price (1993), “River Magic: Extraordinary Experience and the Extended Service Encounter,” Journal of Consumer Research, 20(Jun), 24-45.
4. Badgett, Melody, Maureen Stancik Boyce and Herb Kleinberger (2007), “Turning Shoppers into Advocates,” IBM Institute for Business Value.
5. Belk, Russell, Guliz Ger, and Søren Askegaard (2003), “The Fire of Desire: A Multisited Inquiry intoConsumer Passion,” Journal of Consumer Research, 30 (4), 326-351.
6. Chen, Yu (2009), “Possession and Access: Consumer Desires and Value Perceptions Regarding Contemporary Art Collection and Exhibit Visits,” Journal of Consumer Research, forthcoming.
7. Churchill, Gilbert (1979), “A Paradigm for Developing Better Measures of Marketing Constructs,” Journal of Marketing Research, 16(February), 64-73.
8. Cohen, Joel B. and Chrles S. Areni (1991), “Affect and Consumer Behavior,” in Handbook of Consumer Behavior, ed. Thomas S. Robertson and Harold H. Kassarjian, Englewood Cliffs, NJ: Prentice-Hall, 188-240.
9. Fornell, Claes, and David F. Larcker (1981), “Evaluating Structural Equation Models With Unobservable Variables and Measurement Error,” Journal of Marketing Research, 18(1), 39-40.
10. Guilford, Joy Paul (1956), “The structure of intellect,” Psychological Bulletin, 53, 267-293
11. Havlena, William J. and Morris B. Holbrook (1986), “The Varieties of Consumption Experience: Comparing Two Typologies of Emotion in Consumer Behavior,” Journal of Consumer Research, 13(December), 394-404.
12. Haytko, Diana L. and Julie Baker (2004), “It’s all at the mall: exploring adolescent girls’ experiences,” Journal of Retailing, 80, 67-83.
13. Hinkin, Tim R. (1995), “A Review of Scale Development Practices in the Study of Organizations,” Journal of Management, 21(5), 967-988.
14. Holbrook, Morris B. (1999), “Introduction to Consumer Value,” in Consumer Value: A Framework for Analysis and Research, ed. Morris B. Holbrook, London and New York: Routledge, 1-28.
15. __________(1986), “Emotion in the Consumption Experience: Toward a New Model of the Human Consumer,” in The Role of Affect in Consumer Behavior: Emerging Theories and Applications, ed. Robert A. Peterson et al., Lexington, MA: Heath, 17-52.
16. __________and Elizabeth C. Hirschman (1982), “The Experiential Aspects of Consumption: Consumer Fantasies, Feelings, and Fun,” Journal of Consumer] Research, 9(2), 132-140.
17. Jacoby, Jacob (2002), “Stimulus-Organism-Response Reconsidered: An Evolutionary Step in Modeling (Consumer) Behavior,” Journal of Consumer Psychology, 12(1), 51-58.
18. Joy, Annamma and John F. Sherry, Jr. (2003), “Speaking of Art as Embodied Imagination: A multisensory Approach to Understanding Aesthetic Experience,” Journal of Consumer Research, 30(2), 259-282.
19. Kim, Woo Gon and Yun Ji Moon (2009), “Customers’ Cognitive, Emotional, and Actionable Response to the Servicescape: A Test of the Moderating Effect of the Restaurant Type,” International Journal of Hospitality Management, 28, 144-156.
20. Mathwick, Charla, Naresh Malhotra and Edward Rigdon (2001), “Experiential Value: Conceptua-lization, Measurement and Application in the Catalog and Internet Shopping Environment,” Journal of Retailing, 77, 39-56.
© 2017 Global Journals Inc. (US)
25
Globa
l Jo
urna
l of M
anag
emen
t an
d Bu
siness Resea
rch
Volum
e XVII
Issu
e IV
Ver
sion
IYe
ar
()
2017
G
A Tutorial on Scale Development: The Experiential Value Scale

21. Mehrabian, Albert and James A. Russell (1974), An Approach to Environmental Psychology, Cambridge, MA: MIT Press.
22. Michelli, Joseph (2007), The Starbucks Experience: 5 Principles for Turning Ordinary Into Extraordinary, New York: McGraw Hill.
23. Novak, Thomas P. and Donna L. Hoffman (2009), “The Fit of Thinking Style and Situation: New Measures of Situation-Specific Experiential and Rational Cognition,” Journal of Consumer Research, 36 (1), 56-72.
24. Plutchik, Robert (1980), Emotion: A Psychoevolu-tionary Synthesis, New York: Harper and Row.
25. Richins, Marsha L. (1997), “Measuring Emotions in the Consumption Experience,” Journal of Consumer Research, 24(September), 127-146.
26. Seth, Jagdish N., Bruce I. Newman and Barbara L. Gross (1991), “Why We Buy What We Buy: A Theory of Consumption Values,” Journal of Business Research, 22, 159-170.
27. Shoham, Aviv, Gregory M. Rose, and Lynn R. Kahle (1998), "Marketing of Risky Sports: From Intention to Action," Journal of the Academy of Marketing Science, 26 (Fall), 307-321.
28. Sweeney, Jillian C. and Geoffrey N. Soutar (2001), “Consumer Perceived Value: The Development of a Multiple Item Scale,” Journal of Retailing, 77, 203-220.
29. Thomson, Matthew, Deborah J. MacInnis, and C. Whan Park (2005), “The Ties That Bind: Measuring the Strength of Consumers’ Emotional Attachments to Brands,” Journal of Consumer Psychology, 15 (1), 77–91.
30. Unger, Lynette S. and Jerome B. Kernan (1983), “On the Meaning of Leisure: An Investigation of Some Determinants of the Subjective Experience,”Journal of Consumer Research, 9 (March), 381-392.
31. Verhoef, Peter C., Katherine N. Lemonb, A. Parasuraman, Anne Roggeveen, Michael Tsiros, and Leonard A. Schlesinger (2009), “Customer Experience Creation: Determinants, Dynamics and Management Strategies,” Journal of Retailing, 85(1), 31-41.
26
Globa
l Jo
urna
l of M
anag
emen
t an
d Bu
siness Resea
rch
Volum
e XVII
Issu
e IV
Ver
sion
IYe
ar
()
2017
© 2017 Global Journals Inc. (US)1
GA Tutorial on Scale Development: The Experiential Value Scale

Table 1: List of Initial Scale Items Generated and Their Origins
Adopted from Construct (No. of Items) Item Emotional Value (34) Chen (2009) Access Value (1):
I was inspired to relax
Havlena & Holbrook (1986)
Pleasure (8): Arousal (8): Dominance (8):
I was unhappy I was happy I was melancholic I was contented I was annoyed I was pleased I was unsatisfied I was satisfied I was sluggish I was frenzied I was calm I was excited I was relaxed I was stimulated I was unaroused I was aroused I was controlled I was controlling I was guided I was autonomous I was influenced I was influential I was submissive I was dominant
Mathwick, Malhotra & Rigdon (2001)
Entertainment Value (1)
I was entertained
Shoham, Rose & Kahle (1998)
Thrill (2): Arousal (1):
I was thrilled I was not thrilled (R) I felt adventurous
Sweeney & Soutar (2001) Emotional Value (3): I felt relaxed I felt good I felt pleasure
Focus Group (2) I felt delighted I felt joy
© 2017 Global Journals Inc. (US)
27
Globa
l Jo
urna
l of M
anag
emen
t an
d Bu
siness Resea
rch
Volum
e XVII
Issu
e IV
Ver
sion
IYe
ar
()
2017
G
A Tutorial on Scale Development: The Experiential Value Scale
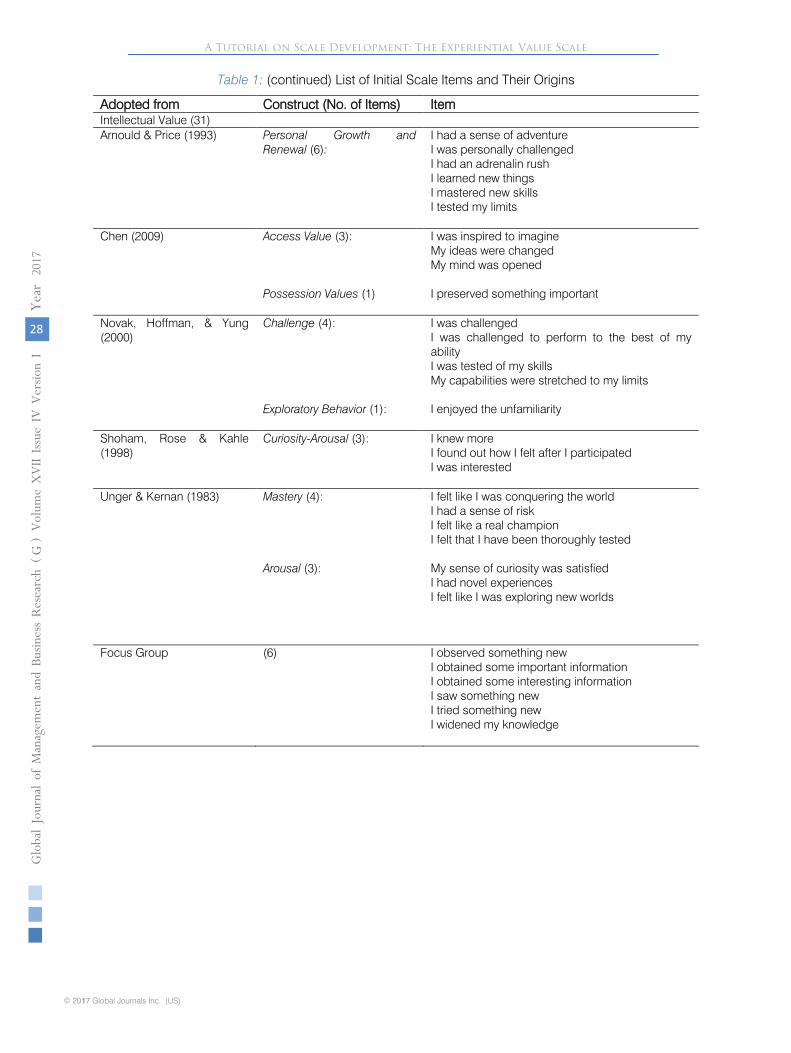
Table 1: (continued) List of Initial Scale Items and Their Origins
Adopted from Construct (No. of Items) Item Intellectual Value (31) Arnould & Price (1993) Personal Growth and
Renewal (6):
I had a sense of adventure I was personally challenged I had an adrenalin rush I learned new things I mastered new skills I tested my limits
Chen (2009) Access Value (3): Possession Values (1)
I was inspired to imagine My ideas were changed My mind was opened I preserved something important
Novak, Hoffman, & Yung (2000)
Challenge (4): Exploratory Behavior (1):
I was challenged I was challenged to perform to the best of my ability I was tested of my skills My capabilities were stretched to my limits I enjoyed the unfamiliarity
Shoham, Rose & Kahle (1998)
Curiosity-Arousal (3):
I knew more I found out how I felt after I participated I was interested
Unger & Kernan (1983) Mastery (4): Arousal (3):
I felt like I was conquering the world I had a sense of risk I felt like a real champion I felt that I have been thoroughly tested My sense of curiosity was satisfied I had novel experiences I felt like I was exploring new worlds
Focus Group (6)
I observed something new I obtained some important information I obtained some interesting information I saw something new I tried something new I widened my knowledge
28
Globa
l Jo
urna
l of M
anag
emen
t an
d Bu
siness Resea
rch
Volum
e XVII
Issu
e IV
Ver
sion
IYe
ar
()
2017
© 2017 Global Journals Inc. (US)1
GA Tutorial on Scale Development: The Experiential Value Scale

Table 2: Items Retained for Exploratory Factor Analysis
Construct (No. of items)
Emotional Value (27) Intellectual Value (17) I felt adventurous I felt like I was exploring new worlds
I felt delighted I had novel experiences
I felt good I knew more
I felt joy I learned new things
I felt pleasure I mastered new skills
I felt relaxed I observed something new
I had a sense of adventure I obtained important information
I had an adrenalin rush I obtained interesting information
I was annoyed I preserved something important
I was aroused I saw something new
I was calm I was inspired to imagine
I was contented I was tested of my skills
I was entertained I widened my knowledge
I was excited My capabilities were stretched to my limits
I was frenzied My ideas were changed
I was happy My mind was opened
I was inspired to relax My sense of curiosity was satisfied
I was melancholic
I was not aroused
I was not thrilled
I was pleased
I was relaxed
I was satisfied
I was stimulated
I was thrilled
I was unhappy
I was unsatisfied
© 2017 Global Journals Inc. (US)
29
Globa
l Jo
urna
l of M
anag
emen
t an
d Bu
siness Resea
rch
Volum
e XVII
Issu
e IV
Ver
sion
IYe
ar
()
2017
G
A Tutorial on Scale Development: The Experiential Value Scale
Table 3a: Initial Exploratory Factor Analysis I (Varimax Rotation) Total Variance Explained
ComponentInitial
EigenvaluesExtraction Sums of Squared Loadings
Rotation Sums of Squared Loadings
Total% of
VarianceCumulative % Total
% of Variance
Cumulative % Total
% of Variance
Cumulative %
1 14.96 33.99 33.99 14.96 33.99 33.99 8.62 19.59 19.59
2 6.07 13.79 47.79 6.07 13.79 47.79 7.37 16.74 36.33
3 3.55 8.06 55.84 3.55 8.06 55.84 4.92 11.18 47.51
4 1.49 3.38 59.22 1.49 3.38 59.22 3.30 7.49 55.00
5 1.16 2.63 61.85 1.16 2.63 61.85 2.41 5.48 60.48
6 1.02 2.32 64.17 1.02 2.32 64.17 1.41 3.21 63.69
7 1.01 2.30 66.47 1.01 2.30 66.47 1.22 2.78 66.47
Extraction Method: Principal Component Analysis.
30
Globa
l Jo
urna
l of M
anag
emen
t an
d Bu
siness Resea
rch
Volum
e XVII
Issu
e IV
Ver
sion
IYe
ar
()
2017
© 2017 Global Journals Inc. (US)1
GA Tutorial on Scale Development: The Experiential Value Scale
Table 3b: Initial Exploratory Factor Analysis II (Varimax Rotation)
Component
1 2 3 4 5 6 7
I felt joy 0.85
I was happy 0.81
I felt relaxed 0.80
I was pleased 0.79
I felt good 0.78
I felt pleasure 0.77
I felt delighted 0.75
I was contented 0.72
I was satisfied 0.72
I was inspired to relax 0.68
I was entertained 0.64
I was aroused 0.56 0.55
I obtained interesting information 0.81
I learned new things 0.80
I widened my knowledge 0.79
I knew more 0.78
I saw something new 0.74
I observed something new 0.74
I obtained important information 0.72
My sense of curiosity was satisfied 0.69
My mind was opened 0.68
I had novel experiences 0.68
I felt like I was exploring new worlds 0.57
I mastered new skills 0.55
My ideas were changed 0.47 0.45
I felt adventurous 0.79
I had a sense of adventure 0.74
My capabilities were stretched to my limits 0.73
I was tested of my skills 0.69
I was thrilled 0.54 0.52
I was stimulated 0.46
I was inspired to imagine 0.42
I was not thrilled 0.67
I was excited 0.47 0.64
I had an adrenalin rush 0.62
I was not aroused -0.44 0.58
I was frenzied 0.43 0.50
I was melancholic 0.73
I was unhappy 0.71
I was annoyed -0.42 0.59
I was unsatisfied -0.45 0.51
I preserved something important 0.56I was calm 0.80
© 2017 Global Journals Inc. (US)
31
Globa
l Jo
urna
l of M
anag
emen
t an
d Bu
siness Resea
rch
Volum
e XVII
Issu
e IV
Ver
sion
IYe
ar
()
2017
G
A Tutorial on Scale Development: The Experiential Value Scale
Table 3c: Initial Exploratory Factor Analysis III (Varimax Rotation)
i. Rotated Component Matrix
Component1 2 3 4 5 6 7
I felt joy 0.85I was happy 0.81I felt relaxed 0.80I was pleased 0.79I felt good 0.78I felt pleasure 0.77I felt delighted 0.75I was contented 0.72I was satisfied 0.72I obtained interesting information 0.81I learned new things 0.80I widened my knowledge 0.79I knew more 0.78I saw something new 0.74I observed something new 0.74I obtained important information 0.72I felt adventurous 0.79I had a sense of adventure 0.74My capabilities were stretched to my limits 0.73I was melancholic 0.73I was unhappy 0.71I was calm 0.80
Loadings > .70; Rotation converged in 8 iterations.
ii. Component Transformation Matrix
Component 1 2 3 4 5 6 7
1 0.65 0.55 0.37 0.34 -0.12 0.10 -0.02
2 -0.57 0.44 0.49 -0.06 0.44 0.18 0.09
3 0.00 0.66 -0.56 -0.48 -0.11 -0.03 0.10
4 0.41 -0.21 -0.13 -0.20 0.59 0.39 0.47
5 0.09 -0.12 0.51 -0.55 -0.39 -0.23 0.46
6 0.14 0.07 -0.01 0.05 0.48 -0.86 0.04
7 0.23 -0.08 0.21 -0.55 0.20 0.08 -0.74
32
Globa
l Jo
urna
l of M
anag
emen
t an
d Bu
siness Resea
rch
Volum
e XVII
Issu
e IV
Ver
sion
IYe
ar
()
2017
© 2017 Global Journals Inc. (US)1
GA Tutorial on Scale Development: The Experiential Value Scale
Table 4a: Confirmatory Factor Analysis: Two-Factor Model
Construct ItemsStandardized factor loadings (t-value)
ReliabilityItem R 2
(POVEI)Correlation Estimate φ(φ2 )
Emotional Value
0.95 0.46*(0.21)
I felt relaxed 0.69* 0.48
I was contented 0.81* 0.65
I was happy 0.86* 0.74
I felt joy 0.91* 0.82
I felt good 0.80* 0.64
I was pleased 0.86* 0.73
I felt pleasure 0.85* 0.72
I was satisfied 0.81* 0.66
I felt delighted 0.83* 0.68
(0.68)
Intellectual Value
0.91 Same as above
I observed something new 0.70* 0.49
I widened my knowledge 0.80* 0.63
I obtained important information
0.71* 0.50
I learned new things 0.83* 0.69
I saw something new 0.71* 0.57
I knew more 0.84* 0.71
I obtained interesting information
0.80* 0.64
(0.60)
*p< .001 Note: All coefficient values are standardized.
Table 4b: Model Fit Indices for a 2-factor Model
Table 4c: Confirmatory Factor Analysis Model Fit Comparisonsa null versus one-factor model; b one-factor model versus two-factor model
Index Indexχ2
χ2/dfRMSEA
403.43 (df = 103)3.920.09
NFICFIIFISRMR
0.960.970.970.05
Model Chi-Square d.f. ∆χ2, ∆df, p-value
NullOne-factorTwo-factor
11397.81557.94403.43
120104103
----9839.86a, 16, p< .0011154.51b, 1, p< .001
© 2017 Global Journals Inc. (US)
33
Globa
l Jo
urna
l of M
anag
emen
t an
d Bu
siness Resea
rch
Volum
e XVII
Issu
e IV
Ver
sion
IYe
ar
()
2017
G
A Tutorial on Scale Development: The Experiential Value Scale
Table 5a: Correlations of Factor Scores with Behavioral Measures
Satisfaction WOM Re-visit IntentionEmotional ValueIntellectual Value
0.65**0.40**
0.48**0.31**
0.42**0.36**
**p< .01
Table 5b: Items Used for the Behavioral Measures
ItemsCronbach’s Alpha
Satisfaction
WOM(Brown et al 2005)
Re-vist Intention(Kim & Moon 2009)
1. I am satisfied with the company2. I am satisfied with the experience3. I would say that it was an excellent shoppingexperience
I would recommend this shopping mall to other peopleI would talk favorably about this shopping mall to othersI would tell family and friends to go to this shopping mall
1. I would re-visit this shopping mall in the near future2. I have a strong intention to bring family and friends to visit this
shopping mall again3. This shopping mall would be my first choice over other shopping
malls
0.84
0.91
0.70
1.2.3.
34
Globa
l Jo
urna
l of M
anag
emen
t an
d Bu
siness Resea
rch
Volum
e XVII
Issu
e IV
Ver
sion
IYe
ar
()
2017
© 2017 Global Journals Inc. (US)1
GA Tutorial on Scale Development: The Experiential Value Scale
Table 6a:
List of Items for Experiential Value and EVS
Emotional Value 1: I was happy
Emotional Value 2: I felt good
Emotional Value 3: I felt joy
Emotional Value 4: I was pleased
Emotional Value 5: I felt delighted
Emotional Value 6: I was satisfied
Emotional Value 7: I felt relaxed
Emotional Value 8: I was contented
Emotional Value 9: I felt pleasure
Intellectual Value 1: I observed something new
Intellectual Value 2: I obtained some interesting information
Intellectual Value 3: I knew more
Intellectual Value 4: I widened my knowledge
Intellectual Value 5: I obtained some important information
Intellectual Value 6: I learned new things
Intellectual Value 7: I saw something new
Entertainment Value 1: This shopping mall was not just for shops to sell products - it entertained me
Entertainment Value 2: I think this shopping experience was very entertaining
Visual Value 1: The decor/display of this shopping mall was attractive
Visual Value 2: This shopping mall was aesthetically appealing
Intrinsic Value 1: I shopped at this shopping mall for the pure enjoyment of it
Intrinsic Value 2: I enjoyed shopping at this shopping mall for its own sake, not just for the items I may have purchased
Escape Value 1: I got so involved at this shopping mall that I forgot everything else
Escape Value 2: Shopping at this shopping mall made me feel like I was in another world
Escape Value 3: Shopping at this shopping mall “got me away from it all”
Efficiency Value 1: Shopping at this shopping mall was an efficient way to manage my time
Efficiency Value 2: Shopping at this shopping mall fitted my schedule
Efficiency Value 3: Shopping at this shopping mall made my life easier
© 2017 Global Journals Inc. (US)
35
Globa
l Jo
urna
l of M
anag
emen
t an
d Bu
siness Resea
rch
Volum
e XVII
Issu
e IV
Ver
sion
IYe
ar
()
2017
G
A Tutorial on Scale Development: The Experiential Value Scale
Exploratory Factor Analysis (Varimax Rotation)
Component
1 2
I was happy 0.89 0.19
I felt good 0.88 0.20
I felt joy 0.86 0.19
I was pleased 0.81 0.25
I felt delighted 0.84 0.18
I was satisfied 0.74 0.26
I felt relaxed 0.74 0.25
I was contented 0.71 0.38
I felt pleasure 0.70 0.22
I observed something new 0.21 0.85
I obtained some interesting information 0.23 0.81
I knew more 0.30 0.81
I widened my knowledge 0.20 0.81
I obtained some important information 0.13 0.80
I learned new things 0.25 0.77
I saw something new 0.30 0.71
Notes: Bold values indicate the factor on which each item predominantly loads.
Table 6b:
Table 6c: Disciminant Validity of Experiential Values and the EVS
Correlation Estimates φ(φ2)
POVEI
Construct 1 2 3 4 5 6 71. Emotional Value 1.00 0.68
2. Intellectual Value 0.56**(0.31)
1.00 0.64
3. Visual Value 0.57**(0.32)
0.53**(0.28)
1.00 0.72
4. Entertainment Value 0.69**(0.48)
0.61**(0.37)
0.77**(0.59)
1.00 0.50
5. Escape Value 0.49**(0.24)
0.50**(0.25)
0.53**(0.28)
0.55**(0.30)
1.00 0.59
6. Intrinsic Value 0.54**(0.29)
0.50**(0.25)
0.61**(0.37)
0.76**(0.58)
0.81**(0.66)
1.00 0.43
7. Efficiency Value 0.36**(0.13)
0.29*(0.08)
0.24*(0.06)
0.31*(0.10)
0.41**(0.17)
0.20ns
(0.04)1.00 0.50
*p<.05; **p<.001

36
Globa
l Jo
urna
l of M
anag
emen
t an
d Bu
siness Resea
rch
Volum
e XVII
Issu
e IV
Ver
sion
IYe
ar
()
2017
© 2017 Global Journals Inc. (US)1
GA Tutorial on Scale Development: The Experiential Value Scale
Table 6d: Comparison of the Two Experiential Value Scales
R 2 ∆ R 2
Model 1EVS (Mathwick, Malhotra & Rigdon 2001)
Model 2Experiential Value (current study)
Model 3: Hierarchical Regression AnalysisStep 1 – EVS (Mathwick, Malhotra & Rigdon 2001)Step 2 – Experiential Value (current study)
.38**
.46**
.38**
.55** .16**
**p<.001