Embed Size (px)
Citation preview
-1-
A Tropospheric Scattering, Non-Line-of-Sight
(NLOS) Wireless Data Communications Link
Final Report
Fall Semester 2009
Prepared to partially fulfill the requirements for ECE401
Department of Electrical and Computer Engineering
Colorado State University
Fort Collins, CO 80523
By:
Jassim Makki
Naif Alhujilan
Rashid Al-Mohannadi
Report Approved: ___________________________________
Project Advisor
___________________________________
Senior Design Coordinator
-2-
Abstract:
Meteors could be used to establish point to point data link. Meteors hit the atmospheric layer
everyday and provide an opportunity to scatter waves and thus establish a communication link.
The task is to establish this link between two points 67 miles apart at 50MHz. 67 miles is
considered to be a short distance for meteor scattering and this project testify if it is possible.
However, the link must support at least 20 signal-to-noise-ratio.
This project started with installing a test bench that repeatedly transmits waves at 50 MHz and
the task is to find if there is any meteors enhancement. This includes using an antenna that has
low angle radiation and high angle radiation that would permit meteor scattering and
tropospheric scattering. Then, the received signal must be analyzed to find out if there is
meteor scattering. If not, the system must be analyzed to find out what is missing to establish
this link.
However, the received signal was low and no varying which means that there is no meteor
scattering. This is due to two reasons. The first reason is that the distance between the two
points is limiting the probability of finding meteors that could be used for scattering. This is
similar to shooting thru a ring that is located far away. However, it is still possible to do it if
more directed antennas with higher gain is used. On the other hand, this experiment showed
us that there is a high noise at 50MHz which resulted in a low SNR=1.5. This noise is mainly
because of man-made noise.
Tropospheric scattering is another option. It can be observed at frequency range of 144 MHz up
to 10 GHz. The path loss increases as the frequency increase, so in this system, we used
simulation software to help us choose the best frequency to operate at.
432 MHz is a good choice. The SNR is not as desired; however, the system can be adjusted to
increase SNR. Studies done and data collected are very promising that this system will operate
successfully.

-3-
Supervisors:
Name: John Steininger
Field: Electrical Engineering
Biography:
Mr. Steininger is an Electrical Engineer, the head of the senior design team, and the one who
own the idea of this project. So every this project is owned and all the information mentioned
in this document to reference to Mr. Steininger.
Contact: E-mal: [email protected]
…………………………………………………………………………………………………………………………………….…………
Academic Advisor:
Name: Professor Ali Pezeshki
Field: Electrical Engineering
Biography:
One of Professor Pezeshki interests’ is wireless communications, since our project has such
subject, he was introduced to it and wanted to be as involved as possible and he was really
helpful.
Contact: [email protected]
……………………………………………………………………………………………………………………………………………………
Academic Advisor:
Name: Professor Rockey Luo
Field: Electrical Engineering
Biography:
Professor Rockey Luo has an interest in communication networks, and he was introduced to
this project for this reason and he was really helpful.
Contact: [email protected]
-4-
Students:
Name: Jassim Makki
Contact: [email protected]
………………………………………………………………………………………………………………………………………………
Name: Naif Alhujilan
Contact: [email protected]
………………………………………………………………………………………………………………………………………………
Name: Rashed Al-Mohannadi
Contact: [email protected]
-5-
TABLE OF CONTENTS
Title ……………………………………………………………………..………………………..……………………………………….. 1
Abstract ……………………………………………………………………………………..……………..………………………....... 2
Supervisor information …………………………………………………………………………..................................... 3
Student information ……..………………………………………………………………………………………………..…....... 4
Table of Contents …………………………………………………………………………………..................................... 5
List of Figures and Tables ………………………………………………………………………………………………..…....... 6
I. Introduction …………………………………………………………………………………………………………………...……. 8
II. Approach …………………………………………………………………………………………………………………………….. 9
III. Transmission station ……………………………………………………………………………………………………….… 10
IV. Receiver station ………………………………………………………………………………………………………………… 14
V. Radio Propagation study ……………………………………………………………………………………………………. 14
VI. AFSK Modems …………………………………………………………………………………………………………………… 15
VII. Results …………………………………………………………………………………………………………………………….. 16
VIII. Options …………………………………………………………………………………………………………………………… 19
IX. Modems ……………………………………………………………………………………………………….………...……….. 20
X. Simulation …………………………………………………………………………………………….…………………………… 23
Results at 432 MHz ………………………………………………….………………………………………………… 23
Results at 1270 MHz ……………………………………………………………..…………………………………… 23
Choice ………………………………………………………………………………………………………………………… 24
XI. Antenna ……………………………………………………….…………………………….………………………..…………… 25
XII. Current Status ………………………………………………………………….……………………………………………… 26
XIII. Recommendation for project continuation …………….………………………………………………………. 27
-6-
IXV. Conclusion ………………………………………………………..……………………………………………………………. 27
References …………………………………………………………………………………………………………………………….. 28
Appendix A – Abbreviations …………………………………………………………………………………………………… 29
Appendix B - Budget ……………………………………………………………………………………………….……………… 30
Appendix C - Acknowledgment ……………………………………………………………………………………………… 31
LIST OF FIGURES
Figure 1: Communication Channels for VHF Meteor Scatter project ………………………………………… 9
Figure 2: Morse code diagram ………………………………………………………………………………………………. 11
Figure 3: Block diagram …………………………………………………………………………………………………………. 12
Figure 4: Flow Chart ………………………………………………………………………………………………………………. 13
Figure 5: Noise vs. Frequency ………………………………………………………………………………………………… 15
Figure 6: Simulation Results …………………………………………………………………………………………………… 16
Figure 7: power Pattern …………………………………………………………………………………………………………. 17
Figure 8: MS & TS …………………………………………………………………………………………………………………… 18
Figure 9: Modems & noise injection ………………………………………………………………………………………. 20
Figure 10: Summer Circuit …………………………………………………………………………………………………….. 21
Figure 11: SNR vs. BER ……………………………………………………………..……………………………………………. 22
-7-
Figure 12: Simulation at 432 MHz ………………………………………………….…………………………………………. 23
Figure 13: Simulation at 1270 MHz …………………………………………………………………………………………….. 24
Figure 14: Yagi Antenna …………………………………………………………………………………………………………. 25
Figure 15: Power pattern of Yagi Antenna …………………………………………………………………….………. 25
Figure 16: audio oscillator ………………………………………………………………………………………….………….. 26
LIST OF TABLES
Table 1: Budget ……………………………………………………………………………………………………………………… 30
-8-
I. Introduction:
In this project we will explore the possibility of building a point to point link with meteor scatter
that would help to develop a communication system that operates at a very high frequency of
fifty mega hertz (50 MHz). This frequency would help study the different propagation modes,
like meteor scattering to improve this wireless communication system. This physical system
would help us as engineers, rather than being students to experience real life obstacles that
field engineers encounter. Furthermore, thanks to our super visor we were able to get sense of
how to deal with real life design approaches and how making mistakes is more desirable to
learn from them.
Meteor scattering is a radio propagation mode that utilizes the ionized trails of meteors where
a short path of communication can be establish between two communication stations that can
ranges up to 2250 kilo meters or about 1400 miles. When meteors enter the upper atmosphere
they burn up creating a trail of ionized particles that can keep on for several seconds, those
particles in the ionized trails can be very dense that can be used to reflect radio waves. The
intensity of the ionized trails determines the frequencies that can be reflected which
sometimes ranges between 20 MHz and 500 MHz .when it comes to how much of a distance a
communication is established, even though the trails exists only for fractions of a second to few
several seconds which indicate a small window of communication, there are some factors that
need to be considered ; which includes the altitudes at where the ionization is shaped , location
of the falling meteor over the earth’s surface , the meteor’s angle of entry to the upper
atmosphere and the location of the communication stations where the channel is desired to be
established.
One of the applications of Meteor Scatter communication is an automated system called
SNOTEL of snowpack where it related to climate sensors. SNOTEL is the acronym for SNOwpack
TELemetry which is defined as network of computers, people, communication devises,
microprocessors and sensors to collect hydro meteorological data. SNOTEL was the motivation
for using meteor scatter in this project. This data that SNOTEL collects can include the
measurements of snow and water content, temperature and accumulated snow or rain. This
application of meteor scattering is the one of the motivations to build such a communication
system.
After introducing the project and some back ground of Meteor scatter, this report will explain
the different approaches of the main goal which is building the link between two
communication stations with our physical system along with our current results.
-9-
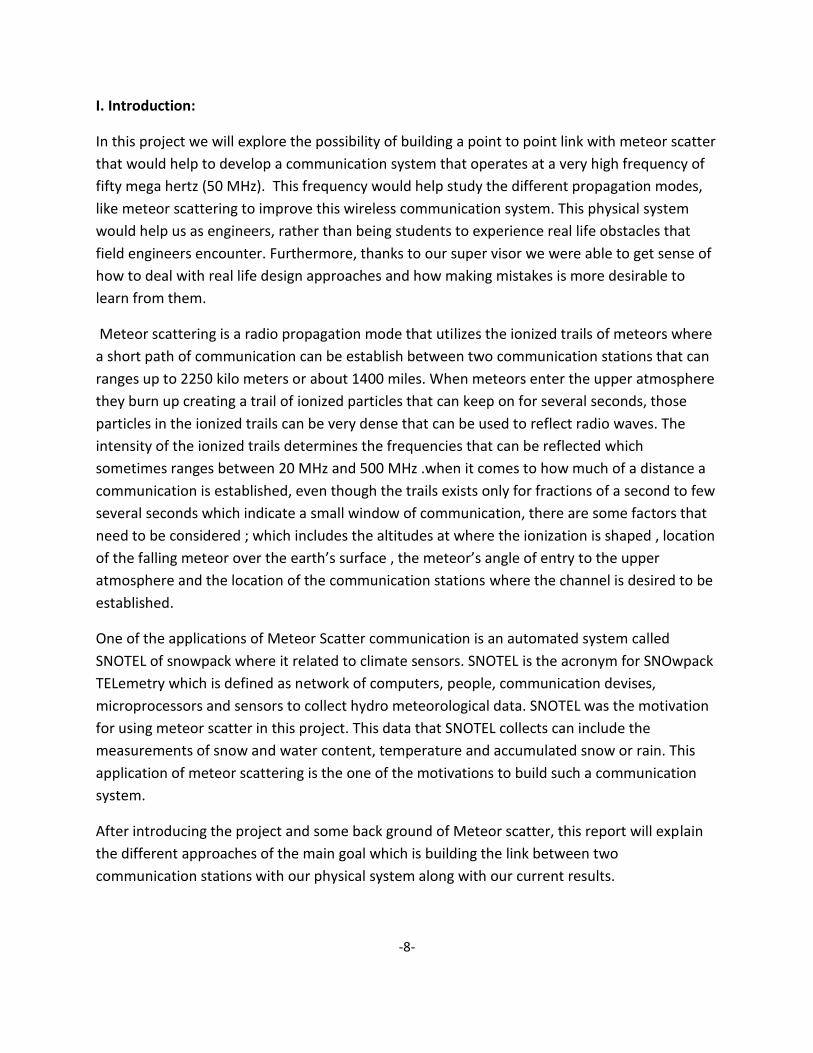
Figure 1 shows a friendly painted picture of the project; where it can be shown the
communication channels using meteor scattering.
Figure 1: Communication Channels for VHF Meteor Scatter project.
II. Approach:
In this project we had some outlined planning on how we can build a system that can act as our
SNOTEL; the approaches can be ordered as follows with a brief enlightenment for each
approach;
First, transmitting a signal from a remote signal to a local place in Fort Collins, this step includes
the following procedures to achieve this objective.
1- Build a test bench that includes the automated station at the remote site where the
transmission takes place.
2- Build a receiver satiation in Fort Collins.
From the previous approach, it can be concluded that in this approach we are building the point
to point communication stations where the desired channel of communication using Meteor
Scatter will take place.
-10-
Then, after building our radio stations; data about the transmitted signal from the remote
station is going to be collected and analyzed to monitor any enhancement caused by meteor
scattering. This approach can be titled as Radio propagation study.
After that, we will be building a mathematical model that would help analysis and make use of
our results of the collected data, mentioned previously.
Finally, we are going to build modems that can communicate using the channel we aimed to
establish. This was a rough sketch of what the report is going to be talking about. The following
is going to be a more detailed description of how those approaches were made along with their
results, what problems that each step had and new decisions that were made beside the ones
that were mentioned here.
III. Transmission station:
To start with, we had to build a transmission station located at John’s cabin NW of Fort Collins.
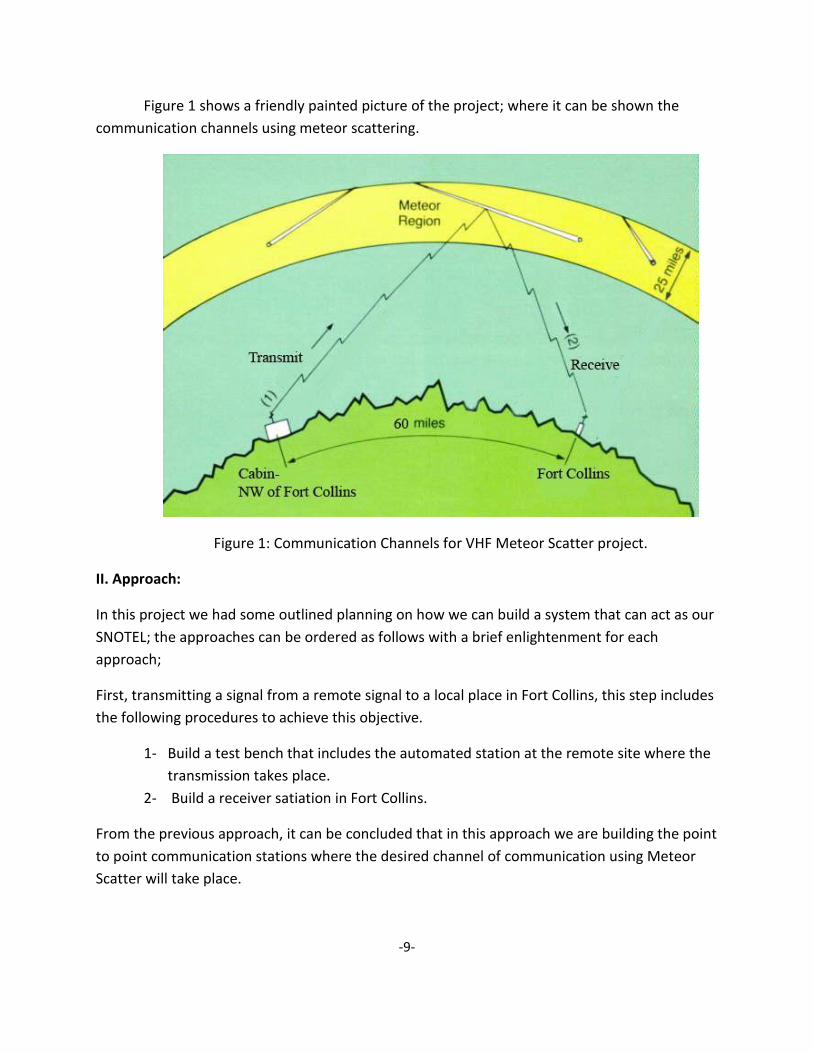
The transmission will be controlled by a micro controller chip that transmits known signal coded
into Morse code. Morse code is a type of character encoding that transmits telegraphic
information using rhythm. Morse code uses a standardized sequence of short and long
elements to represent the letters, numerals, punctuation and special characters of a given
message. The short and long elements can be formed by sounds, marks, or pulses, in on off
keying and are commonly known as "dots" and "dashes". The speed of Morse code is measured
in words per minute (WPM) or characters per minute.
In our project, the dots and dashes are transmitted by on-off keying controlled by the micro
controller and have a speed of about 10 WPM.
-11-
Figure 2: Morse code diagram.
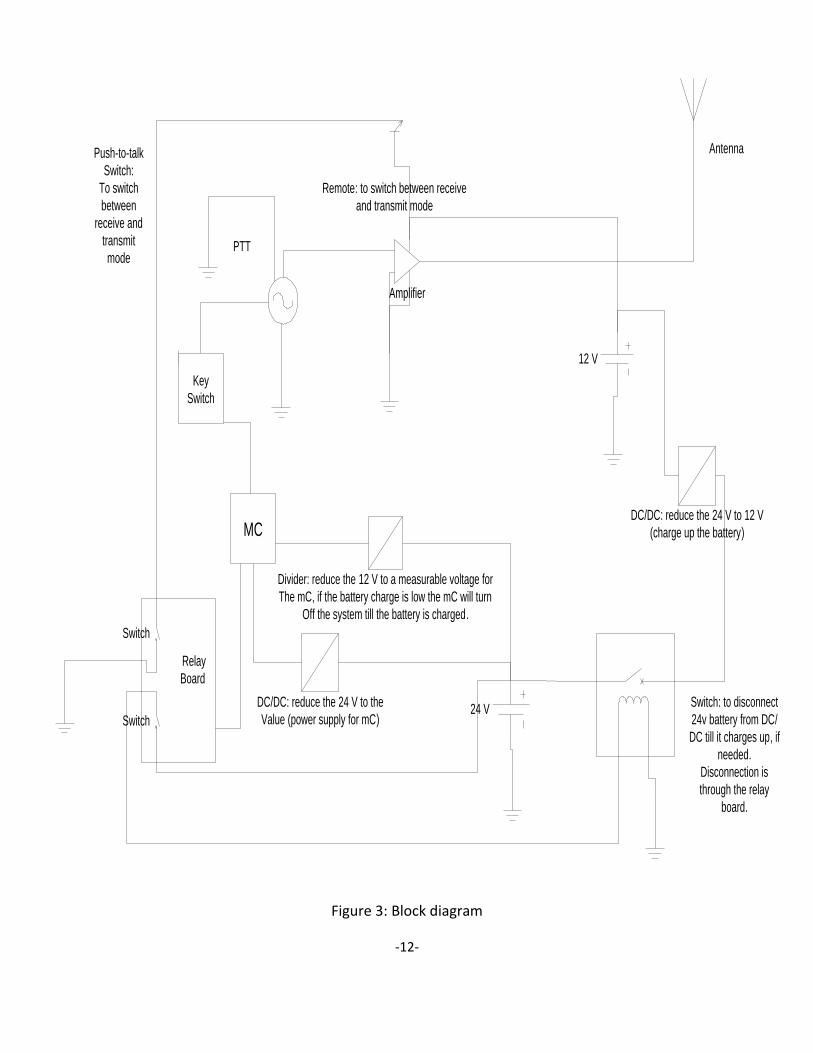
To better understand the transmission station, we shall start with this block diagram.
A DC\DC divider will be used to reduce the 24v, coming from the battery bank, to about 3v to
supply the micro controller chip (MC). MC chip will be monitoring the battery bank while
sending the signal, if the battery bank drop below 22v, MC chip will turn the whole system off
through the relay board till the battery is solar charged again.
The relay board is simply two switches controlled by MC to turn off the amplifier and to
disconnect the battery bank so that no power keeps being consumed.
Both MC chip and key switch will be used to send the Morse coded signal by switching the
transceiver on and off. This signal will be passed through amplifier and then to the antenna.
The amplifier will be turned on and off by MC chip and has a 12v supply coming from the main
battery bank.
-12-
Figure 3: Block diagram
Amplifier
Antenna
12 V
24 VDC/DC: reduce the 24 V to the
Value (power supply for mC)
Divider: reduce the 12 V to a measurable voltage for
The mC, if the battery charge is low the mC will turn
Off the system till the battery is charged.
Key
Switch
MC
Relay
Board
Switch
Switch
DC/DC: reduce the 24 V to 12 V
(charge up the battery)
Remote: to switch between receive
and transmit mode
Switch: to disconnect
24v battery from DC/
DC till it charges up, if
needed.
Disconnection is
through the relay
board.
PTT
Push-to-talk
Switch:
To switch
between
receive and
transmit
mode
-13-
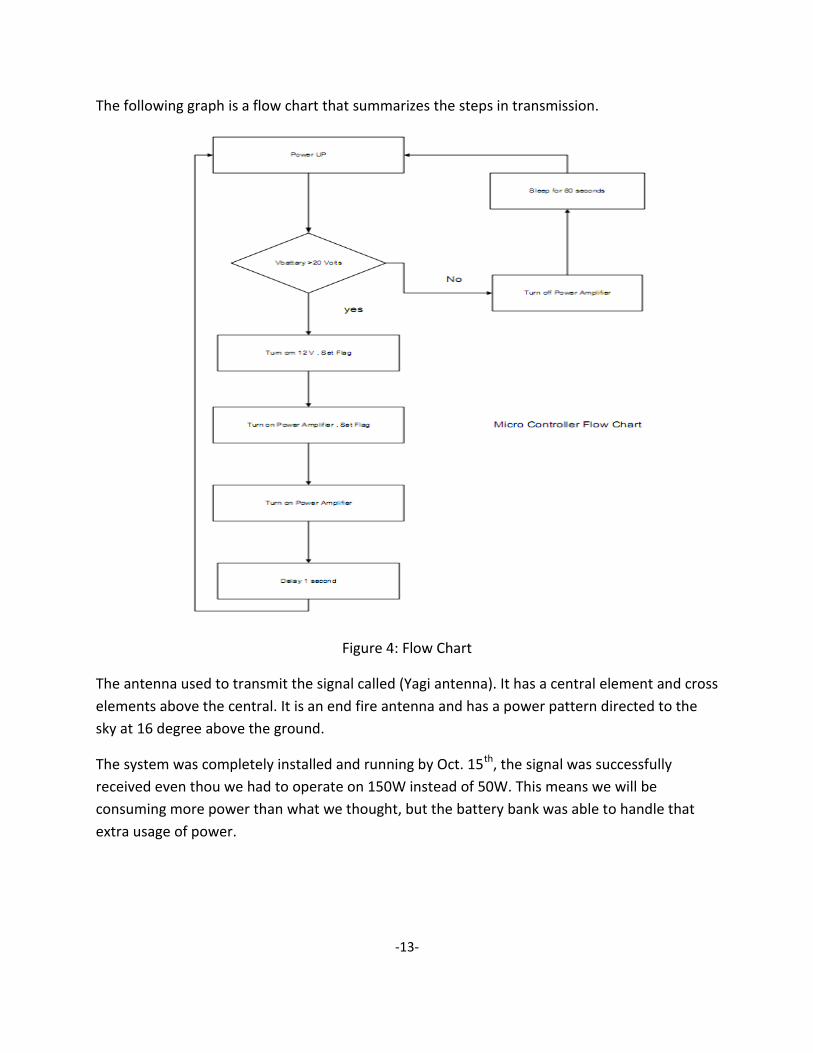
The following graph is a flow chart that summarizes the steps in transmission.
Figure 4: Flow Chart
The antenna used to transmit the signal called (Yagi antenna). It has a central element and cross
elements above the central. It is an end fire antenna and has a power pattern directed to the
sky at 16 degree above the ground.
The system was completely installed and running by Oct. 15th, the signal was successfully
received even thou we had to operate on 150W instead of 50W. This means we will be
consuming more power than what we thought, but the battery bank was able to handle that
extra usage of power.
-14-
IV. Receiver station:
The signal is received here in Fort Collins at John’s house. We will capture the signals
transmitted from the beacon using a commercial, amateur radio transceiver. This radio is a very
sensitive, frequency selective power meter that can be tuned to the beacon transmit frequency
and can measure the received power from the beacon over time. The antenna used to capture
the signal is a loop antenna, which has an omni directional pattern to receive the signal in spite
of the direction it is coming from.
A program written in C- sharp will get the data from the transceiver and save it in a file. These
data will be collected over days and samples will be measured and saved over periods of time
as desirable. Then, this data will be used to study and analyze the channel we are using.
V. Radio Propagation study:
After data was collected using the test bench, they must be analyzed to find out what type of
scattering in the link. At 50 MHz, there are many propagation mechanisms including
tropospheric scattering, meteor scattering and ionospheric scattering. These mechanisms have
different observations which would lead the type of scattering or reflection is used.
Meteor scattering is usually observed by a sudden variation on the received signal. Meteors hit
the top atmospheric layer and it creates an ionized trail forming a dense area that would
reflect. However, this dense area lasts for a few seconds or even a fraction of a second and this
explain why enhancement in received signal lasts for a few seconds. On the other hand,
meteors hit the atmospheric layer every day and the chance of getting more enhancement
increases if the wave propagating travel long distance to get a better probability of reflecting
from multiple meteors. An average distance of meteor scattering is about 2250km and our
system has two points that are 107km apart. This is one of the challenges in this design that this
short distance provides a small opportunity of observing meteors because the transmitting
station will be shooting at a small window creating a small probability of hitting a meteor.
Another type of scattering available at 50MHz is tropospheric scattering. In this mechanism,
waves are reflected at the lowest atmospheric layer called troposphere layer. This layer extends
from the earth’s surface to a height of 7 miles. In this layer, there are inhomogeneous places
called ‘blobs’ which has a different reflection index from air causing waves to be reflected. This
layer has the advantage of being available at all time which would help to test our system if it’s
directed towards this layer. As mentioned above, the troposphere layer exists at the lowest
part of the atmosphere layer which requires a low angle radiation. Experiments have shown
-15-
that the best results when waves are transmitted at low angle and found that for each angle
above in the vertical plane costs 9-12 dB. Tropospheric scattering works from 50 MHz to 10GHz
which is another feature of this mechanism.
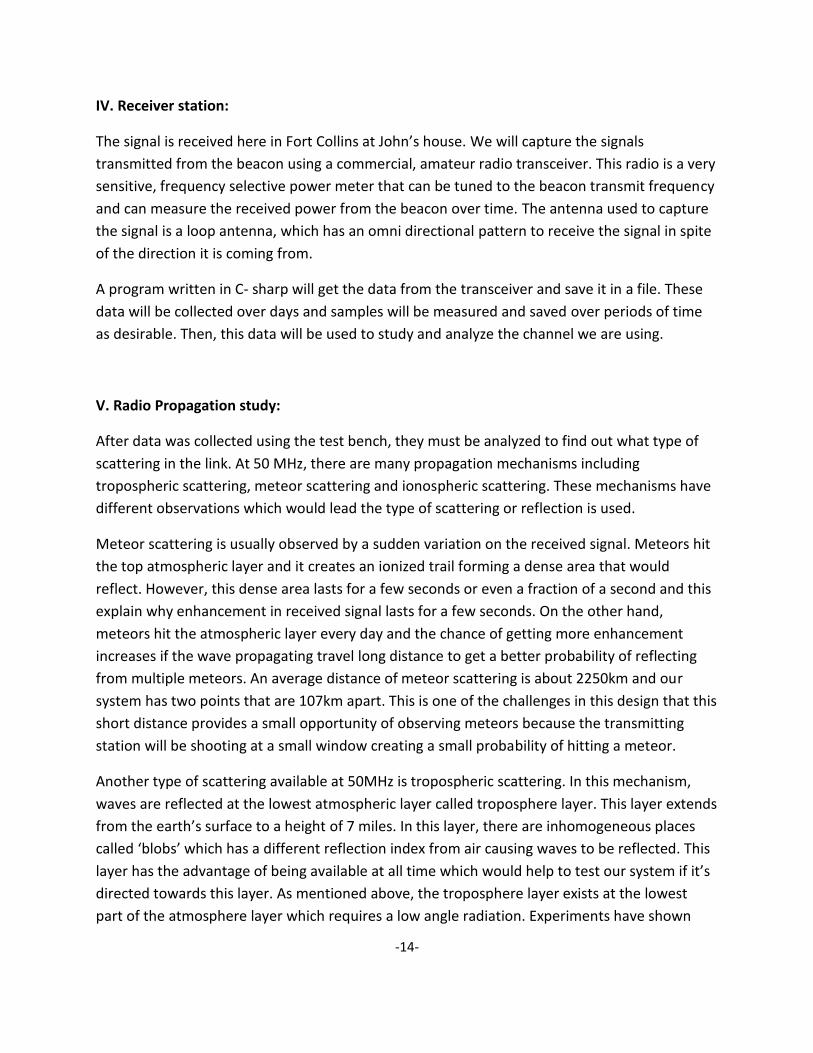
Noise at 50MHz is due to different sources. It includes atmospheric noise and man-made noise.
But as this plot shows man made noise is the dominant. It is at -110dBm at 50 MHz.
Figure 5: Noise vs. Frequency
VI. AFSK Modems:
Once the channel is analyzed and the link is established, modems will complete this link and
make it useful. Modems will be useful to control the receiver station since it can communicate
with digital devices. Modems that will be used are Audio Frequency Shift Keying modems.
These modems will be connected to a radio to receive or transmit information. We built these
modems starting from soldering resistors and capacitors to installing IC chips. These modems
come with full instructions on how to install them from the manufacturer ( www.tnc-x.com ).
However, it is good to build these modems to understand how they function. The modem
consists of an FSK modulator and demodulator that is connected to a microcontroller which
-16-
controls the whole modem and control the flow of data from the modulator to memory and
then to the output using a USB connection. The software that controls the modem is obtained
from the manufacturers and it is editable. However, these modems require at least SNR= 20 dB
to function correctly which adds another constraint to our link.
VII. Results:
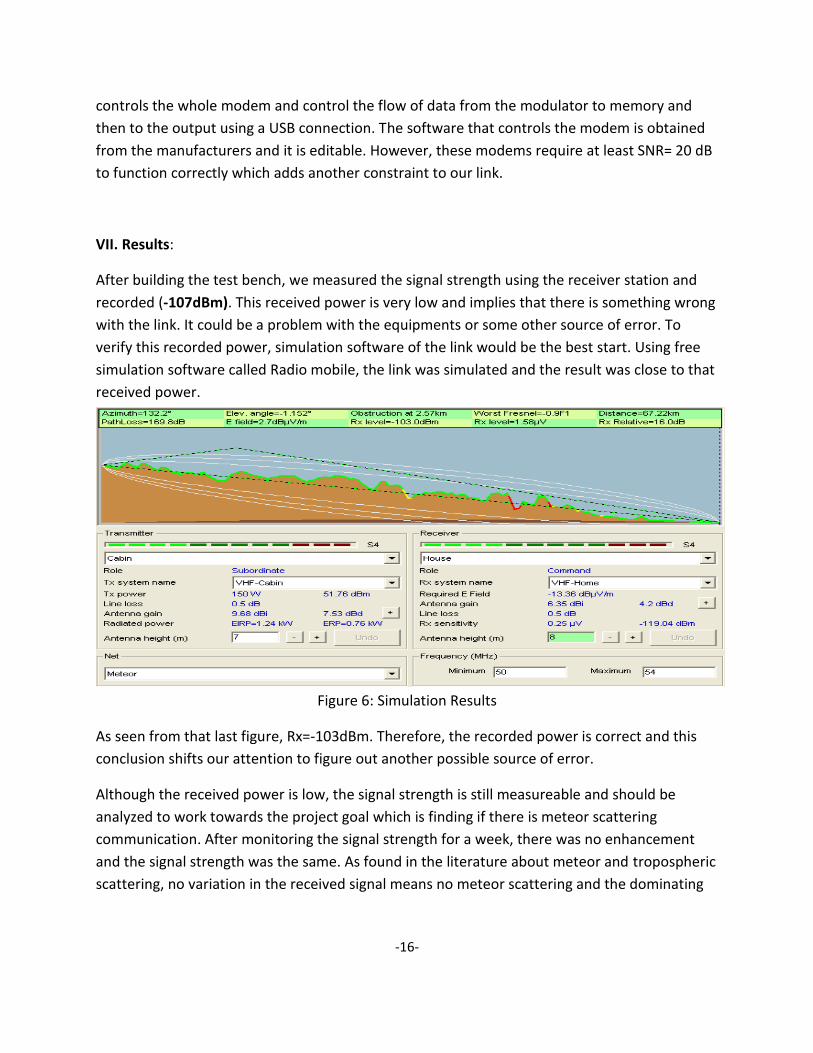
After building the test bench, we measured the signal strength using the receiver station and
recorded (-107dBm). This received power is very low and implies that there is something wrong
with the link. It could be a problem with the equipments or some other source of error. To
verify this recorded power, simulation software of the link would be the best start. Using free
simulation software called Radio mobile, the link was simulated and the result was close to that
received power.
Figure 6: Simulation Results
As seen from that last figure, Rx=-103dBm. Therefore, the recorded power is correct and this
conclusion shifts our attention to figure out another possible source of error.
Although the received power is low, the signal strength is still measureable and should be
analyzed to work towards the project goal which is finding if there is meteor scattering
communication. After monitoring the signal strength for a week, there was no enhancement
and the signal strength was the same. As found in the literature about meteor and tropospheric
scattering, no variation in the received signal means no meteor scattering and the dominating
-17-
scattering is tropospheric scattering. However this could change if we monitor the signal for a
longer time and with different set of equipments that would transmit signals at high angles.
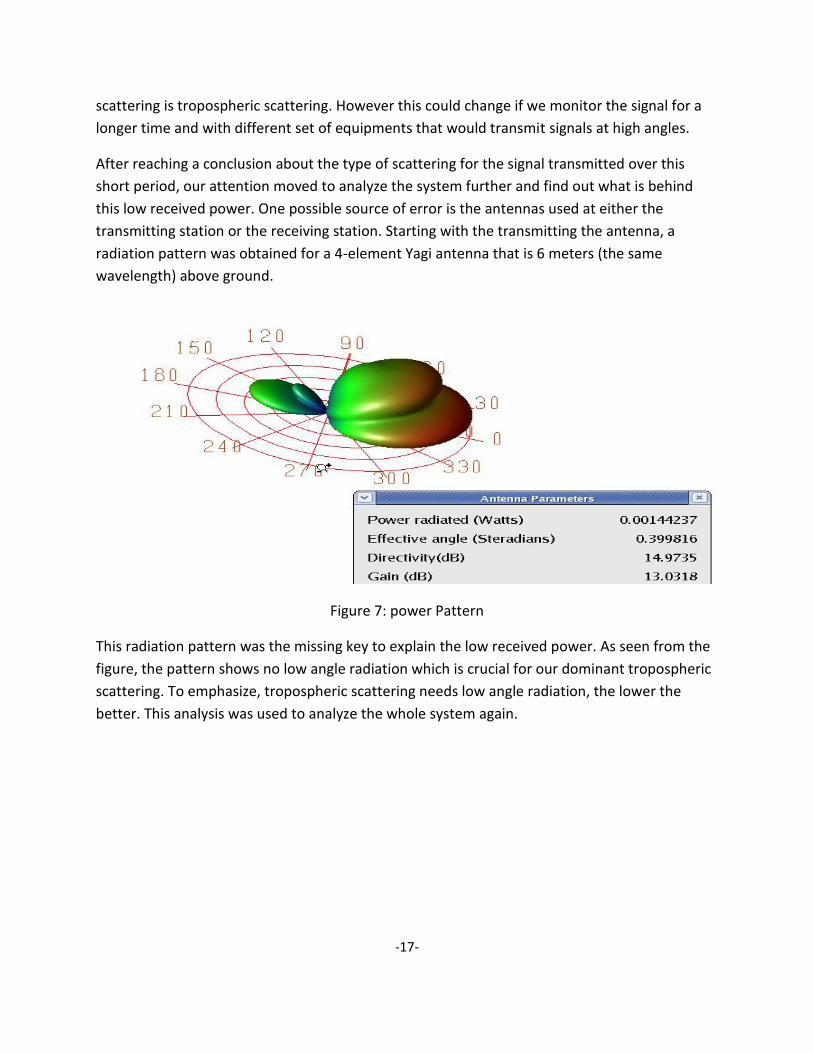
After reaching a conclusion about the type of scattering for the signal transmitted over this
short period, our attention moved to analyze the system further and find out what is behind
this low received power. One possible source of error is the antennas used at either the
transmitting station or the receiving station. Starting with the transmitting the antenna, a
radiation pattern was obtained for a 4-element Yagi antenna that is 6 meters (the same
wavelength) above ground.
Figure 7: power Pattern
This radiation pattern was the missing key to explain the low received power. As seen from the
figure, the pattern shows no low angle radiation which is crucial for our dominant tropospheric
scattering. To emphasize, tropospheric scattering needs low angle radiation, the lower the
better. This analysis was used to analyze the whole system again.
-18-
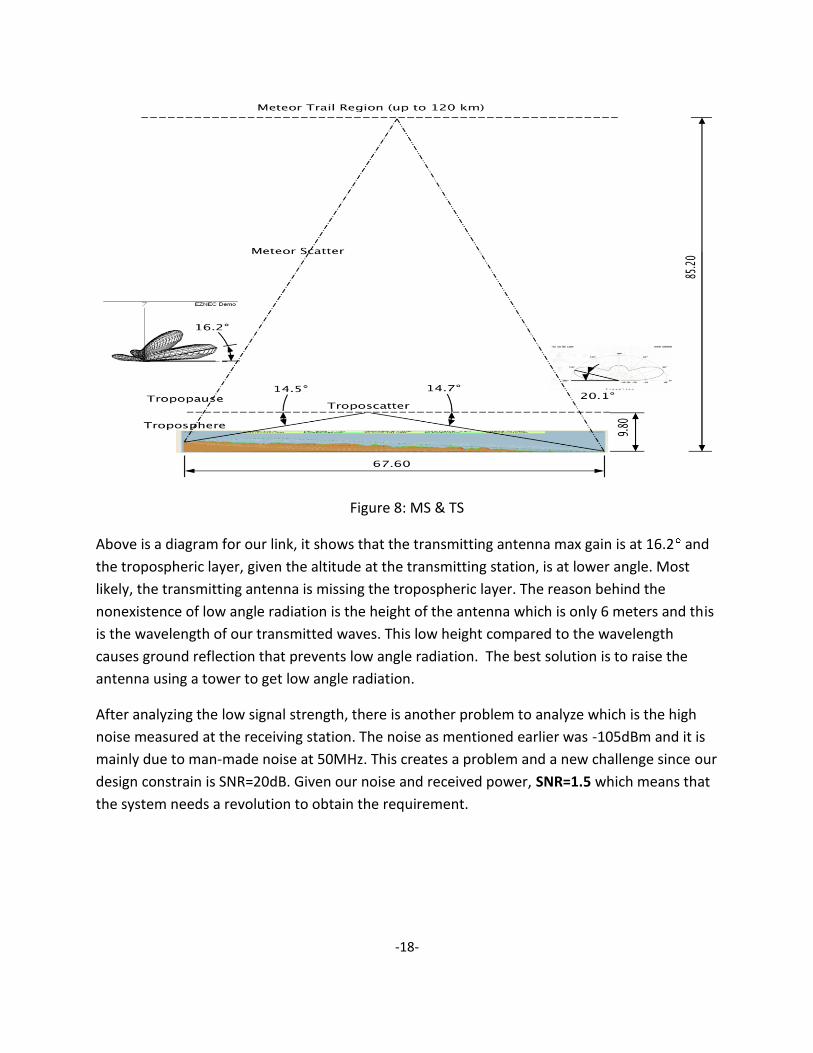
Figure 8: MS & TS
Above is a diagram for our link, it shows that the transmitting antenna max gain is at 16.2 and
the tropospheric layer, given the altitude at the transmitting station, is at lower angle. Most
likely, the transmitting antenna is missing the tropospheric layer. The reason behind the
nonexistence of low angle radiation is the height of the antenna which is only 6 meters and this
is the wavelength of our transmitted waves. This low height compared to the wavelength
causes ground reflection that prevents low angle radiation. The best solution is to raise the
antenna using a tower to get low angle radiation.
After analyzing the low signal strength, there is another problem to analyze which is the high
noise measured at the receiving station. The noise as mentioned earlier was -105dBm and it is
mainly due to man-made noise at 50MHz. This creates a problem and a new challenge since our
design constrain is SNR=20dB. Given our noise and received power, SNR=1.5 which means that
the system needs a revolution to obtain the requirement.
-19-
VIII. Options:
The main problem is manmade noise which badly impacts the SNR. To overcome this problem
we have two options:
The first option is to continue trying with meteor scattering. Since the scattering is dominated
by tropospheric scattering, the angle of radiation of the antenna should be increased to point
skywards so that the radiation can pass the tropospheric without reflecting.
The transmitted power also should be increased to achieve higher SNR, but even with the
increased power, the SNR will not be high enough to be able to use the current modems, so this
mean that the modems will have to be changed as well.
This option will maintain the idea of Meteor Scattering, however, it is not efficient because the
needed transmitted power will not be easily generated.
The second option is to move to tropospheric scattering at higher frequency. Moving to higher
frequency means moving to a region where the manmade noise is much lower than the current
noise. This criteria will help to achieve the desired SNR (20 dB) and since noise is main problem,
we decided to focus on the second option and build our system using the advantages of
troposphere layer.
Tropospheric scattering provides benefits such as:
1- Troposphere layer reflects the signal because of the differences of density and moisture
at that region, so the scattering will be available all the time.
2- With troposhperic scattering, the system can use higher frequency unlike with meteor
scattering and that helps in noise reduction.
3- Tropospheric scattering requires a low radiation angle, and constructing such antenna
with higher gain will be easier and possible with the same equipments and power
supplies we have.
4- The distance between the two ends in our system is about 62 miles and Tropospheric
scattering provides a good communication channel over distances between 70 to 600
miles, while meteor scattering works better with greater distances.
Because of all of these reasons, we decided to move forward in our project and build it at
higher frequency (432 MHz) using tropospheric scattering.
-20-
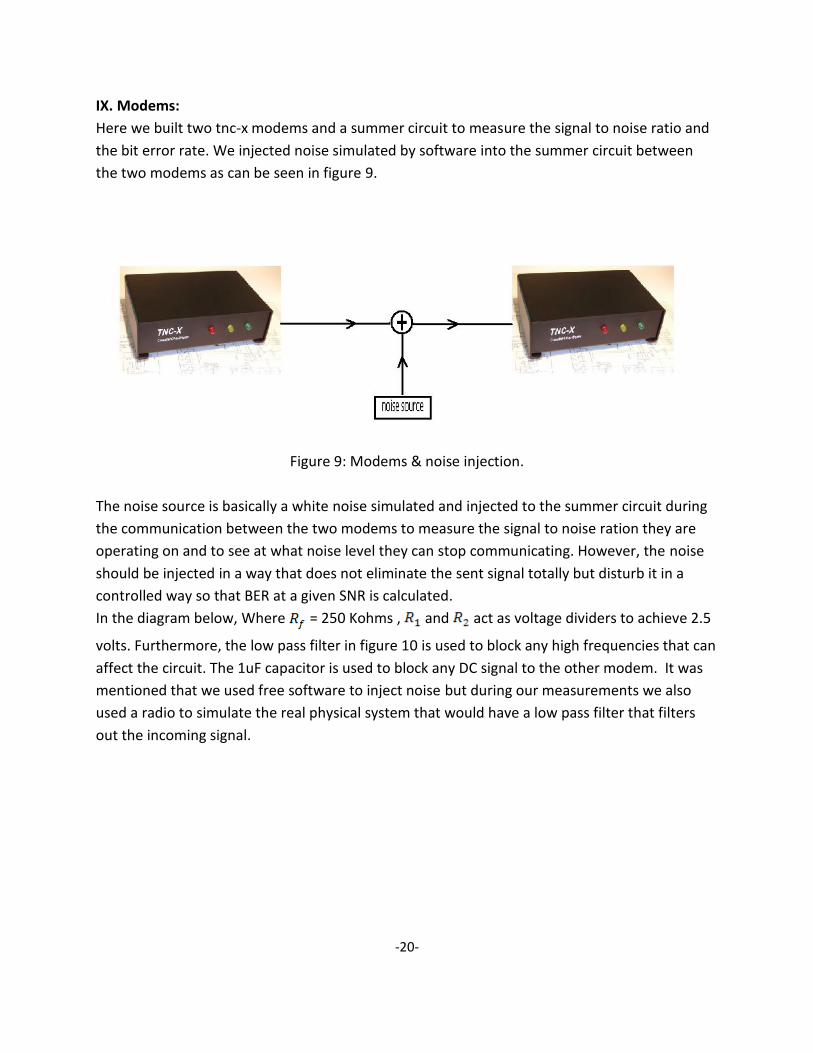
IX. Modems:
Here we built two tnc-x modems and a summer circuit to measure the signal to noise ratio and
the bit error rate. We injected noise simulated by software into the summer circuit between
the two modems as can be seen in figure 9.
Figure 9: Modems & noise injection.
The noise source is basically a white noise simulated and injected to the summer circuit during
the communication between the two modems to measure the signal to noise ration they are
operating on and to see at what noise level they can stop communicating. However, the noise
should be injected in a way that does not eliminate the sent signal totally but disturb it in a
controlled way so that BER at a given SNR is calculated.
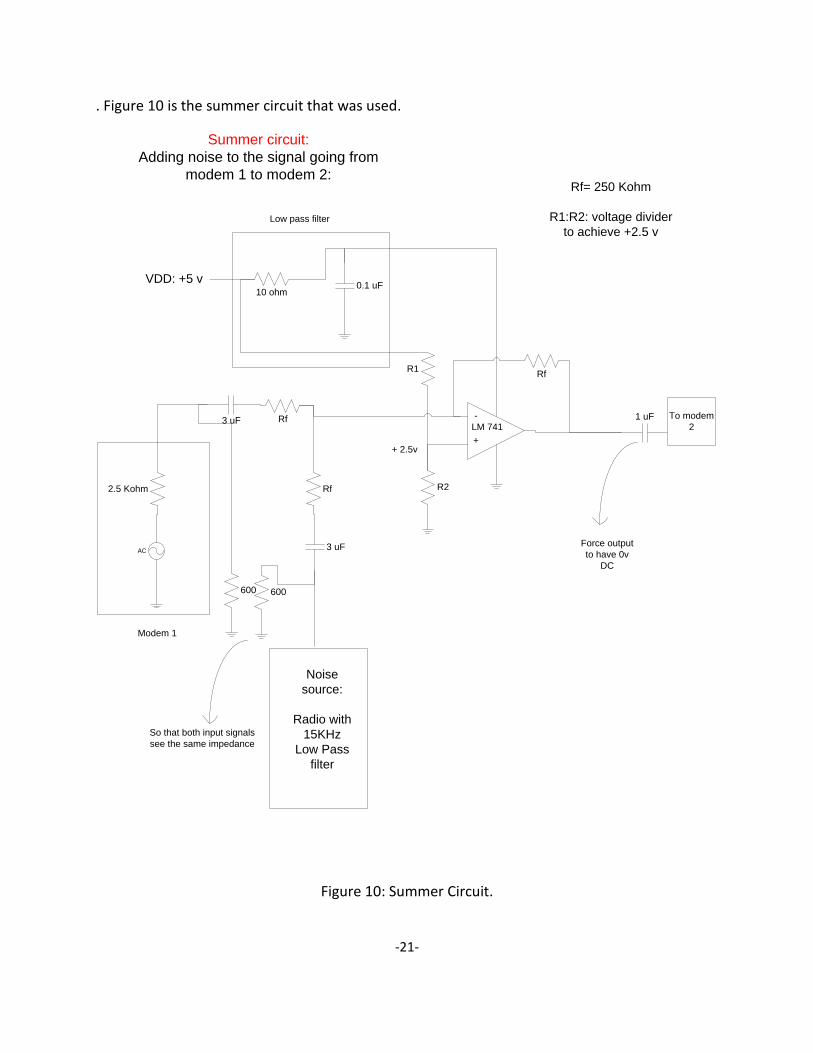
In the diagram below, Where = 250 Kohms , and act as voltage dividers to achieve 2.5
volts. Furthermore, the low pass filter in figure 10 is used to block any high frequencies that can
affect the circuit. The 1uF capacitor is used to block any DC signal to the other modem. It was
mentioned that we used free software to inject noise but during our measurements we also
used a radio to simulate the real physical system that would have a low pass filter that filters
out the incoming signal.
-21-
. Figure 10 is the summer circuit that was used.
AC
2.5 Kohm
10 ohm
RfR1
R2Rf
Rf3 uF
0.1 uF
1 uF
3 uF
Rf= 250 Kohm
R1:R2: voltage divider
to achieve +2.5 v
VDD: +5 v
+
-
Low pass filter
Modem 1
LM 741
To modem
2
Force output
to have 0v
DC
+ 2.5v
Summer circuit:
Adding noise to the signal going from
modem 1 to modem 2:
Noise
source:
Radio with
15KHz
Low Pass
filter
600600
So that both input signals
see the same impedance
Figure 10: Summer Circuit.
-22-
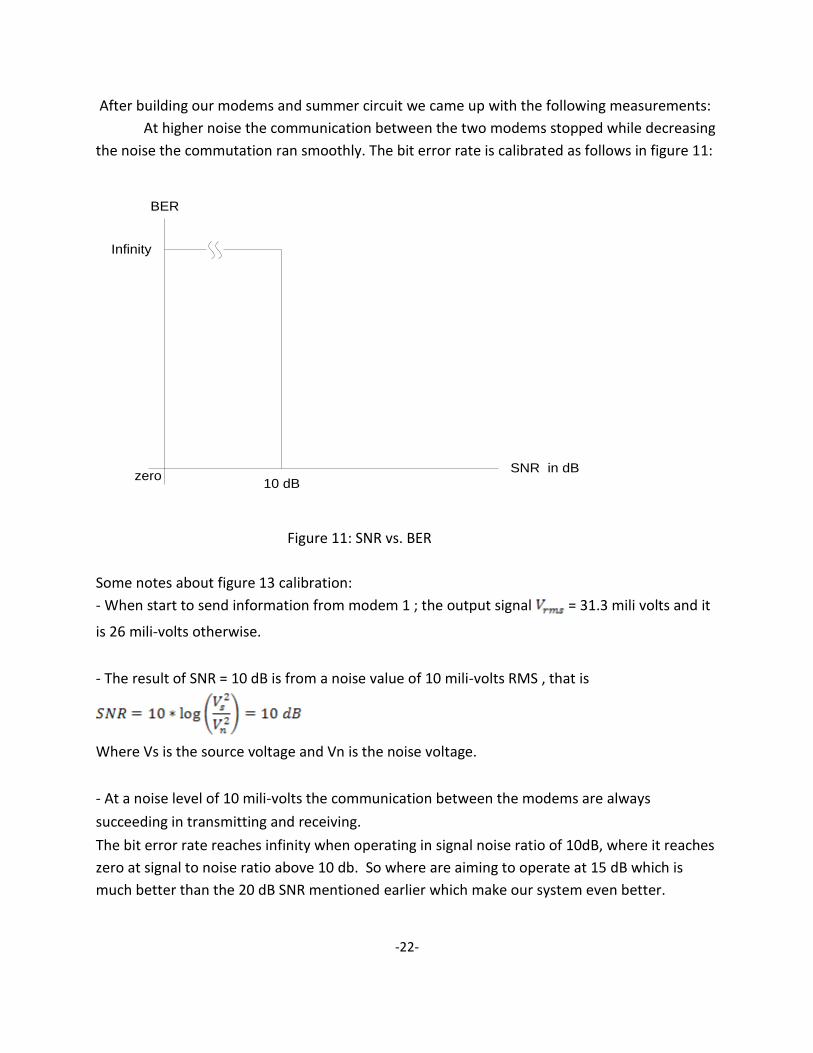
After building our modems and summer circuit we came up with the following measurements:
At higher noise the communication between the two modems stopped while decreasing
the noise the commutation ran smoothly. The bit error rate is calibrated as follows in figure 11:
BER
SNR in dB
10 dB
Infinity
zero
Figure 11: SNR vs. BER
Some notes about figure 13 calibration:
- When start to send information from modem 1 ; the output signal = 31.3 mili volts and it
is 26 mili-volts otherwise.
- The result of SNR = 10 dB is from a noise value of 10 mili-volts RMS , that is
Where Vs is the source voltage and Vn is the noise voltage.
- At a noise level of 10 mili-volts the communication between the modems are always
succeeding in transmitting and receiving.
The bit error rate reaches infinity when operating in signal noise ratio of 10dB, where it reaches
zero at signal to noise ratio above 10 db. So where are aiming to operate at 15 dB which is
much better than the 20 dB SNR mentioned earlier which make our system even better.
-23-
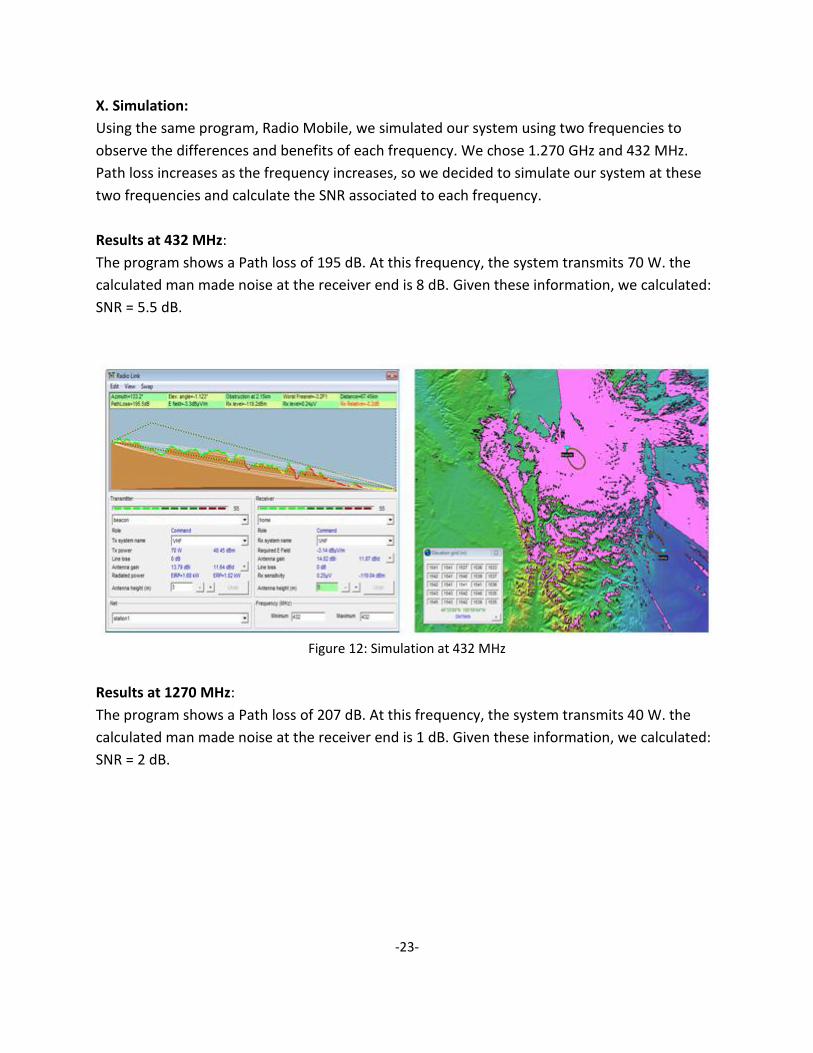
X. Simulation:
Using the same program, Radio Mobile, we simulated our system using two frequencies to
observe the differences and benefits of each frequency. We chose 1.270 GHz and 432 MHz.
Path loss increases as the frequency increases, so we decided to simulate our system at these
two frequencies and calculate the SNR associated to each frequency.
Results at 432 MHz:
The program shows a Path loss of 195 dB. At this frequency, the system transmits 70 W. the
calculated man made noise at the receiver end is 8 dB. Given these information, we calculated:
SNR = 5.5 dB.
Figure 12: Simulation at 432 MHz
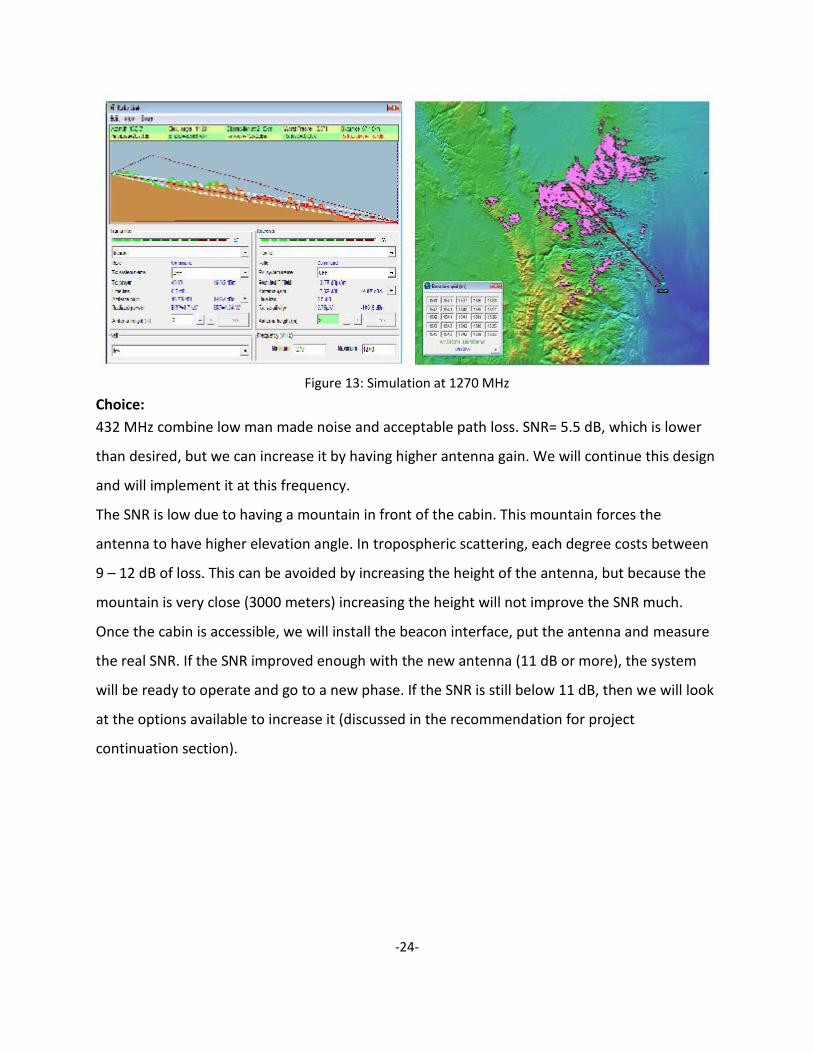
Results at 1270 MHz:
The program shows a Path loss of 207 dB. At this frequency, the system transmits 40 W. the
calculated man made noise at the receiver end is 1 dB. Given these information, we calculated:
SNR = 2 dB.
-24-
Figure 13: Simulation at 1270 MHz
Choice:
432 MHz combine low man made noise and acceptable path loss. SNR= 5.5 dB, which is lower
than desired, but we can increase it by having higher antenna gain. We will continue this design
and will implement it at this frequency.
The SNR is low due to having a mountain in front of the cabin. This mountain forces the
antenna to have higher elevation angle. In tropospheric scattering, each degree costs between
9 – 12 dB of loss. This can be avoided by increasing the height of the antenna, but because the
mountain is very close (3000 meters) increasing the height will not improve the SNR much.
Once the cabin is accessible, we will install the beacon interface, put the antenna and measure
the real SNR. If the SNR improved enough with the new antenna (11 dB or more), the system
will be ready to operate and go to a new phase. If the SNR is still below 11 dB, then we will look
at the options available to increase it (discussed in the recommendation for project
continuation section).
-25-
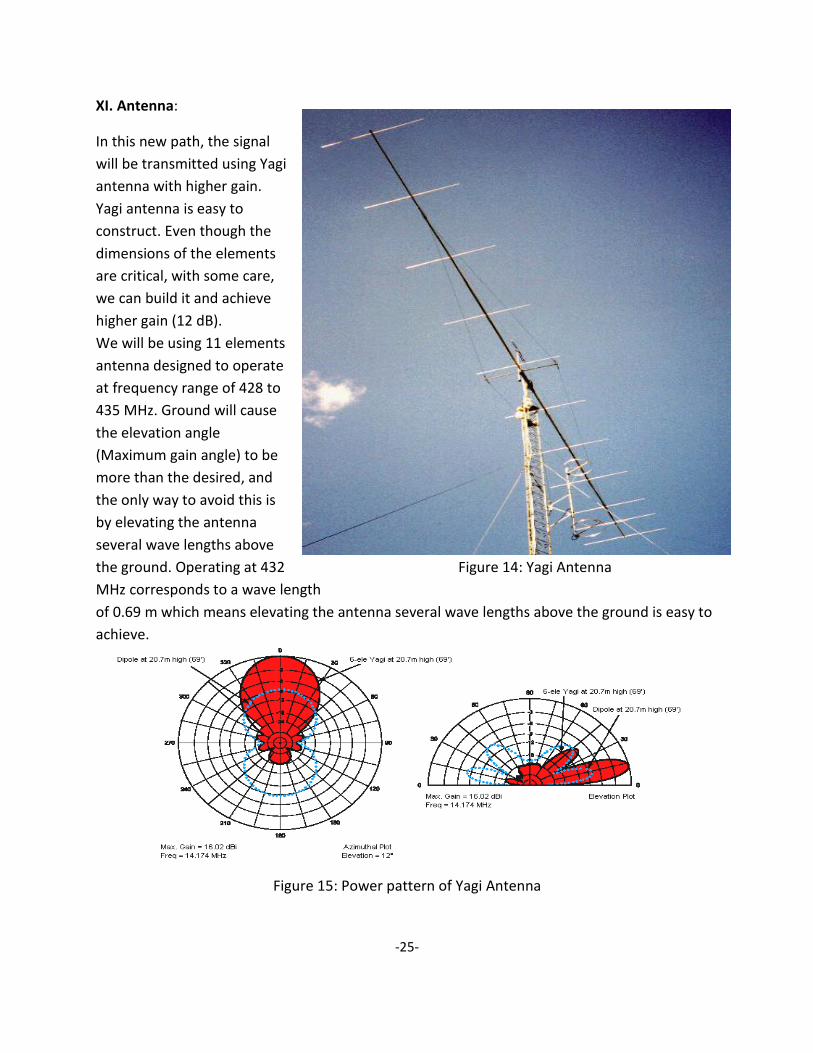
XI. Antenna:
In this new path, the signal
will be transmitted using Yagi
antenna with higher gain.
Yagi antenna is easy to
construct. Even though the
dimensions of the elements
are critical, with some care,
we can build it and achieve
higher gain (12 dB).
We will be using 11 elements
antenna designed to operate
at frequency range of 428 to
435 MHz. Ground will cause
the elevation angle
(Maximum gain angle) to be
more than the desired, and
the only way to avoid this is
by elevating the antenna
several wave lengths above
the ground. Operating at 432 Figure 14: Yagi Antenna
MHz corresponds to a wave length
of 0.69 m which means elevating the antenna several wave lengths above the ground is easy to
achieve.
Figure 15: Power pattern of Yagi Antenna
-26-
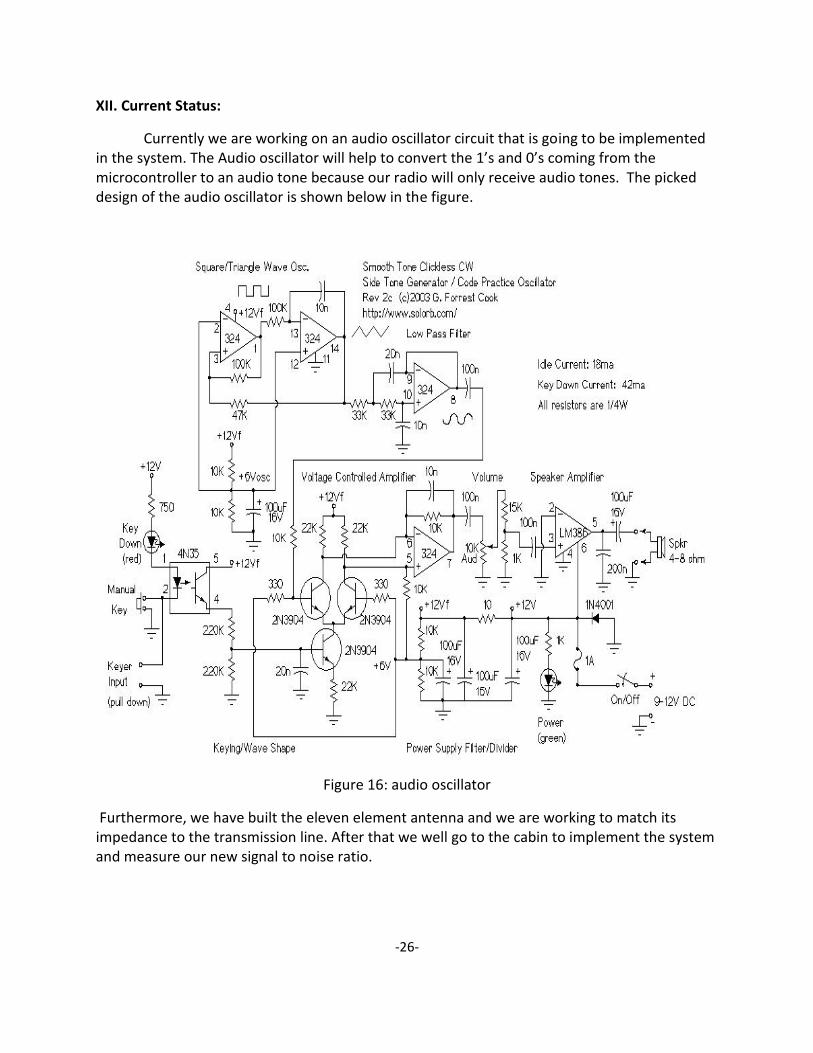
XII. Current Status:
Currently we are working on an audio oscillator circuit that is going to be implemented in the system. The Audio oscillator will help to convert the 1’s and 0’s coming from the microcontroller to an audio tone because our radio will only receive audio tones. The picked design of the audio oscillator is shown below in the figure.
Figure 16: audio oscillator
Furthermore, we have built the eleven element antenna and we are working to match its impedance to the transmission line. After that we well go to the cabin to implement the system and measure our new signal to noise ratio.
-27-
XIII. Recommendation for project continuation:
The simulation result shows that our system achieved 5.5 SNR at 432MHz which is
unsatisfactory for the modems to work. There are many options to continue working on this
project to achieve a better data link.
1. Build an array of antennas at both ends. For each element added in the array, 3
dB is achieved in excess of current SNR.
2. Develop the modems to work at low SNR and then it could be developed to use
one of the coding schemes which could results in doubling SNR. For example, the
modems could be designed to send each bit 2 times which results in doubling the SNR
but the minimum required SNR must be achieved.
3. On the applications side, this data link could be utilized to control the remote
site (cabin). This link could be designed to control the heating system in the cabin and to
control water level on the lake available at that site. Also, it could be used as a
communication link since there is no cellular service at the remote site. This cabin is not
accessible at winter season and most of spring season due to snow. So, this link could be
designed to check the snow level and whether it is accessible.
4. The main obstacle that we faced in this project is the poor location of the cabin
since it is located 3km away from Green Mountain which is on the line-of-sight path. To
overcome this problem, a repeater at the mountain summit would increase SNR by
more than 10 dB. This repeater would make this link as a line of sight path for the short
distance from the cabin to the mountain and then another long line of sight path from
the mountain’s summit to the receiver end in Fort Collins. Also, the long line of sight
path might take advantage of tropospheric scattering since the scatter angle will be
much lower than before.
IXV. Conclusion:
This project is a communication problem that reflects real life engineering experience. We
learned how to identify, solve and approach a problem and we got the opportunity to be part
of this project which we would like to continue next semester to achieve the goal of it.
-28-
REFERENCES
[1] David, H.H. “A new approach to long range communications”. IEEE, Vehicular
Communications, Aug 1961.
[2] Darnell, M. Riley, N.G. Melton, D. “Tropospheric scatter propagation in the low-VHF
band”.IEEE, Antennas and Propagation, 1991.
[3] Hansen, John. “How to build AFSK modems”. www.tnc-x.com.
[4] Joint Technical Advisory Committee. “Radio Transmission By Ionospheric and Tropospheric Scatter”.
IEEE, Proceedings of IRE, 1960.
[5] PolyZou, J. Sassler,M. “Path-Loss Measuring Techniques and Equipment”. IEEE, Communication
Systems, 1960.
[6] Preben-Hansen , Palle . “Everyday VHF, UHF, and SHF propagation 700 km DX anytime using troposcatter.” [April,13 . 2010].
[7] Roos, Andrew. “A Simple 70cm Satellite Antenna”.
www.qsl.net/zs1an/weekend_antennas_4.pdf. 2005
[8] “Smooth Tone Clickless CW Sidetone Generator Electronic Circuit.”
http://www.circuitsarchive.org/index.php/Smooth_Tone_Clickless_CW_Sidetone_Generator,[
April,20.2010].
[9] Willis, Mike. “Propagation Tutorial.” http://www.mike-willis.com/Tutorial/PF9.htm ,
[April, 1.2010].
-29-
Appendix A - Abbreviations:
BER: Bit Error Rate.
MC: Micro Controller.
SNOTEL: SNOwpack TELemetry.
SNR: Signal to Noise Ratio.
VHF: Very High Frequency.
WPM: Word Per Minute.
-30-
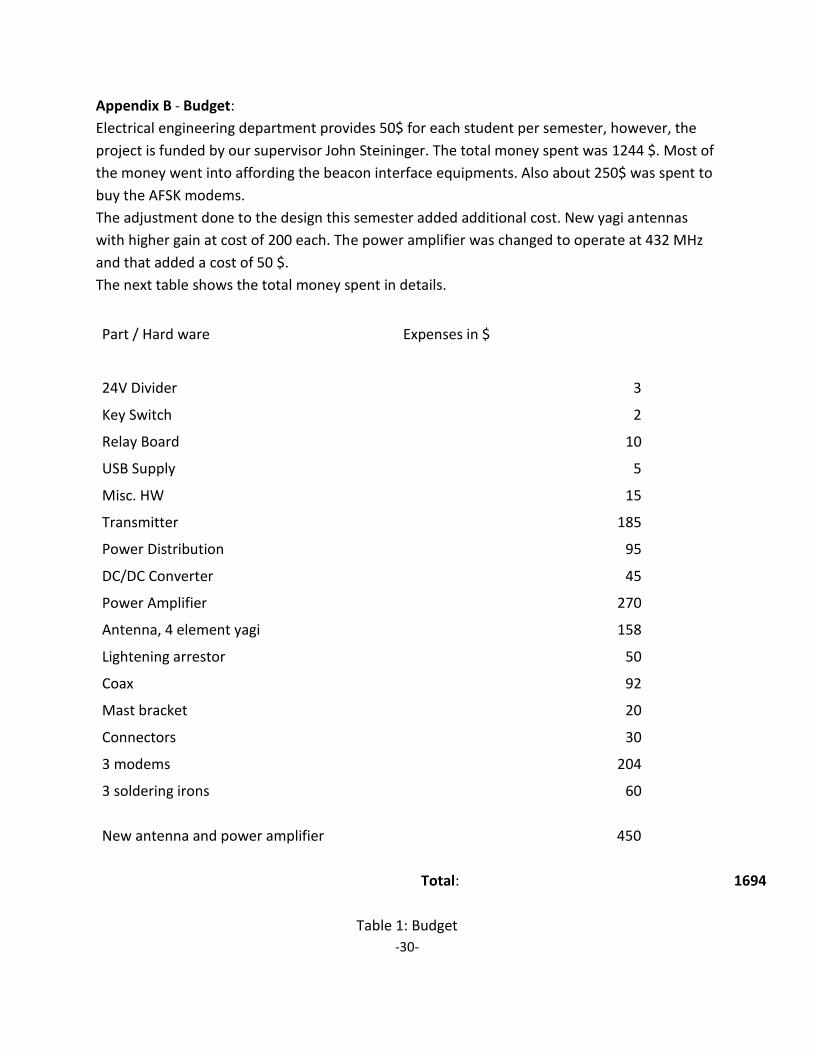
Appendix B - Budget:
Electrical engineering department provides 50$ for each student per semester, however, the
project is funded by our supervisor John Steininger. The total money spent was 1244 $. Most of
the money went into affording the beacon interface equipments. Also about 250$ was spent to
buy the AFSK modems.
The adjustment done to the design this semester added additional cost. New yagi antennas
with higher gain at cost of 200 each. The power amplifier was changed to operate at 432 MHz
and that added a cost of 50 $.
The next table shows the total money spent in details.
Part / Hard ware Expenses in $
24V Divider
3
Key Switch
2
Relay Board
10
USB Supply
5
Misc. HW
15
Transmitter
185
Power Distribution
95
DC/DC Converter
45
Power Amplifier
270
Antenna, 4 element yagi 158
Lightening arrestor
50
Coax
92
Mast bracket
20
Connectors
30
3 modems
204
3 soldering irons
60
New antenna and power amplifier
4 450
Total: 1694
Table 1: Budget

-31-
Appendix C - Acknowledgment:
At the end, we would like to thank our supervisors, John Steininger, Prof. Rocky Luo and Prof. Ali
Pezeshki for providing this opportunity and for helping us through all the semester. They have
been good teachers and good team leaders. We learned about communication and lived a real
life experience.


![Positioning for NLOS Propagation: Algorithm Derivations ... · PDF fileMIAO etal.: POSITIONING FOR NLOS PROPAGATION: ALGORITHM DERIVATIONS AND CRAMER–RAO BOUNDS 2569 and Zhuang [30]](https://img.pdfslide.us/doc/110x75/5a7275077f8b9a9d538d8f92/positioning-for-nlos-propagation-algorithm-derivations-nbsppdf.jpg)