Embed Size (px)
Citation preview
arX
iv:0
806.
3988
v1 [
astr
o-ph
] 2
5 Ju
n 20
08
ApJ, in press
A trio of new Local Group galaxies with extreme properties
Alan W. McConnachie1
Avon Huxor2
Nicolas F. Martin3
Mike J. Irwin4
Scott C. Chapman4
Gregory Fahlman5
Annette M. N. Ferguson2
Rodrigo A. Ibata6
Geraint F. Lewis7
Harvey Richer8
Nial R. Tanvir9
– 2 –
1Department of Physics and Astronomy, University of Victoria, Victoria, B.C., V8P 1A1,
Canada
2Institute for Astronomy, University of Edinburgh, Royal Observatory, Blackford Hill,
Edinburgh EH9 3HJ, U.K.
3Max-Planck-Institut fur Astronomie, Konigstuhl 17, D-69117 Heidelberg, Germany
4Institute of Astronomy, Madingley Road, Cambridge, CB3 0HA, U.K.
5NRC Herzberg Institute of Astrophysics, 5071 West Saanich Road, Victoria, B.C., V9E
2E7, Canada
6Observatoire de Strasbourg, 11, rue de l’Universite, F-67000, Strasbourg, France
7Institute of Astronomy, School of Physics, A29, University of Sydney, NSW 2006,
Australia
8Department of Physics and Astronomy, University of British Columbia, Vancouver, B.C.,
V6T 1Z1, Canada
9Department of Physics and Astronomy, University of Leicester, Leicester, LE1 7RH, U.K.
ABSTRACT
We report on the discovery of three new dwarf galaxies in the Local Group.
These galaxies are found in new CFHT/MegaPrime g, i imaging of the south-
western quadrant of M31, extending our extant survey area to include the ma-
jority of the southern hemisphere of M31’s halo out to 150 kpc. All these galaxies
have stellar populations which appear typical of dwarf spheroidal (dSph) systems.
The first of these galaxies, Andromeda XVIII, is the most distant Local Group
dwarf discovered in recent years, at ∼ 1.4Mpc from the Milky Way (∼ 600 kpc
from M31). The second galaxy, Andromeda XIX, a satellite of M31, is the most
extended dwarf galaxy known in the Local Group, with a half-light radius of
rh ∼ 1.7 kpc. This is approximately an order of magnitude larger than the typical
half-light radius of many Milky Way dSphs, and reinforces the difference in scale
sizes seen between the Milky Way and M31 dSphs (such that the M31 dwarfs are
generally more extended than their Milky Way counterparts). The third galaxy,
Andromeda XX, is one of the faintest galaxies so far discovered in the vicinity of
M31, with an absolute magnitude of order MV ∼ −6.3. Andromeda XVIII, XIX
and XX highlight different aspects of, and raise important questions regarding,
– 3 –
the formation and evolution of galaxies at the extreme faint-end of the luminosity
function. These findings indicate that we have not yet sampled the full parameter
space occupied by dwarf galaxies, although this is an essential pre-requisite for
successfully and consistently linking these systems to the predicted cosmological
dark matter sub-structure.
Subject headings: surveys — galaxies: dwarf — Local Group — galaxies: indi-
vidual (Andromeda XVIII, Andromeda XIX, Andromeda XX)
1. Introduction
Edwin Hubble first coined the term “Local Group” in his 1936 book “The Realm of the
Nebulae”, to describe those galaxies that were isolated in the general field but were in the
vicinity of the Galaxy. In recent years, the galaxies of the Local Group have been at the focus
of intense and broad-ranging research, from providing laboratories for the investigation of
dark matter properties (e.g., Gilmore et al. 2007 and references therein) to determinations of
the star formation history of the Universe (e.g., Skillman 2005 and references therein). Un-
derstanding individual galaxies in the Local Group offers important contributions to galaxy
structure and evolution studies; understanding the properties of the population is central to
galaxy formation in a cosmological context.
Hubble originally identified nine members of the Local Group: the Galaxy and the
Large and Small Magellanic Clouds; M31, M32 and NGC205; M33, NGC6822 and IC1613;
along with three possible members NGC6946, IC10 and IC342. The distances of the latter
three were highly uncertain due to heavy extinction; IC10 has since been confirmed as a
member (Sakai et al. 1999) although the other two lie outside the Local Group (NGC6946;
Sharina et al. 1997; IC342: Krismer et al. 1995).
The discovery of new Local Group members continued at a relatively constant rate up to
the start of 2004 (e.g., Ibata et al. 1994; Whiting et al. 1997, 1999; Armandroff et al. 1998,
1999; Karachentsev & Karachentseva 1999), at which point the discovery rate has increased
sharply. This has mostly been due to large area photometric CCD-based surveys of the
Milky Way and M31 stellar haloes: by searching for overdensities of resolved stars in certain
regions of colour-magnitude space, it is possible to identify very faint dwarf satellites which
have previously eluded detection.
Around the Milky Way, this technique has so far lead to the discovery of 9 new
satellites since 2005 (including possible diffuse star clusters) (Willman et al. 2005, 2006;
Belokurov et al. 2006, 2007; Zucker et al. 2006; Walsh et al. 2007). All of these discoveries
– 4 –
have been made using the Sloan Digitized Sky Survey (SDSS). In addition, two new iso-
lated dwarf galaxies have been identified: Leo T, more than 400kpc from the Milky Way
(Irwin et al. 2007), was discovered in the SDSS, and a revised distance estimate for the
previously known UGC4879 has moved this galaxy from > 10Mpc to being placed on the
periphery of the Local Group (a scant ∼ 1.1Mpc from the Milky Way; Kopylov et al. 2008).
Around M31, 9 new dwarf galaxy satellites have been discovered since 2004 (not includ-
ing results presented herein). Two of these galaxies (Andromeda IX, X) were found in special
SDSS scans of M31 (Zucker et al. 2004, 2007) and one (Andromeda XIV) was discovered
serendipitously by Majewski et al. (2007) in Kitt Peak 4m imaging of fields in the south-east
halo of M31. The remaining new dwarf galaxies have been discovered as part of our ongoing
photometric survey of this galaxy and its environs using the INT/WFC (Andromeda XVII,
Irwin et al. 2008) and CFHT/MegaPrime (Andromeda XI, XII and XIII, Martin et al. 2006;
Andromeda XV and XVI, Ibata et al. 2007). Despite its name, Andromeda XVII is only
the fifteenth dwarf spheroidal satellite of M31 to be discovered; Andromeda IV is a back-
ground galaxy (Ferguson et al. 2000) and Andromeda VIII was originally identified using
planetary nebulae (Morrison et al. 2003) which were later shown to belong to M31 and not
to a separate entity (Merrett et al. 2006). Additionally, only thirteen of these dwarfs are
actually located in the constellation of Andromeda (Andromeda VI ≡ the Pegasus dSph;
Andromeda VII ≡ the Cassiopeia dSph).
The unique, panoramic, perspective of the resolved stellar populations of galaxies pro-
vided by Local Group members make them ideal targets for observational programs aimed
at understanding the detailed structure of galaxies, their formation processes and their evo-
lutionary pathways. Dwarf galaxies are of particular interest, given that they are thought to
be the lowest mass, most dark matter dominated systems which contain baryons (e.g., Mateo
1998). They are therefore particularly sensitive probes of external processes, such as tides and
ram pressure stripping (e.g., Mayer et al. 2006; McConnachie et al. 2007b; Penarrubia et al.
2008b), and internal processes such as feedback from star formation (e.g., Dekel & Silk 1986;
Dekel & Woo 2003). Further, their potential as probes of dark matter (e.g., Gilmore et al.
2007; Strigari et al. 2007b) and their probable connection to cosmological sub-structures
(e.g., Moore et al. 1999; Bullock et al. 2000; Kravtsov et al. 2004; Penarrubia et al. 2008a)
give them an importance to galaxy formation not at all in proportion to their luminosity.
Here we report on the discovery of three new dwarf galaxies in the Local Group, all
of which have been found as part of our ongoing CFHT/MegaPrime photometric survey of
M31. This new imaging extends our survey area from the south-eastern quadrant discussed
in Ibata et al. (2007) to the west, and currently includes an additional 49 sq. degrees of M31’s
halo out to a maximum projected radius of 150 kpc. Section 2 summarises the observations
– 5 –
and data-reduction procedures and Section 3 presents a preliminary analysis of the new
dwarfs and quantifies their global properties. In Section 4, we discuss our results in relation
to some of the key questions which have been prompted with the discoveries of so many new
low luminosity galaxies in the Local Group. Section 5 summarises our results.
2. Observations
Martin et al. (2006) and Ibata et al. (2007) presented first results from our CFHT/MegaPrime
survey of the south-west quadrant of M31, obtained in semesters S02B – 06B. Since S06B,
we have initiated an extension to this survey with the aim of obtaining complete coverage
of the southern hemisphere of M31’s halo out to a maximum projected radius of 150 kpc
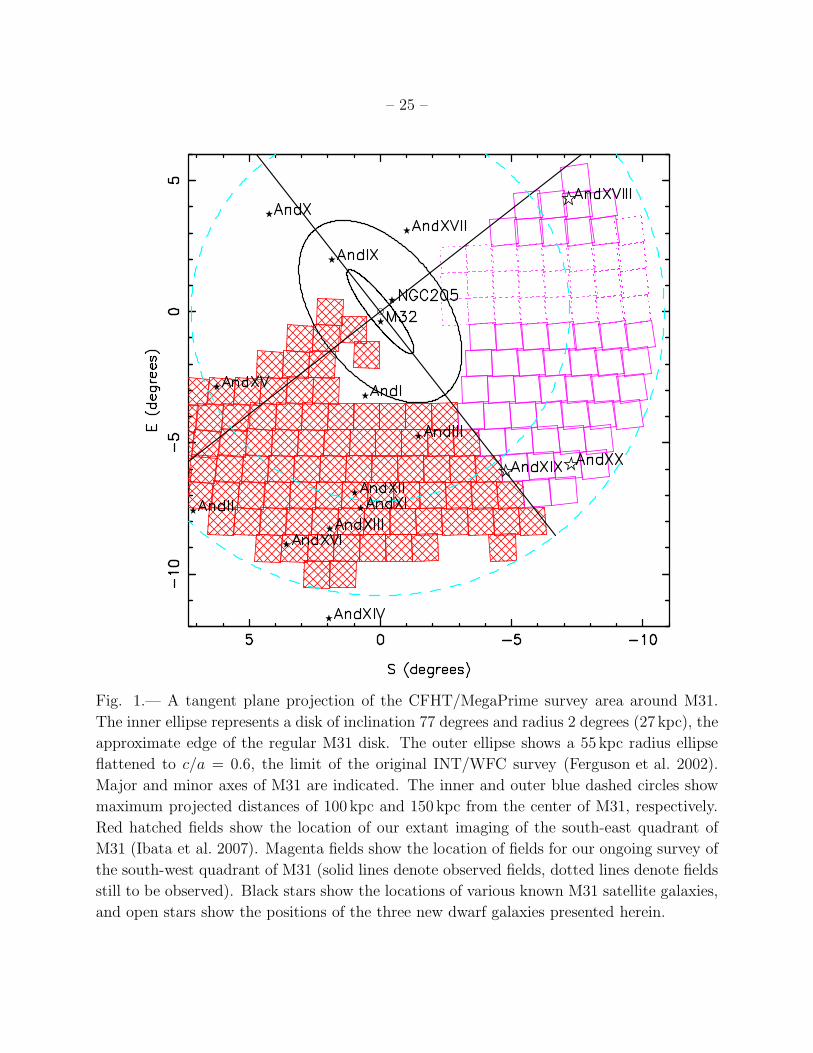
from the center of M31. Figure 1 shows the locations of these new fields relative to M31 in
a tangent-plane projection. Red hatched fields represent those fields previously presented
in Ibata et al. (2007). Magenta open fields represent the new survey area, where solid lines
denote fields which were observed in S06B – 07B, and dotted lines denote fields yet to be
observed. Black stars mark the positions of known M31 satellite galaxies, and open stars
mark the positions of the three new dwarfs presented herein.
Our observing strategy is very similar to that described in Ibata et al. (2007), to which
we refer the reader for further details. In brief, CFHT/MegaPrime consists of a mosaic of
thirty-six 2048 × 4612 pixel CCDs with a total field of view of 0.96 × 0.94 sq. degrees at a
pixel scale of 0.187 arcsec pixel−1. We observe in the CFHT g and i bands for a total of
1350 seconds each, split into 3× 450 seconds dithered sub-exposures, in < 0.8 arcsec seeing.
This is sufficient to reach g ∼ 25.5 and i ∼ 24.5 with a signal-to-noise of 10. In some
cases, more than three exposures were taken (at the discretion of CFHT staff to ensure
the requested observing conditions were met), and in these cases the viable images were
included in the stacking procedure, weighted according to noise/seeing. We have chosen a
tiling pattern which typically has very little overlap between fields, and so we use short,
45 second exposures in g and i offset by half a degree in the right ascension and declination
directions in order to establish a consistent photometric level over the survey. This typically
has a rms scatter of 0.02mags over our survey area.
The CFHT/MegaPrime data were pre-processed by CFHT staff using the Elixir pipeline,
which accomplishes the bias, flat, and fringe corrections and also determines the photometric
zero point of the observations. These images were then processed using a version of the CASU
photometry pipeline (Irwin & Lewis 2001) adapted for CFHT/MegaPrime observations. The
pipeline includes re-registration, stacking, catalogue generation and object morphological
classification, and creates band-merged g, i products for use in the subsequent analysis. The
– 6 –
CFHT g and i magnitudes are de-reddened using the Schlegel et al. (1998) IRAS maps, such
that g0 = g−3.793E(B−V ) and i0 = i−2.086E(B−V ), where g0 and i0 are the de-reddened
magnitudes.
3. Analysis
In this section we present an initial analysis of the three new dwarf galaxies using the
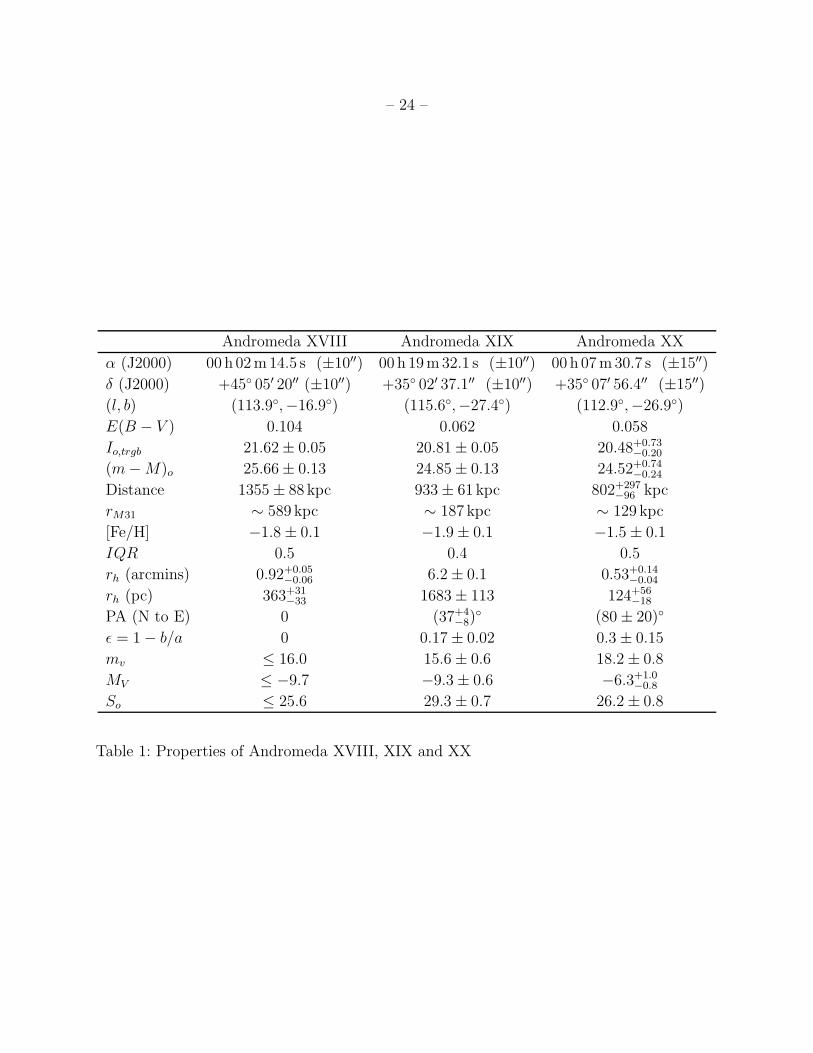
CFHT/MegaPrime discovery data. The measured parameters of the dwarfs are summarised
in Table 1.
3.1. Discovery and stellar populations
Two of the new dwarf galaxies (Andromeda XVIII and XIX) stand out as prominent
overdensities of stars in our survey and can be clearly identified by eye in maps of the
distribution of stellar sources. Andromeda XX, on the other hand, is considerably fainter
and its CMD is far more sparsely populated. Despite this, it was initially identified by one
of us (A. Huxor) through visual examination of the individual CCDs during a search for
globular clusters. An automated detection algorithm, based upon a boxcar matched-filter
search for local overdensities with a variable width, was subsequently applied after these
preliminary searches. As well as highlighting these three dwarfs, some other dwarf galaxy
candidates were identified and are being followed up. A subsequent paper will deal in detail
with the automated detection of dwarf galaxies around M31 to enable a full completeness
study, although such an analysis requires more contiguous coverage of M31 than we currently
possess. Prior to such a study, we do not make any claims regarding the completeness of the
satellite sample so far discovered.
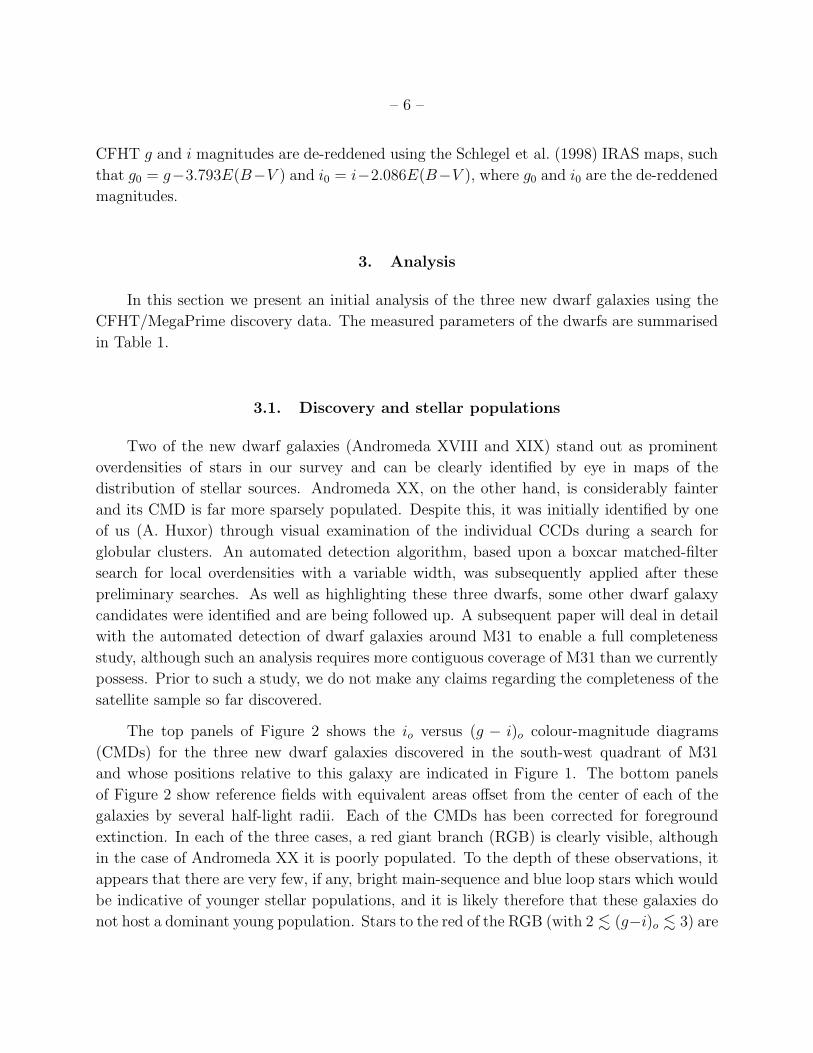
The top panels of Figure 2 shows the io versus (g − i)o colour-magnitude diagrams
(CMDs) for the three new dwarf galaxies discovered in the south-west quadrant of M31
and whose positions relative to this galaxy are indicated in Figure 1. The bottom panels
of Figure 2 show reference fields with equivalent areas offset from the center of each of the
galaxies by several half-light radii. Each of the CMDs has been corrected for foreground
extinction. In each of the three cases, a red giant branch (RGB) is clearly visible, although
in the case of Andromeda XX it is poorly populated. To the depth of these observations, it
appears that there are very few, if any, bright main-sequence and blue loop stars which would
be indicative of younger stellar populations, and it is likely therefore that these galaxies do
not host a dominant young population. Stars to the red of the RGB (with 2 . (g−i)o . 3) are
– 7 –
likely foreground Milky Way disk stars, although intermediate-age asymptotic giant branch
stars can also occupy this colour locus and have a luminosity similar to or brighter than the
tip of the red giant branch (although this is probably only relevant for Andromeda XIX). In
the Andromeda XIX CMD and reference field, the vertical feature at (g − i)o ∼ 0.3 is the
foreground Milky Way halo locus (see Martin et al. 2007 for an analysis of this feature in
our extant M31 survey). Given these current data, all of the CMDs appear to show stellar
populations typical of dSph galaxies. The faint blue objects centered around io ∼ 25.2
with a mean colour of (g − i)o ∼ 0.5 in the Andromeda XIX CMD may be a horizontal
branch component. However, as the reference field shows, contamination from misclassified
background galaxies is considerable in this region of colour - magnitude space. There is also
some evidence of a very weak RGB population in the Andromeda XIX reference field, which
is likely due to the background M31 halo and stellar overdensities in the vicinity of this dwarf
galaxy (see Section 4.3.2).
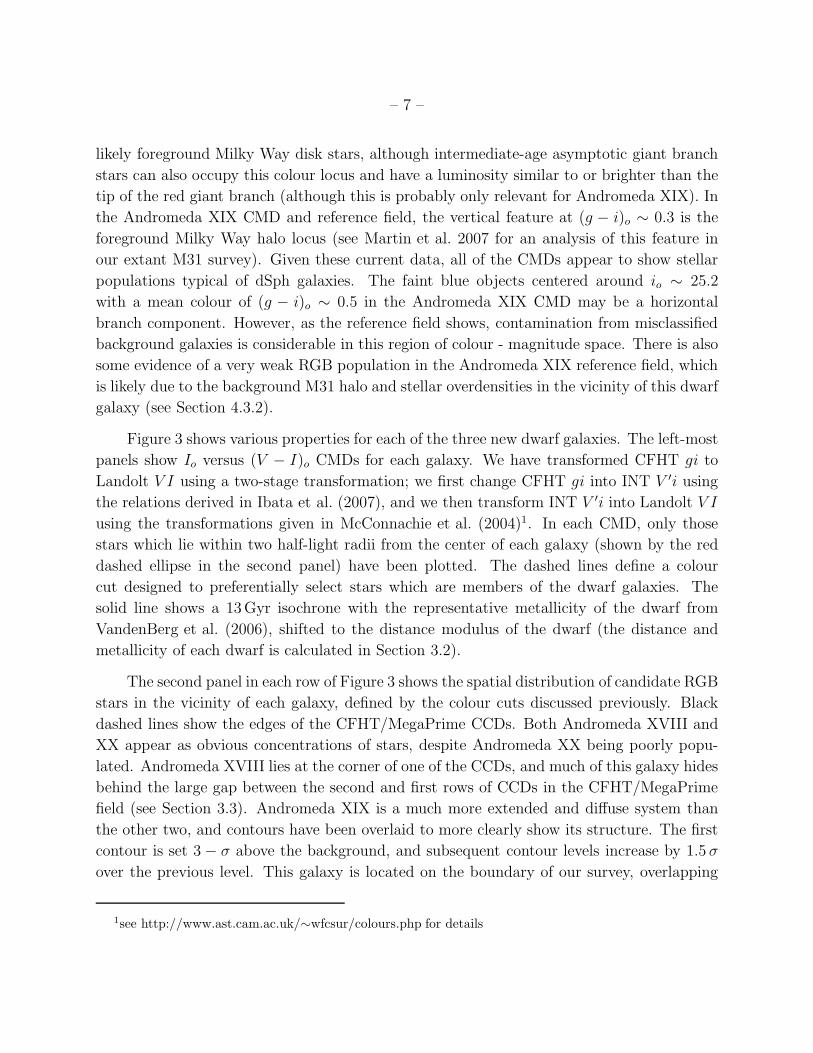
Figure 3 shows various properties for each of the three new dwarf galaxies. The left-most
panels show Io versus (V − I)o CMDs for each galaxy. We have transformed CFHT gi to
Landolt V I using a two-stage transformation; we first change CFHT gi into INT V ′i using
the relations derived in Ibata et al. (2007), and we then transform INT V ′i into Landolt V I
using the transformations given in McConnachie et al. (2004)1. In each CMD, only those
stars which lie within two half-light radii from the center of each galaxy (shown by the red
dashed ellipse in the second panel) have been plotted. The dashed lines define a colour
cut designed to preferentially select stars which are members of the dwarf galaxies. The
solid line shows a 13Gyr isochrone with the representative metallicity of the dwarf from
VandenBerg et al. (2006), shifted to the distance modulus of the dwarf (the distance and
metallicity of each dwarf is calculated in Section 3.2).
The second panel in each row of Figure 3 shows the spatial distribution of candidate RGB
stars in the vicinity of each galaxy, defined by the colour cuts discussed previously. Black
dashed lines show the edges of the CFHT/MegaPrime CCDs. Both Andromeda XVIII and
XX appear as obvious concentrations of stars, despite Andromeda XX being poorly popu-
lated. Andromeda XVIII lies at the corner of one of the CCDs, and much of this galaxy hides
behind the large gap between the second and first rows of CCDs in the CFHT/MegaPrime
field (see Section 3.3). Andromeda XIX is a much more extended and diffuse system than
the other two, and contours have been overlaid to more clearly show its structure. The first
contour is set 3 − σ above the background, and subsequent contour levels increase by 1.5 σ
over the previous level. This galaxy is located on the boundary of our survey, overlapping
1see http://www.ast.cam.ac.uk/∼wfcsur/colours.php for details
– 8 –
slightly with the extant survey region from Ibata et al. (2007). We include some adjacent
fields from this earlier part of the survey to obtain complete coverage of Andromeda XIX.
3.2. Distances and metallicities
The upper-right panels in each row of Figure 3 show, for each galaxy, the de-reddened
I-band luminosity functions of stars in the CMD which satisfy the colour and spatial cuts
defined previously. These have been corrected for foreground/background contamination by
subtracting a nearby “reference” field, scaled by area. The scaled reference field is shown by
the dotted line, to illustrate the contribution from the foreground/background as a function of
magnitude. The I−band magnitude of the tip of the red giant branch (TRGB; corresponding
to the point in the evolution of a RGB star immediately prior to it undergoing the core helium
flash) is a well-calibrated standard candle which is used extensively for nearby galaxies
(e.g., Lee et al. 1993; Salaris & Cassisi 1997; McConnachie et al. 2004, 2005 and references
therein). In a well populated luminosity function, it is normally taken to be equal to the
luminosity of the brightest RGB star. However, when dealing with faint dwarfs - particularly
systems like Andromeda XX with a very sparse RGB - this assumption is likely to be flawed
due to sampling errors. However, for this initial analysis of these galaxies we assume that
the TRGB position measured in this way is a good estimate of its actual position. We note
that the resulting distance modulus of Andromeda XX in particular is uncertain and will be
refined once deeper data reaching below the horizontal branch is available.
Our best estimates for the (extinction-corrected) I−band magnitude of the TRGB are
highlighted on each of the luminosity functions in Figure 3 and are listed in Table 1. For
Andromeda XX, we have adopted very conservative error bars; the lower limit is an estimate
of the possible offset of the brightest RGB star from the true TRGB from our experience with
the comparably faint Andromeda XII (Chapman et al. 2007); the upper limit assumes that
the few brightest stars we have identified are actually foreground contamination, and that the
true TRGB is represented by the group of stars at Io ∼ 21.2. Adopting MI = −4.04± 0.12
(Bellazzini et al. 2001) yields a preliminary distance to each of the new dwarf galaxies; the
derived distance moduli and distances are given in Table 1. Most notable is the distance
to Andromeda XVIII, which has a well-defined TRGB, and which places it approximately
1.4Mpc from the Milky Way (∼ 600 kpc distant from M31), at the periphery of the Local
Group.
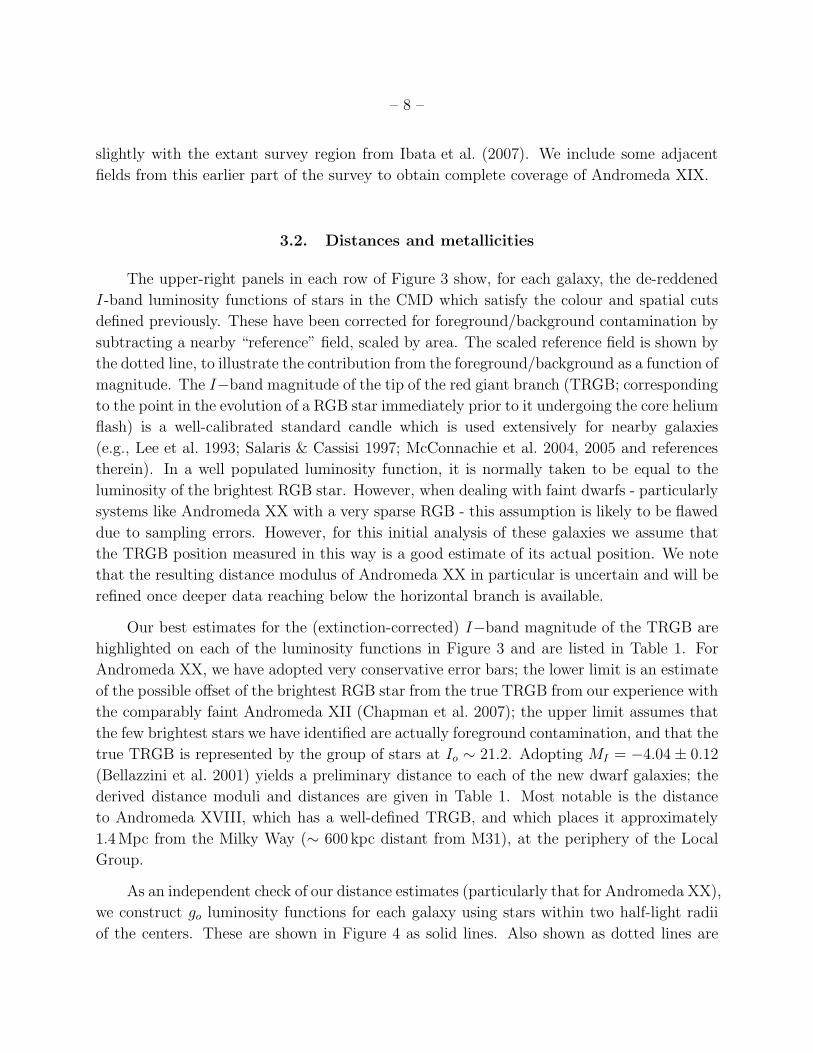
As an independent check of our distance estimates (particularly that for Andromeda XX),
we construct go luminosity functions for each galaxy using stars within two half-light radii
of the centers. These are shown in Figure 4 as solid lines. Also shown as dotted lines are
– 9 –
luminosity functions for nearby reference fields, scaled by area. These luminosity functions
go deeper than the previous CMDs since stars are only required to be detected in the g-
band. Our data start to become seriously incomplete below go ∼ 25.5, and photometric
errors at this magnitude are of order ∆ g ≃ 0.15. For reference, the horizontal branch in
M31 has a magnitude of go ∼ 25.2 (Ibata et al. 2007). For Andromeda XIX and XX, peaks
of stars are visible at g ∼ 25.3 and g ∼ 25.6, respectively, which are not present in the
reference fields, and which are marked in Figure 4 by dashed lines. We attribute these peaks
to the detection of horizontal branch stars in each of these galaxies. While the peak for
Andromeda XIX is less apparent than that for Andromeda XX, its position coincides with
the expected luminosity of the horizontal branch from inspection of its CMD in Figure 2,
reinforcing our interpretation of this feature. In contrast, no such feature is visible for An-
dromeda XVIII, which is expected given that we measure it to be much more distant than
the other two and so our observations will not be deep enough to observe the horizontal
branch population. Similarly, our measurements of the positions of the horizontal branches
in Andromeda XIX and XX are consistent with the positions we measure for the TRGB in
these galaxies. These detections (and non-detection) of the horizontal branches are therefore
consistent with the distances derived from the TRGB, and suggest that the uncertainty in
the distance to Andromeda XX may be less than we currently adopt in Table 1.
The lower-right panels of Figure 3 show the observed photometric metallicity distribu-
tion (MDF) function, constructed using the same technique as detailed in McConnachie et al.
(2005), using a bi-linear interpolation of stars in the top two magnitudes of the RGB with
13Gyr isochrones, [α/Fe] = 0, from VandenBerg et al. (2006) with BV RI colour-Teff re-
lations as described by VandenBerg & Clem (2003). Each MDF has been corrected for
foreground/background contamination by subtraction of a MDF for a reference field, scaled
by area. The MDF for the scaled reference field is shown as a dotted line in each panel. The
mean metallicity and metallicity spread, as quantified by the inter-quartile range (IQR), are
highlighted in Figure 3, and an isochrone corresponding to the mean metallicity of the dwarf
is overlaid on the CMD in the first panels, shifted to the distance modulus of the dwarf
galaxy.
The metallicity spread in each of the three galaxies is similar, although the IQR for
Andromeda XIX appears slightly smaller than for the other two. Certainly, the colour
spread of the RGB seen from the CMDs is much smaller for Andromeda XIX than for
Andromeda XVIII and XX. That this does not correspond to a much smaller spread in
metallicity probably reflects the metal poor nature of Andromeda XIX, since RGB colour
is a poor indicator of metallicity variation at very low metallicities. It is also tempting to
suggest that the narrow spread in RGB colour indicates that Andromeda XIX is a simple
stellar population; however, lessons learned from the Carina dSph, which has a large age and
– 10 –
metallicity spread but conspires to have a narrow RGB (Smecker-Hane et al. 1994), suggests
a note of caution against this interpretation.
The metallicity information is summarised in Table 1. The formal uncertainties in the
metallicity and metallicity spread estimates are of order 0.1 dex. In addition to uncertainties
in the stellar models, our metallicity estimates assume that (i) the dwarfs are all domi-
nated by a 13Gyr stellar population, and (ii) the distance modulus for each galaxy is well
estimated. The former assumption is likely reasonable, and should not lead to an error
& 0.2 dex unless the dwarfs are dominated by intermediate-age and young stellar popula-
tions (for which there is no current evidence). The latter assumption looks to be reason-
able for Andromeda XVIII and XIX, where the RGB is reasonably well populated, but for
Andromeda XX the uncertainty introduced through the distance estimate could be more
significant. We note that the metallicities of Andromeda XVIII and XIX look to be signif-
icantly lower than the median metallicity of the kinematically-selected halo of M31, which
has [Fe/H]≃ −1.4 (Chapman et al. 2006; Kalirai et al. 2006).
3.3. Structures and magnitudes
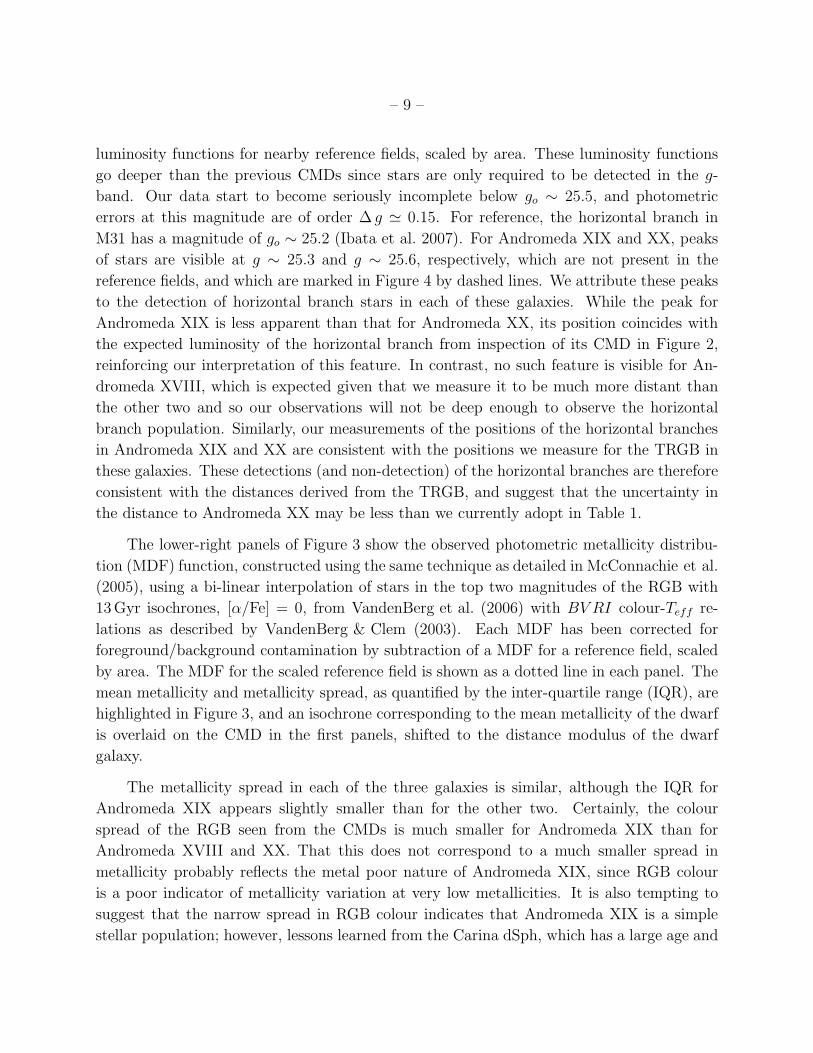
We quantify the structures of Andromeda XVIII, XIX and XX through the spatial
distributions of their resolved stars. However, the analysis is made more complex since An-
dromeda XIX is very diffuse, Andromeda XX has very few bright stars on which to base our
analysis, and each of the dwarf galaxies lies close to or at the edges of CCDs. In the extreme
case of Andromeda XVIII, we are clearly missing a significant part of the galaxy which lies
behind the large gap between the second and first rows of the CFHT/MegaPrime mosaic. To
illustrate this, the top panel of Figure 5 shows the i−band image of Andromeda XVIII with
linear scaling; while Andromeda XVIII is clearly visible to the naked eye, much of the galaxy
falls off the edge of the detector. To determine how large this effect is, the lower panel of Fig-
ure 5 shows a 10× 10 arcmins image centered on the coordinates of Andromeda XVIII from
the POSSII/UKSTU (Blue) survey which we retrieved through the Digitized Sky Survey,
and which covers the entirety of this galaxy.
Given the several complications discussed above, we choose to derive the structural
parameters for the dwarfs based upon the maximum likelihood technique developed by
Martin et al. (2008) instead of the usual technique which bins the data spatially and uses
smoothing kernels (e.g., Irwin & Hatzidimitriou 1995; McConnachie & Irwin 2006a). The
procedure has been modified from Martin et al. (2008), to which we refer the reader for
details, to account for incomplete coverage of the dwarfs due to CCD edges. In brief, this
technique calculates simultaneously the most plausible values for the centroid, ellipticity,
– 11 –
position angle and half-light radius of the dwarf under the assumption that the surface
brightness radial profile is well described by an exponential curve, without any need for
smoothing or binning of the data. However, for Andromeda XVIII this approach is still
insufficient since our data only samples one segment of the galaxy, as shown by comparing
the POSSII/UKSTU image with the CFHT/MegaPrime image in Figure 5. Thus, for this
galaxy, we estimate its center from the POSSII/UKSTU data and approximate it as circular.
The half-light radius is then calculated via the same technique as for Andromeda XIX and
XX using the CFHT/MegaPrime data.
The centroid, half-light radius (rh), position angle (measured east from north) and ellip-
ticity (ǫ = 1− b/a) for each dwarf galaxy, derived using the maximum likelihood technique
(with the above caveat for Andromeda XVIII), are listed in Table 1. In addition, Figure 6
shows the (background-corrected) stellar density profile (equivalent to the surface brightness
profile), derived using the same technique as in McConnachie & Irwin (2006a), for each of
the three dwarf galaxies. We use elliptical annuli with the position angle, ellipticity and
centroid listed in Table 1. Overlaid on these profiles are exponential profiles with the appro-
priate half light radii (the exponential scale radius, re ≃ 0.6rh). These profiles are the most
probable exponential models for the stellar density distribution of the dwarf galaxy derived
using the maximum likelihood method, and are not fits to the averaged data-points.
We estimate the magnitude of Andromeda XIX and XX in a similar way as Martin et al.
(2006) and Ibata et al. (2007). First, we sum the total V−band flux from candidate member
stars which are within the half-light radius of each dwarf galaxy and which are within 2− 3
magnitudes of the TRGB. However, this flux does not take into account the contribution
to the total light from fainter stars, most of which we do not detect. To determine the
appropriate correction to apply, we compare the half-light flux of Andromeda III measured
in this way (using similar CFHT/MegaPrime observations) to its apparent magnitude of
mv = 14.4 ± 0.3, directly measured by McConnachie & Irwin (2006a). We then apply the
appropriate correction to the fluxes for each dwarf galaxy. Clearly, the uncertainties asso-
ciated with this method are considerable, and we make the implicit assumption that the
luminosity functions of Andromeda III, XIX and XX are similar. Under this assumption, we
estimate an accuracy of ∼ 0.6mags in the final magnitude of Andromeda XIX, although we
estimate a larger uncertainty of ∼ 0.8mags for Andromeda XX due to the small number of
bright stars available. The central surface brightness of Andromeda XIX and XX are esti-
mated by normalizing the exponential profiles shown in Figure 6 so that the surface integral
over the dwarf out to the half-light radius is equal to half the total flux received from the
dwarf. These numbers are also given in Table 1.
It is not possible to derive the magnitude of Andromeda XVIII in the same way as
– 12 –
above given that we only sample a segment of this galaxy with our data. Comparison of
the POSSII/UKSTU images of Andromeda XVIII with those of Andromeda V, VI and VII
show that it is considerably lower surface brightness than either Andromeda VI or VII, but
is similar to - and perhaps brighter than - that of Andromeda V, which has So = 25.6± 0.3
(McConnachie & Irwin 2006a). We therefore adopt this as a faint-end limit to the central
surface brightness of Andromeda XVIII. A faint-end limit to its magnitude can then be
calculated by normalizing its radial surface brightness profile to this central value, integrating
over its area out to the half light radius, and multiplying the answer by two. The magnitude
derived in this way is given in Table 1. We note that updated magnitudes and surface
brightnesses will be derived for each of the three new galaxies using the unresolved light
component from dedicated, follow-up, photometric studies.
4. Discussion
Andromeda XVIII, XIX and XX have a range of relatively unusual properties. In
particular, Andromeda XVIII is one of the most distant Local Group galaxies discovered for
several years, and is one of the most isolated systems in the Local Group. Andromeda XIX
is extremely extended, with a very large half-light radius and extremely faint central surface
brightness. Andromeda XX, on the other hand, is one of the lowest luminosity dwarf galaxies
so far discovered around M31, with a magnitude of MV ≃ −6.3+1.0−0.7, comparable to the
luminosity of Andromeda XII (MV = −6.4 ± 1.0; Martin et al. 2006). In this section, we
discuss the properties of these galaxies in the larger context of the main science questions
raised by the recent discoveries of so many new dwarf galaxies.
4.1. Completeness
Prior to 2004, there were 15 dSph galaxies known in the Local Group (nine Milky Way
satellites, six M31 satellites and two isolated systems, Cetus and Tucana). Since this time,
22 new dwarf galaxies (including possible diffuse star clusters around the Milky Way) have
been discovered in the Local Group, the overwhelming majority of which are dSph satellites
of the Milky Way and M31. For the Milky Way, the SDSS has been responsible for all the
discoveries to date, and most of the galaxies discovered have been extremely faint; no new
Milky Way satellites with MV . −8 have been found. Thus, apart from satellites hidden by
the Milky Way disk, our satellite system is probably complete to this approximate magnitude
limit, as originally argued by Irwin (1994).
– 13 –
Around M31, it is more difficult to identify extremely faint dwarf galaxies since we can-
not probe as far down the stellar luminosity function. Andromeda XII and Andromeda XX
are the two faintest M31 satellites found so far, both with MV ∼ −6.3. For comparison,
the faintest Milky Way satellite found to date is probably Willman I, with MV ∼ −2.7
(Willman et al. 2006; Martin et al. 2008).
Andromeda XVIII is considerably brighter than Andromeda XX, and has a central
surface brightness similar to or brighter than Andromeda V (So = 25.6± 0.3mags arcsec−2).
Andromeda XVIII is clearly visible in the POSSII/UKSTU (Blue) survey image which we
retrieved through the Digitized Sky Survey and which is reproduced in the lower panel of
Figure 5. However, its identification is made more complicated by numerous nearby bright
stars and nebulosity in its vicinity, which may act to explain why it was not discovered
using these data. We have also confirmed that it is visible in the original POSSI (Blue)
survey. Its belated discovery indicates that previous surveys for relatively bright dwarf
galaxies around M31 were incomplete and that some dwarfs were missed. Variable and
unknown completeness is problematic for studies of satellite distributions and highlights the
vital need for more systematic studies such as those now being conducted.
It is fortuitous that Andromeda XVIII lies within our survey area given its considerable
distance fromM31. Indeed, even as current and future surveys help improve the completeness
of the M31 and Milky Way satellite systems, many isolated Local Group galaxies can be
expected to continue to elude detection: unlike the Milky Way satellites, they are not nearby,
and unlike the M31 satellites, they are not necessarily clustered in an area amenable to
systematic searches. PanStarrs 3π will survey a large fraction of the sky a magnitude deeper
than SDSS, and should discover isolated Local Group galaxies, particularly those within
500 kpc or so from the Milky Way. However, very faint galaxies much further away than this
(∼ 1Mpc) may prove more difficult to spot. Exactly how many very faint dwarf galaxies are
to be found at the periphery of the Local Group is likely to remain uncertain for some time
yet.
4.2. Spatial distribution
Several recent studies of the spatial distributions of satellites around the Milky Way and
M31 (Willman et al. 2004; Kroupa et al. 2005; McConnachie & Irwin 2006b; Koch & Grebel
2006; Metz et al. 2007; Irwin et al. 2008) have generally concluded that the distributions ap-
pear anisotropic: McConnachie & Irwin (2006b) highlight the fact that (at the time) 14 out
of the 16 candidate satellites of M31 are probably on the near side of M31, while others
(Kroupa et al. 2005; Koch & Grebel 2006; Metz et al. 2007; Irwin et al. 2008) conclude that
– 14 –
many of the Milky Way and M31 satellites are aligned in very flattened, disk-like, distribu-
tions (an observation originally made by Lynden-Bell 1976, 1982).
Andromeda XVIII, XIX and XX do not lie near any of the principle satellite planes
previously proposed to exist around M31. As discussed in the previous sub-section, the
census of Local Group galaxies is clearly not complete, and it is too early to draw definitive
conclusions regarding the distributions of satellites. This is particularly true around M31,
where relatively bright satellites are still being discovered. For the Milky Way, the SDSS
covers roughly one-fifth of the Milky Way halo in the direction of the north galactic cap;
depending upon how many satellites are found in future surveys at lower latitudes, the
statistical significance of the proposed streams of satellites may change substantially.
In terms of spatial distributions, Andromeda XVIII is unusual insofar as it is very distant
- roughly 1.4Mpc from the Milky Way, and roughly 600 kpc from M31. Thus it is probably
not a satellite of M31, although kinematics may help reveal whether it is approaching M31
and the Local Group for the first time (like Andromeda XII, Chapman et al. 2007) or if it has
been thrown out from M31 following an interaction (like Andromeda XIV, Majewski et al.
2007; Sales et al. 2007).
4.3. Environment and structures
4.3.1. Andromeda XVIII, position and morphology
Andromeda XVIII appears to possess stellar populations typical of dSph galaxies. If
it is subsequently confirmed to be gas poor, then it will be the third dSph galaxy found
in isolation in the Local Group (in addition to Cetus and Tucana). The fact that isolated
galaxies are preferentially more gas-rich compared to satellites (Einasto et al. 1974) has lead
to the proposition that satellite galaxies are stripped of their gas via ram-pressure stripping
and tidal harassment in the halo of the host galaxy (e.g., Mayer et al. 2006). However,
for isolated systems such as Andromeda XVIII, Cetus and Tucana, prolonged interactions
with massive galaxies are unlikely to have occurred. Likewise, the gas-deficient satellite
Andromeda XII is not believed to have undergone any past interactions with a large galaxy
since it appears to be on its first infall into the potential of M31 (Chapman et al. 2007).
Further, the most compelling case of a dwarf galaxy thought to be undergoing ram-pressure
stripping is Pegasus (DDO216; McConnachie et al. 2007b), an isolated galaxy more than
400 kpc from M31. Clearly, understanding if these observations are consistent with the
present models for dwarf galaxy evolution requires a more complete inventory of nearby
galaxies and their properties than we currently possess.
– 15 –
4.3.2. Andromeda XIX, tides and substructure
The half-light radius of Andromeda XIX is 6.2 arcmins. At the distance we derive for
it, this corresponds to rh ≃ 1.7 kpc, which is the largest value yet recorded for any dSph
in the Local Group. The average half-light radius for Milky Way dSphs is an order of
magnitude less, at rh ∼ 150 pc, and none have half-light radii larger than rh ≃ 550 pc
(with the exception of the tidally disrupting Sagittarius dSph; Majewski et al. 2003) .
M31 dSphs, on the other hand, have typical half-light radii of rh ∼ 300 pc, with the
previous extremes being Andromeda II, with rh ≃ 1.1 kpc, and Andromeda VII, with
rh ≃ 750 pc (McConnachie & Irwin 2006a). The extremely diffuse and extended nature
of Andromeda XIX is reminiscent of the “outer component” of Andromeda II, as traced by
horizontal branch stars by McConnachie et al. (2007a).
It is tempting to attribute the diffuse structure of Andromeda XIX to tidal interactions.
In this respect, it is relevant to note that Andromeda XIX lies very close to the major
axis substructure identified by Ibata et al. (2007). No independent distance estimate to this
substructure currently exists; Ibata et al. (2007) assumed it to be at the distance of M31 but
if it is at the same distance as Andromeda XIX then the photometric metallicity estimates
of these features will be very similar. Figure 7 shows the surroundings of Andromeda XIX as
a stellar density map; the first two contour levels are 2 and 3−σ above the background, and
the levels then increase by 1.5 σ over the previous level. As well as showing Andromeda XIX
as a prominent overdensity, there is some evidence of stellar material in its outskirts (also
visible in the contours of Figure 3). Whether or not Andromeda XIX is the source of the
major axis substructure identified in Ibata et al. (2007), or is being tidally perturbed, will
require detailed kinematics in this region. We note that Penarrubia et al. (2008b) show that
the effect of tides on dwarf galaxies in cosmological haloes is to decrease the central surface
brightness and decrease the half light radius of the bound component. This would argue
against tidal effects explaining the structure of Andromeda XIX.
The large scale-size of Andromeda XIX reinforces the difference in scale-size between the
Milky Way and M31 satellites first highlighted in McConnachie & Irwin (2006a), such that
the M31 dSphs are more extended than their Milky Way counterparts. Penarrubia et al.
(2008a,b) have investigated the cause of this disparity in an attempt to relate it to either
differences in the underlying dark matter properties of the dwarfs or differences in their
evolution around their hosts. They conclude that tidal effects are insufficient to explain
the magnitude of the effect. However, if the different scale sizes reflect intrinsic differences
between the Milky Way and M31 sub-haloes then this should reveal itself in the kinematics
of the two populations (with the M31 dwarfs being dynamically hotter than their Milky
Way counterparts). Whatever the cause, the comparison of Andromeda XIX and the other
– 16 –
M31 satellites to the Milky Way population highlights the importance of sampling dwarfs
in a range of environments so as to obtain a fuller appreciation of the range of properties
that these systems possess. In turn, this helps us understand the physical drivers behind
the differences and similarities we observe. We note that studies of the star clusters of
M31 (Huxor et al. 2005, 2008) have already extended the known parameter space for these
objects, with the M31 population containing extended star clusters not found in the Milky
Way population.
4.4. Satellites that are missing and “the missing satellites”
Andromeda XX is an exceptionally faint galaxy with a very poorly populated RGB. This
makes an accurate derivation of its properties particularly difficult. However, the star forma-
tion history of Andromeda XX and the other ultra-faint satellites is particularly relevant to
the “missing satellites” question (do all the thousands of dark matter sub-haloes predicted
to exist in the haloes of galaxies like the Milky Way and M31 contain stars and, if they do,
where are they?). Until recently, only a dozen or so dwarf satellites were observed, and it was
noted that the cumulative mass distribution of these satellites was dramatically different to
that of predicted dark matter sub-haloes, even at relatively large masses (Moore et al. 1999;
Klypin et al. 1999). To solve this discrepancy without altering the underlying cosmology, it
was suggested that either there were a large number of luminous satellites awaiting discovery
or that not all sub-haloes have a luminous component.
Despite many new galaxies in the Local Group being discovered, and many more un-
doubtedly awaiting discovery, we consider it very unlikely that these discoveries will resolve
the discrepancy between theory and observation. The original comparison between the ob-
served and predicted satellite mass functions shows that the discrepancy sets in for dwarfs
as luminous as the Small Magellanic Cloud (MV ≃ −16) and Fornax (MV ≃ −13). Finding
thousands of very faint (and presumably less massive?) satellites would not solve the dis-
agreement at the more massive end and there is no evidence to suggest that a dozen galaxies
the luminosity of Fornax have been missed (e.g., Irwin 1994). Further, as higher resolution
dark matter simulations make clear (e.g., Diemand et al. 2007), the sub-halo mass function
appears to continue to increase at the low mass end. It seems reasonable, therefore, that
at some point these haloes will not be massive enough to be able to accrete and/or retain
baryons and form stars, and this implies that there is a minimum mass halo which can host
a luminous component (Kravtsov et al. 2004).
A re-analysis of the observed dynamics of the dwarf galaxies by Penarrubia et al. (2008a,b)
within the Λ−CDM framework has shown that few-if-any of these galaxies (including recent
– 17 –
discoveries) occupy a halo with a circular velocity less than ∼ 10−20 km s−1. Further, these
estimates bring the cumulative distribution of luminous satellites and dark matter sub-haloes
into good agreement at the high-mass end. Using a different technique, Strigari et al. (2007a)
find a similar result. Given that these authors find good agreement between observations
and theory down to a certain mass limit, their results support the idea of a mass threshold
in dark matter haloes below which star formation becomes highly inefficient. Therefore, by
continuing to identify new, ultra-faint dwarfs, we probe the astrophysics of galaxy forma-
tion at low mass limits where the sensitivity to complex feedback mechanisms - such as star
formation (Kravtsov et al. 2004) and reionization (Bullock et al. 2001) - is greatest.
5. Summary
We have presented three new Local Group dwarf galaxies discovered as part of our
ongoing CFHT/MegaPrime survey of M31 and its environs. These galaxies - christened
Andromeda XVIII, XIX and XX after the constellation in which they are found - have stellar
populations which appear typical of dSph galaxies. Individually, each of these galaxies has
relatively unusual properties compared to the previously known dwarfs in the vicinity of
M31:
• Andromeda XVIII is extremely distant, at 1355± 88 kpc from the Milky Way, placing
it nearly 600 kpc from M31. Thus it is one of the most isolated galaxies in the Local
Group. It is clearly observed through its integrated light (it appears to have a central
surface brightness similar to or brighter than that of Andromeda V) and suggests that
there could be several other relatively bright dwarf galaxies within the Local Group
which have so far eluded detection;
• Andromeda XIX is extremely extended, with a half-light radius of rh = 1683±113 kpc.
This is an order of magnitude more extended than typical Milky Way dSphs. While its
integrated luminosity is MV = −9.3±0.6, its central surface brightness is exceptionally
low, at So = 29.3±0.7. Andromeda XIX reinforces the difference in scale-size between
the Milky Way and M31 satellites first discussed in McConnachie & Irwin (2006a).
This galaxy may be being tidally disrupted, and could be related to major axis sub-
structure first identified in Ibata et al. (2007) and which lies near to Andromeda XIX in
projection. However, we note that calculations by Penarrubia et al. (2008b) show that
the net effect of tides on a dwarf galaxy is to decrease the central surface brightness
and decrease the half-light radius of the bound component;
• Andromeda XX is extremely faint, with an absolute magnitude of orderMV = −6.3+1.0−0.7.
– 18 –
It is one of the faintest galaxy so far discovered in the vicinity of M31 (comparable in
luminosity to Andromeda XII) and as such many of its key parameters are extremely
uncertain at this stage. A full inventory of these systems is required to properly define
the faint-end of the galaxy luminosity function, and to determine where, if anywhere,
we encounter a lower limit to the galaxy mass/luminosity function.
Based on observations obtained with MegaPrime/MegaCam, a joint project of CFHT
and CEA/DAPNIA, at the Canada-France-Hawaii Telescope (CFHT) which is operated by
the National Research Council (NRC) of Canada, the Institute National des Sciences de
l’Univers of the Centre National de la Recherche Scientifique of France, and the University
of Hawaii. We are indebted to the CFHT staff for their help and careful observations, and we
thank the anonymous referee for useful comments which improved the clarity of this paper.
AWM thanks Evan Skillman, Jorge Penarrubia and Andrew Cole for useful discussions.
AWM is supported by a Research Fellowship from the Royal Commission for the Exhibition
of 1851, and thanks Sara Ellision and Julio Navarro for additional financial assistance. AH
and AMNF acknowledge support from a Marie Curie Excellence Grant from the European
Commission under contract MCEXT-CT-2005-025869.
REFERENCES
Armandroff, T. E., Davies, J. E., & Jacoby, G. H. 1998, AJ, 116, 2287
Armandroff, T. E., Jacoby, G. H., & Davies, J. E. 1999, AJ, 118, 1220
Bellazzini, M., Ferraro, F. R., & Pancino, E. 2001, ApJ, 556, 635
Belokurov, V., Zucker, D. B., Evans, N. W., Kleyna, J. T., Koposov, S., Hodgkin, S. T.,
Irwin, M. J., Gilmore, G., Wilkinson, M. I., Fellhauer, M., Bramich, D. M., Hewett,
P. C., Vidrih, S., De Jong, J. T. A., Smith, J. A., Rix, H.-W., Bell, E. F., Wyse,
R. F. G., Newberg, H. J., Mayeur, P. A., Yanny, B., Rockosi, C. M., Gnedin, O. Y.,
Schneider, D. P., Beers, T. C., Barentine, J. C., Brewington, H., Brinkmann, J.,
Harvanek, M., Kleinman, S. J., Krzesinski, J., Long, D., Nitta, A., & Snedden, S. A.
2007, ApJ, 654, 897
Belokurov, V., Zucker, D. B., Evans, N. W., Wilkinson, M. I., Irwin, M. J., Hodgkin, S.,
Bramich, D. M., Irwin, J. M., Gilmore, G., Willman, B., Vidrih, S., Newberg, H. J.,
Wyse, R. F. G., Fellhauer, M., Hewett, P. C., Cole, N., Bell, E. F., Beers, T. C.,
Rockosi, C. M., Yanny, B., Grebel, E. K., Schneider, D. P., Lupton, R., Barentine,
– 19 –
J. C., Brewington, H., Brinkmann, J., Harvanek, M., Kleinman, S. J., Krzesinski, J.,
Long, D., Nitta, A., Smith, J. A., & Snedden, S. A. 2006, ApJ, 647, L111
Bullock, J. S., Kolatt, T. S., Sigad, Y., Somerville, R. S., Kravtsov, A. V., Klypin, A. A.,
Primack, J. R., & Dekel, A. 2001, MNRAS, 321, 559
Bullock, J. S., Kravtsov, A. V., & Weinberg, D. H. 2000, ApJ, 539, 517
Chapman, S. C., Ibata, R., Lewis, G. F., Ferguson, A. M. N., Irwin, M., McConnachie, A.,
& Tanvir, N. 2006, ApJ, 653, 255
Chapman, S. C., Penarrubia, J., Ibata, R., McConnachie, A., Martin, N., Irwin, M., Blain,
A., Lewis, G. F., Letarte, B., Lo, K., Ludlow, A., & O’neil, K. 2007, ApJ, 662, L79
Dekel, A. & Silk, J. 1986, ApJ, 303, 39
Dekel, A. & Woo, J. 2003, MNRAS, 344, 1131
Diemand, J., Kuhlen, M., & Madau, P. 2007, ApJ, 667, 859
Einasto, J., Saar, E., Kaasik, A., & Chernin, A. D. 1974, Nature, 252, 111
Ferguson, A. M. N., Gallagher, J. S., & Wyse, R. F. G. 2000, AJ, 120, 821
Ferguson, A. M. N., Irwin, M. J., Ibata, R. A., Lewis, G. F., & Tanvir, N. R. 2002, AJ, 124,
1452
Gilmore, G., Wilkinson, M. I., Wyse, R. F. G., Kleyna, J. T., Koch, A., Evans, N. W., &
Grebel, E. K. 2007, ApJ, 663, 948
Huxor, A. P., Tanvir, N. R., Ferguson, A. M. N., Irwin, M. J., Ibata, R., Bridges, T., &
Lewis, G. F. 2008, ArXiv: 0801.0002, 801
Huxor, A. P., Tanvir, N. R., Irwin, M. J., Ibata, R., Collett, J. L., Ferguson, A. M. N.,
Bridges, T., & Lewis, G. F. 2005, MNRAS, 360, 1007
Ibata, R., Martin, N. F., Irwin, M., Chapman, S., Ferguson, A. M. N., Lewis, G. F., &
McConnachie, A. W. 2007, ApJ, 671, 1591
Ibata, R. A., Gilmore, G., & Irwin, M. J. 1994, Nature, 370, 194
Irwin, M. & Hatzidimitriou, D. 1995, MNRAS, 277, 1354
Irwin, M. & Lewis, J. 2001, New Astronomy Review, 45, 105
– 20 –
Irwin, M. J. 1994, in ESO/OHP workshop No. 49 on Dwarf Galaxies, ed. G Meylan. and P.
Prugniel., 27
Irwin, M. J., Belokurov, V., Evans, N. W., Ryan-Weber, E. V., de Jong, J. T. A., Koposov,
S., Zucker, D. B., Hodgkin, S. T., Gilmore, G., Prema, P., Hebb, L., Begum, A.,
Fellhauer, M., Hewett, P. C., Kennicutt, Jr., R. C., Wilkinson, M. I., Bramich, D. M.,
Vidrih, S., Rix, H.-W., Beers, T. C., Barentine, J. C., Brewington, H., Harvanek, M.,
Krzesinski, J., Long, D., Nitta, A., & Snedden, S. A. 2007, ApJ, 656, L13
Irwin, M. J., Ferguson, A. M. N., Huxor, A. P., Tanvir, N. R., Ibata, R. A., & Lewis, G. F.
2008, ApJ, 676, L17
Kalirai, J. S., Gilbert, K. M., Guhathakurta, P., Majewski, S. R., Ostheimer, J. C., Rich,
R. M., Cooper, M. C., Reitzel, D. B., & Patterson, R. J. 2006, ApJ, 648, 389
Karachentsev, I. D. & Karachentseva, V. E. 1999, A&A, 341, 355
Klypin, A., Kravtsov, A. V., Valenzuela, O., & Prada, F. 1999, ApJ, 522, 82
Koch, A. & Grebel, E. K. 2006, AJ, 131, 1405
Kopylov, A. I., Tikhonov, N. A., Fabrika, S., Drozdovsky, I., & Valeev, A. F. 2008, ArXiv
e-prints, 803
Kravtsov, A. V., Gnedin, O. Y., & Klypin, A. A. 2004, ApJ, 609, 482
Krismer, M., Tully, R. B., & Gioia, I. M. 1995, AJ, 110, 1584
Kroupa, P., Theis, C., & Boily, C. M. 2005, A&A, 431, 517
Lee, M. G., Freedman, W. L., & Madore, B. F. 1993, ApJ, 417, 553
Lynden-Bell, D. 1976, MNRAS, 174, 695
—. 1982, The Observatory, 102, 202
Majewski, S. R., Beaton, R. L., Patterson, R. J., Kalirai, J. S., Geha, M. C., Munoz, R. R.,
Seigar, M. S., Guhathakurta, P., Gilbert, K. M., Rich, R. M., Bullock, J. S., & Reitzel,
D. B. 2007, ApJ, 670, L9
Majewski, S. R., Skrutskie, M. F., Weinberg, M. D., & Ostheimer, J. C. 2003, ApJ, 599,
1082
Martin, N. F., de Jong, J. T. A., & Rix, H.-W. 2008, arXiv:0805.2945, 805
– 21 –
Martin, N. F., Ibata, R. A., & Irwin, M. 2007, ApJ, 668, L123
Martin, N. F., Ibata, R. A., Irwin, M. J., Chapman, S., Lewis, G. F., Ferguson, A. M. N.,
Tanvir, N., & McConnachie, A. W. 2006, MNRAS, 371, 1983
Mateo, M. L. 1998, ARA&A, 36, 435
Mayer, L., Mastropietro, C., Wadsley, J., Stadel, J., & Moore, B. 2006, MNRAS, 369, 1021
McConnachie, A. W., Arimoto, N., & Irwin, M. 2007a, MNRAS, 379, 379
McConnachie, A. W. & Irwin, M. J. 2006a, MNRAS, 365, 1263
—. 2006b, MNRAS, 365, 902
McConnachie, A. W., Irwin, M. J., Ferguson, A. M. N., Ibata, R. A., Lewis, G. F., & Tanvir,
N. 2004, MNRAS, 350, 243
—. 2005, MNRAS, 356, 979
McConnachie, A. W., Venn, K. A., Irwin, M. J., Young, L. M., & Geehan, J. J. 2007b, ApJ,
671, L33
Merrett, H. R., Merrifield, M. R., Douglas, N. G., Kuijken, K., Romanowsky, A. J., Napoli-
tano, N. R., Arnaboldi, M., Capaccioli, M., Freeman, K. C., Gerhard, O., Coccato,
L., Carter, D., Evans, N. W., Wilkinson, M. I., Halliday, C., & Bridges, T. J. 2006,
MNRAS, 369, 120
Metz, M., Kroupa, P., & Jerjen, H. 2007, MNRAS, 374, 1125
Moore, B., Quinn, T., Governato, F., Stadel, J., & Lake, G. 1999, MNRAS, 310, 1147
Morrison, H. L., Harding, P., Hurley-Keller, D., & Jacoby, G. 2003, ApJ, 596, L183
Penarrubia, J., McConnachie, A. W., & Navarro, J. F. 2008a, ApJ, 672, 904
Penarrubia, J., Navarro, J. F., & McConnachie, A. W. 2008b, ApJ, 673, 226
Sakai, S., Madore, B. F., & Freedman, W. L. 1999, ApJ, 511, 671
Salaris, M. & Cassisi, S. 1997, MNRAS, 289, 406
Sales, L. V., Navarro, J. F., Abadi, M. G., & Steinmetz, M. 2007, MNRAS, 379, 1475
Schlegel, D. J., Finkbeiner, D. P., & Davis, M. 1998, ApJ, 500, 525
– 22 –
Sharina, M. E., Karachentsev, I. D., & Tikhonov, N. A. 1997, Astronomy Letters, 23, 373
Skillman, E. D. 2005, New Astronomy Review, 49, 453
Smecker-Hane, T. A., Stetson, P. B., Hesser, J. E., & Lehnert, M. D. 1994, AJ, 108, 507
Strigari, L. E., Bullock, J. S., Kaplinghat, M., Diemand, J., Kuhlen, M., & Madau, P. 2007a,
ApJ, 669, 676
Strigari, L. E., Koushiappas, S. M., Bullock, J. S., & Kaplinghat, M. 2007b, Phys. Rev. D,
75, 083526
VandenBerg, D. A., Bergbusch, P. A., & Dowler, P. D. 2006, ApJS, 162, 375
VandenBerg, D. A. & Clem, J. L. 2003, AJ, 126, 778
Walsh, S. M., Jerjen, H., & Willman, B. 2007, ApJ, 662, L83
Whiting, A. B., Hau, G. K. T., & Irwin, M. 1999, AJ, 118, 2767
Whiting, A. B., Irwin, M. J., & Hau, G. K. T. 1997, AJ, 114, 996
Willman, B., Dalcanton, J. J., Martinez-Delgado, D., West, A. A., Blanton, M. R., Hogg,
D. W., Barentine, J. C., Brewington, H. J., Harvanek, M., Kleinman, S. J., Krzesinski,
J., Long, D., Neilsen, Jr., E. H., Nitta, A., & Snedden, S. A. 2005, ApJ, 626, L85
Willman, B., Governato, F., Dalcanton, J. J., Reed, D., & Quinn, T. 2004, MNRAS, 353,
639
Willman, B., Masjedi, M., Hogg, D. W., Dalcanton, J. J., Martinez-Delgado, D., Blanton,
M., West, A. A., Dotter, A., & Chaboyer, B. 2006, astro-ph/0603486
Zucker, D. B., Belokurov, V., Evans, N. W., Wilkinson, M. I., Irwin, M. J., Sivarani, T.,
Hodgkin, S., Bramich, D. M., Irwin, J. M., Gilmore, G., Willman, B., Vidrih, S.,
Fellhauer, M., Hewett, P. C., Beers, T. C., Bell, E. F., Grebel, E. K., Schneider, D. P.,
Newberg, H. J., Wyse, R. F. G., Rockosi, C. M., Yanny, B., Lupton, R., Smith, J. A.,
Barentine, J. C., Brewington, H., Brinkmann, J., Harvanek, M., Kleinman, S. J.,
Krzesinski, J., Long, D., Nitta, A., & Snedden, S. A. 2006, ApJ, 643, L103
Zucker, D. B., Kniazev, A. Y., Bell, E. F., Martınez-Delgado, D., Grebel, E. K., Rix, H.,
Rockosi, C. M., Holtzman, J. A., Walterbos, R. A. M., Annis, J., York, D. G., Ivezic,
Z., Brinkmann, J., Brewington, H., Harvanek, M., Hennessy, G., Kleinman, S. J.,
Krzesinski, J., Long, D., Newman, P. R., Nitta, A., & Snedden, S. A. 2004, ApJ, 612,
L121
– 23 –
Zucker, D. B., Kniazev, A. Y., Martınez-Delgado, D., Bell, E. F., Rix, H.-W., Grebel, E. K.,
Holtzman, J. A., Walterbos, R. A. M., Rockosi, C. M., York, D. G., Barentine, J. C.,
Brewington, H., Brinkmann, J., Harvanek, M., Kleinman, S. J., Krzesinski, J., Long,
D., Neilsen, Jr., E. H., Nitta, A., & Snedden, S. A. 2007, ApJ, 659, L21
This preprint was prepared with the AAS LATEX macros v5.2.
– 24 –
Andromeda XVIII Andromeda XIX Andromeda XX
α (J2000) 00 h 02m14.5 s (±10′′) 00 h 19m32.1 s (±10′′) 00 h 07m30.7 s (±15′′)
δ (J2000) +45◦ 05′ 20′′ (±10′′) +35◦ 02′ 37.1′′ (±10′′) +35◦ 07′ 56.4′′ (±15′′)
(l, b) (113.9◦,−16.9◦) (115.6◦,−27.4◦) (112.9◦,−26.9◦)
E(B − V ) 0.104 0.062 0.058
Io,trgb 21.62± 0.05 20.81± 0.05 20.48+0.73−0.20
(m−M)o 25.66± 0.13 24.85± 0.13 24.52+0.74−0.24
Distance 1355± 88 kpc 933± 61 kpc 802+297
−96 kpc
rM31 ∼ 589 kpc ∼ 187 kpc ∼ 129 kpc
[Fe/H] −1.8 ± 0.1 −1.9± 0.1 −1.5± 0.1
IQR 0.5 0.4 0.5
rh (arcmins) 0.92+0.05−0.06 6.2± 0.1 0.53+0.14
−0.04
rh (pc) 363+31
−33 1683± 113 124+56
−18
PA (N to E) 0 (37+4
−8)◦ (80± 20)◦
ǫ = 1− b/a 0 0.17± 0.02 0.3± 0.15
mv ≤ 16.0 15.6± 0.6 18.2± 0.8
MV ≤ −9.7 −9.3± 0.6 −6.3+1.0−0.8
So ≤ 25.6 29.3± 0.7 26.2± 0.8
Table 1: Properties of Andromeda XVIII, XIX and XX
– 25 –
Fig. 1.— A tangent plane projection of the CFHT/MegaPrime survey area around M31.
The inner ellipse represents a disk of inclination 77 degrees and radius 2 degrees (27 kpc), the
approximate edge of the regular M31 disk. The outer ellipse shows a 55 kpc radius ellipse
flattened to c/a = 0.6, the limit of the original INT/WFC survey (Ferguson et al. 2002).
Major and minor axes of M31 are indicated. The inner and outer blue dashed circles show
maximum projected distances of 100 kpc and 150 kpc from the center of M31, respectively.
Red hatched fields show the location of our extant imaging of the south-east quadrant of
M31 (Ibata et al. 2007). Magenta fields show the location of fields for our ongoing survey of
the south-west quadrant of M31 (solid lines denote observed fields, dotted lines denote fields
still to be observed). Black stars show the locations of various known M31 satellite galaxies,
and open stars show the positions of the three new dwarf galaxies presented herein.
– 26 –
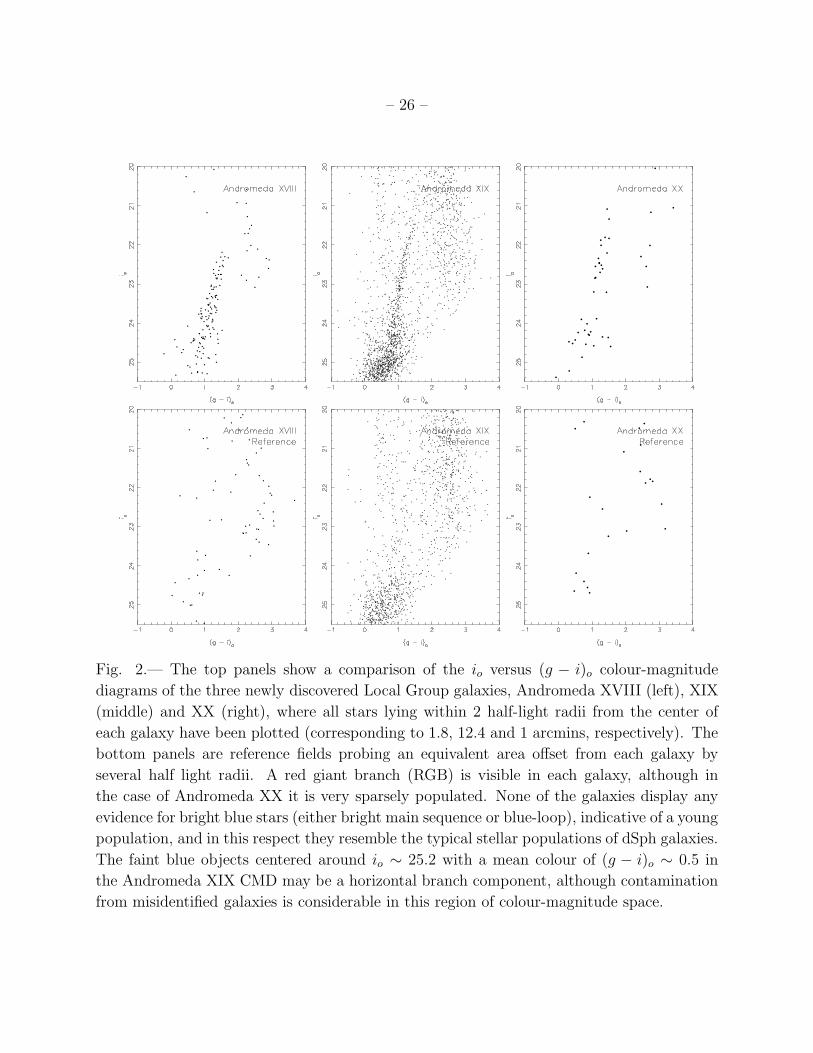
Fig. 2.— The top panels show a comparison of the io versus (g − i)o colour-magnitude
diagrams of the three newly discovered Local Group galaxies, Andromeda XVIII (left), XIX
(middle) and XX (right), where all stars lying within 2 half-light radii from the center of
each galaxy have been plotted (corresponding to 1.8, 12.4 and 1 arcmins, respectively). The
bottom panels are reference fields probing an equivalent area offset from each galaxy by
several half light radii. A red giant branch (RGB) is visible in each galaxy, although in
the case of Andromeda XX it is very sparsely populated. None of the galaxies display any
evidence for bright blue stars (either bright main sequence or blue-loop), indicative of a young
population, and in this respect they resemble the typical stellar populations of dSph galaxies.
The faint blue objects centered around io ∼ 25.2 with a mean colour of (g − i)o ∼ 0.5 in
the Andromeda XIX CMD may be a horizontal branch component, although contamination
from misidentified galaxies is considerable in this region of colour-magnitude space.
– 27 –
– 28 –
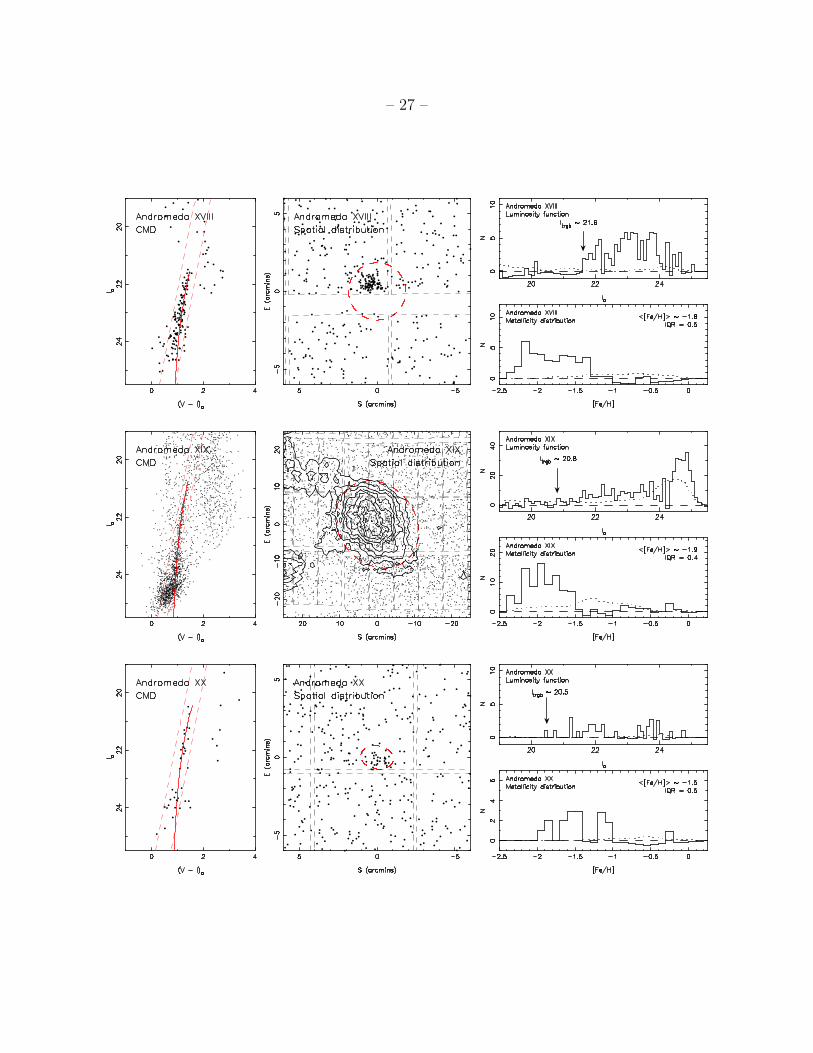
Fig. 3.— Each set of panels shows various properties of Andromeda XVIII (top row), An-
dromeda XIX (middle row) and Andromeda XX (bottom row). Left panels: Io versus (V −I)ocolour magnitude diagram for each galaxy. Dashed lines define a colour-cut used to prefer-
entially select stars associated with the dwarf. A 13Gyr isochrone with the representative
metallicity of the dwarf from VandenBerg et al. (2006), shifted to the appropriate distance
modulus, is overlaid on each CMD. Only stars within the dotted ellipses shown in the mid-
dle panels are plotted. Middle panels: tangent plane projections of the spatial distribution
of stars in the vicinity of each dwarf. Only stars satisfying the colour cuts shown in the
CMDs are plotted. Dashed lines show the edges of the CFHT/MegaPrime CCDs. Dashed
ellipses mark two half-light radii from the center of each galaxy. For Andromeda XVIII
and XX, the dwarf galaxies are clearly visible as overdensities in the centers of each field,
whereas Andromeda XIX is more extended and diffuse and contours have been overlaid
to more clearly define its structure. The first contour is set 3 − σ above the background,
and subsequent contour levels increase by 1.5 σ over the previous level. Right top panels:
foreground-corrected, de-reddened, I-band luminosity functions of stars in each galaxy sat-
isfying our colour and spatial cuts. Scaled reference field luminosity functions are shown as
dotted lines. The estimated luminosity of the tip of the red giant branch is highlighted. Right
bottom panels: foreground-corrected observed photometric metallicity distribution function
derived using the technique detailed in McConnachie et al. (2005) using 13Gyr isochrones
from VandenBerg et al. (2006) with [α/Fe] = 0]. Scaled reference field metallicity distri-
bution functions are shown as dotted lines. The mean metallicity and metallicity spread
(quantified using the inter-quartile range, IQR) for each galaxy is highlighted.
– 29 –
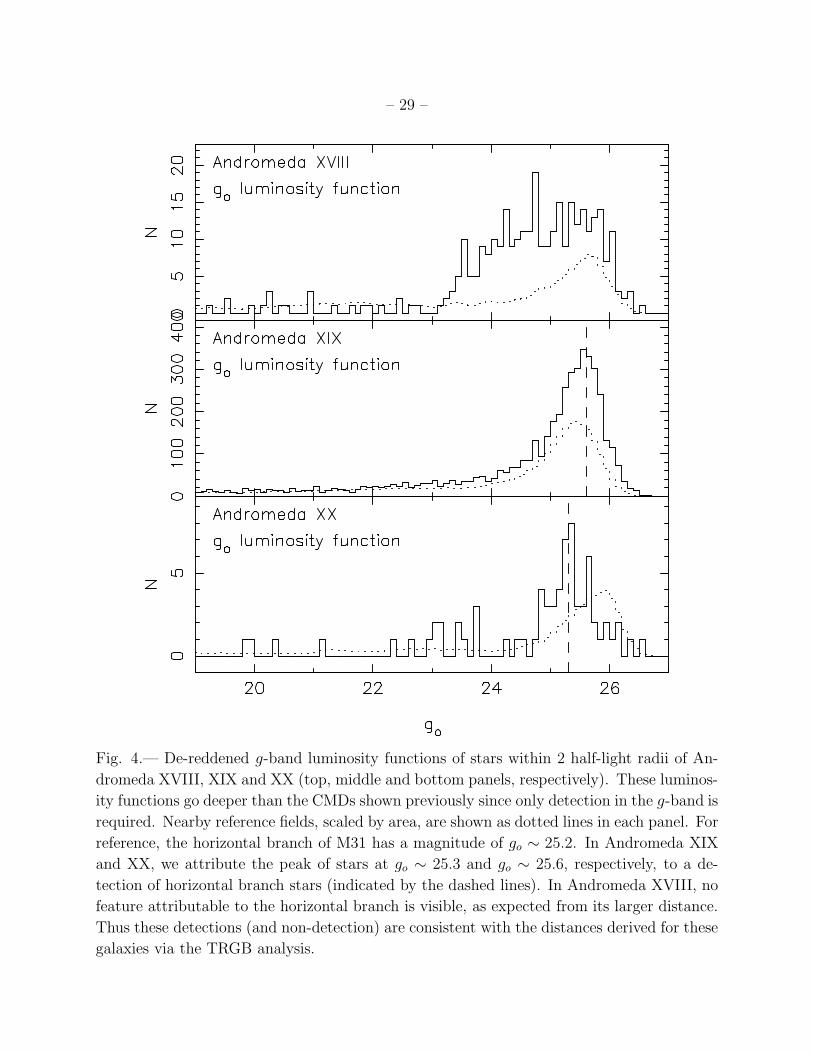
Fig. 4.— De-reddened g-band luminosity functions of stars within 2 half-light radii of An-
dromeda XVIII, XIX and XX (top, middle and bottom panels, respectively). These luminos-
ity functions go deeper than the CMDs shown previously since only detection in the g-band is
required. Nearby reference fields, scaled by area, are shown as dotted lines in each panel. For
reference, the horizontal branch of M31 has a magnitude of go ∼ 25.2. In Andromeda XIX
and XX, we attribute the peak of stars at go ∼ 25.3 and go ∼ 25.6, respectively, to a de-
tection of horizontal branch stars (indicated by the dashed lines). In Andromeda XVIII, no
feature attributable to the horizontal branch is visible, as expected from its larger distance.
Thus these detections (and non-detection) are consistent with the distances derived for these
galaxies via the TRGB analysis.
– 30 –
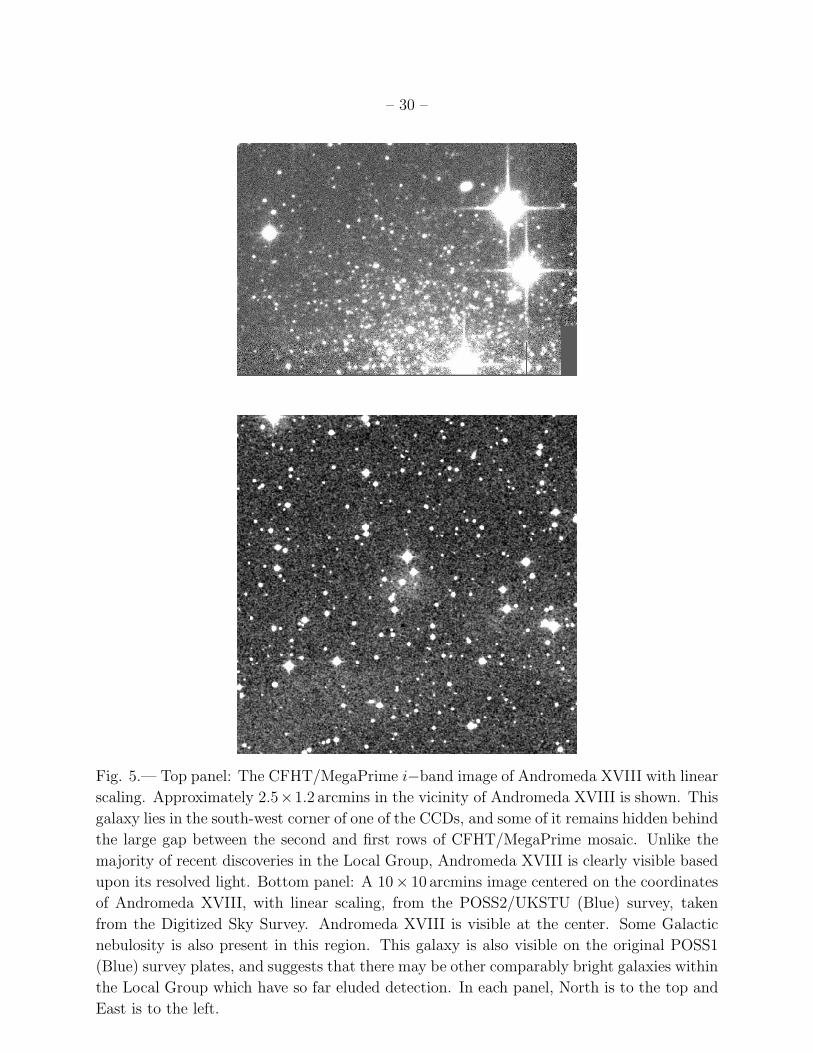
Fig. 5.— Top panel: The CFHT/MegaPrime i−band image of Andromeda XVIII with linear
scaling. Approximately 2.5×1.2 arcmins in the vicinity of Andromeda XVIII is shown. This
galaxy lies in the south-west corner of one of the CCDs, and some of it remains hidden behind
the large gap between the second and first rows of CFHT/MegaPrime mosaic. Unlike the
majority of recent discoveries in the Local Group, Andromeda XVIII is clearly visible based
upon its resolved light. Bottom panel: A 10× 10 arcmins image centered on the coordinates
of Andromeda XVIII, with linear scaling, from the POSS2/UKSTU (Blue) survey, taken
from the Digitized Sky Survey. Andromeda XVIII is visible at the center. Some Galactic
nebulosity is also present in this region. This galaxy is also visible on the original POSS1
(Blue) survey plates, and suggests that there may be other comparably bright galaxies within
the Local Group which have so far eluded detection. In each panel, North is to the top and
East is to the left.
– 31 –
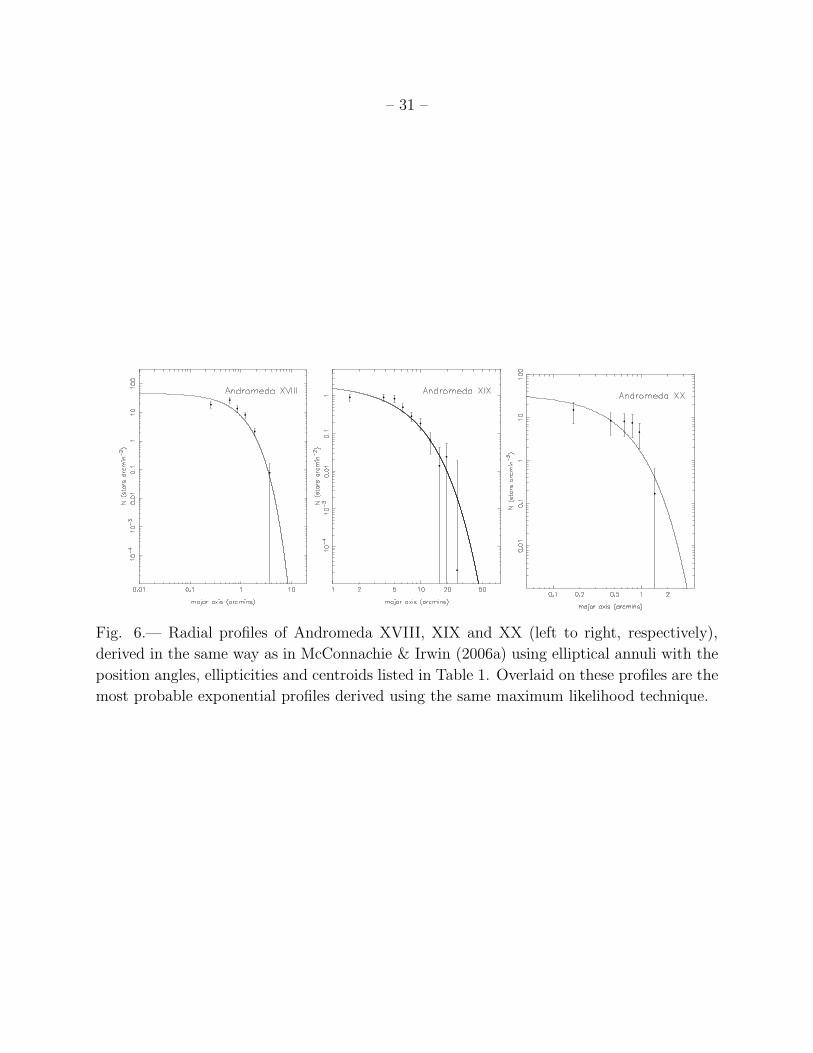
Fig. 6.— Radial profiles of Andromeda XVIII, XIX and XX (left to right, respectively),
derived in the same way as in McConnachie & Irwin (2006a) using elliptical annuli with the
position angles, ellipticities and centroids listed in Table 1. Overlaid on these profiles are the
most probable exponential profiles derived using the same maximum likelihood technique.
– 32 –
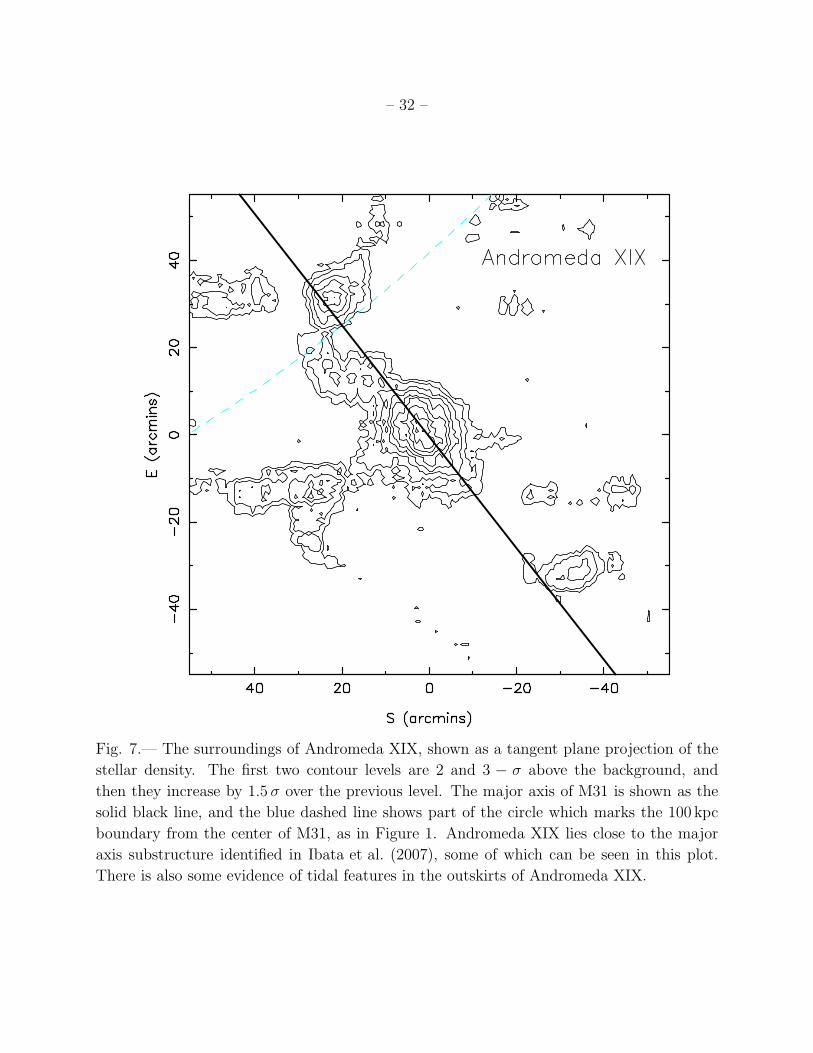
Fig. 7.— The surroundings of Andromeda XIX, shown as a tangent plane projection of the
stellar density. The first two contour levels are 2 and 3 − σ above the background, and
then they increase by 1.5 σ over the previous level. The major axis of M31 is shown as the
solid black line, and the blue dashed line shows part of the circle which marks the 100 kpc
boundary from the center of M31, as in Figure 1. Andromeda XIX lies close to the major
axis substructure identified in Ibata et al. (2007), some of which can be seen in this plot.
There is also some evidence of tidal features in the outskirts of Andromeda XIX.