Embed Size (px)
Citation preview

A Tracer Study on Employability and
Effectiveness of TVET Certificate Holders in
2011
December 2013.
RESEARCH TEAM
Mr. P.C.P.Jayathilake, Director (P&R)
Mr. H.G.K.N. Bandara, Assistant Director (P&R)
Ms. Priyanga Nanayakkara, Assistant Director (P&R)
Mr. Manoj Ganepola, Assistant Director (P&R)
Ms. K.T.Amarasinhe, CAA, (P&R)
(P & R Division- Tertiary and Vocational Education Commission)

Content
Page no
List of Tables і - іі
List of Figures ііі - іѵ
Foreword ѵ - ѵi
Abbreviations ѵ іі
Abstract (Executive Summary) ѵiii – Хi
Chapter 01: Introduction 01-08
1.1: Overview
1.2: General education and TVET systems in Sri Lanka.
1.3: NVQ framework.
1.4: Research Objectives
1.5: Research Methodology
1.5:1: literature survey
1.5:2: Population and sample.
1.5:3: Data Collection
1.5:4: Data analysis
1.6: Limitation of the Study
Chapter 02: literature review 10-19
2.1. Introduction
2.2 Findings from tracer studies conducted in Sri Lanka
2.3 Tracer Study on the students who have followed National Certificate of Engineering Craft
Practice course – 2000.
2.4 Study on Training delivery in Private/NGO Training Institutes in Sri Lanka
2.5 A Tracer Study on NVQ Certificate Holders
2.6 A Study on Changing Patterns of ICT (Information and Communication Technology)
Related Occupations in Labour Market of Sri Lanka.
2.7 Tracer Study for ICT NVQ Level 5 & 6 and NDICT Courses
2.8 Study on Employment of Trainees and Tracer Studies
Chapter 03: analysis of Data. 21-87
3.1.Overview.
3.2. Key findings.
Chapter 04: Conclusion and suggestions 87-92
04.1. Overview
04.2. Conclusion and final summary
04.3. Suggestions

i
List of Tables
Tables Page no.
3.1 Details of questionnaire posted and responses 22
3.2 Distribution of Total respondents by NVQ and Non NVQ 23
3.3 Distribution of Total NVQ and Non NVQ respondents by Gender 24
3.4 Distribution of Total NVQ and Non NVQ respondents by Province 25
3.5 Distribution of Total respondents by district 26
3.6 Distribution of Gender by province and district 28
3.7 Distribution of Total respondents by Gender 29
3.8 Distribution of Total respondents by age groups. 30
3.9 Distribution of Total respondent’s age range by province. 31
3.10 Distribution of Total respondents by marital status 32
3.11 Distribution of Total respondents by Educational Qualification 33
3.12 Distribution of respondents Education qualification by Gender 34
3.13 Distribution of Education qualification by Province 35
3.14 Distribution of Education qualifications by age range 37
3.15 Distribution of certificate holders by influence for joining
-TVET by Male Female (%) 38
3.16 Distribution of certificate holders by influence for joining TVET by Province 39
3.17 Distribution of Distance from home to the institute by province 40
3.18 Distribution of respondents by the ownership and by province. 41
3.19 Distribution of respondent by Gender by institutional ownership 42
3.20 Distribution of NVQ and Non NVQ respondents by institute 43
3.21 Distribution of NVQ and Non NVQ respondents by province 44
3.22 Distribution of certificate holders by employment 45
3.23 Current Employability by NVQ or Non NVQ 46
3.24 Current Employability by NVQ or Non NVQ 46
3.25 Current Employability by gender 47
3.26 Employability of NVQ and Non NVQ certificate holders by gender 48
3.27 Employability of responded NVQ certificate holders by Province 49
3.28 Employability of responded Non NVQ certificate holders by Province 50
3.29 Employability by educational qualification 51
3.30 Employability by age 52
ii
3.31 No. of Jobs after the training by province 53
3.32 No. of Jobs after the training by gender 54
3.33 Distribution of Current employability by Sector 55
3.34 Distribution of current occupational sector by gender 56
3.35 Distribution of current occupational sector by province 57
3.36 Distribution of Employed respondents by Job type 58
3.37 Distribution of employability of VT certificate holders by course duration 59
3.38 Distribution of employability of VT certificate holders by training course 60
3.39 Distribution of employability by Non NVQ Courses 64
3.40 Distribution of Employability by NVQ Courses 67
3.41 Does your Job relevant to VT 70
3.42 Does your VT relevant for the self employment by NVQ and Non NVQ 70
3.43 VT related to the Self employment by educational qualification. 72
3.44 Sufficiency of Vocational Training to perform on the job 73
3.45 Distribution of already employed respondents Monthly Income 74
3.46 Distribution of monthly income by training programmers 75
3.47 Distribution of employed respondents Monthly Income by province 78
3.48 Distribution of employed respondents Monthly Income by gender 79
3.49 Distribution of employed respondent’s Monthly income
-by educational qualification 80
3.50 Importance factors for career development of certificate holders 81
3.51 Duration of Unemployment by Educational Qualification 82
3.52 Duration of Unemployment by NVQ or Non NVQ. 83
3.53 Duration of Unemployment by Gender 84
3.54 No of application sent for jobs by Gender 85
3.55 No. of application sent for jobs by NVQ and Non NVQ. 86
3.56 Reason for Unemployment 87
iii
List of Figures
Figures Page no.
3.1 Details of questionnaire posted and responses 22
3.2 Distribution of Total respondents by NVQ or Non NVQ 23
3.3 Distribution of Total NVQ and Non NVQ respondents by Gender 24
3.4 Distribution of Total NVQ and Non NVQ respondents by Province 25
3.5 Distribution of Total respondents by district 27
3.6 Distribution of Total respondents by Gender 29
3.7 Distribution of Total respondents by age groups 30
3.8. Distribution of Total respondents of TVET certificate holders by Age 30
3.9. Distribution of age range of total respondents by province 31
3.10. Distribution of Total respondents by Marital Status 32
3.11. Distribution of Total respondents by Educational Qualification (%) 33
3.12. Distribution of Education qualification by Gender 34
3.13. Distribution of Education qualifications by Province as a percentage 35
3.14. Distribution of Education qualifications by Province 36
3.15. Distribution of Education qualifications by age range 37
3.16 Distribution of certificate holders by influence for joining
-TVET by Male Female (%) 38
3.17 Distribution of certificate holders, by influence for joining TVET 38
3.18 Distribution of certificate holders, by influence for joining TVET by Province 39
3.19 Distribution of certificate holders by distance from home to Institute. 40
3.20 Distribution of respondents training institute by province. 41
3.21 Distribution of respondents by Gender by institutional ownership 42
3.22 Distribution of NVQ and Non NVQ respondents by institute 43
3.23 Distribution of NVQ and Non NVQ respondents by province 44
3.24 Distribution of Total responded certificate holders by employment. (%) 45
3.25 Current Employability by NVQ or Non NVQ 46
3.26 Current Employability by NVQ or Non NVQ 47
3.27 Current Employability by gender 48
3.28 Employability of NVQ and Non NVQ certificate holders by gender 48
3.29 Employability of responded NVQ certificate holders by Province 49
3.30 Employability of responded Non NVQ certificate holders by Province 50

iv
3.31 Employability by educational qualification 51
3.32 Employability by age 52
3.33 No. of Jobs after the training by province 53
3.34 No. of Jobs after the training (%) 53
3.35 No. of Jobs after the training by gender 54
3.36 Distribution of Current employability by Sector 55
3.37 Distribution of current occupational sector by gender 56
3.38 Distribution of current occupational sector by province 57
3.39 Distributions of Employed respondents by Job type 58
3.40 Distribution of Employed respondents Job type by gender 58
3.41 Distribution of employability of VT certificate holders by course duration 59
3.42 Does your Job relevant to VT 70
3.43 Does your VT relevant for the self employment by NVQ and Non NVQ 71
3.44 VT related to the Self employment by educational qualification 72
3.45. Sufficiency of Vocational Training to perform on the job 73
3.46 Distribution of already employed respondents Monthly Income 74
3.47 Distribution of employed respondents Monthly Income by province 79
3.48 Distribution of employed respondents Monthly Income by gender 79
3.49. Distribution of employed respondent’s Monthly income by
Educational qualification 80
3.50 Duration of Unemployment by Educational Qualification 82
3.51 Duration of Unemployment by Educational Qualification (total) 82
3.52 Duration of Unemployment by NVQ or Non NVQ. 83
3.53 Duration of Unemployment by Gender 84
3.54 No of application sent for find a jobs 85
3.55 No. of application sent for jobs by NVQ and Non NVQ 86
3.56 Reason for Unemployment 87
v
Foreword
INTRODUCTION
Tracer studies are important as a way of understanding the relevance and quality of
programmes offered by the institutions as well as the labour market. It has been found that tracer
studies are the most important vehicle to build strong bonds between the Alma Mater and the
ever-increasing graduates. This is feasible through two perspectives. From one perspective, the
graduates are the rich source of feedback for improvements in the course curriculum, teaching,
research, extension, and networking. On the other, the tracer study helps to measure the extent of
professional careers pursued by the graduates after gaining knowledge and skill through
institutions. Starting from 2008 to date altogether 15 tracer studies have been conducted in
different formats by TVEC. The latest tracer study was conducted in 2012 targeting recent past
graduates of NDICT and NVQ L5&6 in the ICT sector. This tracer study also has employed
both parametric and non-parametric statistical tools in the data analysis and interpretation. The
total sample taken for this study was 350 ICT certificate holders who graduated in the year 2012.
Objectives of Tracer Study
In this Tracer Study we made connections between the ideas and methods of a handful of
studies that we knew about and used them as a basis to design this study. In some ways, the most
exciting outcomes from the studies were that they gave us insights into aspects of employability
of TVET students. Following are the three major objectives of this study.
To find out the employability of passed out trainees
To identify the demand for the skilled labor in different industry sectors
To identify the possible improvements in TVET sector.
There are a number of characteristics that distinguish these studies from conventional academic
research. One is that a Tracer Study starts from the objectives, goals and context of a programme
and sets out to learn from what is there – especially from the kinds of personal outcomes that

vi
participants reveal. A second characteristic is that the mass of information that results is often of
immediate use: knowing about its actual impact on people can be directly related to the
conceptualization and operation of a programme, changing or refining how effectiveness is
perceived, modifying or adding to the programme’s objectives, and perhaps fine-tuning
programme content or changing the ways in which it is structured and run. A third distinctive
characteristic is that a Tracer Study in this same spirit of sharing, learning and building new
knowledge, we encourage other organizations to take the ideas, principles, methods and
approaches described in this and apply them in their own contexts.
………………………………………………..
P.C.P. Jayathilake,
Director, P & R Division,
Tertiary and Vocational Education Commission.

vii
Abbreviations
DCS Department of Census and Statistics
DS Divisional Secretariat
DTET Department of Technical Education and Training
G.C.E.(A/L) General Certificate in Education (Advanced Level)
G.C.E.(O/L) General Certificate in Education (Ordinary Level)
CAA Computer Application Assistant
AD Assistant Director
D Director
GDP Gross Domestic Product
HR Human Resources
ICT Information and Communication Technology
ILO International Labour Organization
NGOs Non Governmental Organizations
MYASD Ministry of Youth Affairs and Skills Development
NAITA National Apprentice and Industrial Training Authority
NCS National Competency Standards
NGOs Non Governmental Organizations
NIBM National Institute of Business Management
NITAC National Industry Training Advisory Committee
NVQ National Vocational Qualifications
NYSC National Youth Services Council
OJT On the Job Training
RPL Recognition of Prior Learning
QMS Quality Management System
TVE Tertiary and Vocational Education
TVEC Tertiary and Vocational Education Commission
TVET Technical and Vocational Education and Training
VTA Vocational Training Authority
VTC Vocational Training Centre
UNIVOTEC University of Vocational Technology
SLIOP Sri Lanka Institute of Printing
SLITA Sri Lanka Institute of Textile and Apparel
CGTTI Ceylon German Technical Training Institute
GJRTI Gem and Jewelers Research and Training Institute CBSL Central Bank of Sri Lanka
CBT Competency Based Training
CLS Computer Literacy Survey
CoT College of Technology
SPSS Statistical package for social science

viii
Executive Summary
Sri Lankan Government is continuously working towards enhancing the human resource
development in the country to meet the ever increasing demand emanated from national and
international labor market looking for high quality skills. One of the major problems faced by
Sri Lanka is unemployment among educated and young people due to lack of competences
demanded by the labour market. The Technical and Vocational Education and Training system
in Sri Lanka provides opportunity for sustainable and strategic solutions for national training
needs as well as for the unemployment problem in both formal and non formal sectors and
supply the required human resources with right quality and relevance.
The objectives of this study are, to find the employability of passed out trainees and to identify
the possible improvements in TVET sector. Data was collected by using primary & secondary
sources. Postal survey method was adopted to collect primary data. Secondary data was
collected from various sources i.e. reports of TVEC and other institutions, web sites of TVET
organizations, Central bank annual reports of 2010 to 2012, Statistical abstracts of department
of census and statistics-2011, Publications of External Resource Department etc. Target
population was both NVQ and non NVQ certificate holders in Sri Lanka. The sampling frame
of the study is considered as all NVQ certificate holders from public sectors and selected 5000
Non NVQ Certificate holders in the year 2011 in Sri Lanka, who have under gone training in
government training institutes. Normal Response rate of the postal questionnaires is
approximately 18-20%. However, 4686 responses were received which is approximately 31.2%
of the sample. Data analysis has been done basically by quantitative methods using of SPSS and
cross tabulation and graphical methods also have been used for qualitative data.
These study findings are as follows,
As reasons for joining TVET, Influence of Parents (27%), friends (26%), and advertising (19%)
and Vocational awareness programs (15%) are most effective ways to attract youth for TVET.
Workshops (5%), radio and TV (2%), and other modes of advertizing including TVEC website
(1%) seem to be of very low effectiveness with the aggregate of 8%.
ix
The majority of respondents from both NVQ and Non NVQ are male (63%) and majority from
government VT centers (72%). Participation from Northern and Eastern provinces for vocational
education programmers are significantly less compared to western, Southern, Sabaragamuwa
and central provinces. The private vocational training institutes are offered more non NVQ
courses which is 70.4%. Highest number of respondents is from western province which is 1056
out of total responded persons of 4686. Other high response provinces are Southern (848),
Sabaragamuwa (449) and Central (371). Lowest number responded is from Northern Province
(143). Other low desponded provinces are North central, Uva, and Eastern with 208, 293 and
324 respectively.
The majority of the age group has fallen into the category of 15-29 which is 81.5%. And More
than 91% of certificate holders are less than 40 years of age. Majority of respondents have
passed GCE Advance Level which is 1485 and 3300 certificate holders have passed Ordinary
Level and above. Majority of the 15 – 29 age groups has passed GCE A /L and above which is
60.4%. Educational level of the younger groups is high when compared to the elderly group.
Most of certificate holders have not traveled more than 20 km from their residence which is 77
%.
In this study it is revealed that 2226 which is 47.5 % of the certificate holders are employed.
2460 TVET Certificate holders are unemployed which is 52.5 %. Employability of NVQ
certificate holders, 1361 were employed which is 50%. And 1343 were Unemployed which is
50%. And Employability of Non NVQ certificate holders, 667 were employed which is 48%.
709 were Unemployed which is 52%. However, there is no significant different in employability
of NVQ and non-NVQ holders.
Male employability is higher than female. Among male respondents, 1612 are employed which
is 55.8% and 1275 are unemployed which is 44.2%. From of female respondents, 589 are
employed which is 34.8% and 1102 are unemployed which is 65.2%. Employability of NVQ
certificate holders in Southern, Sabaragamuwa, North western, Eastern and Uva provinces have
shown high while Western, North Central, Northern and Central Provinces have shown high
unemployment. Western province unemployment rate is 56.3 % and Northern provinces
unemployment is 68.1%.

x
Data reveals that 59.4% of respondents with GCE A/L are unemployed and the percentage for
unemployment with degree and above is 64.3%. Conversely, most respondents with lower
educational qualifications seem to be employed. The employed rate for 1-5 Year education is
69.4% and up to GCE O/L is 55.5 %. Unemployment of 15-29 age group is 55.1%. Majority of
elders are employed. The employment rate of the age group of 30-40 is 64.8 % and that of above
40 is 68.9 %.
Respondents working in the private sector seem higher which around 44% is. Government,
NGO and self employment sector contributions are 29%, 13% and 14% respectively and those
employed on permanent basis is 41.1%. Percentage on casual basis is 38.1% and on contract is
20.8%. 769 certificate holders are drawing less than Rs.10000 salary per month which is 32%.
And 1318 are taken between Rs.10000 and Rs. 30 000 salary which is 56%. No. of 287 and 12
% are taken more than Rs.30 000 income per month. Among them 101 are earning more than
Rs.50 000 per month.
Highest numbers of responded certificate holders are reported from computer application
assistant course which amount is 328. Among them very few certificate holders are earning
more than R. 30 000 which is 19 certificate holders. Electrician, wood craftsman (furniture),
Welder, Automobile Mechanic, Computer hardware technician, Beautician, Computer graphic
designer, Motor cycle mechanic….etc have been reported highest respondent rates among the
certificate holders. Among them very few certificate holders are earned more than Rs. 30 000
which are 27, 22, 15, 8, 7, 5, 9, and 8 respectively.
Employability among both NVQ and Non NVQ courses, the highest numbers of responded
certificate holders are reported from computer application assistant course which amount are
692 and 171 respectively. Among NVQ category 457 certificate holders are Unemployed which
is 66% and 235 certificate holders are employed which is 34%. Among Non NVQ category 100
are Unemployed which is 58.5% and 71 are employed which is 41.5%. AAT, Accounting,
Tailor, Computer graphic designer and languages etc… also have shown high unemployment
rates. The high Employment rates have reported in Electrician (64.1%), wood craftsman
(furniture) (75.5%), welder (56.8%), Computer hardware technician (57.9%) etc.
Employability as course duration, the majority is reported 3-6 months duration which is 1248.
Among them 57% are unemployed and 43% employed. Among 3 months courses employment

xi
rate is 50.8%. Durations of 1-2 years have reported high employability rate which is 53.2% and
more than 2 years courses have reported 52.5% employability rate
.
49.2% of respondents have been waited for more than 2 years without a job. And also 22.7%
were waited between 1-2 years. 615 respondents out of 2460 responded certificate holders they
have sent 1-5 applications to find a job. Among them 233 are female and 382 are male. 175
female respondents they have sent more than 20 applications.

xii
Chapter 01:
Introduction
1
1.1. Overview
The Government of Sri Lanka has the responsibility to ensure the development of nationally and
internationally competent labour force in order to enhance the sustainable development of the
country. Under the guidance of the ministry of Youth Affairs and Skills Development, Tertiary
and Vocational Education Commission in the year 2004 has co-partnered the programme to
introduce National Vocational Qualification (NVQ) Framework in the TVET sector. The
Technical and Vocational Education and Training system in Sri Lanka provides the opportunity
for sustainable and strategic solutions for national training needs as well as for the
unemployment problem in both formal and non formal sectors and supply the required human
resources with right quality and relevance.
1.2. General education and TVET systems in Sri Lanka.
It is officially recorded that the Technical Education in Sri Lanka was initiated in the year 1893.
The specific event was the establishment of the very first technical training institute by the
government. From thereon, the Technical and Vocational Education and Training (TVET) have
developed to the present state. It is now estimated that there are about 5000 training institutions
in Sri Lanka belonging to government, private and nongovernmental organizations. Even today
the government plays a key role in providing training and education in TVET sector through a
number of government departments and Authorities. The Department of Technical Education
and Training (DTET), The National Apprentice and Industrial Training Authority (NAITA) and
Vocational Training Authority of Sri Lanka (VTA), National Youth Services Council (NYSC)
are the main institutes that are under the Ministry of Youth Affairs and Skills Development
where approximately 65,000 students are trained annually through their Training Centre network
located throughout the country. Institutional training and on the job training are the key methods
used by these organizations to train the students. In addition to these organizations, there are
other public institutions such as Department of Social Services, Ministry of Higher Education
and specialized institutes such as health sector paramedical, telecom, transport (road & railway)
training etc which operates in TVET sector in the country.
2
General education system, though a basic introduction to the world of work and technological
world given for the students at general certificate of education ordinary level (G.C.E. O/L ) is
not adequate for joining the technical workforce. Presently out of the total number of the
students who study G.C.E.(A/L) the students represent, 51% of arts, 27% of commerce, 22% of
math’s and science subjects. Thus, many students are studying arts.
One of the major problems faced by Sri Lanka is unemployment among arts graduates due to
lack of competences demanded by the labour market. The overall unemployment rate is 4% in
2012, and among educated people who have passed GCE Advance level and above
unemployment rate is 7.5% in 2012. Unemployment rate among young people i.e. age 15-19 is
18.9% and for age 20-29 it is 11.3%. The major reason is the mismatch in education system with
job opportunities in the labour market and is now a hindrance to the development effort.
Presently in Sri Lanka, the share of the industrial sector in total GDP has increased from 27.3%
in 2000 to 30.4 percent in 2012. And services sector has the fastest growth from 52.8 percent in
2000 to 58.5 Percent in 2012 in GDP contribution. Similarly, the employment share of industry
sector increased from 23.6% to 26.1% between 2000 and 2012. Service sector also increased
from 40.3% to 42.9% between 2000 and 2012 respectively.
1.3. NVQ framework.
Tertiary and Vocational Education Commission (TVEC) has taken steps to introduce a National
Vocational Qualification Framework since 2004 and established a Quality management system
of tertiary and vocational education in Sri Lanka. Therefore, nationally and internationally
recognized system to award qualifications on Tertiary & Vocational Education and Training for
those who seek certificates for employment and other purposes is available. The NVQ
framework has following key features;
Assurance of Quality training & education,
Industry based vocational training,
Equal accessibility and uniformity,
3
Competency Based Training (CBT) will remain as the major mode of delivery of vocational
training that is leading to offer qualifications under the NVQ framework. National Competency
Standards and curricula are developed as main guides.
TVEC is functioning as the central certificate-awarding agency for institutional and non-
institutional training. Under the Competency Based Training mode, certificates are issued to
those who successfully complete assessments at accredited training centers and also institutions
those registered under the TVEC. Recognition of Prior Learning (RPL) route, issues NVQ
certificates to those who have not attended a formal training.
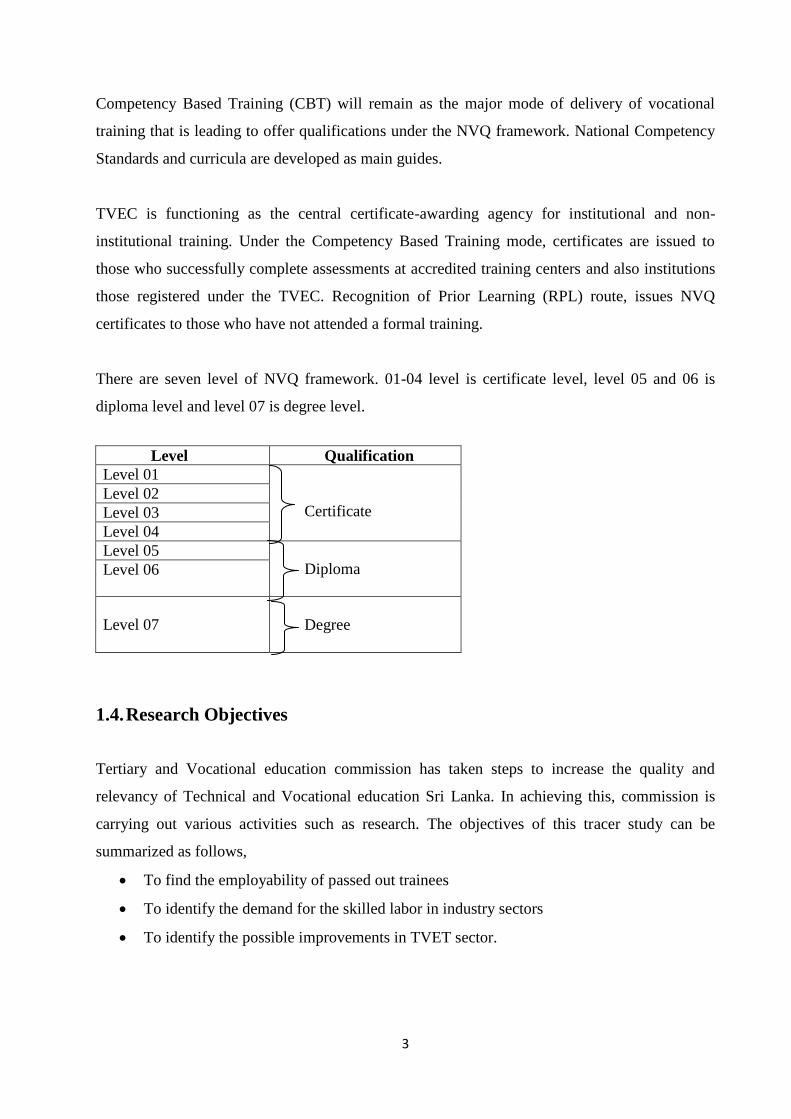
There are seven level of NVQ framework. 01-04 level is certificate level, level 05 and 06 is
diploma level and level 07 is degree level.
Level Qualification
Level 01
Certificate Level 02
Level 03
Level 04
Level 05
Diploma
Level 06
Level 07
Degree
1.4. Research Objectives
Tertiary and Vocational education commission has taken steps to increase the quality and
relevancy of Technical and Vocational education Sri Lanka. In achieving this, commission is
carrying out various activities such as research. The objectives of this tracer study can be
summarized as follows,
To find the employability of passed out trainees
To identify the demand for the skilled labor in industry sectors
To identify the possible improvements in TVET sector.
4
1.5. Research Methodology
This chapter describes the methodology followed in carrying out the research, which includes
1. Formulating the Research Problem
2. Extensive Literature Review
3. Developing the objectives
4. Preparing the Research Design including Sample Design
5. Collecting the Data
6. Analysis of Data
7. Interpretation
8. Preparation of the Report or Presentation of Results-Formal write ups of conclusions reached.
The questionnaire has been divided into three main parts. In the first part it attempted collecting
general information from vocational certificate holders and this part is compulsory for all
respondents. The second part is only for certificate holders who are already employed which is
employability focused. And third part is for currently unemployed certificate holders.
1.5.1: Literature Survey
At the first stage a literature survey was conducted in order to identify the employability and
effectiveness of TVET Certificate Holders in the Public Sector. Previous studies on
employability and effectiveness of TVET certificate holders in public sector discussed under the
literature review.
1.5.2: Population and Sample.
Target population was both NVQ and non NVQ certificate holders in Sri Lanka. The sampling
frame of the study is considered as all NVQ certificate holders from public sectors and selected
5000 non-NVQ Certificate holders in the year 2011 in Sri Lanka, who have Trained in
government training institutes. i.e. Department of Technical Education and Training (DTET),
National Youth Services Council (NYSC), Vocational Training Authority (VTA), National
Apprentice and Industrial Training Authority (NAITA), National Institute of Business
Management (NIBM), Sri Lanka Institute of Printing (SLIOP), Sri Lanka Institute of Textile and
5
Apparel (SLITA), Ceylon German Technical Training Institute (CGTTI), Gem and Jewellery
Research and Training Institute (GJRTI), and National Design centre.
The sample consists of around 10,000 NVQ certificate holders who have qualified both from
institutional and RPL mode and randomly selected 5000 non-NVQ certificate holders in the year
2011 from the public sector. The detailed list of the NVQ certificate holders was obtained from
the NVQ certificate database of the certificate division of TVEC and the detailed list of the non-
NVQ certificate holders was obtained from each institute mentioned above.
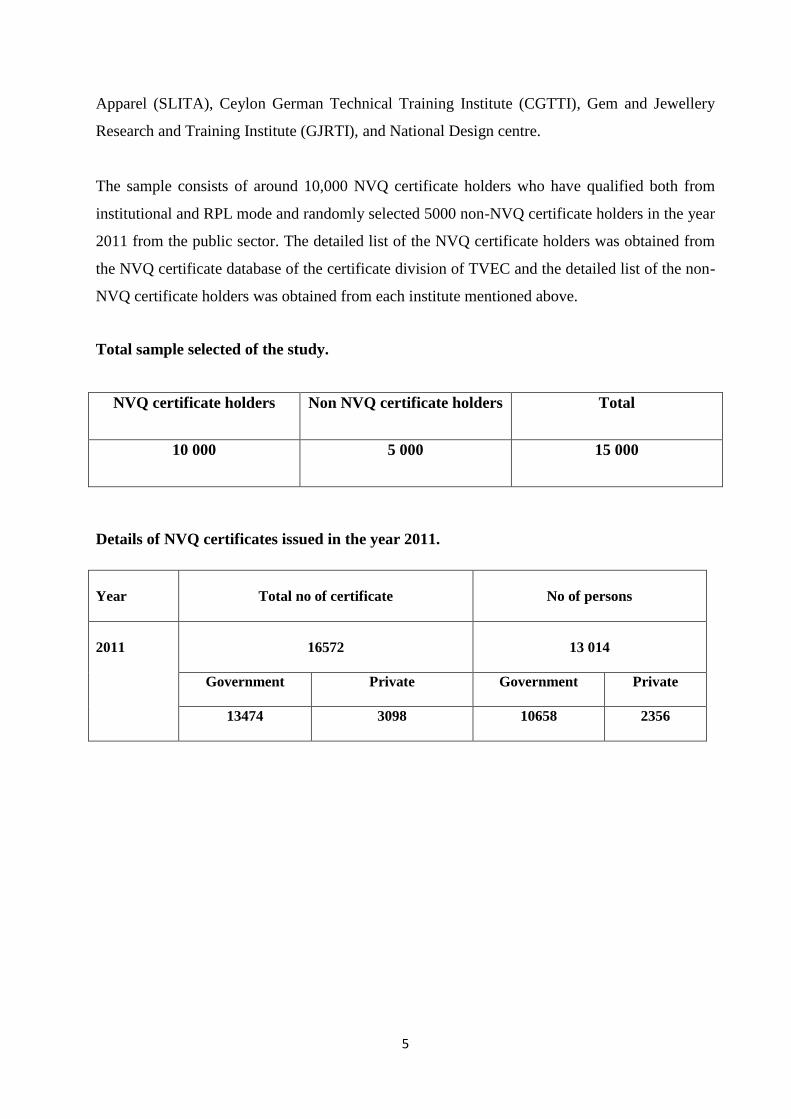
Total sample selected of the study.
NVQ certificate holders Non NVQ certificate holders Total
10 000 5 000 15 000
Details of NVQ certificates issued in the year 2011.
Year
Total no of certificate
No of persons
2011
16572
13 014
Government Private Government Private
13474 3098 10658 2356

6
Non-NVQ Certificate Holders Sample size and selection from public institutes
Institutes
No. of Non-
NVQ
Certificate
Holders
Selected
Sample
No. of Non-NVQ
Certificate
Holders
National Apprentice and Industrial Training
Authority (NAITA)
3619 402
Vocational Training Authority (VTA) 17,353 1929
National Youth Services Council (NYSC) 9246 1028
National Institute of Business Management
(NIBM)
2,367 263
Department of Technical Education and Training
(DTET)
10280 1142
Sri Lanka Institute of Printing (SLIOP) 469 52
Sri Lanka Institute of Textile and Apparel
(SLITA)
301 33
Ceylon German Technical Training Institute
(CGTTI) (CGTTI)
1,139 126
Gem and Jewellery Research and Training
Institute (GJRTI)
165 18
National Design centre 48 5
Total 44,987 5,000
The sample size was derived from the following formula
Sample=No of certificates of the institution
Total No of Certificates∗ Total sample size
E.g.-
3619 x 5000 = 402
44,987

7
Details of NVQ certificates issued in the year 2011.
NVQ Level RPL CBT Total
NVQ Level 01 0 2 2
NVQ Level 02 208 1920 2128
NVQ Level 03 1413 9943 11356
NVQ Level 04 375 2697 3072
NVQ Level 05 0 13 13
NVQ Level 06 0 1 1
NVQ Level 07 0 0 0
Total 1996 14576 16572
NVQ certificates issued since 2004 and Up to December 2011.
NVQ Level RPL CBT Total
NVQ Level 01 6 40 46
NVQ Level 02 593 6386 6979
NVQ Level 03 4414 28340 32754
NVQ Level 04 2014 9894 11908
NVQ Level 05 0 125 125
NVQ Level 06 0 38 38
NVQ Level 07 0 0 0
Total 7027 44823 51850
There were total of 16,572 NVQ certificates issued in the year 2011 which comprise 1,996
certificates issued through RPL mode and 14,576 certificates issued through institutional mode.
The totals of 51,850 NVQ certificates have been issued between 2004 and 2011. Among these
there were 7,027 certificates issued on RPL mode and 44,823 NVQ certificates issued on the
institutional mode. Recognition of the NVQ certificate by the industry is a vital indicator which
shows the effectiveness of TVET and therefore, the Planning and research division of TVEC
decided to conduct this tracer study to find out employability, effectiveness and behavior of the
labor market in terms of NVQ and Non NVQ certificate holders in Sri Lanka.
1.5.3: Data Collection
Postal survey method was adopted to collect primary data and as the main data collection
instrument, questionnaires were developed in Sinhala and Tamil medium and forwarded by post
to NVQ and Non NVQ certificate holders who have completed their training in 2011.

8
Before the actual survey, a pilot survey workshop in order to finalize the questionnaire was
conducted. Around 20 persons participated in the finalization process of the questionnaire.
Secondary data was collected from various sources i.e. reports of TVEC and other institutions,
web sites of TVET organizations, Central bank annual reports of 2010 to 2012, Statistical
abstracts of department of census and statistics-2011, published by External Resource
Department etc.
With regard to primary data, 15,000 Questionnaires have been sent to both NVQ and Non NVQ
certificate holders who have followed vocational training in the public sector in the year 2011.
Questionnaire was consisted of 24 overall questions comprised of structured questions as well as
open ended questions. This has been posted to the population of NVQ Certificate Holders and
the sample of 5000 of Non NVQ certificate holders and collected by post.
Normal Response rate of the postal questionnaires is approximately 18%. However, 4686
responses were received which is approximately 31.2% of the sample.
1.5.4: Data analysis
Data analysis has been done basically by quantitative methods using of SPSS and cross
tabulation and graphical methods also have been used for qualitative data.
1.6. Limitations of the Study
The study mainly focused here to identify the employability and effectiveness of training in the
public sector. Privet sector training certificate holders were excluded. Also, instead of the
population, a sample of 5000 of non NVQ certificate holders was considered and was limited to
year 2011.
9
Chapter 02.
Literature survey

10
2.1. Introduction
The purpose of this education is to enable interested parties to have a knowledge, skills and
values for achieving the country’s vision of attaining the status of fully developed nation in
terms of economic development, social justice and spiritual, moral and ethical strength, towards
creating a society that is united, democratic, liberal and dynamic ( Abu Bakar et al. 2009). In this
regard, the Sri Lankan National Vocational Education and Training seeks among other things to
deliver training that meets the requirements of the industry, thus making people employable; and
to provide initial training to school leavers to enhance their opportunities for employment and
self-employment. When rising demand for skills is not met by supply, the result is a persistent
shortage of skilled labour and constrained growth. The root of the shortage of skilled labour can
be traced by antiquated and unresponsive training mechanisms of vocational and technical
systems that are not providing new entrants with appropriate skills.
It is however widely believed that the training system in Sri Lanka is still out of sync with the
economy and the labour market. This requires that the linkage between the economy and labour
market should be understood and requires of industries to communicate to Government to enable
it to assist in the development of future skills and career development policies. To ascertain the
importance of training to the economy and the labour market, tracer studies are necessary.
Tracer studies are generally defined as surveys of graduates from institutions in
education/training and are often seen as an important tool of institutional development especially
when the world of work is changing rapidly. From information provided by tracer studies, the
training institutions can get a systematic feedback from their former students. Institutions can
know the whereabouts of their graduates; their working conditions and their retrospective
assessment of their course of study might stimulate the curricular assessment and could be also
very interesting for the current or later students (Schomburg, 2003). Tracer Studies provide
quantitative-structural data on employment and career, the character of work and related
competencies and information on the professional orientation and experiences of their graduates
(Millington, 2008). Guzman et al (2008) advocated for the use of a graduate tracer study as an
appropriate tool in determining institutional capability in preparing graduates to meet the
demands of the work place. The graduate tracer studies involves the determination of graduates
in the job search mode, lead time and employment condition, where the knowledge acquired in
schools are used to work, in promotions, and job satisfaction (Guzman et al, 2008).
11
2.2 Findings from tracer studies conducted in Sri Lanka
A Number of tracer studies have been conducted in Sri Lanka is limited. Department of
Technical Education and Training conducted a tracer study in 2005 on trends in employment of
graduates who have followed the National Certificate of Engineering Craft Practice
(NCECP) courses of electronics, industrial electrician, fitter machinist and gas & arc
welder in technical colleges
This Study was conducted by Department of Technical Education and Training in Sri Lanka.
This study has attempted to find out the employability of graduates who have followed National
Certificate of Engineering Craft Practice (NCECP) courses of electronics, industrial electrician,
fitter machinist and gas & arc welder at Technical colleges in 2005.
Perspective of this research study was to unveil the level of employability of the students
(Employment /Self employment/ Unemployment/ Underemployment), satisfaction of students
about the courses, income and intention for higher studies.
Although the total population has been considered for the study, respondent rate existed as
11.43% of the sample. Numeric value is 106. Hence, the analysis has been done based on the
respondent rate.
Employability after graduation
Apparently around 63% of the sample is employed and 24% among them are employed on
permanent basis. 33% is employed on daily paid, temporary or part-time basis. The majority of
the employed represent this category. Intention for self employment among passed outs is
significantly low as it remains 6% of the sample.
Around 35% of passed outs had to spend over one year time to be employed. Around 38% of the
sample says that they are unemployed. Majority are being unemployed for 20 months after the
completion of courses. Difficulty of finding a job relevant to the course that they have followed
and the alienation between the available jobs and inadequate salary were unveiled as major
reasons behind the unemployment.
12
Sector wise analysis of employment of passed outs revealed following facts. 38% of passed outs
are employed in the private sector. Tendency of getting employed in both government and semi
government sectors are comparatively low as it is denoted 7%. Over 10% has engaged with
communication industry and this is the main industry that the majority is involved. Secondly,
passed outs have occupied with electrical industry. It is over 8% of the total sample.
Relevance of the course with employment
24% of the respondents stated that the course that they have followed has been the basic
qualification to find a job or start a self employment. 16% have said that it had been an
additional qualification for their employment. Only 0.9% has said that the course they followed
was not effective for their employment. As a whole 41% have said the effectiveness of the
course they followed is positive in finding a job or start a self employment.
Course content or the theoretical and practical knowledge disseminated by all four streams is
highly sufficient for the job that they are engaged; said by 33%. 29% said that the theoretical
and practical knowledge of the course is sufficient for some extent for their jobs. Amidst 1%
said the knowledge derived from the course is not sufficient for their jobs. Hence, it is obvious
that the theoretical and practical knowledge of the course is sufficient for their employment as
the percentage is over 62. As well as 43% of employers are well satisfied or satisfied with the
capabilities of employees.
Satisfaction with wages
Only 13% of respondents were receiving over Rs. 15000.00 as their monthly income and 3%
among them are receiving over Rs. 20000.00 per month. 47% receives less than Rs. 15000.00 as
their monthly income. 18% of them are in below of Rs. 7000.00 per month. Hence, it is clear
majority were not satisfied with their wages.
Intention for further education under the NVQ system
Around 40% of passed outs have followed other courses or training programmes after the
completion of their NCECP course. 17% of passed outs from NCECP course have followed
courses aligned with NVQ system. Only 32% have got the awareness of National Vocational
Qualification system. The tendency for selection of NVQ courses as further education is
significantly low. 34% of respondents considered the NCECP course that they followed had

13
been a basic qualification for their further education and 10% said that the NCEP course was an
additional qualification for their further education.
2.3. Tracer Study on the students who have followed National Certificate of
Engineering Craft Practice course – 2000.
In 1990, the amateur craftsmanship course which was introduced in early 1960 has been
modernized with the commitment of National Institute of Technical Education of Sri Lanka. It
was increased up to 13 subjects with the reforms and the course name also changed as
Engineering Crafts Practice. This new course is being taught at 28 Technical Colleges out of 36
which are governed by the Department of Technical Education and Training. Creating new job
opportunities in Industrial and Business sector was the intention behind the reform of this course
and the study focused on whether the expectations have been fulfilled or not.
The method of the research has been developed based on the previous studies and research
works which had been taken place. How many of passed outs have been employed and what are
the institutions they have been working, relevancy of jobs and education that they have obtained,
nature of the jobs, duration spent between the completion of education and being employed,
check the attitudes of their employers on their workability were expected to realize through the
study. Even though, there were 3600 passed outs for consecutive 4 years since the beginning of
this new courses, it was selected the batch passed out in the year 2000 and the total population
was 691. The data were collected by a postal questionnaire. In addition to that, interviews were
conducted with principals and academic staff of Technical Colleges to obtain some information.
These data were analyzed by using valid percents and chi squared methods.
Findings of the study unveiled that the tendency of employment has not been changed though
the course was modernized and the level of income has slightly increased among the employees.
Majority of graduates have stated that the course they followed is relevant for their employment.
But it has been revealed that most of them have got extra training opportunities from their
workplaces. Majority of the students are satisfied about the courses and the content of the course
is more suitable for the business sector.
14
2.4. Study on Training delivery in Private/NGO Training Institutes in Sri
Lanka
This research was conducted by the standards & accreditation division of Tertiary and
Vocational Education Commission in 2010. That study had been reviewed and edited by the
Research Cell of the TVEC on 18th January 2010.
This research study was conducted to identify effectiveness of training delivery and also factors
considered to enhance the quality of the training delivery in registered private/NGO training
institutions in Sri Lanka. Meanwhile, it was intended to evaluate the standards or conditions of
the training environment of the training institutions. And also this helped to find out the
suitability of qualifications of the trainers to conduct the courses and to recognize the way of
upgrading skills of trainers.
In this research, only registered training institutes were considered. There were 406 private
training institutes registered under TVEC and 200 of them were situated in the Western
Province. 190 courses conducted by Private sector training organizations have been accredited
and 79 courses out of them were in the Western Province. Nearly 30 training institutes in five
provinces have been selected to collect the data.
According to the findings of the study, 62 percent trainees and 95% passed out trainees have
mentioned that the quality of the training delivery was excellent. Meanwhile, 41% passed out
trainees were employed and 78% of them have obtained jobs related to the field of training. 10%
of passed out trainees had mentioned that the courses followed by them were highly supported to
obtain a job. It is very important to mention that the age of the trainees was varied from 16-55
years. Highest vocational qualification of 14 trainers was certificate level, 10 trainers were
Diploma level, two were Degree level and one trainer was Post Graduate Diploma level.
Nineteen trainers were conducting courses related to their vocational qualifications. One trainer
mentioned that he was conducting the course not related to his qualification. According to
trainees view more training methods and media have been used for the training by the trainers
and those were excellent. They mentioned that the theory hours per week varied from 2-35 and
practical hours varied from 2-50 hours.

15
According to the conclusion of the report, delivery of training in the private training institutes
are satisfied in accordance with criteria used to accredit the courses and trainees received quality
training from them. Therefore, private training institutes have contributed to technical and
vocational training sector to fulfill the requirements of the labor market. Following
recommendations were presented based on data analyzing:
• Motivate Private Training Institutes to conduct the NVQ courses and accredit the courses
• Aware school Leavers about the NVQ courses and NVQ system and its benefits.
• Aware society to get accepted certificate through following courses in the registered institution
• Aware head of the Institute about the Course accreditation and its benefits
• Train the trainers to get course accreditation
• Develop NVQ documents to other fields also
• Identify system to accredit non- NVQ courses also
2.5. A Tracer Study on NVQ Certificate Holders
This research conducted by information system division at Tertiary and Vocational Education
Commission in 2011. The sampling frame of the study is considered as all the NVQ certificate
holders from public and private and NGO sector up to December 2010. The total sample size for
the study was 8,400. Postal questionnaire survey method was used for this research.
This study focused attention on age distribution of the NVQ certificate holders. It can be
concluded that there is a higher tendency of looking for NVQ at young ages. The average age of
the NVQ certificate holder is 27 years. As 80 percent of NVQ holders are males it is clear that
the TVET sector courses are male dominated. Therefore females are less like to looking for a
vocational or technical qualification than males.
The important feature is that Western province produces the majority of NVQ certificate
holders. The war affected Northern and Eastern provinces produce less than 5 percent, lower
percentages of NVQ certificate holders. The study revealed that manufacturing sector has
produced highest percentage of NVQ certificate holders.
16
As shown in the analysis, only 5.4 percent from all respondents found another job with a higher
salary. It has been seen that 20.7% of NVQ certificate holders were able to find new jobs with
the help of National Vocational Qualification. From all respondents 31.2 percent of NVQ
certificate holders were able to go for higher qualification studies. About 13 percent of CBT
training receivers stated that on-the-job training at the work place is not useful. It has been
observed that majority of NVQ holders have some type of employment.
From RPL mode certificate holders 53 percent have waged employment. For CBT mode it is
48.3 percent. It has been seen that from all employees 58 percent say that their jobs were not
solely because of the NVQ qualifications. For NVQ certificate holders private sector job
openings are higher. 31.7 percent have stated that they have entered to employers/own account
worker category through the NVQ training. More than 35 percent of employers/own account
workers have stated that selection of the job is their interest.
Majority of NVQ certificate holders earning range is Rs. 5,001 -15,000. Out of all employed
NVQ certificate holders 62.9 percent stated that their job relate to the NVQ. Majority employed
NVQ certificate holders (57%) have stated that the qualification is enough or more than enough
in order to do the current job successfully. The research team concluded that even though the
employability is considerably high among the NVQ certificate holders, still there is a possibility of
unemployment among them.
2.6. A Study on Changing Patterns of ICT (Information and Communication
Technology) Related Occupations in Labour Market of Sri Lanka.
This research was conducted by information system division at Tertiary and Vocational
Education Commission in 2010.
The main objectives of this study were, to identify the changing patterns of ICT related
occupations and to identify the knowledge and skill gaps between current and expected level in

17
ICT related occupations. In this study, organizations that work on ICT projects are very few
compared to the total ICT workforce, which distributed mostly among the non ICT
organizations in Sri Lanka.
Simple Random Sampling procedure was adopted for each district Colombo, Kandy & Galle to
select a sample of 250 organizations including IT companies, Non-IT companies and
Government sector.
According to the survey, it has found that male contribution is higher than female contribution in
ICT related occupations. When considering professional qualifications of the ICT labour market,
Diploma holders contribute to half of the total and equal percentages from male and female.
When employment sector is considered, the Private sector contribution is the highest with higher
male contribution in the private sector ICT occupations.
57 percent of male ICT related workers were engaged in private sector while 49 percent of
females were in government sector, 68 percent of male ICT related workers were in executive
and professional level jobs, about 60 percent of female ICT related workers were in technical
and clerical related jobs, 68 percent of ICT related workers were permanent in their job while 24
percent were temporary, about 86 percent of ICT related workers are satisfy in their job as
revealed from the study.
2.7. Tracer Study for ICT NVQ Level 5 & 6 and NDICT Courses
This research conducted by information system division at tertiary and vocational education
commission in 2013. In this study attempt to Analysis of the current employment status of
NDICT and NVQ 5 & 6 holders in ICT sector. Under the Research method total sample were
selected 350 ICT certificate holders. Stratified sampling techniques were used to select the
sample. And Used Postal questionnaire survey method In addition to that secondary data was
considered. SPSS package used to analyze the data. Graphs and tables were used to represent the
output.
Findings of the study as fallows,
Only few, 4.3 percent were fund high salary jobs. From all respondents 29.3 percent of NVQ
certificate holders were able to go for higher qualification studies. When percentage distribution
of employment status of the respondents is considered, 41.3 % employed. From the employed
18
population, 66 percent worked in ICT related jobs while 34 percent worked in non ICT related
jobs. The average salary of NVQ level 5 and 6/NDICT qualified persons in salary range of Rs.
10,001 -20,000. According to reasons for dissatisfaction, most responded with salary were not
up to expected level and work not related to the qualification. From the sample, 84.2 accepted
that their working environment is good, which is a positive factor in improved working
environments. 53 persons who don’t do jobs 56.6 percent says that they were unable to find a
job. 37.7 percent of certificate holders are doing studies.
In this research following recommendations were presented based on data analyzing,
Expand ICT diploma level courses to Northern, Eastern, North central and Uva provinces to
avoid low participation in ICT Education, Further strengthen OJT component to cover all
students with relevant training, Improve private sector training places for OJT rather than public
sector, Avoid OJT places only with Word Processing, Data Entry and Clerical work, Standardize
ICT sector labour market with proper designations, defining job roles and improving quality and
relevancy, Improve ICT related job opportunities through career guidance and conduct labour
market surveys to focus training more towards usable competencies.
2.8. Study on Employment of Trainees.
This research conducted by Technical Education Development Project, Ministry of Vocational
and Technical Training in 2008.Objectives of the Tracer Study related this study were,
Analysis of the current employment status of trainees in different disciplines, Analysis of the
absorption patterns of the trainees in different sectors of employment, Analysis of the pattern
and the rate of absorption of trainees into the labour market, Identification of the obstacles faced
by the trainees in the process of securing jobs in the labour market, Identification of gaps as
observed by employers and trainees including mismatch between industry acceptances and skills
of trainees.
Under the Research method both qualitative and quantitative data collected by using the
questionnaires, interview formats, and observation schedules and at focus group discussions.
Sample was selected as, 33 employers were interviewed at their industry and 65 employees were
interviewed. These employers and employees employed by them were interviewed at the
industry premises by the consultants using interview formats. Visited the consultants and
conducted discussions with Principals/Heads of Institutes and Senior Instructors. Postal
questionnaire survey method was used for collect data.
19
Research finding related our research as follows,
Twenty seven percent of the vocational pass outs have to take full responsibility for their family
expenditure as they are the only wage earners in the family. Seventy percent of the households
have either one or two wage earners only. Fifty three percent of the vocational pass outs of the
sample are employed in private sector. This is about three times the number employed by
government sector.
The waiting time for employment among the 99 unemployed varies from 1 year to 6 years. Data
reveals that the unemployed 99 vocational pass outs includes 4 waiting for employment for 6
years, 9 waiting for 5 years, 11 waiting for 4 years, 19 waiting for 3 years, 24 waiting for 2 years
15 waiting for 1 year and lastly 17 waiting for employment to date since completion of training
in 2008.
It is revealed that nearly 50% of the employees spend less than 25 % of their earnings on the
family. 5% of the employees spend over 75% of their earning on the family, Eighty two percent
of the employees spend less than 50% of their earnings on personal up keep, Seventy out of the
84 employees who were interviewed have said that they can save less than 25% of the earnings
for future use. Some of the employees are registered with further education courses while being
employed. Sixty five percent of the employees spend less than 25% of their earnings on further
education courses. At interviews with 84 employees it was revealed that 29 (35%) employees
are registered with part-time higher education courses at different institutes.
Nearly 81% of the vocational pass outs find employment after training without much waiting
time the trained persons absorbed into the automobile industry are automobile mechanics,
automobile electricians, automobile air condition technicians or automobile painters. Those
absorbed into building industry are masons, carpenters, electricians and plumbers. Over 50% of
the technically trained graduates are absorbed into automobile and building industries.
Some of the specific machinery and tools that were not covered at the training are listed by the
employees. A comparatively high percentage of employees have acquired the competencies that
are needed at employment, Sixty eight percent of the employees have said the mismatch
between employer requirements and training skills gathered at the Technical Training Institute is
nil or at a very low extent. Only 33% have said that there is mismatch. Data reveals that 77% of
the employees are in favor of upgrading their knowledge and skills to meet the employer
demand.

20
High percentage of NAITA pass outs is observed to possess by employers on the two fields,
‘Soft skills & Good Attitude’ and ‘Practical Skills required at Industry’. Likewise, high
percentage of NYSC pass outs is observed to possess by employers on the two fields
‘Commitment & Flexibility to adopt’ and ‘Soft skills & Good attitudes’
Out of the 112 responses given by 49 employers, nineteen responses indicated the need for
welders. Thirty-six responses out of 112 (32%) are on automobile related trades. Assessing the
future needs of employers, out of 112 responses, seventeen clearly indicated that the employers
like to employ vocational pass outs in the electrician trade. This study identifies the vocational
trainees in the electrician trade as the second highest demanding category in the future labour
market.

21
Chapter 03.
Data analysis.

22
3.1. Overview.
The survey was conducted by means of postal survey using prepared structured questionnaire to
collect data. Total sample size was 15 000 out of which 10 000 are NVQ certificate holders and
5000 are Non NVQ certificate holders. The responded number is 4686 and the rate is 31% which
is significantly high. To analyze data findings SPSS package was used for graphical
representations in this chapter. The key findings of this study try to explore the relationship
between employability and effectiveness of Tertiary and Vocational education training
certificate holders.
3.2. Key findings.
According to table 3.1, in this tracer survey total response rate is 31.2 % of the total sample
which is respectively high compared to other similar postal surveys.
Table-3.1. details of questionnaire posted and responses
Total Questionnaire
posted
Total responded amounts Responses percentage
NVQ 10 000 2704 27.04
Non NVQ 5000 1376 27.52
Not Indicated - 606 04.04
Total 15 000 4686 31.2
Source- tracer survey details 2013.
Figure-3.1. details of questionnaire posted and responses
Source- tracer survey details 2013.
10000
5000
0
27
04
13
76
60
6
0
2000
4000
6000
8000
10000
12000
NVO Non NVQ No responded
Selected sample
Responses

23
Above 3.1 table and figure shows total of 6686 response received. Numbers of 2704 represent
NVQ, as a percentage 27 and Non NVQ certificate holders responded 1376, as percentage 27.5.
Only 606 training holders as a percentage 04 have not given whether they are NVQ or Non
NVQ category.
Table-3.2. Distribution of Total respondents by NVQ and Non NVQ
Number Percent Valid Percent
Non NVQ 1376 29.4 33.7
NVQ 2704 57.7 66.3
Total 4080 87.1 100.0
Not Mention 606 12.9
Total 4686 100.0
Source- tracer survey details 2013.
Figure-3.2. Distribution of Total respondents by NVQ or Non NVQ
Source- tracer survey details 2013.
Above 3.2 table and 3.2 figure based is on the findings of the study. The total number of
valid sample is 4080 which is the total respondents of both NVQ and Non NVQ. The other
606 is ignored as it is fallen in to non categorical data. It’s 66.3% and 33.7% of the
responded sample of NVQ and Non NVQ certificate holders respectively.
0
500
1000
1500
2000
2500
3000
1376
2704
606
Non NVQ
NVQ
Not Mention

24
Table-3.3. Distribution of Total NVQ and Non NVQ respondents by Gender
Gender Non NVQ %
NVQ %
Total %
Female 529 38.4 961 35.5 1490 36.5
Male 827 60.1 1719 63.6 2546 62.5
Not
specified 20
1.5 24
1.9 44
1.0
Total 1376 100
2704 100
4080
100
Source- tracer survey details 2013.
Figure-3.3. Distribution of Total NVQ and Non NVQ respondents by Gender
Source- tracer survey details 2013.
Above 3.3 table and 3.3 figure shows that Distribution of total NVQ and Non NVQ
respondents by Gender. The majority of Both NVQ responses and Non NVQ responses are
male certificate holders which is 63%. Female represent of this study is 37 percent which is
not represented in general demographics of Sri Lanka. There for promoting female
population to study in TVET is essential.
0
500
1000
1500
2000
2500
3000
Female Male Not Specified
96
1
17
19
24
52
9
82
7
20
14
90
25
46
44
NVQ
Non NVQ
Total
25
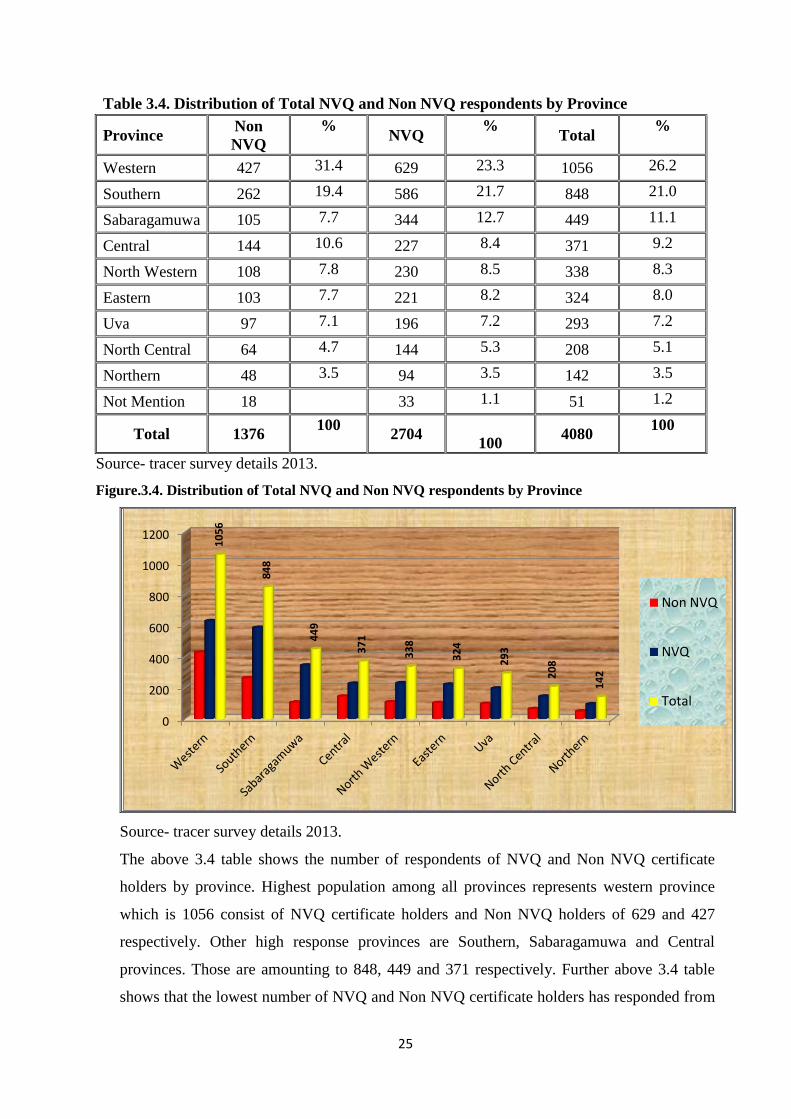
Table 3.4. Distribution of Total NVQ and Non NVQ respondents by Province
Province Non
NVQ
% NVQ
% Total
%
Western 427 31.4 629 23.3 1056 26.2
Southern 262 19.4 586 21.7 848 21.0
Sabaragamuwa 105 7.7 344 12.7 449 11.1
Central 144 10.6 227 8.4 371 9.2
North Western 108 7.8 230 8.5 338 8.3
Eastern 103 7.7 221 8.2 324 8.0
Uva 97 7.1 196 7.2 293 7.2
North Central 64 4.7 144 5.3 208 5.1
Northern 48 3.5 94 3.5 142 3.5
Not Mention 18 33 1.1 51 1.2
Total 1376 100
2704
100 4080
100
Source- tracer survey details 2013.
Figure.3.4. Distribution of Total NVQ and Non NVQ respondents by Province
Source- tracer survey details 2013.
The above 3.4 table shows the number of respondents of NVQ and Non NVQ certificate
holders by province. Highest population among all provinces represents western province
which is 1056 consist of NVQ certificate holders and Non NVQ holders of 629 and 427
respectively. Other high response provinces are Southern, Sabaragamuwa and Central
provinces. Those are amounting to 848, 449 and 371 respectively. Further above 3.4 table
shows that the lowest number of NVQ and Non NVQ certificate holders has responded from
0
200
400
600
800
1000
1200
10
56
84
8
44
9
37
1
33
8
32
4
29
3
20
8
14
2
Non NVQ
NVQ
Total

26
Northern Province which is 142. Other low response provinces are North central, Uva, and
Eastern. Those amounting to 208, 293 and 324 respectively.
Table-3.5. Distribution of Total respondents by district
District Number Percent Valid Percent
Colombo 342 7.3 7.5
Gampaha 468 10.0 10.2
Kalutara 373 8.0 8.2
Kandy 226 4.8 4.9
Matale 116 2.5 2.5
Nuwara Eliya 97 2.1 2.1
Galle 398 8.5 8.7
Matara 307 6.6 6.7
Hambantota 243 5.2 5.3
Jaffna 79 1.7 1.7
Mannar 24 .5 .5
Vavuniya 15 .3 .3
Mulativu 22 .5 .5
Kilinochchi 23 .5 .5
Batticaloa 58 1.2 1.3
Ampara 266 5.7 5.8
Trincomalee 42 .9 .9
Kurunegala 297 6.3 6.5
Puttalam 81 1.7 1.8
Anuradhapura 149 3.2 3.3
Polonnaruwa 106 2.3 2.3
Badulla 224 4.8 4.9
Monaragala 118 2.5 2.6
Rathnapura 241 5.1 5.3
Kegalle 257 5.5 5.6
Total 4572 97.6 100.0
System (missing) 114 2.4
Total 4686 100.0
Source- tracer survey details 2013.

27
Figure-3.5. Distribution of Total respondents by district
Source- tracer survey details 2013.
The table 3.5 shows the responded numbers of both NVQ and Non NVQ certificate holders
and distribution by districts. Among certificate holders 4572 out of total respondents of 4686
have specified their province which is 97.6% and 114 training holders which is 2.4% have
not specified. The highest number of respondents is from Gampaha district which is 468
(10.2%) and the lowest amount of respondents is reported from Vauniya district. It is
amounted to 15 and as a percentage 0.3. However, it shows that eastern and Northern
Provinces have low respondent rate as well. i.e. vauniya-0.3%, Mulative-0.5%, kilinochchi-
0.5%, batticalo-1.2% and Trincomalee-0.9%. This shows that more attention is required for
these areas.
0
50
100
150
200
250
300
350
400
450
500 Colombo
Gampaha
Kalutara
Kandy
Matale
Nuwara Eliya
Galle
Matara
Hambantota
Jaffna
Mannar
Vavuniya
Mulativu
Kilinochchi
Batticaloa
Ampara
Trincomalee
Kurunegala
Puttalam
Anuradhapura
Polonnaruwa
Badulla
Monaragala
Rathnapura
Kegalle

28
Table-3.6. Distribution of Gender by province and district
Province District Female Male Total Provincial
Total
Western
Colombo 149 179 342
1183 Gampaha 127 340 468
Kalutara 133 240 373
Central
Kandy 47 179 226
439 Matale 45 71 116
Nuwara
Eliya 38 58 97
Southern
Galle 160 237 398
948 Matara 132 175 307
Hambantota 100 142 243
Northern
Jaffna 42 37 79
163
Mannar 3 21 24
Vavuniya 3 12 15
Mulativu 4 18 22
Kilinochchi 4 19 23
Eastern
Batticaloa 41 16 58
366 Ampara 114 151 266
Trincomalee 12 30 42
North Western Kurunegala 86 210 297
378 Puttalam 37 44 81
North Central Anuradhapura 58 91 149
255 Polonnaruwa 39 67 106
Uva Badulla 54 169 224
342 Monaragala 39 79 118
Sabaragamuwa Rathnapura 109 132 241
498 Kegalle 100 155 257
Not mentioned
15 15 30 30
Total 1691 2887 4578 4578
Not Specified 108 108
Grand Total 4686 4686
Source- tracer survey details 2013.

29
According to table 3.6 based on the findings of this study it is a visible factor that
participation from northern and eastern province for vocational education programmed are
significantly less compared to western, Southern, sabaragamuwa and central provinces.
This might be a major factor for prevailing unemployment issues in those areas which
represent in central bank statistics.
Table-3.7. Distribution of Total respondents by Gender
Number %
Female 1691 36.1
Male 2887 61.6
Missing 108 2.3
Total 4686 100.0
Source- tracer survey details 2013.
Figure-3.6. Distribution of Total respondents by Gender
Source- tracer survey details 2013.
The table-3.7 and figure 3.6- Shows the gender distribution of respondents of Vocational
certificate holders. The majority is male certificate holders of 2887 and 61.6%. The number
of female certificate holder’s is 1691 and the percentage is 36.1%, which is of approximately
50 percent difference in participation in tertiary and vocational education stream.
0
500
1000
1500
2000
2500
3000
1691
2887
108
Female
Male
Missing

30
Table 3.8 Distribution of Total respondents by age groups.
Age Range Age not
specified Total
15 - 29 30 - 40 More than 40
3822 474 190 200 4686
81.5% 10.1% 4.1% 4.2% 100%
Source- tracer survey details 2013.
Figure 3.7. Distribution of Total respondents by age groups
Source- tracer survey details 2013.
The age range distribution of the respondents is shown in above 3.8 table and 3.7 figure. The
majority of the age group has fallen in to 15-29 amounting to 3822 and the percentage is
81.5%. More than 91 percent of certificate holders are less than 40 years.
Figure-3.8. Distribution of Total respondents of TVET certificate holders by Age
Source- tracer survey details 2013.
3822
474
190 200
15-29
30-40
above 40
not specified
31
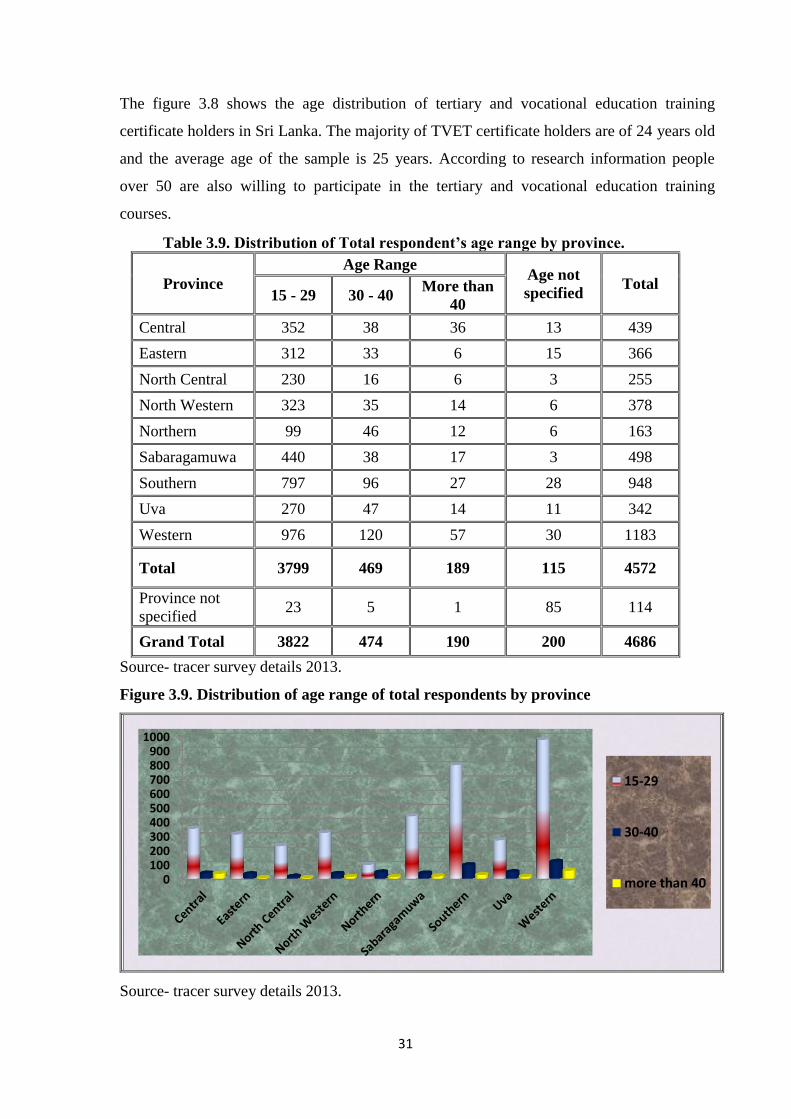
The figure 3.8 shows the age distribution of tertiary and vocational education training
certificate holders in Sri Lanka. The majority of TVET certificate holders are of 24 years old
and the average age of the sample is 25 years. According to research information people
over 50 are also willing to participate in the tertiary and vocational education training
courses.
Table 3.9. Distribution of Total respondent’s age range by province.
Province
Age Range Age not
specified Total
15 - 29 30 - 40 More than
40
Central 352 38 36 13 439
Eastern 312 33 6 15 366
North Central 230 16 6 3 255
North Western 323 35 14 6 378
Northern 99 46 12 6 163
Sabaragamuwa 440 38 17 3 498
Southern 797 96 27 28 948
Uva 270 47 14 11 342
Western 976 120 57 30 1183
Total 3799 469 189 115 4572
Province not
specified 23 5 1 85 114
Grand Total 3822 474 190 200 4686
Source- tracer survey details 2013.
Figure 3.9. Distribution of age range of total respondents by province
Source- tracer survey details 2013.
0100200300400500600700800900
1000
15-29
30-40
more than 40
32
According to above table 3.9 shows total respondents of certificate holders by age range in
each province. The information indicates the high tendency for vocational education among
youth is between 15 to 29 years. Highest response is indicated from western province. And
lowest response is indicated from Northern Province.
Table-3.10. Distribution of Total respondents by marital status
Number Percent Valid Percent
Unmarried 3717 79.3 80.1
Married 923 19.7 19.9
Total 4640 99.0 100.0
Not mentioned 46 1.0
Total 4686 100.0
Source- tracer survey details 2013.
Figure-3.10. Distribution of Total respondents by Marital Status
Source- tracer survey details 2013.
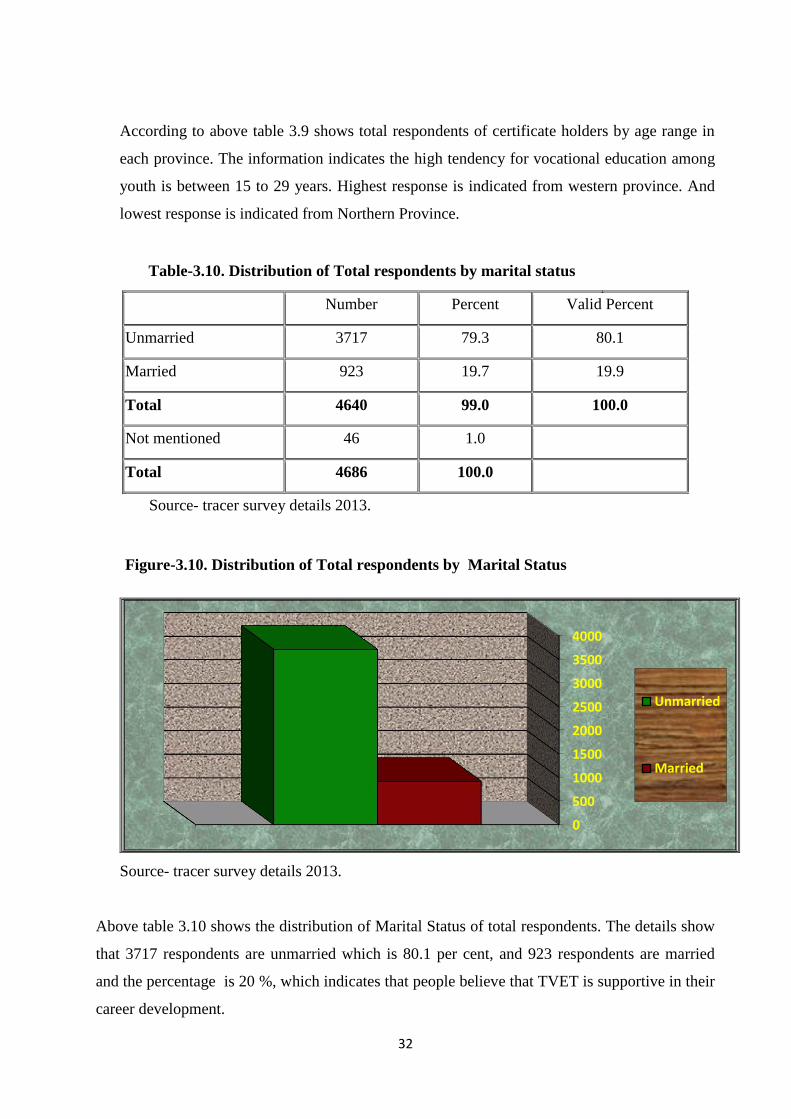
Above table 3.10 shows the distribution of Marital Status of total respondents. The details show
that 3717 respondents are unmarried which is 80.1 per cent, and 923 respondents are married
and the percentage is 20 %, which indicates that people believe that TVET is supportive in their
career development.
0
500
1000
1500
2000
2500
3000
3500
4000
Unmarried
Married

33
Table-3.11. Distribution of Total respondents by Educational Qualification
Level Number Percentage Valid Percentage
1-5 Years 36 .8 .8
5-Upto GCE O/L 1229 26.2 26.9
Passed GCE O/L 610 13.0 13.4
Up to GCE A/L 1037 22.1 22.7
Passed GCE A/L 1485 31.7 32.5
Degree and above 168 3.6 3.7
Total 4565 97.4 100.0
Not mentioned 121 2.6
Total 4686 100.0
Source- tracer survey details 2013.
Figure-3.11. Distribution of Total respondents by Educational Qualification (%)
Source- tracer survey details 2013.
The above table 3.11 shows the distribution of total vocational education certificate holders
by general education. A majority of participant population are above Ordinary Level
qualification which is about 72.3 percent. Among them Advance level passed certificate
holders are 32.5 % and graduate population also among them which represents around 4
percent. That proves TVET is attracted as a way of getting practical knowledge and for
career development. Findings show that approximately 28 percent of population enrolled for
0.8
26.9
13.4
22.7
32.5
3.7
1-5 Years
5-Upto GCE O/L
Passed GCE O/L
Up to GCE A/L
Passed GCE A/L
Degree and above

34
TVET is bellow ordinary level education. Around 59% of the respondents have either
studied or passed A/L.
Table 3.12. Distribution of respondents Education qualification by Gender
Gender
Educational Qualification
Total 1-5
Years
5-Upto
GCE
O/L
Passed
GCE
O/L
Up to
GCE
A/L
Passed
GCE
A/L
Degree
and
above
Not
mentioned
Female 9 165
(14%) 138 390 846
135
(80%)
20 1691
Male 28 1064
(86%) 472 647 631
33
(20%) 2887
Total 36 1229 610 1037 1485 168 108
4686
Source- tracer survey details 2013.
Figure 3.12. Distribution of Education qualification by Gender
Source- tracer survey details 2013.
The education qualification distribution by gender is shown above in table 3.12. The female
population having education below O/L is 14% and that of male population is 86%. There are
1265 certificate holders who have not passed G.C.E (O/L) examination. Among them 36 persons
have educational qualification between grades 1-5 and the majority is male certificate holders.
There are 168 certificate holders who have passed degree and above. Among them 80% are
Female and 20% are male.
0
200
400
600
800
1000
1200
1400
1600
Female Male Not specified Total
5-Jan
6- O/L
Passed O/L
Up To A/L
Passed A/L
Degree & above
35
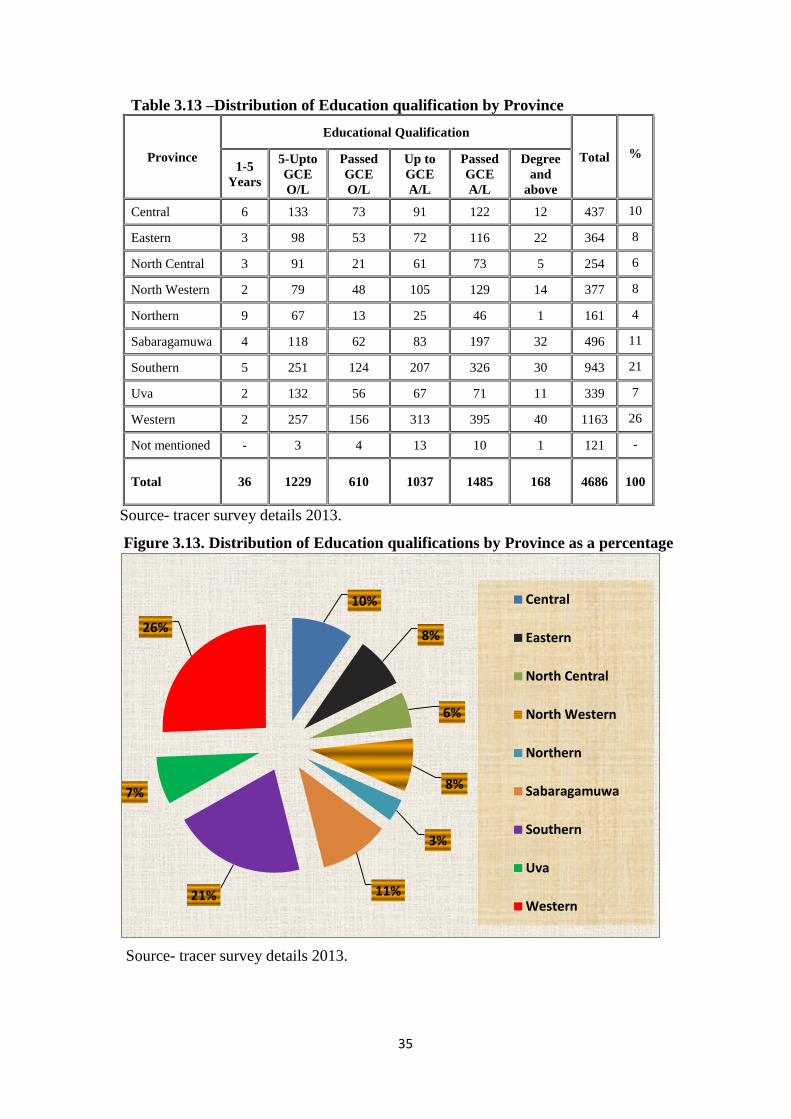
Table 3.13 –Distribution of Education qualification by Province
Province
Educational Qualification
Total % 1-5
Years
5-Upto
GCE
O/L
Passed
GCE
O/L
Up to
GCE
A/L
Passed
GCE
A/L
Degree
and
above
Central 6 133 73 91 122 12 437 10
Eastern 3 98 53 72 116 22 364 8
North Central 3 91 21 61 73 5 254 6
North Western 2 79 48 105 129 14 377 8
Northern 9 67 13 25 46 1 161 4
Sabaragamuwa 4 118 62 83 197 32 496 11
Southern 5 251 124 207 326 30 943 21
Uva 2 132 56 67 71 11 339 7
Western 2 257 156 313 395 40 1163 26
Not mentioned - 3 4 13 10 1 121 -
Total 36 1229 610 1037 1485 168 4686 100
Source- tracer survey details 2013.
Figure 3.13. Distribution of Education qualifications by Province as a percentage
Source- tracer survey details 2013.
10%
8%
6%
8%
3%
11% 21%
7%
26%
Central
Eastern
North Central
North Western
Northern
Sabaragamuwa
Southern
Uva
Western
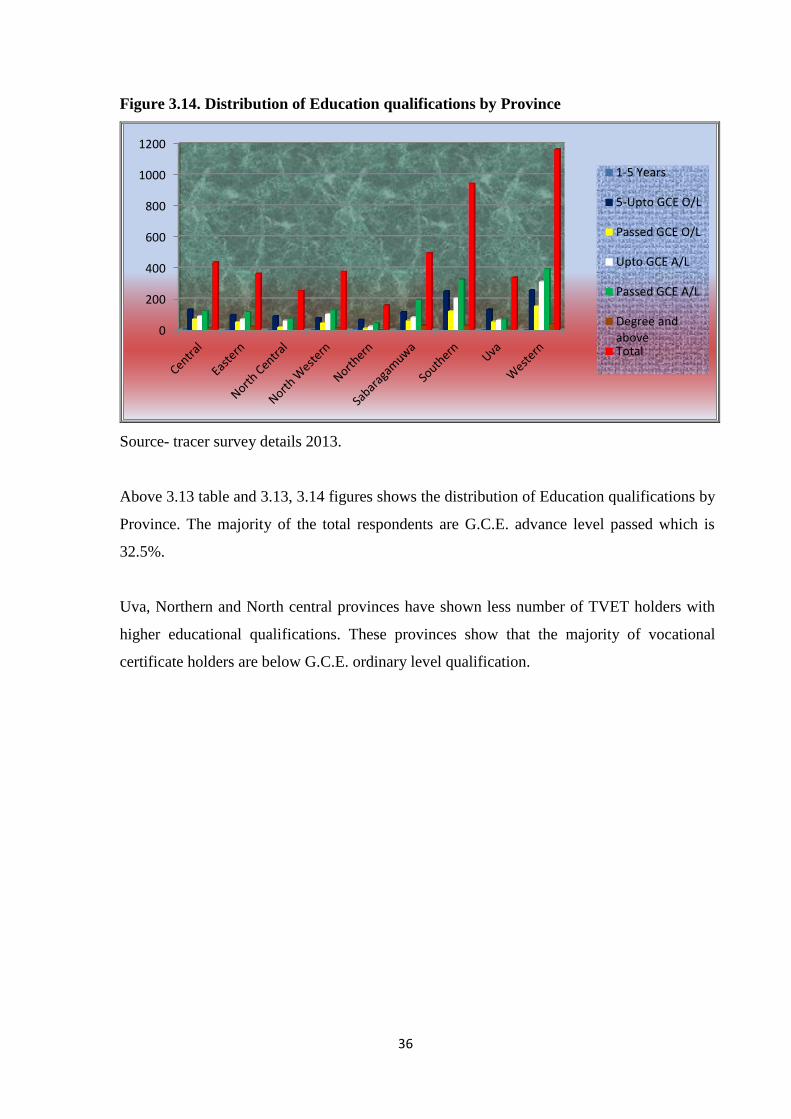
36
Figure 3.14. Distribution of Education qualifications by Province
Source- tracer survey details 2013.
Above 3.13 table and 3.13, 3.14 figures shows the distribution of Education qualifications by
Province. The majority of the total respondents are G.C.E. advance level passed which is
32.5%.
Uva, Northern and North central provinces have shown less number of TVET holders with
higher educational qualifications. These provinces show that the majority of vocational
certificate holders are below G.C.E. ordinary level qualification.
0
200
400
600
800
1000
1200
1-5 Years
5-Upto GCE O/L
Passed GCE O/L
Upto GCE A/L
Passed GCE A/L
Degree andaboveTotal
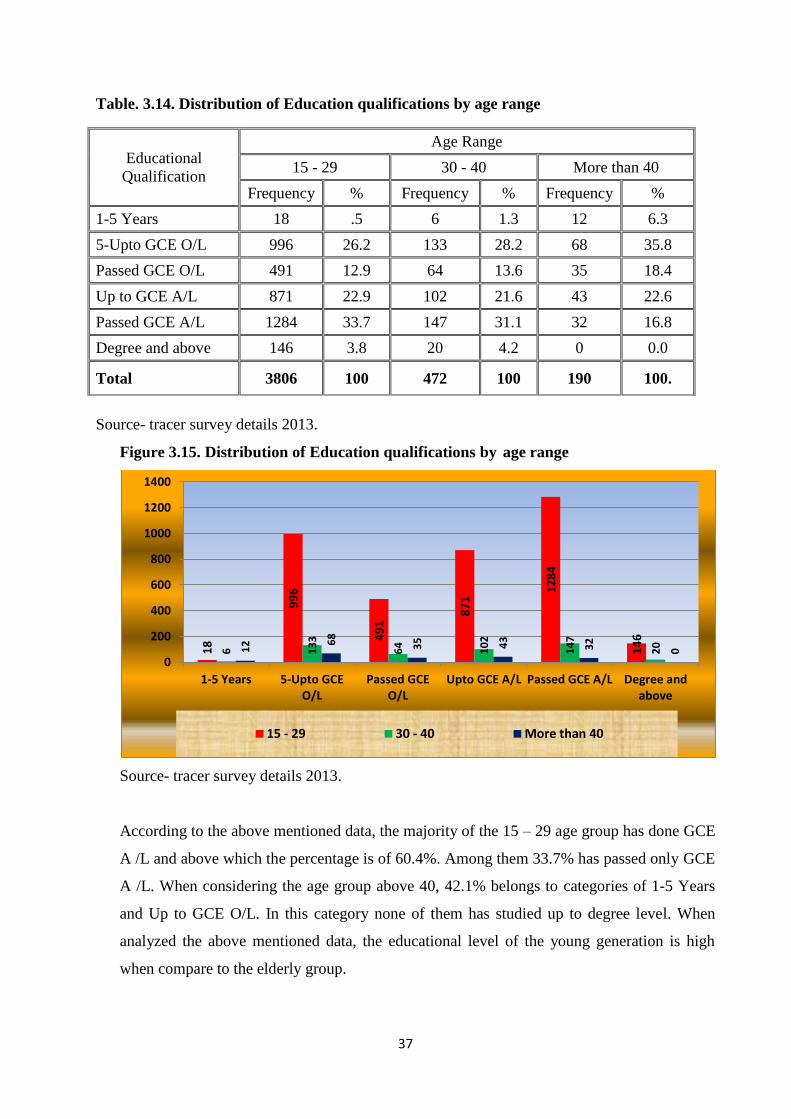
37
Table. 3.14. Distribution of Education qualifications by age range
Source- tracer survey details 2013.
Figure 3.15. Distribution of Education qualifications by age range
Source- tracer survey details 2013.
According to the above mentioned data, the majority of the 15 – 29 age group has done GCE
A /L and above which the percentage is of 60.4%. Among them 33.7% has passed only GCE
A /L. When considering the age group above 40, 42.1% belongs to categories of 1-5 Years
and Up to GCE O/L. In this category none of them has studied up to degree level. When
analyzed the above mentioned data, the educational level of the young generation is high
when compare to the elderly group.
18
99
6
49
1 8
71
12
84
14
6
6
13
3
64
10
2
14
7
20
12
68
35
43
32
0
0
200
400
600
800
1000
1200
1400
1-5 Years 5-Upto GCEO/L
Passed GCEO/L
Upto GCE A/L Passed GCE A/L Degree andabove
15 - 29 30 - 40 More than 40
Educational
Qualification
Age Range
15 - 29 30 - 40 More than 40
Frequency % Frequency % Frequency %
1-5 Years 18 .5 6 1.3 12 6.3
5-Upto GCE O/L 996 26.2 133 28.2 68 35.8
Passed GCE O/L 491 12.9 64 13.6 35 18.4
Up to GCE A/L 871 22.9 102 21.6 43 22.6
Passed GCE A/L 1284 33.7 147 31.1 32 16.8
Degree and above 146 3.8 20 4.2 0 0.0
Total 3806 100 472 100 190 100.
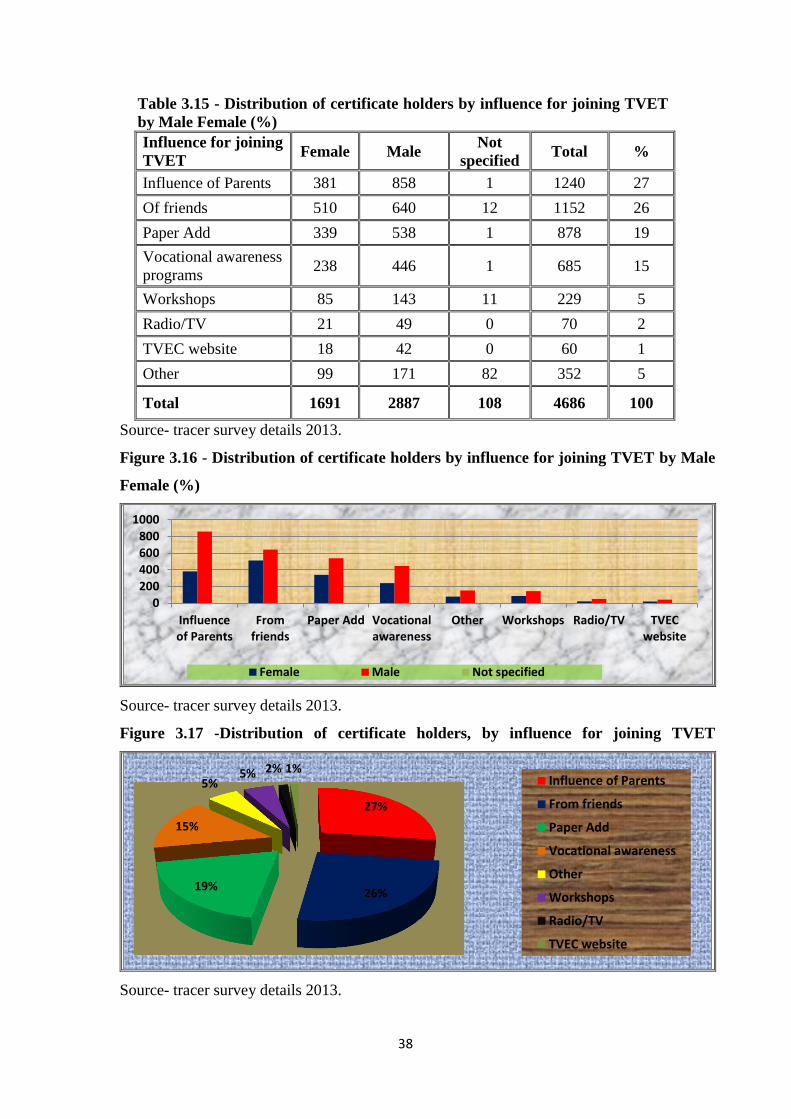
38
Table 3.15 - Distribution of certificate holders by influence for joining TVET
by Male Female (%)
Influence for joining
TVET Female Male
Not
specified Total %
Influence of Parents 381 858 1 1240 27
Of friends 510 640 12 1152 26
Paper Add 339 538 1 878 19
Vocational awareness
programs 238 446 1 685 15
Workshops 85 143 11 229 5
Radio/TV 21 49 0 70 2
TVEC website 18 42 0 60 1
Other 99 171 82 352 5
Total 1691 2887 108 4686 100
Source- tracer survey details 2013.
Figure 3.16 - Distribution of certificate holders by influence for joining TVET by Male
Female (%)
Source- tracer survey details 2013.
Figure 3.17 -Distribution of certificate holders, by influence for joining TVET
Source- tracer survey details 2013.
0
200
400
600
800
1000
Influenceof Parents
Fromfriends
Paper Add Vocationalawareness
Other Workshops Radio/TV TVECwebsite
Female Male Not specified
27%
26% 19%
15%
5% 5% 2% 1%
Influence of Parents
From friends
Paper Add
Vocational awareness
Other
Workshops
Radio/TV
TVEC website
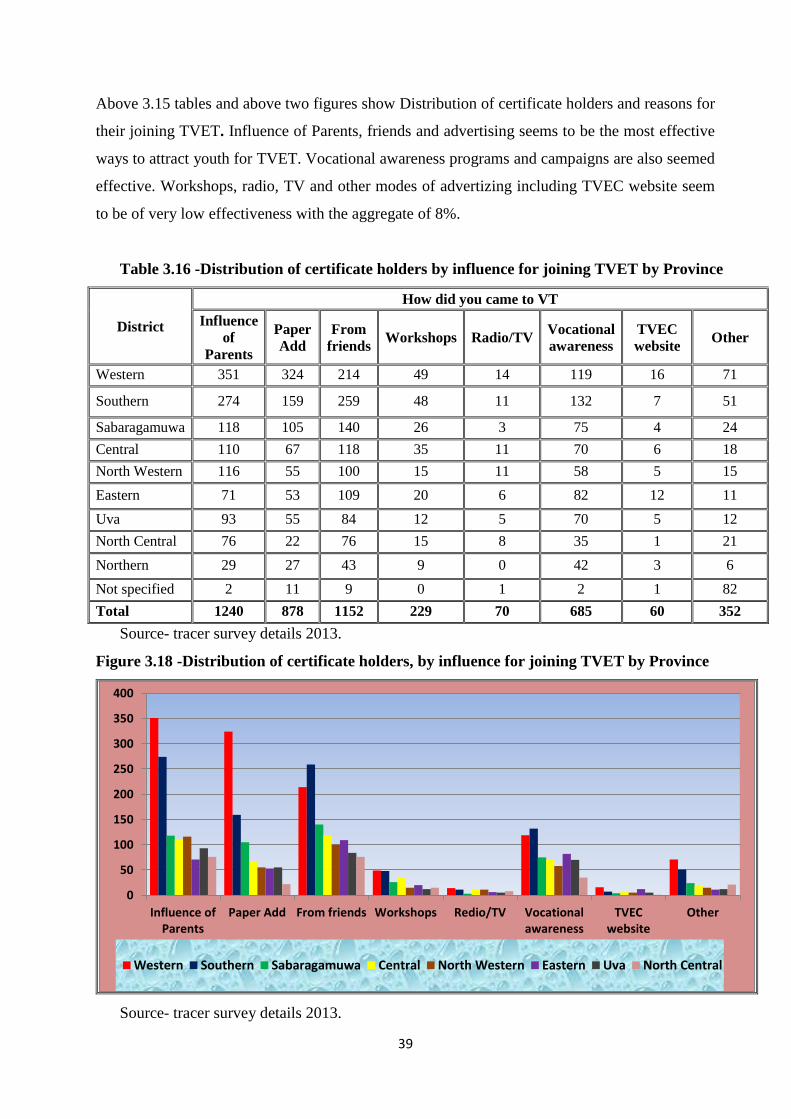
39
Above 3.15 tables and above two figures show Distribution of certificate holders and reasons for
their joining TVET. Influence of Parents, friends and advertising seems to be the most effective
ways to attract youth for TVET. Vocational awareness programs and campaigns are also seemed
effective. Workshops, radio, TV and other modes of advertizing including TVEC website seem
to be of very low effectiveness with the aggregate of 8%.
Table 3.16 -Distribution of certificate holders by influence for joining TVET by Province
District
How did you came to VT
Influence
of
Parents
Paper
Add
From
friends Workshops Radio/TV
Vocational
awareness
TVEC
website Other
Western 351 324 214 49 14 119 16 71
Southern 274 159 259 48 11 132 7 51
Sabaragamuwa 118 105 140 26 3 75 4 24
Central 110 67 118 35 11 70 6 18
North Western 116 55 100 15 11 58 5 15
Eastern 71 53 109 20 6 82 12 11
Uva 93 55 84 12 5 70 5 12
North Central 76 22 76 15 8 35 1 21
Northern 29 27 43 9 0 42 3 6
Not specified 2 11 9 0 1 2 1 82
Total 1240 878 1152 229 70 685 60 352
Source- tracer survey details 2013.
Figure 3.18 -Distribution of certificate holders, by influence for joining TVET by Province
Source- tracer survey details 2013.
0
50
100
150
200
250
300
350
400
Influence ofParents
Paper Add From friends Workshops Redio/TV Vocationalawareness
TVECwebsite
Other
Western Southern Sabaragamuwa Central North Western Eastern Uva North Central

40
Above 3.16 table and 3.18. Figure show the distribution of certificate holders by province and
influencing factors for joining TVET. Western province has shown that the most influencing
factors are parents influence and paper advertisement. However in the southern province the
most influencing factors are friends and vocational awareness programmers and the third
influencing factor seems to be the paper advertisements.
Figure 3.19 -Distribution of certificate holders by distance from home to Institute.
Source- tracer survey details 2013.
Table 3.17 -Distribution of Distance from home to the institute by province
Province
Distance Range – KM.
Not
responded
Less
than 2 2 - 10 10 - 20 20 - 30
More than
30 K
Western 440 24 230 187 120 182
Southern 348 22 250 147 63 118
Sabaragamuwa 168 10 119 92 41 68
Central 171 19 109 63 29 48
North Western 142 12 69 62 35 58
Eastern 137 25 120 41 18 25
Uva 135 13 80 48 36 30
North Central 103 4 52 33 30 33
Northern 66 4 57 18 6 12
Not specified 83 0 13 7 6 5
Total 1793 133 1099 698 384 579
Source- tracer survey details 2013.

41
Findings of this study prove that accessibility is an important factor when selecting a training
institute. The above 3.17 table and 3.19 figure clearly show that participants are not willing to go
more than 50km away from the residential place. Most of certificate holders have not traveled
More than 20 Km from their residence which is 77 %. If availability of centers can be increase
to some extend in the areas where the demand is existing will be a plus point for future growth
of tertiary and vocational education.
Table 3.18 -Distribution of respondents by the nature of ownership and by province.
Province
Ownership of the Institute
Government Private Not specified
Frequency % Frequency % Frequency %
Western 844 72.3% 135 11.4% 204 17.2%
Southern 730 77.0% 59 6.2% 159 16.8%
Sabaragamuwa 407 81.7% 25 5.0% 66 13.3%
Central 316 72.0% 22 5.0% 101 23.0%
North Western 292 77.2% 22 5.8% 64 16.9%
Eastern 270 73.8% 23 6.3% 73 19.9%
Uva 243 71.1% 28 8.2% 71 20.8%
North Central 181 71.0% 13 5.1% 61 23.9%
Northern 98 60.1% 20 12.3% 45 27.6%
Not specified 36 31.6% 4 3.5% 74 64.9%
Total 3416 72.9% 351 7.5% 918 19.6%
Source- tracer survey details 2013.
Figure 3.20 -Distribution of respondents training institute by province.
Source- tracer survey details 2013.
84
4
73
0
40
7
31
6
29
2
27
0
24
3
18
1
98
36
13
5
59
25
22
22
23
28
13
20
4
20
4
15
9
66
10
1
64
73
71
61
45
74
0
100
200
300
400
500
600
700
800
900
Government Private Not specified

42
Above 3.18 table and 3.20 figure show the distribution of respondent training institutes by
province. In Sri Lanka government vocational training institutes particularly VTA, NAITA,
DTET, and NYSC are playing a major role. Out of the total respondents, 3416 are from
government training institutes and the percentage is 72.9%. And there are 351 vocational
certificate holders from private vocational training providers which is 7.5%. This shows that the
majority of certificate holders completed their TVET course through government institutes.
Table 3.19 - Distribution of respondent by Gender by institutional ownership
Gender
Ownership of the Institute Total
Government Private Not specified
Frequency % Frequency % Frequency % Frequency %
Male 2095 72.6 222 7.7 570 19.7 2887 100
Female 1292 77.3 123 7.3 276 16.3 1691 100
Not
specified 30 27.8 6 5.6 72 66.7 108 100
Total 3416 72.9 351 7.5 918 19.6 4686 100
Source- tracer survey details 2013.
Figure 3.21 - Distribution of respondents by Gender by institutional ownership
Source- tracer survey details 2013.
Above 3.19 table and 3.21 figure show the distribution of respondents by gender. The majority
of vocational training certificate holders are male. The tracer survey information has shown,
majority of both male and female vocational training certificate holders are from the government
training centers. Both 3416 male and female student have completed their Vocational training
from Government VT centers. It is percentage is 72.9%. and Both 351 male and female student
0
500
1000
1500
2000
2500
3000
3500
4000
4500
5000
Government Private Not specified Total
Male Female Not specified Total
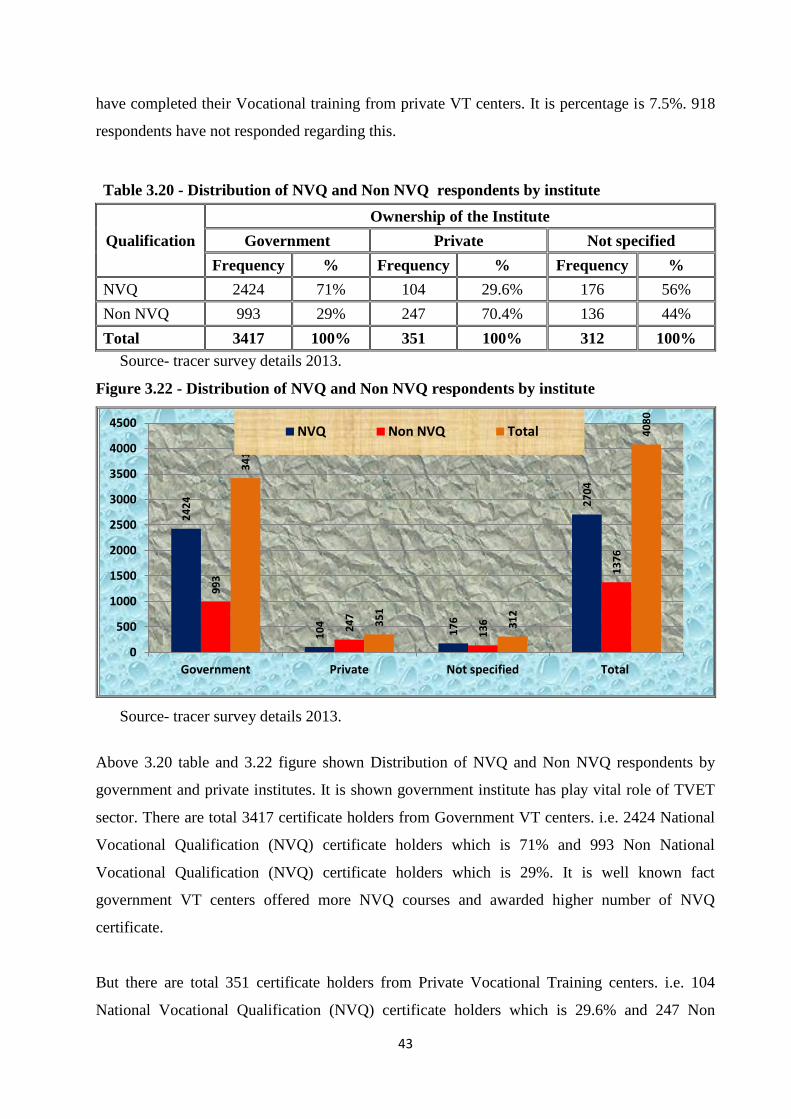
43
have completed their Vocational training from private VT centers. It is percentage is 7.5%. 918
respondents have not responded regarding this.
Table 3.20 - Distribution of NVQ and Non NVQ respondents by institute
Qualification
Ownership of the Institute
Government Private Not specified
Frequency % Frequency % Frequency %
NVQ 2424 71% 104 29.6% 176 56%
Non NVQ 993 29% 247 70.4% 136 44%
Total 3417 100% 351 100% 312 100%
Source- tracer survey details 2013.
Figure 3.22 - Distribution of NVQ and Non NVQ respondents by institute
Source- tracer survey details 2013.
Above 3.20 table and 3.22 figure shown Distribution of NVQ and Non NVQ respondents by
government and private institutes. It is shown government institute has play vital role of TVET
sector. There are total 3417 certificate holders from Government VT centers. i.e. 2424 National
Vocational Qualification (NVQ) certificate holders which is 71% and 993 Non National
Vocational Qualification (NVQ) certificate holders which is 29%. It is well known fact
government VT centers offered more NVQ courses and awarded higher number of NVQ
certificate.
But there are total 351 certificate holders from Private Vocational Training centers. i.e. 104
National Vocational Qualification (NVQ) certificate holders which is 29.6% and 247 Non
24
24
10
4
17
6
27
04
99
3
24
7
13
6
13
76
34
17
35
1
31
2
40
80
0
500
1000
1500
2000
2500
3000
3500
4000
4500
Government Private Not specified Total
NVQ Non NVQ Total

44
National Vocational Qualification (Non NVQ) certificate holders it is percentage 70.4%. Private
VT centers offered more Non NVQ courses and awarded higher number of Non NVQ
certificate.
Table 3.21 -Distribution of NVQ and Non NVQ respondents by province
Province
Ownership of the Institute Total
Government Private Not specified
NVQ Non
NVQ NVQ
Non
NVQ NVQ
Non
NVQ NVQ
Non
NVQ
Western 555 289 33 102 41 36 629 427
Southern 535 195 16 43 35 24 586 262
Sabaragamuwa 322 114 9 15 13 15 344 144
North Western 210 82 5 17 15 9 230 108
Central 202 85 7 16 18 4 227 105
Eastern 200 70 7 16 14 17 221 103
Uva 170 73 13 15 13 9 196 97
North Central 135 46 3 10 6 8 144 64
Northern 68 30 10 10 16 8 94 48
Not specified 27 9 1 3 5 6 33 18
Total 2424 992 104 247 176 136 2704 1376
Source- tracer survey details 2013
Figure 3.23 -Distribution of NVQ and Non NVQ respondents by province
Source- tracer survey details 2013
0
100
200
300
400
500
600
Government NVQ Government Non NVQ Private NVQ Private Non NVQ
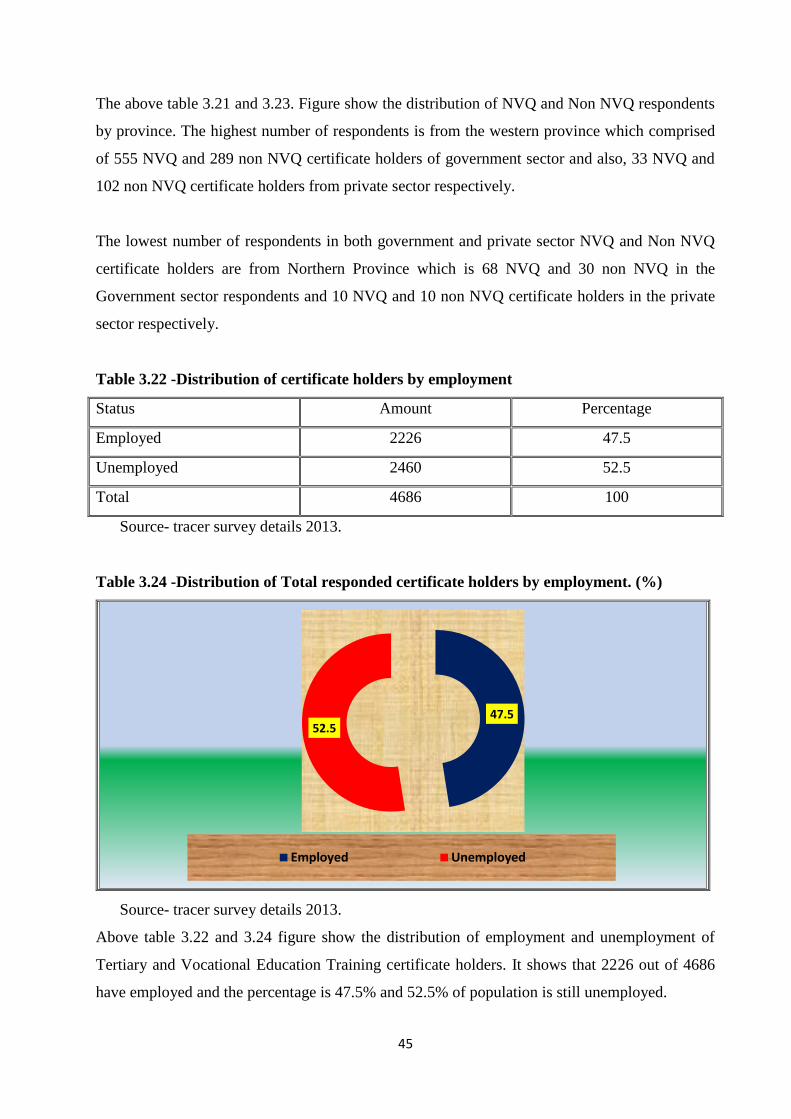
45
The above table 3.21 and 3.23. Figure show the distribution of NVQ and Non NVQ respondents
by province. The highest number of respondents is from the western province which comprised
of 555 NVQ and 289 non NVQ certificate holders of government sector and also, 33 NVQ and
102 non NVQ certificate holders from private sector respectively.
The lowest number of respondents in both government and private sector NVQ and Non NVQ
certificate holders are from Northern Province which is 68 NVQ and 30 non NVQ in the
Government sector respondents and 10 NVQ and 10 non NVQ certificate holders in the private
sector respectively.
Table 3.22 -Distribution of certificate holders by employment
Status Amount Percentage
Employed 2226 47.5
Unemployed 2460 52.5
Total 4686 100
Source- tracer survey details 2013.
Table 3.24 -Distribution of Total responded certificate holders by employment. (%)
Source- tracer survey details 2013.
Above table 3.22 and 3.24 figure show the distribution of employment and unemployment of
Tertiary and Vocational Education Training certificate holders. It shows that 2226 out of 4686
have employed and the percentage is 47.5% and 52.5% of population is still unemployed.
47.5 52.5
Employed Unemployed
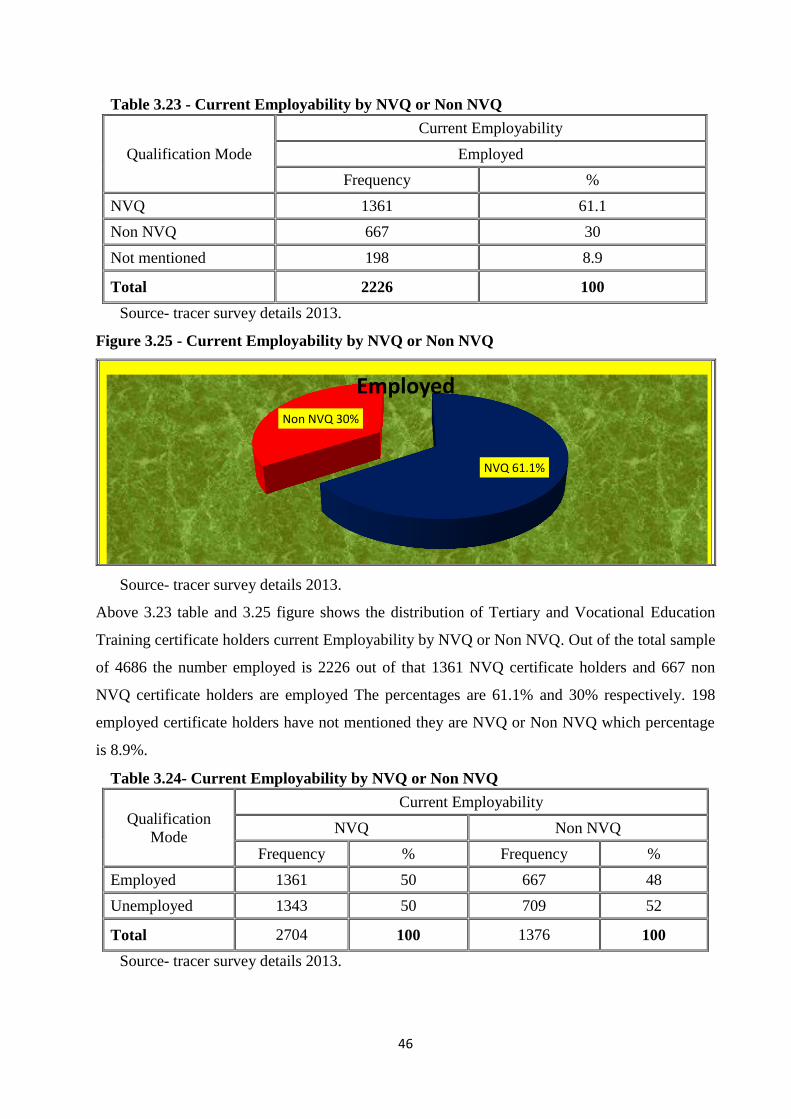
46
Table 3.23 - Current Employability by NVQ or Non NVQ
Qualification Mode
Current Employability
Employed
Frequency %
NVQ 1361 61.1
Non NVQ 667 30
Not mentioned 198 8.9
Total 2226 100
Source- tracer survey details 2013.
Figure 3.25 - Current Employability by NVQ or Non NVQ
Source- tracer survey details 2013.
Above 3.23 table and 3.25 figure shows the distribution of Tertiary and Vocational Education
Training certificate holders current Employability by NVQ or Non NVQ. Out of the total sample
of 4686 the number employed is 2226 out of that 1361 NVQ certificate holders and 667 non
NVQ certificate holders are employed The percentages are 61.1% and 30% respectively. 198
employed certificate holders have not mentioned they are NVQ or Non NVQ which percentage
is 8.9%.
Table 3.24- Current Employability by NVQ or Non NVQ
Qualification
Mode
Current Employability
NVQ Non NVQ
Frequency % Frequency %
Employed 1361 50 667 48
Unemployed 1343 50 709 52
Total 2704 100 1376 100
Source- tracer survey details 2013.
NVQ 61.1%
Non NVQ 30%
Employed
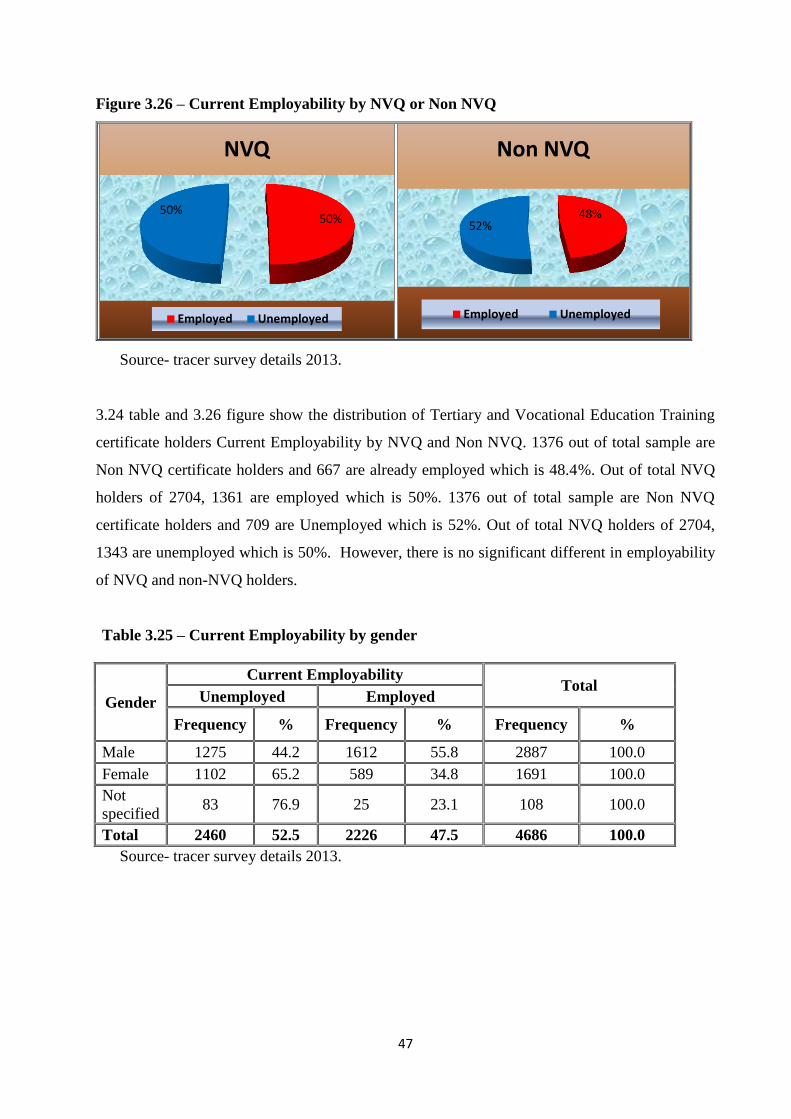
47
Figure 3.26 – Current Employability by NVQ or Non NVQ
Source- tracer survey details 2013.
3.24 table and 3.26 figure show the distribution of Tertiary and Vocational Education Training
certificate holders Current Employability by NVQ and Non NVQ. 1376 out of total sample are
Non NVQ certificate holders and 667 are already employed which is 48.4%. Out of total NVQ
holders of 2704, 1361 are employed which is 50%. 1376 out of total sample are Non NVQ
certificate holders and 709 are Unemployed which is 52%. Out of total NVQ holders of 2704,
1343 are unemployed which is 50%. However, there is no significant different in employability
of NVQ and non-NVQ holders.
Table 3.25 – Current Employability by gender
Gender
Current Employability Total
Unemployed Employed
Frequency % Frequency % Frequency %
Male 1275 44.2 1612 55.8 2887 100.0
Female 1102 65.2 589 34.8 1691 100.0
Not
specified 83 76.9 25 23.1 108 100.0
Total 2460 52.5 2226 47.5 4686 100.0
Source- tracer survey details 2013.
50% 50%
NVQ
Employed Unemployed
48% 52%
Non NVQ
Employed Unemployed

48
Table 3.27 – Current Employability by gender
Source- tracer survey details 2013.
Above 3.25 table and 3.27 figure show the distribution of current employability by male and
female. It shows that male employment is high than that of female. 1612 out of 2887 of total
male responded is employed which is 55.8%. And male unemployment certificate holders are
1275. It percentage is 44.2%. Female employed amount among certificate holders are less than
the male employment which is 589 and the percentage is 34.8%. The female unemployed
amount is1102. And the percentage is 65.2%.
Table 3.26 Employability of NVQ and Non NVQ certificate holders by gender
unemployed employed Total Total
%
NVQ % Non NVQ % NVQ % Non
NVQ %
Male 737 29 344 14 982 39 483 19 2546 100
Female 611 41 351 24 350 23 178 12 1490 100
Not specified 13 30
14 32
11 25
6 14
44 100
Total 1361 709 1343 667 4080
Source- tracer survey details 2013.
Figure 3.28 Employability of NVQ and Non NVQ certificate holders by gender
Source- tracer survey details 2013.
12
75
11
02
83
24
60
16
12
58
9
25
22
26
28
87
16
91
10
8
46
86
0
1000
2000
3000
4000
5000
Male Female Not specified Total
Unemployment Employment Total Linear (Employment)
73
7
34
4 9
82
48
3
61
1
35
1
35
0
17
8
0200400600800
10001200
NVQ Non NVQ NVQ Non NVQ
Un employed Employed
Male
Female
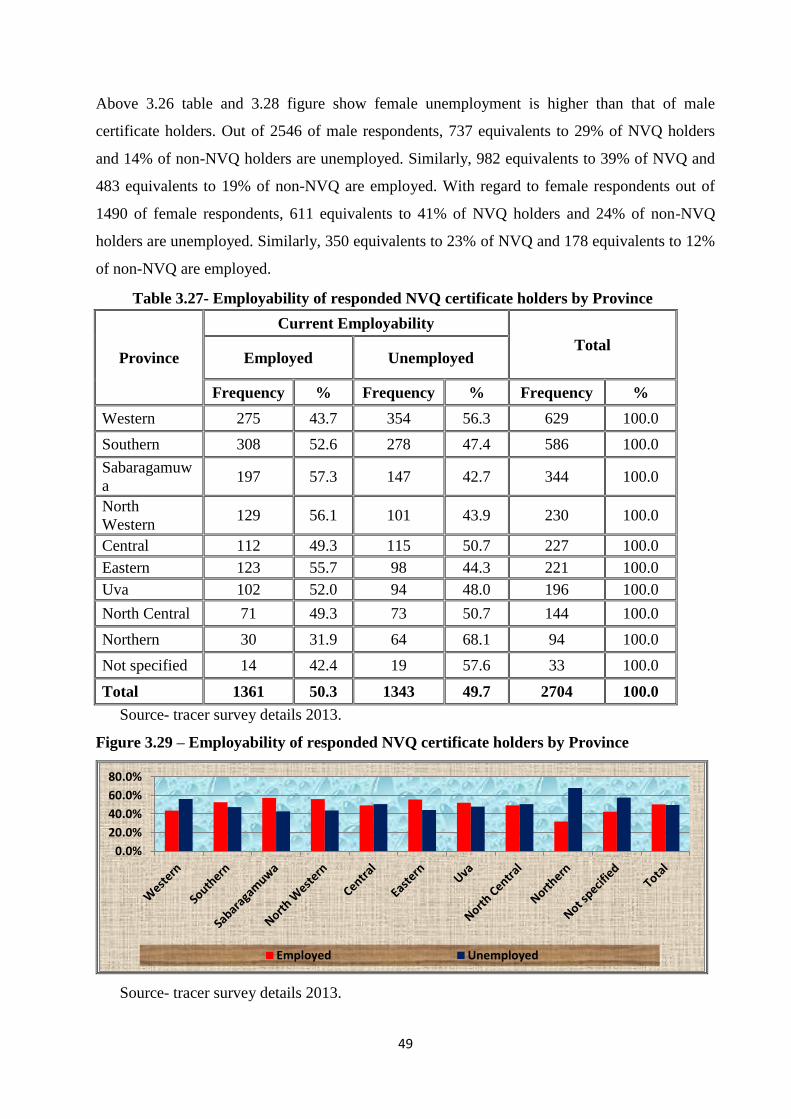
49
Above 3.26 table and 3.28 figure show female unemployment is higher than that of male
certificate holders. Out of 2546 of male respondents, 737 equivalents to 29% of NVQ holders
and 14% of non-NVQ holders are unemployed. Similarly, 982 equivalents to 39% of NVQ and
483 equivalents to 19% of non-NVQ are employed. With regard to female respondents out of
1490 of female respondents, 611 equivalents to 41% of NVQ holders and 24% of non-NVQ
holders are unemployed. Similarly, 350 equivalents to 23% of NVQ and 178 equivalents to 12%
of non-NVQ are employed.
Table 3.27- Employability of responded NVQ certificate holders by Province
Province
Current Employability
Total Employed Unemployed
Frequency % Frequency % Frequency %
Western 275 43.7 354 56.3 629 100.0
Southern 308 52.6 278 47.4 586 100.0
Sabaragamuw
a 197 57.3 147 42.7 344 100.0
North
Western 129 56.1 101 43.9 230 100.0
Central 112 49.3 115 50.7 227 100.0
Eastern 123 55.7 98 44.3 221 100.0
Uva 102 52.0 94 48.0 196 100.0
North Central 71 49.3 73 50.7 144 100.0
Northern 30 31.9 64 68.1 94 100.0
Not specified 14 42.4 19 57.6 33 100.0
Total 1361 50.3 1343 49.7 2704 100.0
Source- tracer survey details 2013.
Figure 3.29 – Employability of responded NVQ certificate holders by Province
Source- tracer survey details 2013.
0.0%
20.0%
40.0%
60.0%
80.0%
Employed Unemployed

50
The above 3.27 table and 3.29 chart shows the details of employability among NVQ holders by
provinces. The highest employment rate within the province is in Sabaragamuwa which is
equivalent to 57.3% followed by North-Western and Eastern with 56.1% and 55.7%
respectively. With regard to unemployment, the highest rate has shown in Northern which is
68.1% followed by Western and Central provinces with 56.3% and 50.7% respectively.
Table 3.28 – Employability of responded Non NVQ certificate holders by
Province
Province
Current Employability Total
Unemployed Employed
Frequency % Frequency % Frequency %
Western 218 51.1 209 48.9 427 100.0
Southern 137 52.3 125 47.7 262 100.0
Central 85 59.0 59 41.0 144 100.0
North Western 52 48.1 56 51.9 108 100.0
Sabaragamuwa 55 52.4 50 47.6 105 100.0
Eastern 56 54.4 47 45.6 103 100.0
Uva 45 46.4 52 53.6 97 100.0
North Central 37 57.8 27 42.2 64 100.0
Northern 13 27.1 35 72.9 48 100.0
Not specified 11 61.1 7 38.9 18 100.0
Total 709 51.5 667 48.5 1376 100.0
Source- tracer survey details 2013.
Figure 3.30 – Employability of responded Non NVQ certificate holders by Province
Source- tracer survey details 2013.
0.0%
10.0%
20.0%
30.0%
40.0%
50.0%
60.0%
70.0%
80.0%
Un employed Employed
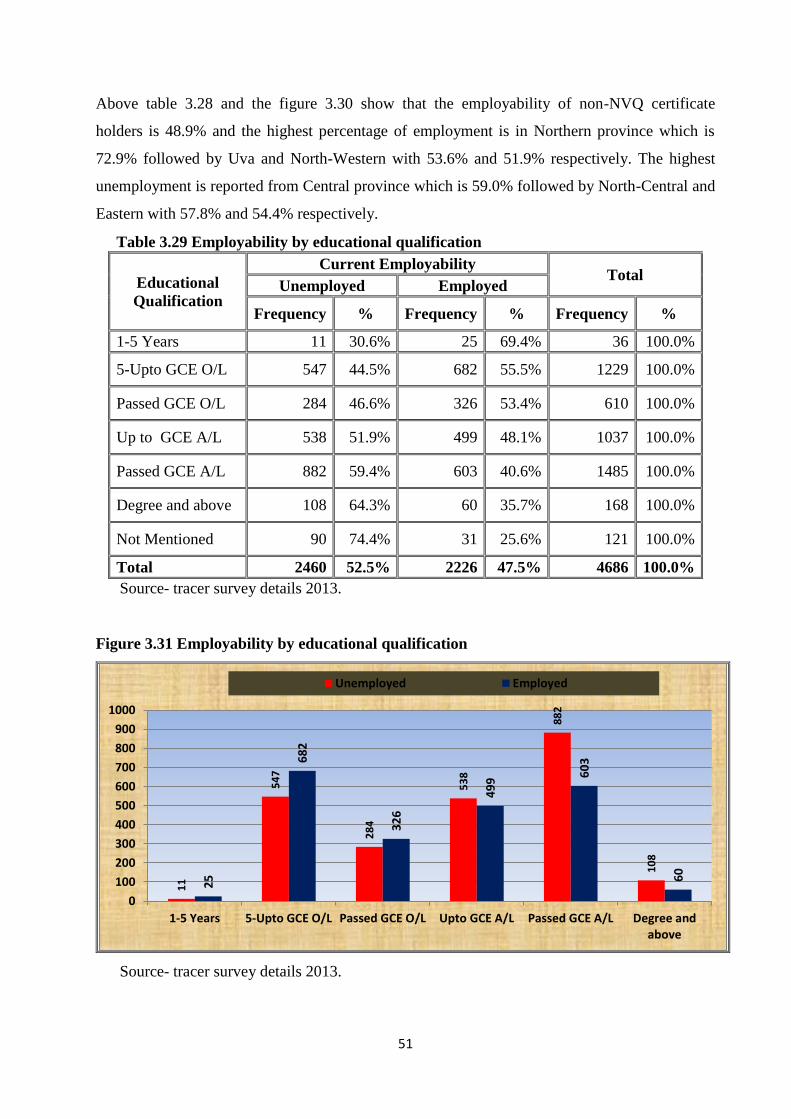
51
Above table 3.28 and the figure 3.30 show that the employability of non-NVQ certificate
holders is 48.9% and the highest percentage of employment is in Northern province which is
72.9% followed by Uva and North-Western with 53.6% and 51.9% respectively. The highest
unemployment is reported from Central province which is 59.0% followed by North-Central and
Eastern with 57.8% and 54.4% respectively.
Table 3.29 Employability by educational qualification
Educational
Qualification
Current Employability Total
Unemployed Employed
Frequency % Frequency % Frequency %
1-5 Years 11 30.6% 25 69.4% 36 100.0%
5-Upto GCE O/L 547 44.5% 682 55.5% 1229 100.0%
Passed GCE O/L 284 46.6% 326 53.4% 610 100.0%
Up to GCE A/L 538 51.9% 499 48.1% 1037 100.0%
Passed GCE A/L 882 59.4% 603 40.6% 1485 100.0%
Degree and above 108 64.3% 60 35.7% 168 100.0%
Not Mentioned 90 74.4% 31 25.6% 121 100.0%
Total 2460 52.5% 2226 47.5% 4686 100.0%
Source- tracer survey details 2013.
Figure 3.31 Employability by educational qualification
Source- tracer survey details 2013.
11
54
7
28
4
53
8
88
2
10
8
25
68
2
32
6
49
9 6
03
60
0
100
200
300
400
500
600
700
800
900
1000
1-5 Years 5-Upto GCE O/L Passed GCE O/L Upto GCE A/L Passed GCE A/L Degree andabove
Unemployed Employed

52
According to the above data, majority with the higher education qualification are unemployed.
Unemployed percentage with qualification of Passed GCE A/L is 59.4% and Unemployed
percentage with qualification of Degree and above is 64.3%. And also higher numbers of lower
education qualification respondents are employed. Employed percentage with qualification of 1-
5 Years is 69.4% and Employed percentage with qualification up to GCE O/L is 55.5 %.
Table 3.30 Employability by age
Age
Current Employability Total
Unemployed Employed
Frequency % Frequency % Frequency %
15 - 29 2107 55.1 1715 44.9 3822 100.0
30 - 40 167 35.2 307 64.8 474 100.0
More than 40 59 31.1 131 68.9 190 100.0
Not specified 127 63.5 73 36.5 200 100.0
Total 2460 52.5 2226 47.5 4686 100.0
Source- tracer survey details 2013.
Figure 3.32 Employability by age
Source- tracer survey details 2013.
Above table 3.30 and the figure 3.32 show that the employability by age. Higher number of
unemployed percentage can be seen between 15-29 age group which is 55.1%. And also
majority of both 30-40 and above 40 age categories are employed. Employed percentage of 30-
40 categories is 64.8 % and the category of above 40 employed percentage is 68.9 %. According
to this analysis, it is seen that the employability of the certificate holders takes place rather late.
0
500
1000
1500
2000
2500
15 - 29 30 - 40 More than 40 Not specified
21
07
16
7
59
12
7
17
15
30
7
13
1
73
Unemployed
Employed
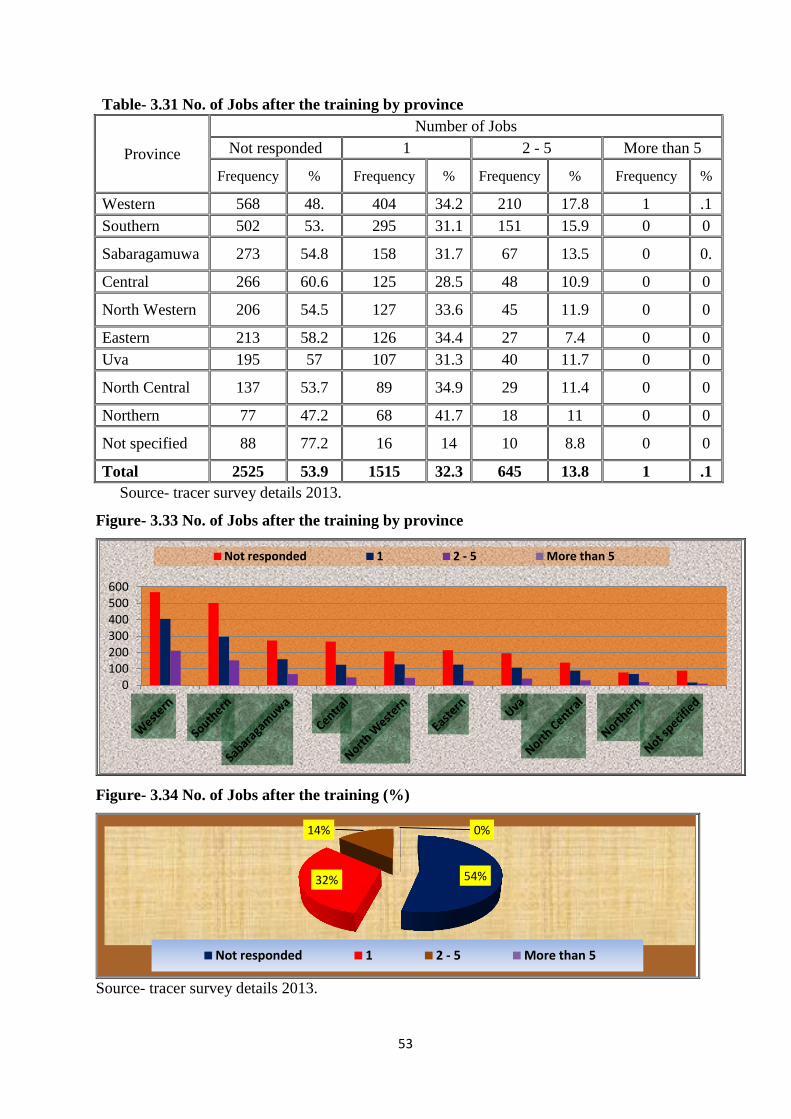
53
Table- 3.31 No. of Jobs after the training by province
Province
Number of Jobs
Not responded 1 2 - 5 More than 5
Frequency % Frequency % Frequency % Frequency %
Western 568 48. 404 34.2 210 17.8 1 .1
Southern 502 53. 295 31.1 151 15.9 0 0
Sabaragamuwa 273 54.8 158 31.7 67 13.5 0 0.
Central 266 60.6 125 28.5 48 10.9 0 0
North Western 206 54.5 127 33.6 45 11.9 0 0
Eastern 213 58.2 126 34.4 27 7.4 0 0
Uva 195 57 107 31.3 40 11.7 0 0
North Central 137 53.7 89 34.9 29 11.4 0 0
Northern 77 47.2 68 41.7 18 11 0 0
Not specified 88 77.2 16 14 10 8.8 0 0
Total 2525 53.9 1515 32.3 645 13.8 1 .1
Source- tracer survey details 2013.
Figure- 3.33 No. of Jobs after the training by province
Figure- 3.34 No. of Jobs after the training (%)
Source- tracer survey details 2013.
0100200300400500600
Not responded 1 2 - 5 More than 5
54% 32%
14% 0%
Not responded 1 2 - 5 More than 5
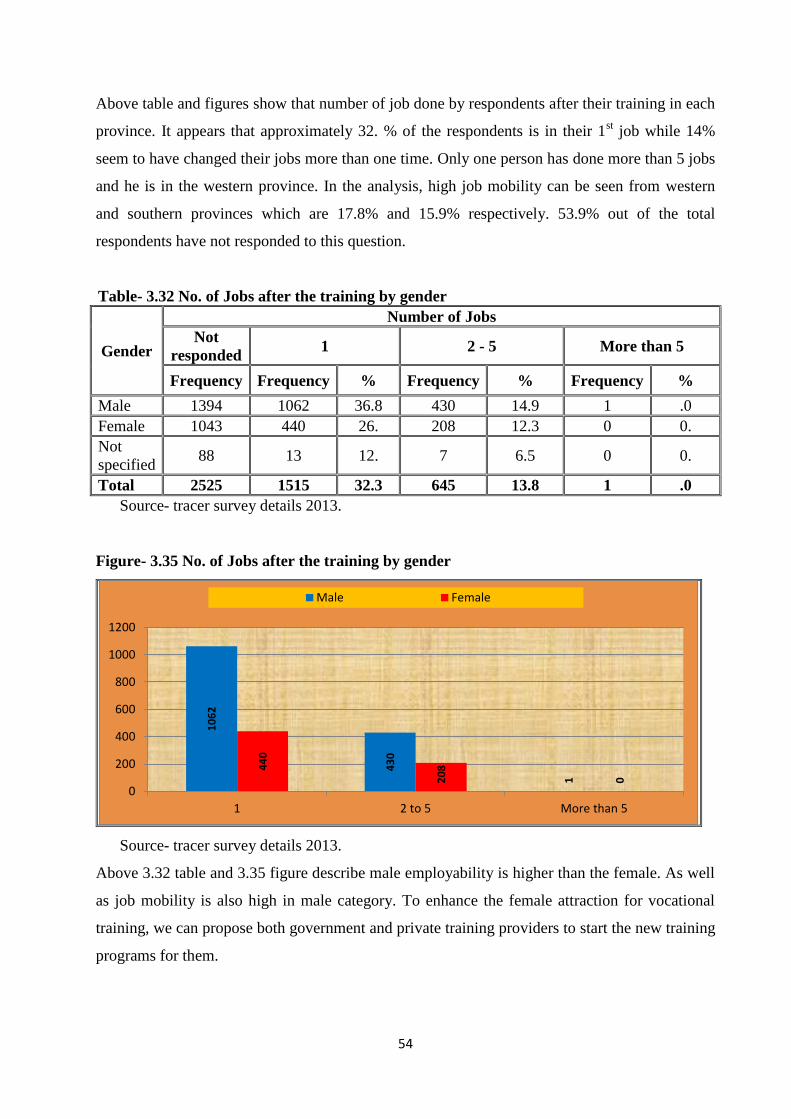
54
Above table and figures show that number of job done by respondents after their training in each
province. It appears that approximately 32. % of the respondents is in their 1st job while 14%
seem to have changed their jobs more than one time. Only one person has done more than 5 jobs
and he is in the western province. In the analysis, high job mobility can be seen from western
and southern provinces which are 17.8% and 15.9% respectively. 53.9% out of the total
respondents have not responded to this question.
Table- 3.32 No. of Jobs after the training by gender
Gender
Number of Jobs
Not
responded 1 2 - 5 More than 5
Frequency Frequency % Frequency % Frequency %
Male 1394 1062 36.8 430 14.9 1 .0
Female 1043 440 26. 208 12.3 0 0.
Not
specified 88 13 12. 7 6.5 0 0.
Total 2525 1515 32.3 645 13.8 1 .0
Source- tracer survey details 2013.
Figure- 3.35 No. of Jobs after the training by gender
Source- tracer survey details 2013.
Above 3.32 table and 3.35 figure describe male employability is higher than the female. As well
as job mobility is also high in male category. To enhance the female attraction for vocational
training, we can propose both government and private training providers to start the new training
programs for them.
10
62
43
0
1
44
0
20
8
0
0
200
400
600
800
1000
1200
1 2 to 5 More than 5
Male Female
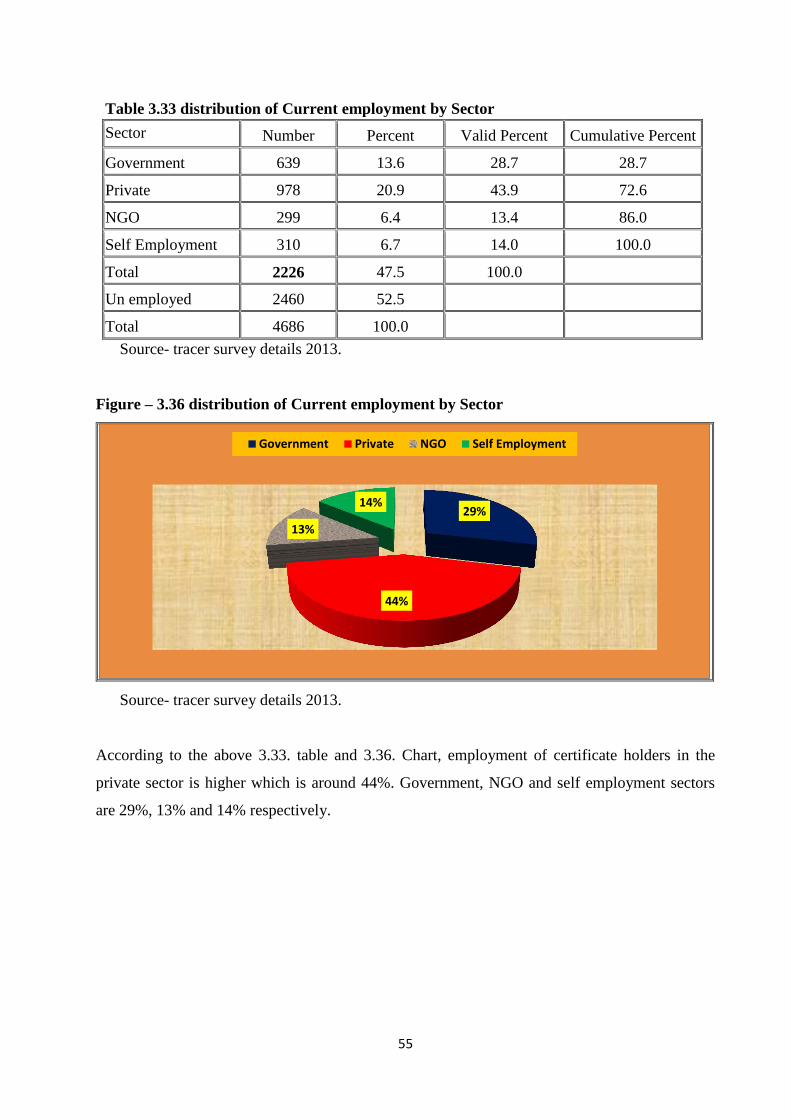
55
Table 3.33 distribution of Current employment by Sector
Sector Number Percent Valid Percent Cumulative Percent
Government 639 13.6 28.7 28.7
Private 978 20.9 43.9 72.6
NGO 299 6.4 13.4 86.0
Self Employment 310 6.7 14.0 100.0
Total 2226 47.5 100.0
Un employed 2460 52.5
Total 4686 100.0
Source- tracer survey details 2013.
Figure – 3.36 distribution of Current employment by Sector
Source- tracer survey details 2013.
According to the above 3.33. table and 3.36. Chart, employment of certificate holders in the
private sector is higher which is around 44%. Government, NGO and self employment sectors
are 29%, 13% and 14% respectively.
29%
44%
13%
14%
Government Private NGO Self Employment

56
Table- 3.34 distribution of current employment by sector and by gender
Gender
Current Occupation Sector
Government Private NGO Self Employment
Frequency % Frequency % Frequency % Frequency %
Male 418 26.2 757 47.4 215 13.5 207 13.
Female 216 35.6 211 34.8 78 12.9 101 16.
7
Not
Mentioned 5 20.0 10 40. 6 24. 2 16
Total 639 28.7 978 43.9 299 13.4 310 14
Source- tracer survey details 2013.
Figure- 3.37 distribution of current employment by sector and by gender
Source- tracer survey details 2013.
Above 3.34 table and 3.37 figure show the distribution of current employment by sector and
by gender. It clearly shows that the male employability is higher than the female in all
sectors. Especially in private sector male employability is very high when comparing to the
other sectors. When considering the self employment the female self employment is higher
than that of the male.
418
757
215 207 216 211
78 101
5 10 6 2 0
100
200
300
400
500
600
700
800
Government Private NGO Self Employment
Male Female Not specified
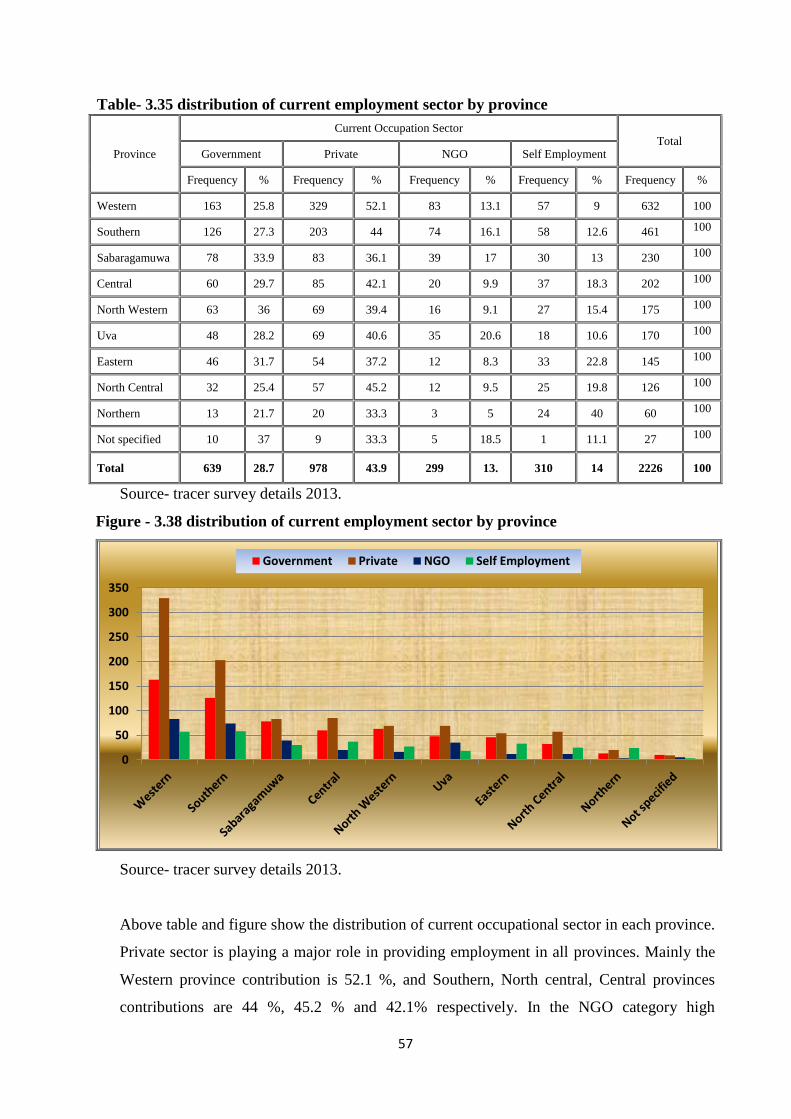
57
Table- 3.35 distribution of current employment sector by province
Province
Current Occupation Sector Total
Government Private NGO Self Employment
Frequency % Frequency % Frequency % Frequency % Frequency %
Western 163 25.8 329 52.1 83 13.1 57 9 632 100
Southern 126 27.3 203 44 74 16.1 58 12.6 461 100
Sabaragamuwa 78 33.9 83 36.1 39 17 30 13 230 100
Central 60 29.7 85 42.1 20 9.9 37 18.3 202 100
North Western 63 36 69 39.4 16 9.1 27 15.4 175 100
Uva 48 28.2 69 40.6 35 20.6 18 10.6 170 100
Eastern 46 31.7 54 37.2 12 8.3 33 22.8 145 100
North Central 32 25.4 57 45.2 12 9.5 25 19.8 126 100
Northern 13 21.7 20 33.3 3 5 24 40 60 100
Not specified 10 37 9 33.3 5 18.5 1 11.1 27 100
Total 639 28.7 978 43.9 299 13. 310 14 2226 100
Source- tracer survey details 2013.
Figure - 3.38 distribution of current employment sector by province
Source- tracer survey details 2013.
Above table and figure show the distribution of current occupational sector in each province.
Private sector is playing a major role in providing employment in all provinces. Mainly the
Western province contribution is 52.1 %, and Southern, North central, Central provinces
contributions are 44 %, 45.2 % and 42.1% respectively. In the NGO category high
0
50
100
150
200
250
300
350
Government Private NGO Self Employment
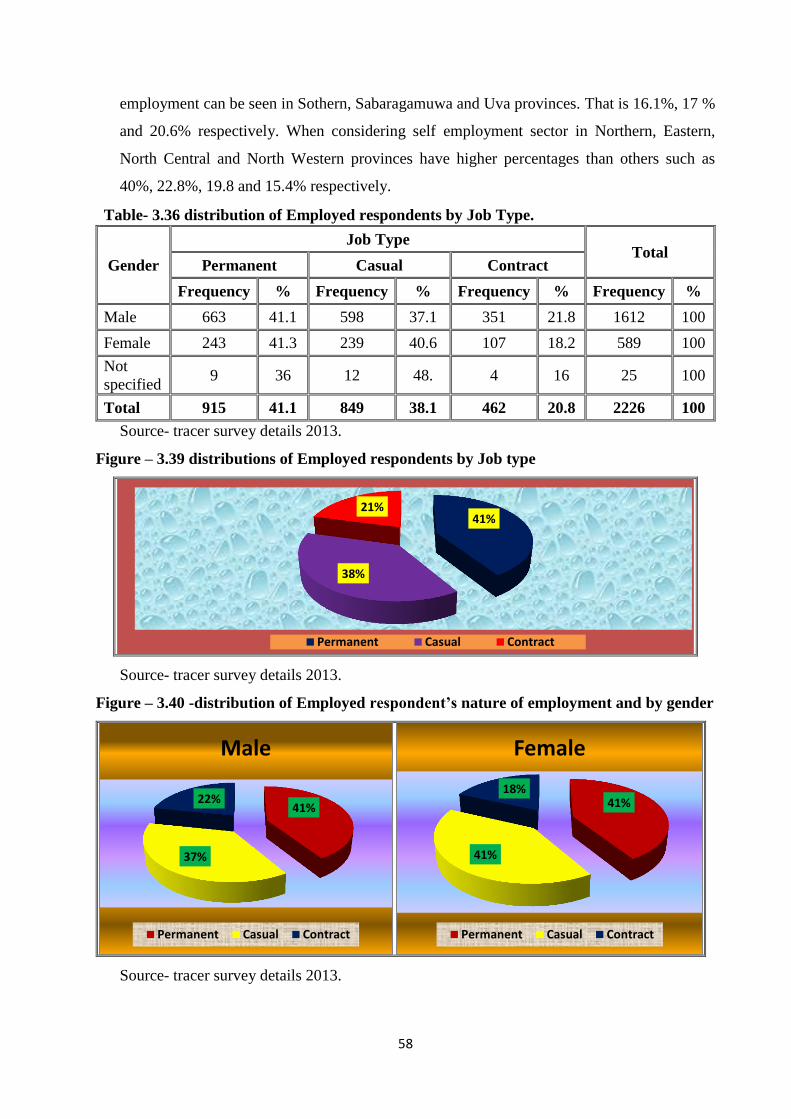
58
employment can be seen in Sothern, Sabaragamuwa and Uva provinces. That is 16.1%, 17 %
and 20.6% respectively. When considering self employment sector in Northern, Eastern,
North Central and North Western provinces have higher percentages than others such as
40%, 22.8%, 19.8 and 15.4% respectively.
Table- 3.36 distribution of Employed respondents by Job Type.
Gender
Job Type Total
Permanent Casual Contract
Frequency % Frequency % Frequency % Frequency %
Male 663 41.1 598 37.1 351 21.8 1612 100
Female 243 41.3 239 40.6 107 18.2 589 100
Not
specified 9 36 12 48. 4 16 25 100
Total 915 41.1 849 38.1 462 20.8 2226 100
Source- tracer survey details 2013.
Figure – 3.39 distributions of Employed respondents by Job type
Source- tracer survey details 2013.
Figure – 3.40 -distribution of Employed respondent’s nature of employment and by gender
Source- tracer survey details 2013.
41%
38%
21%
Permanent Casual Contract
41%
37%
22%
Male
Permanent Casual Contract
41%
41%
18%
Female
Permanent Casual Contract

59
Above 3.36 table and figures describe the distribution of employability by the nature of
employment. Accordingly, the permanent category is 41.1%. Casual employment is 38.1% and
Contract employment is 20.8%. When comparing the employment nature by gender, there is no
big difference between male and female.
Table 3.37- distribution of employability of TVET certificate holders by course duration
Course
Duration
Current Employability Total
Unemployed Employed
No. of
respondents %
No. of
respondents %
No. of
respondents %
3 Months 288 49.2 297 50.8 585 100
3 - 6 Months 711 57.0 537 43.0 1248 100
7 - 12 Months 259 51.1 248 48.9 507 100
1 - 2 Years 169 46.8 192 53.2 361 100
More than 2
Years 56 47.5 62 52.5 118 100
Not Specified 977 52.3 890 47.7 1867 100
Total 2460 52.5 2226 47.5 4686 100
Source- tracer survey details 2013.
Figure 3.41 - distribution of employability of TVET certificate holders by course duration
Source- tracer survey details 2013.
Above 3.37 table and 3.41 figure shown the distribution of employability of TVET certificate
holder’s by course duration. The majority of certificate holders have completed their VET
courses with 3-6 months duration which is 1248. Among them 57% are unemployed and 43%
employed. 585 certificate holders have completed 3 months courses of which the employment
rate is 50.8%. High employability has been reported by courses of more than one year durations.
0
200
400
600
800
1000
1200
1400
1600
1800
2000
3 Months 3 - 6Months
7 - 12Months
1 - 2 Years More than2 Years
NotSpecified
Not Doing aJob
Doing a Job
Total

60
i.e. courses of 1-2 duration have reported 53.2% and courses with duration more than 2 years
have reported 52.5%.
Table 3.38 - distribution of employability of TVET certificate holders by training
course.
No
Course Name Current Employability Total
Unemployed Employed
Count % Count % Count %
1
Computer Applications
Assistant 557 64.5 306 35.5 863 100
2 Electrician 133 40.2 198 59.8 331 100
3 Others 139 51.5 131 48.5 270 100
4 Welder 83 44.9 102 55.1 185 100
5 Wood Craftsman (Furniture) 51 33.3 102 66.7 153 100
6 Tailor 104 69.3 46 30.7 150 100
7 Automobile Mechanic 49 33.3 98 66.7 147 100
8 Beautician 77 57.5 57 42.5 134 100
9 Computer Graphic Designer 67 53.2 59 46.8 126 100
10 Computer Hardware Technician 45 39.1 70 60.9 115 100
11
Professional Course (AAT,
Accounting, CIMA, …..etc.) 64 63.4 37 36.6 101
100
12
Construction Craftsman
(Masonry) 38 43.2 50 56.8 88
100
13
Refrigeration & Air
Conditioning Mechanic 31 35.6 56 64.4 87
100
14 Motor Cycle Mechanic 24 30.4 55 69.6 79 100
15 Machinist 23 32.9 47 67.1 70 100
16 Aluminum Fabricator 25 40.3 37 59.7 62 100
17
Information And
Communication Technology
Technician
33 54.1 28 45.9 61
100
18 Draughts person 29 50.9 28 49.1 57 100
19 Plumber 21 38.9 33 61.1 54 100
20 Wood Craftsman (Buildings) 30 62.5 18 37.5 48 100
21 Cook 22 52.4 20 47.6 42 100
22 Languages 28 66.7 14 33.3 42 100
23 Outboard Motor Mechanic 15 37.5 25 62.5 40 100
24
Industrial Sewing Machine
Operator 26 72.2 10 27.8 36
100
25
Radio, TV And Allied
Equipment Repairer 17 48.6 18 51.4 35
100
26 Industrial Electronic Craftsman 14 42.4 19 57.6 33 100
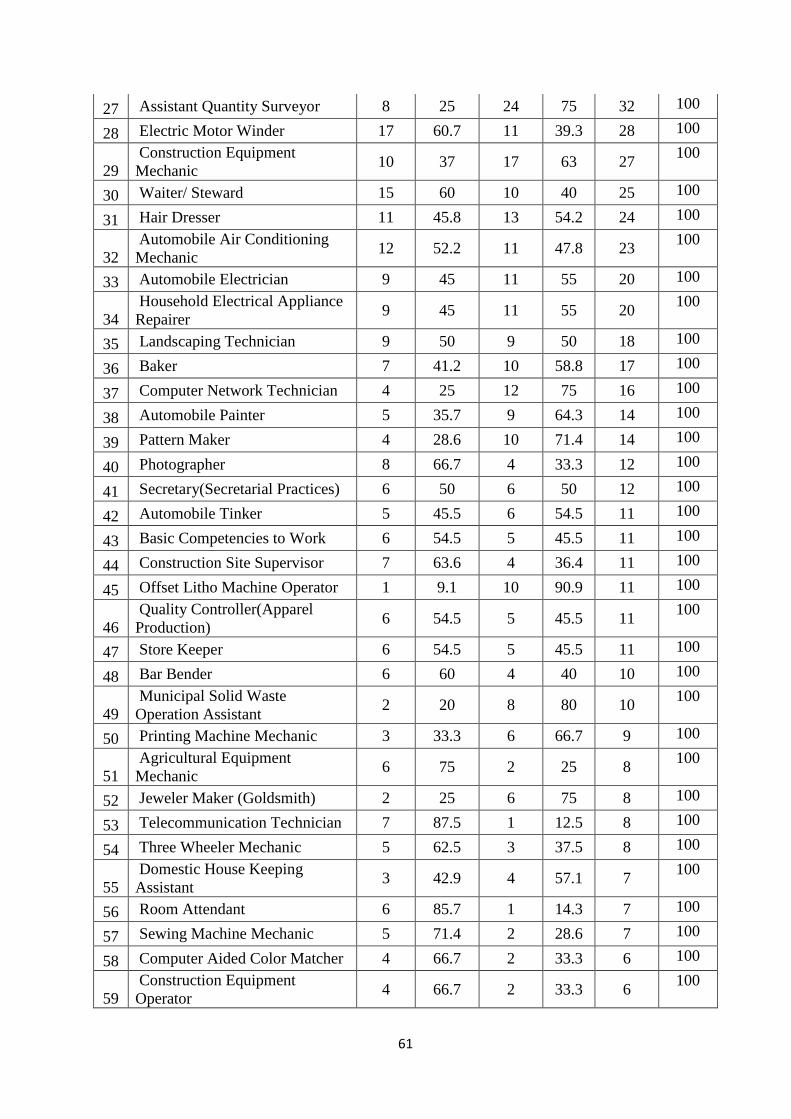
61
27 Assistant Quantity Surveyor 8 25 24 75 32 100
28 Electric Motor Winder 17 60.7 11 39.3 28 100
29
Construction Equipment
Mechanic 10 37 17 63 27
100
30 Waiter/ Steward 15 60 10 40 25 100
31 Hair Dresser 11 45.8 13 54.2 24 100
32
Automobile Air Conditioning
Mechanic 12 52.2 11 47.8 23
100
33 Automobile Electrician 9 45 11 55 20 100
34
Household Electrical Appliance
Repairer 9 45 11 55 20
100
35 Landscaping Technician 9 50 9 50 18 100
36 Baker 7 41.2 10 58.8 17 100
37 Computer Network Technician 4 25 12 75 16 100
38 Automobile Painter 5 35.7 9 64.3 14 100
39 Pattern Maker 4 28.6 10 71.4 14 100
40 Photographer 8 66.7 4 33.3 12 100
41 Secretary(Secretarial Practices) 6 50 6 50 12 100
42 Automobile Tinker 5 45.5 6 54.5 11 100
43 Basic Competencies to Work 6 54.5 5 45.5 11 100
44 Construction Site Supervisor 7 63.6 4 36.4 11 100
45 Offset Litho Machine Operator 1 9.1 10 90.9 11 100
46
Quality Controller(Apparel
Production) 6 54.5 5 45.5 11
100
47 Store Keeper 6 54.5 5 45.5 11 100
48 Bar Bender 6 60 4 40 10 100
49
Municipal Solid Waste
Operation Assistant 2 20 8 80 10
100
50 Printing Machine Mechanic 3 33.3 6 66.7 9 100
51
Agricultural Equipment
Mechanic 6 75 2 25 8
100
52 Jeweler Maker (Goldsmith) 2 25 6 75 8 100
53 Telecommunication Technician 7 87.5 1 12.5 8 100
54 Three Wheeler Mechanic 5 62.5 3 37.5 8 100
55
Domestic House Keeping
Assistant 3 42.9 4 57.1 7
100
56 Room Attendant 6 85.7 1 14.3 7 100
57 Sewing Machine Mechanic 5 71.4 2 28.6 7 100
58 Computer Aided Color Matcher 4 66.7 2 33.3 6 100
59
Construction Equipment
Operator 4 66.7 2 33.3 6
100
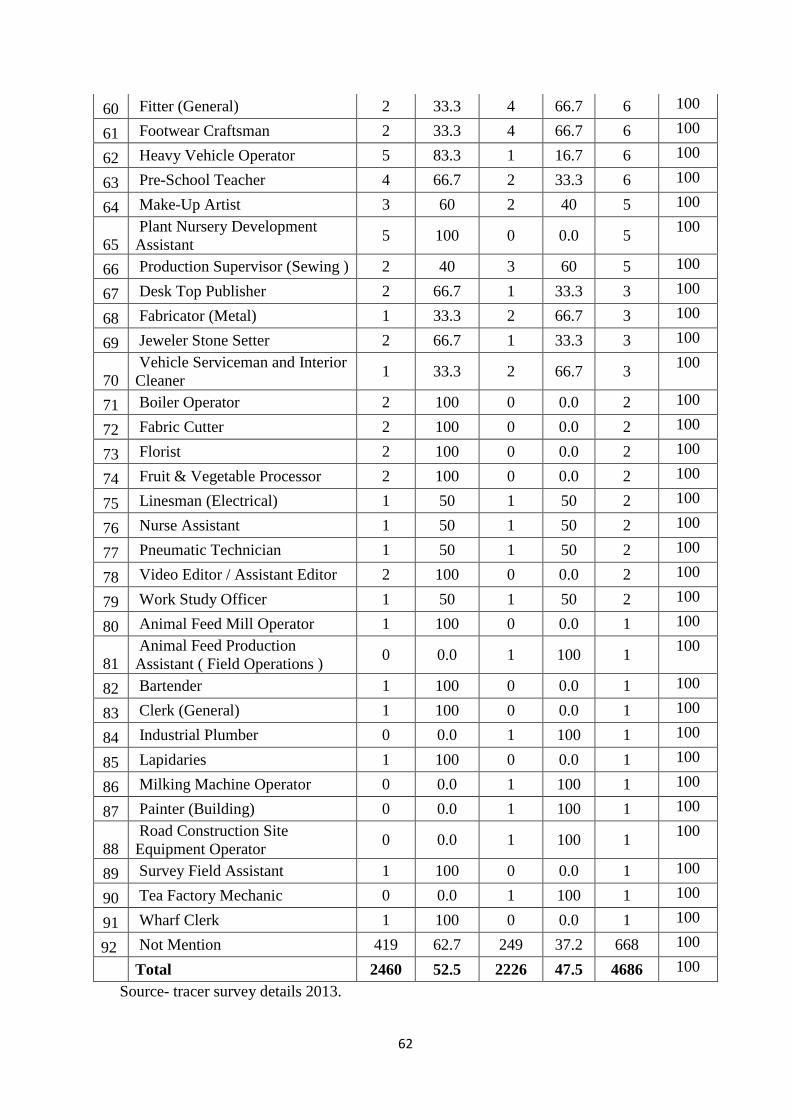
62
60 Fitter (General) 2 33.3 4 66.7 6 100
61 Footwear Craftsman 2 33.3 4 66.7 6 100
62 Heavy Vehicle Operator 5 83.3 1 16.7 6 100
63 Pre-School Teacher 4 66.7 2 33.3 6 100
64 Make-Up Artist 3 60 2 40 5 100
65
Plant Nursery Development
Assistant 5 100 0 0.0 5
100
66 Production Supervisor (Sewing ) 2 40 3 60 5 100
67 Desk Top Publisher 2 66.7 1 33.3 3 100
68 Fabricator (Metal) 1 33.3 2 66.7 3 100
69 Jeweler Stone Setter 2 66.7 1 33.3 3 100
70
Vehicle Serviceman and Interior
Cleaner 1 33.3 2 66.7 3
100
71 Boiler Operator 2 100 0 0.0 2 100
72 Fabric Cutter 2 100 0 0.0 2 100
73 Florist 2 100 0 0.0 2 100
74 Fruit & Vegetable Processor 2 100 0 0.0 2 100
75 Linesman (Electrical) 1 50 1 50 2 100
76 Nurse Assistant 1 50 1 50 2 100
77 Pneumatic Technician 1 50 1 50 2 100
78 Video Editor / Assistant Editor 2 100 0 0.0 2 100
79 Work Study Officer 1 50 1 50 2 100
80 Animal Feed Mill Operator 1 100 0 0.0 1 100
81
Animal Feed Production
Assistant ( Field Operations ) 0 0.0 1 100 1
100
82 Bartender 1 100 0 0.0 1 100
83 Clerk (General) 1 100 0 0.0 1 100
84 Industrial Plumber 0 0.0 1 100 1 100
85 Lapidaries 1 100 0 0.0 1 100
86 Milking Machine Operator 0 0.0 1 100 1 100
87 Painter (Building) 0 0.0 1 100 1 100
88
Road Construction Site
Equipment Operator 0 0.0 1 100 1
100
89 Survey Field Assistant 1 100 0 0.0 1 100
90 Tea Factory Mechanic 0 0.0 1 100 1 100
91 Wharf Clerk 1 100 0 0.0 1 100
92 Not Mention 419 62.7 249 37.2 668 100
Total 2460 52.5 2226 47.5 4686 100
Source- tracer survey details 2013.
63
Above 3.38 table has shown distribution of TVET certificate holder’s employability by their
training courses. The highest numbers among the responded certificate holders are those who
have completed computer application assistant course which amounts to 863. Among them 306
certificate holders are employed which is 35.5% and 557 certificate holders are unemployed
which is 64.5%. Electrician, welder, wood craftsman (furniture), tailor, automobile mechanic etc
have the highest respondent rates among the certificate holders amounting to 331, 185, 153, 150,
and 147 respectively. More than 60% Unemployment rate have reported in Computer
application assistant, Tailor, Professional courses ( AAT,CIMA etc ), wood craftsman (building)
industrials sewing machine operator, electric motor winder, waiter, languages, photographer,
constriction site supervisor, bar bender, agriculture equipment mechanic, telecommunication
technician, room attendants, Sewing Machine Mechanic, Computer Aided Color Matcher,
Construction Equipment Operator, Heavy Vehicle Operator, Pre-School Teacher, Plant Nursery
Development Assistant, Jeweler Stone Setter, Boiler Operator, Fabric Cutter, Florist, Fruit &
Vegetable Processor, Video Editor / Assistant Editor, Animal Feed Mill Operator, Bartender,
Clerk (General), Survey Field Assistant, etc. Among those courses, Boiler Operator, Fabric
Cutter, Florist, Fruit & Vegetable Processor, Video Editor / Assistant Editor, Animal Feed Mill
Operator, Bartender, Clerk (General), Survey Field Assistant, Plant Nursery Development
Assistant have reported 100% unemployment rates. However, this may be because of low
respondent numbers.
More than 70% employment rates have reported by Assistant Quantity Surveyor, Computer
Network Technician, Pattern Maker, Offset Litho Machine Operator, Municipal Solid Waste
Operation Assistant, Jeweler Maker (Goldsmith), Animal Feed Production Assistant (Field
Operations), Industrial Plumber, Milking Machine Operator, Painter (Building), Road
Construction Site Equipment Operator, and Tea Factory Mechanic etc. 100% employment or
unemployment is visible due to single response.

64
Table- 3.39. Distribution of employability by Non NVQ Courses
Course Name
Current Employability
Total Unemployed Employed
amount % amount %
Computer Applications Assistant 100 58.5 71 41.5 171
Others 94 56.3 73 43.7 167
Professional Course (AAT, Accounting,
CIMA, …..etc.) 54 63.5 31 36.5 85
Electrician 28 35.9 50 64.1 78
Tailor 48 73.8 17 26.2 65
Computer Graphic Designer 36 63.2 21 36.8 57
Wood Craftsman (Furniture) 12 24.5 37 75.5 49
Welder 19 43.2 25 56.8 44
Computer Hardware Technician 16 42.1 22 57.9 38
Draughts person 17 50.0 17 50.0 34
Languages 20 64.5 11 35.5 31
Automobile Mechanic 6 20.7 23 79.3 29
Information And Communication Technology
Technician 12 42.9 16 57.1 28
Cook 13 52.0 12 48.0 25
Outboard Motor Mechanic 10 41.7 14 58.3 24
Beautician 13 56.5 10 43.5 23
Construction Craftsman (Masonry) 8 42.1 11 57.9 19
Refrigeration & Air Conditioning Mechanic 10 52.6 9 47.4 19
Industrial Sewing Machine Operator 13 72.2 5 27.8 18
Machinist 8 47.1 9 52.9 17
Waiter/ Steward 11 64.7 6 35.3 17
Construction Equipment Mechanic 4 25.0 12 75.0 16
Assistant Quantity Surveyor 3 21.4 11 78.6 14
Computer Network Technician 3 21.4 11 78.6 14
Landscaping Technician 7 53.8 6 46.2 13
Plumber 3 27.3 8 72.7 11
Radio, TV And Allied Equipment Repairer 7 63.6 4 36.4 11
Aluminum Fabricator 3 33.3 6 66.7 9
Photographer 7 77.8 2 22.2 9
Bar Bender 5 62.5 3 37.5 8
Basic Competencies to Work 4 50.0 4 50.0 8
Hair Dresser 7 87.5 1 12.5 8
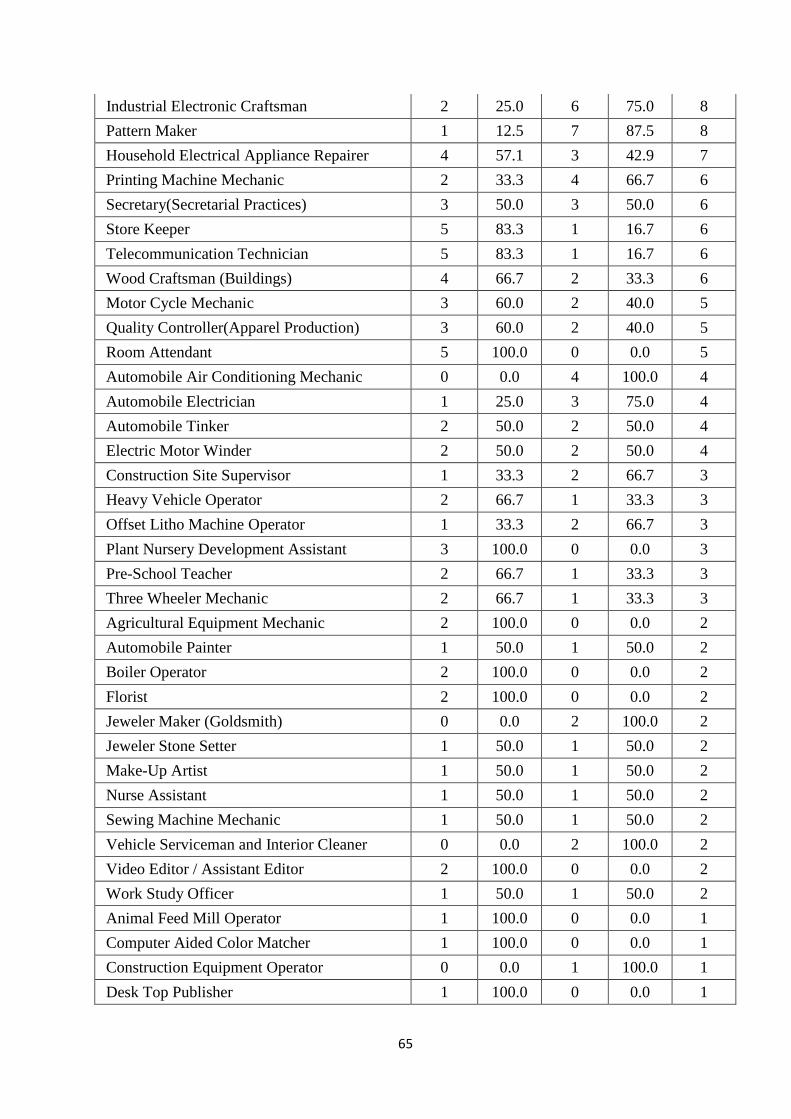
65
Industrial Electronic Craftsman 2 25.0 6 75.0 8
Pattern Maker 1 12.5 7 87.5 8
Household Electrical Appliance Repairer 4 57.1 3 42.9 7
Printing Machine Mechanic 2 33.3 4 66.7 6
Secretary(Secretarial Practices) 3 50.0 3 50.0 6
Store Keeper 5 83.3 1 16.7 6
Telecommunication Technician 5 83.3 1 16.7 6
Wood Craftsman (Buildings) 4 66.7 2 33.3 6
Motor Cycle Mechanic 3 60.0 2 40.0 5
Quality Controller(Apparel Production) 3 60.0 2 40.0 5
Room Attendant 5 100.0 0 0.0 5
Automobile Air Conditioning Mechanic 0 0.0 4 100.0 4
Automobile Electrician 1 25.0 3 75.0 4
Automobile Tinker 2 50.0 2 50.0 4
Electric Motor Winder 2 50.0 2 50.0 4
Construction Site Supervisor 1 33.3 2 66.7 3
Heavy Vehicle Operator 2 66.7 1 33.3 3
Offset Litho Machine Operator 1 33.3 2 66.7 3
Plant Nursery Development Assistant 3 100.0 0 0.0 3
Pre-School Teacher 2 66.7 1 33.3 3
Three Wheeler Mechanic 2 66.7 1 33.3 3
Agricultural Equipment Mechanic 2 100.0 0 0.0 2
Automobile Painter 1 50.0 1 50.0 2
Boiler Operator 2 100.0 0 0.0 2
Florist 2 100.0 0 0.0 2
Jeweler Maker (Goldsmith) 0 0.0 2 100.0 2
Jeweler Stone Setter 1 50.0 1 50.0 2
Make-Up Artist 1 50.0 1 50.0 2
Nurse Assistant 1 50.0 1 50.0 2
Sewing Machine Mechanic 1 50.0 1 50.0 2
Vehicle Serviceman and Interior Cleaner 0 0.0 2 100.0 2
Video Editor / Assistant Editor 2 100.0 0 0.0 2
Work Study Officer 1 50.0 1 50.0 2
Animal Feed Mill Operator 1 100.0 0 0.0 1
Computer Aided Color Matcher 1 100.0 0 0.0 1
Construction Equipment Operator 0 0.0 1 100.0 1
Desk Top Publisher 1 100.0 0 0.0 1

66
Domestic House Keeping Assistant 0 0.0 1 100.0 1
Fabric Cutter 1 100.0 0 0.0 1
Footwear Craftsman 1 100.0 0 0.0 1
Lapidaries 1 100.0 0 0.0 1
Milking Machine Operator 0 0.0 1 100.0 1
Municipal Solid Waste Operation Assistant 1 100.0 0 0.0 1
Production Supervisor (Sewing ) 1 100.0 0 0.0 1
Road Construction Site Equipment Operator 0 0.0 1 100.0 1
Tea Factory Mechanic 0 0.0 1 100.0 1
Not Mention 33 36.1 45 63.9 78
Total 709 51.6 667 48.4 1376
Above 3.39 table has shown distribution of TVET certificate holder’s employability by Non
NVQ courses. The highest numbers of responded certificate holders are reported from computer
application assistant course which amount is 171. Among them 100 certificate holders are
Unemployed which is 58.5% and 71 certificate holders are employed which is 41.5%.
Professional courses ( AAT,CIMA etc ), Electrician, Tailor, computer graphic designer, wood
craftsman (furniture), welder etc have the highest respondent rates among the certificate holders
amounting to 85, 78, 65, 57, 49 and 44 respectively.
Among Non NVQ courses (more than 30 persons ware responded,) highest Unemployment rate
have reported in computer application assistant, Professional Course (AAT, Accounting,
CIMA,…..etc, Tailor, Computer graphic designer and languages etc.
Among Non NVQ courses (more than 30 persons ware responded,) highest Employment rate
have reported in Electrician, wood craftsman (furniture), welder, Computer hardware technician
etc. and 100% employment or unemployment is visible due to single response.
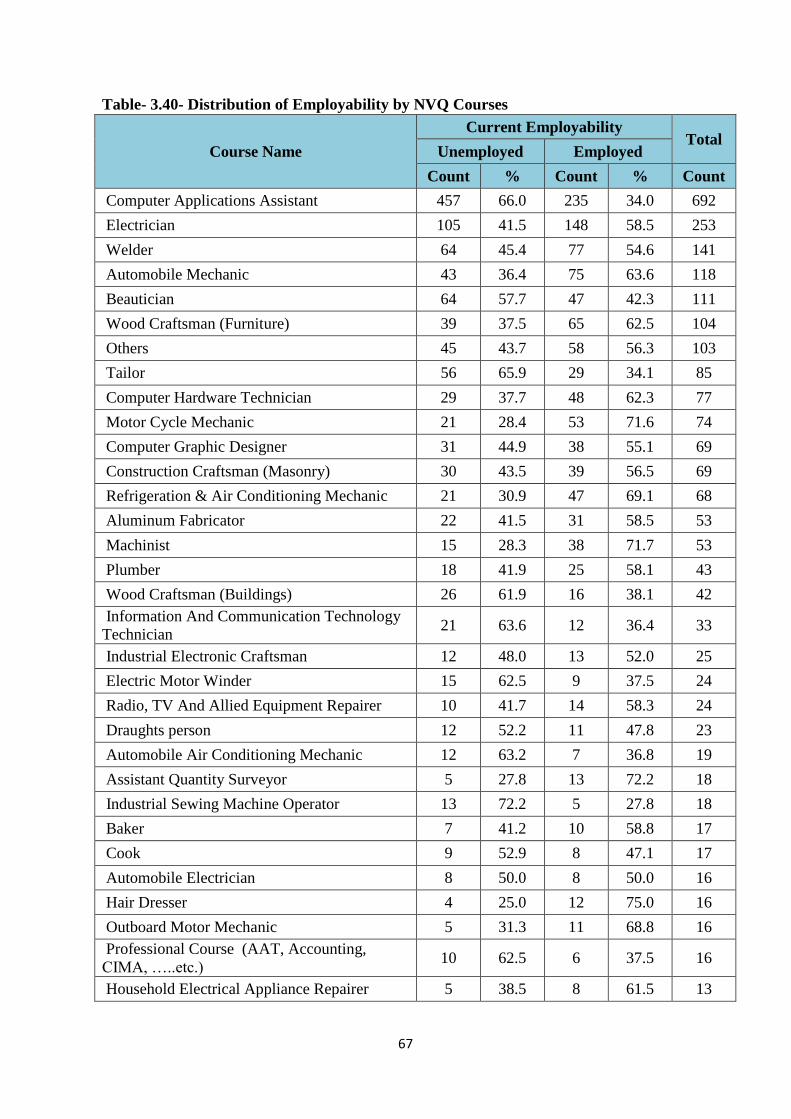
67
Table- 3.40- Distribution of Employability by NVQ Courses
Course Name
Current Employability Total
Unemployed Employed
Count % Count % Count
Computer Applications Assistant 457 66.0 235 34.0 692
Electrician 105 41.5 148 58.5 253
Welder 64 45.4 77 54.6 141
Automobile Mechanic 43 36.4 75 63.6 118
Beautician 64 57.7 47 42.3 111
Wood Craftsman (Furniture) 39 37.5 65 62.5 104
Others 45 43.7 58 56.3 103
Tailor 56 65.9 29 34.1 85
Computer Hardware Technician 29 37.7 48 62.3 77
Motor Cycle Mechanic 21 28.4 53 71.6 74
Computer Graphic Designer 31 44.9 38 55.1 69
Construction Craftsman (Masonry) 30 43.5 39 56.5 69
Refrigeration & Air Conditioning Mechanic 21 30.9 47 69.1 68
Aluminum Fabricator 22 41.5 31 58.5 53
Machinist 15 28.3 38 71.7 53
Plumber 18 41.9 25 58.1 43
Wood Craftsman (Buildings) 26 61.9 16 38.1 42
Information And Communication Technology
Technician 21 63.6 12 36.4 33
Industrial Electronic Craftsman 12 48.0 13 52.0 25
Electric Motor Winder 15 62.5 9 37.5 24
Radio, TV And Allied Equipment Repairer 10 41.7 14 58.3 24
Draughts person 12 52.2 11 47.8 23
Automobile Air Conditioning Mechanic 12 63.2 7 36.8 19
Assistant Quantity Surveyor 5 27.8 13 72.2 18
Industrial Sewing Machine Operator 13 72.2 5 27.8 18
Baker 7 41.2 10 58.8 17
Cook 9 52.9 8 47.1 17
Automobile Electrician 8 50.0 8 50.0 16
Hair Dresser 4 25.0 12 75.0 16
Outboard Motor Mechanic 5 31.3 11 68.8 16
Professional Course (AAT, Accounting,
CIMA, …..etc.) 10 62.5 6 37.5 16
Household Electrical Appliance Repairer 5 38.5 8 61.5 13
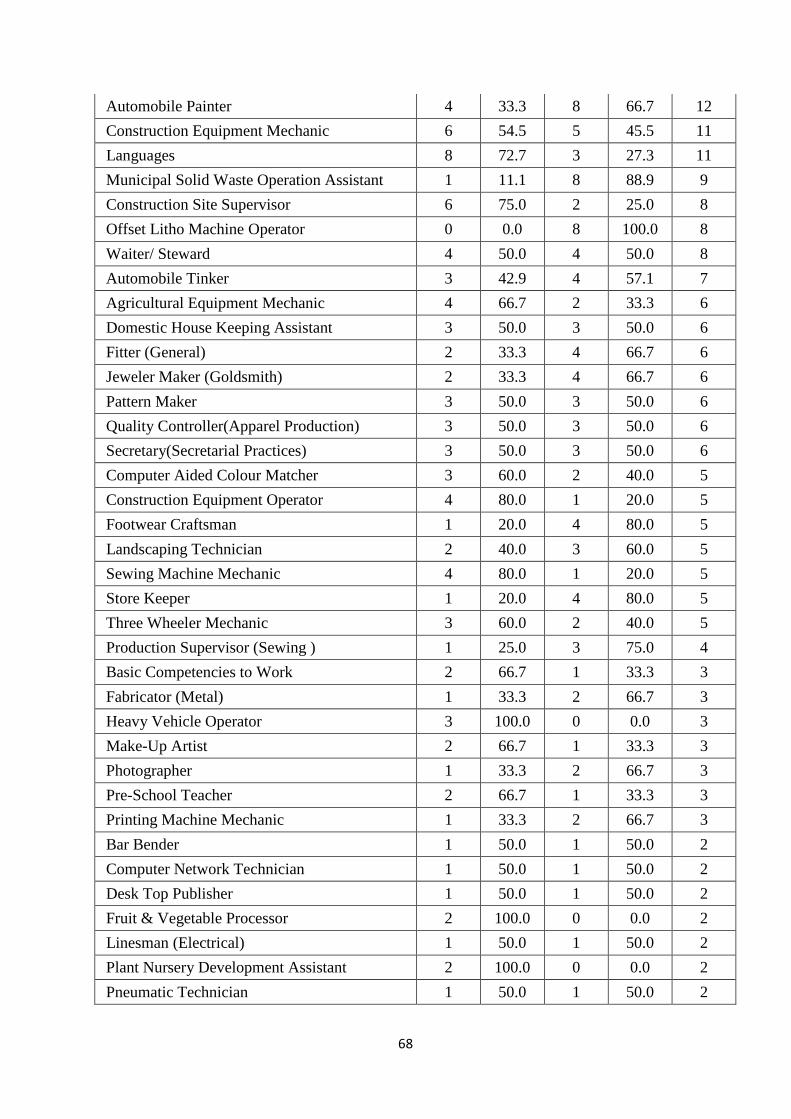
68
Automobile Painter 4 33.3 8 66.7 12
Construction Equipment Mechanic 6 54.5 5 45.5 11
Languages 8 72.7 3 27.3 11
Municipal Solid Waste Operation Assistant 1 11.1 8 88.9 9
Construction Site Supervisor 6 75.0 2 25.0 8
Offset Litho Machine Operator 0 0.0 8 100.0 8
Waiter/ Steward 4 50.0 4 50.0 8
Automobile Tinker 3 42.9 4 57.1 7
Agricultural Equipment Mechanic 4 66.7 2 33.3 6
Domestic House Keeping Assistant 3 50.0 3 50.0 6
Fitter (General) 2 33.3 4 66.7 6
Jeweler Maker (Goldsmith) 2 33.3 4 66.7 6
Pattern Maker 3 50.0 3 50.0 6
Quality Controller(Apparel Production) 3 50.0 3 50.0 6
Secretary(Secretarial Practices) 3 50.0 3 50.0 6
Computer Aided Colour Matcher 3 60.0 2 40.0 5
Construction Equipment Operator 4 80.0 1 20.0 5
Footwear Craftsman 1 20.0 4 80.0 5
Landscaping Technician 2 40.0 3 60.0 5
Sewing Machine Mechanic 4 80.0 1 20.0 5
Store Keeper 1 20.0 4 80.0 5
Three Wheeler Mechanic 3 60.0 2 40.0 5
Production Supervisor (Sewing ) 1 25.0 3 75.0 4
Basic Competencies to Work 2 66.7 1 33.3 3
Fabricator (Metal) 1 33.3 2 66.7 3
Heavy Vehicle Operator 3 100.0 0 0.0 3
Make-Up Artist 2 66.7 1 33.3 3
Photographer 1 33.3 2 66.7 3
Pre-School Teacher 2 66.7 1 33.3 3
Printing Machine Mechanic 1 33.3 2 66.7 3
Bar Bender 1 50.0 1 50.0 2
Computer Network Technician 1 50.0 1 50.0 2
Desk Top Publisher 1 50.0 1 50.0 2
Fruit & Vegetable Processor 2 100.0 0 0.0 2
Linesman (Electrical) 1 50.0 1 50.0 2
Plant Nursery Development Assistant 2 100.0 0 0.0 2
Pneumatic Technician 1 50.0 1 50.0 2
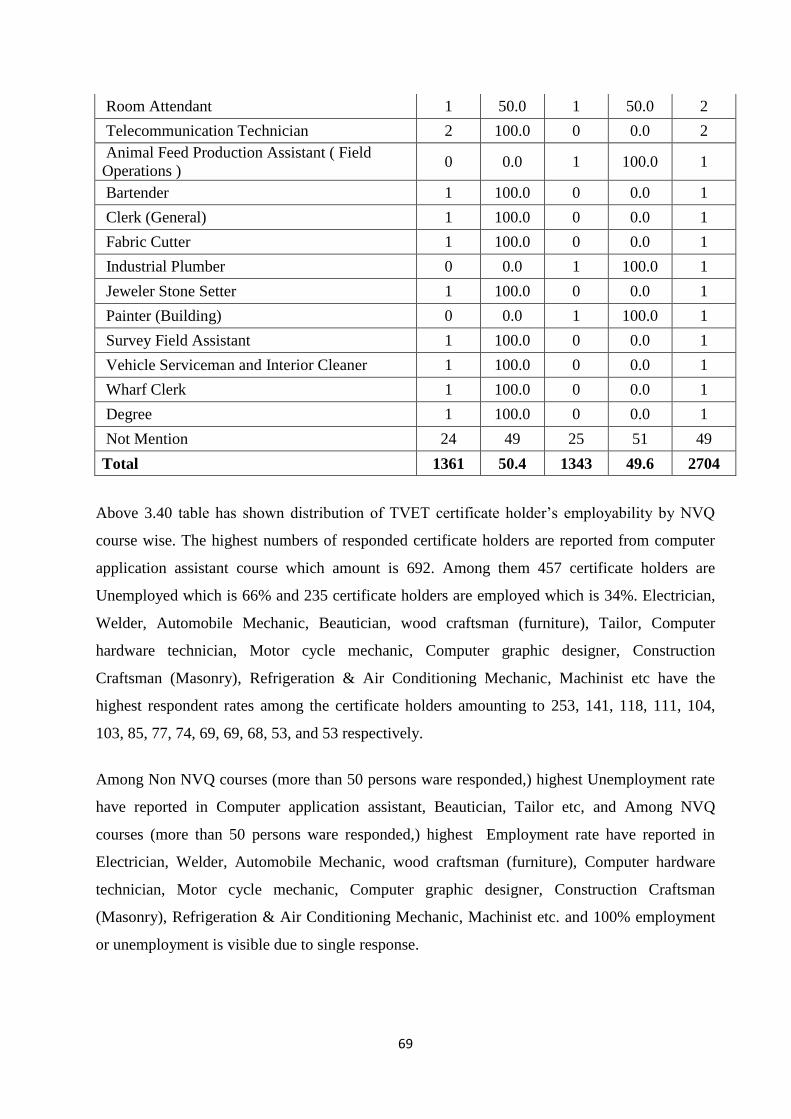
69
Room Attendant 1 50.0 1 50.0 2
Telecommunication Technician 2 100.0 0 0.0 2
Animal Feed Production Assistant ( Field
Operations ) 0 0.0 1 100.0 1
Bartender 1 100.0 0 0.0 1
Clerk (General) 1 100.0 0 0.0 1
Fabric Cutter 1 100.0 0 0.0 1
Industrial Plumber 0 0.0 1 100.0 1
Jeweler Stone Setter 1 100.0 0 0.0 1
Painter (Building) 0 0.0 1 100.0 1
Survey Field Assistant 1 100.0 0 0.0 1
Vehicle Serviceman and Interior Cleaner 1 100.0 0 0.0 1
Wharf Clerk 1 100.0 0 0.0 1
Degree 1 100.0 0 0.0 1
Not Mention 24 49 25 51 49
Total 1361 50.4 1343 49.6 2704
Above 3.40 table has shown distribution of TVET certificate holder’s employability by NVQ
course wise. The highest numbers of responded certificate holders are reported from computer
application assistant course which amount is 692. Among them 457 certificate holders are
Unemployed which is 66% and 235 certificate holders are employed which is 34%. Electrician,
Welder, Automobile Mechanic, Beautician, wood craftsman (furniture), Tailor, Computer
hardware technician, Motor cycle mechanic, Computer graphic designer, Construction
Craftsman (Masonry), Refrigeration & Air Conditioning Mechanic, Machinist etc have the
highest respondent rates among the certificate holders amounting to 253, 141, 118, 111, 104,
103, 85, 77, 74, 69, 69, 68, 53, and 53 respectively.
Among Non NVQ courses (more than 50 persons ware responded,) highest Unemployment rate
have reported in Computer application assistant, Beautician, Tailor etc, and Among NVQ
courses (more than 50 persons ware responded,) highest Employment rate have reported in
Electrician, Welder, Automobile Mechanic, wood craftsman (furniture), Computer hardware
technician, Motor cycle mechanic, Computer graphic designer, Construction Craftsman
(Masonry), Refrigeration & Air Conditioning Mechanic, Machinist etc. and 100% employment
or unemployment is visible due to single response.

70
Table- 3.41. Relevance of the Job
Number Percentage
Yes 1801 81
No 425 19
Total 2226 100.0
Source- tracer survey details 2013.
Figure 3.42- Relevance of the Job
Source- tracer survey details 2013.
Above 3.41 table and 3.42 figure describe the relevance of Vocational Training to their
respective jobs. It is clearly shows that the training provided by TVET institute is directly
relevant to their which is 81%. And 19% of participants say that the training provided by TVET
is less relevant to the job.
Table 3.42 Relevance of TVET to self employment by NVQ and Non NVQ
Qualification
Mode
Relevance of TVET to Self employment Total
Yes No
Frequency % Frequency % Frequency %
Non NVQ 78 79.3 21 20.7 99 100
NVQ 181 88.1 23 11.9 204 100
Not mentioned 5 55.5 4 44.5 9 100
Total 264 85.6 45 14.4 312 100
Source- tracer survey details 2013.
81%
19%
Yes No
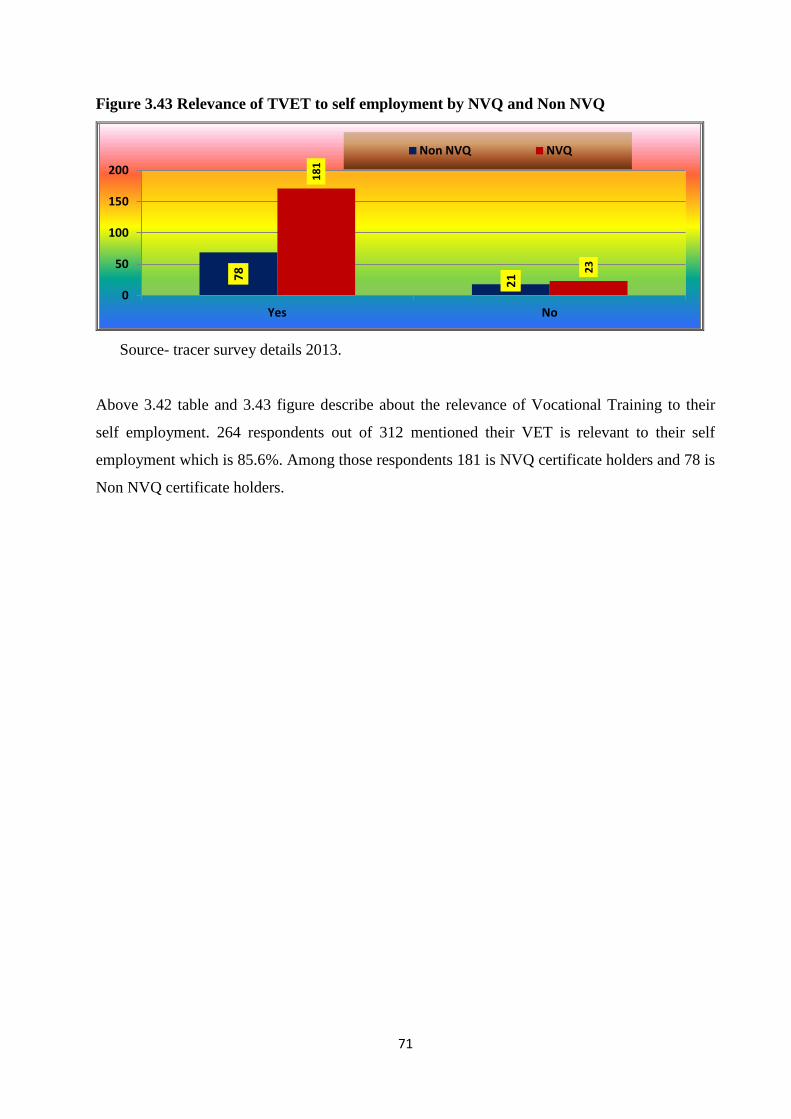
71
Figure 3.43 Relevance of TVET to self employment by NVQ and Non NVQ
Source- tracer survey details 2013.
Above 3.42 table and 3.43 figure describe about the relevance of Vocational Training to their
self employment. 264 respondents out of 312 mentioned their VET is relevant to their self
employment which is 85.6%. Among those respondents 181 is NVQ certificate holders and 78 is
Non NVQ certificate holders.
78
21
18
1
23
0
50
100
150
200
Yes No
Non NVQ NVQ

72
Table 3.43 - TVET relevance to the Self employment by educational qualification.
Educational
Qualification
Relevance of job to TVET received Total
Yes No
Frequency % Frequency % Frequency %
1-5 Years 5 83.3 1 16.7 6 100
5-Upto GCE
O/L 94 91.3 9 8.7 103 100
Passed GCE
O/L 38 86.4 6 13.6 44 100
Up to GCE
A/L 54 85.7 9 14.3 63 100
Passed GCE
A/L 63 77.8 18 22.2 81 100
Degree and
above 5 83.3 1 16.7 6 100
Not Mentioned 5 55.5 4 44.5 9 100
Total 264 85.6 48 14.4 312 100
Source- tracer survey details 2013.
Figure 3.44 - TVET relevance to the Self employment by educational qualification.
Source- tracer survey details 2013.
Above data shows the relevance of Vocational Training to self employment by educational
qualifications. Most respondents of all educational categories have mentioned that vocational
training is highly relevant to their self employment. 103 respondents out of 303 represent
between grades 5 to GCE O/L educational category out of which 91.3% say that the TVET
training received is relevant to their self employment.
0
10
20
30
40
50
60
70
80
90
100
1-5 Years 5-Upto GCEO/L
Passed GCEO/L
Up to GCE A/L Passed GCEA/L
Degree andabove
Yes
No
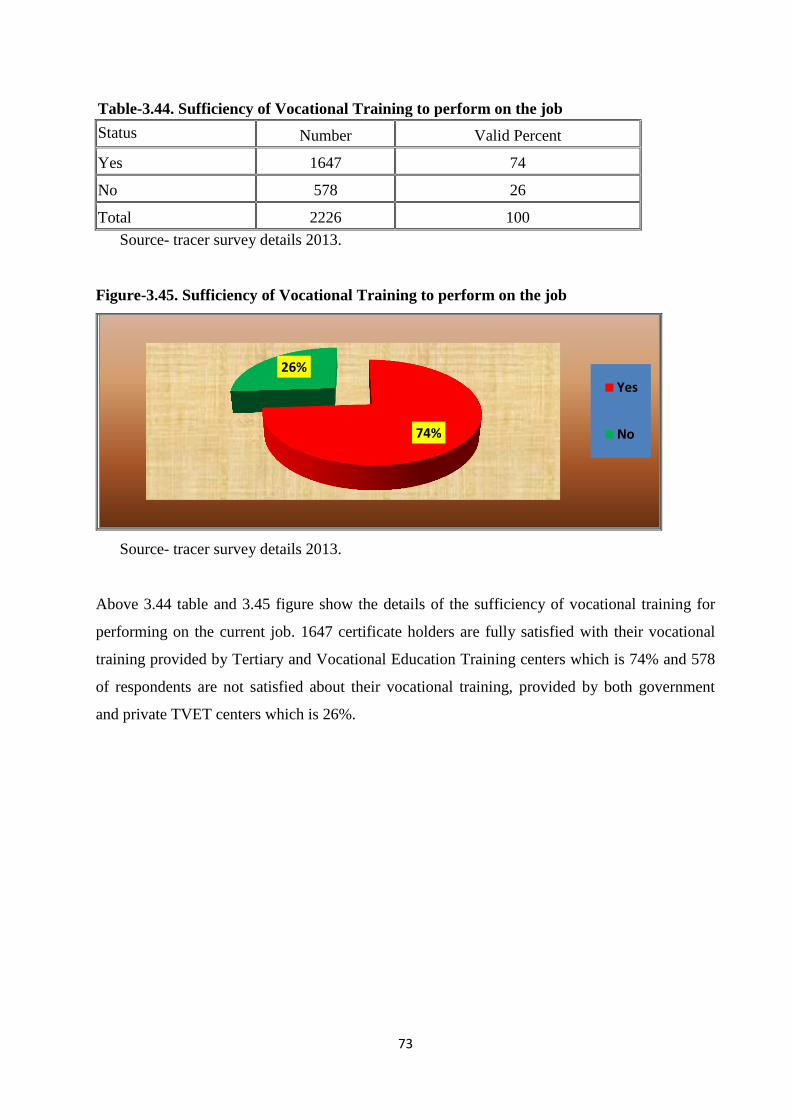
73
Table-3.44. Sufficiency of Vocational Training to perform on the job
Status Number Valid Percent
Yes 1647 74
No 578 26
Total 2226 100
Source- tracer survey details 2013.
Figure-3.45. Sufficiency of Vocational Training to perform on the job
Source- tracer survey details 2013.
Above 3.44 table and 3.45 figure show the details of the sufficiency of vocational training for
performing on the current job. 1647 certificate holders are fully satisfied with their vocational
training provided by Tertiary and Vocational Education Training centers which is 74% and 578
of respondents are not satisfied about their vocational training, provided by both government
and private TVET centers which is 26%.
74%
26%
Yes
No
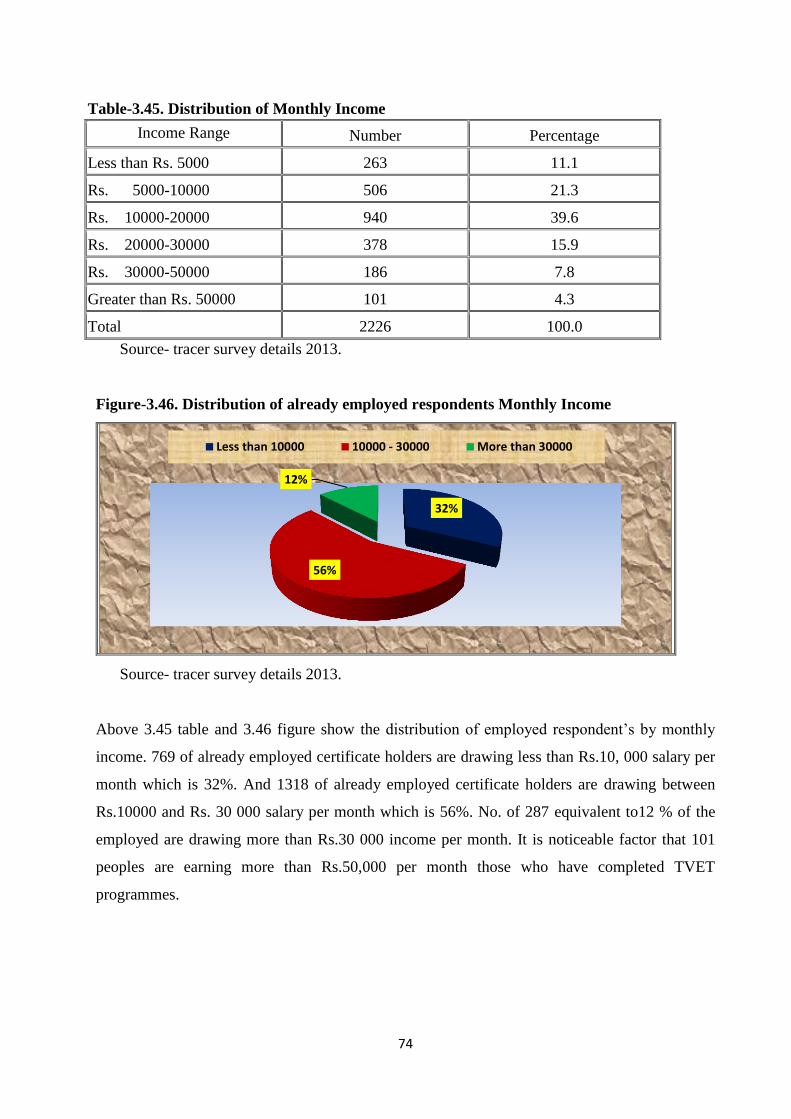
74
Table-3.45. Distribution of Monthly Income
Income Range Number Percentage
Less than Rs. 5000 263 11.1
Rs. 5000-10000 506 21.3
Rs. 10000-20000 940 39.6
Rs. 20000-30000 378 15.9
Rs. 30000-50000 186 7.8
Greater than Rs. 50000 101 4.3
Total 2226 100.0
Source- tracer survey details 2013.
Figure-3.46. Distribution of already employed respondents Monthly Income
Source- tracer survey details 2013.
Above 3.45 table and 3.46 figure show the distribution of employed respondent’s by monthly
income. 769 of already employed certificate holders are drawing less than Rs.10, 000 salary per
month which is 32%. And 1318 of already employed certificate holders are drawing between
Rs.10000 and Rs. 30 000 salary per month which is 56%. No. of 287 equivalent to12 % of the
employed are drawing more than Rs.30 000 income per month. It is noticeable factor that 101
peoples are earning more than Rs.50,000 per month those who have completed TVET
programmes.
32%
56%
12%
Less than 10000 10000 - 30000 More than 30000

75
Table 3.46 – Distribution of monthly income by training programmers
Course Name
Income Category
Not
mentioned
Total Less than
10000
10000 -
30000
More
than
30000
Computer Applications Assistant 138 171 19 328
Electrician 61 119 27 207
Others 44 72 20 136
Wood Craftsman (Furniture) 19 67 22 108
Welder 27 63 15 105
Automobile Mechanic 30 63 8 101
Computer Hardware Technician 25 43 7 75
Beautician 37 29 5 71
Computer Graphic Designer 23 32 9 64
Motor Cycle Mechanic 21 31 8 60
Refrigeration & Air Conditioning
Mechanic 12 35 10 57
Tailor 41 12 3 56
Construction Craftsman
(Masonry) 9 36 8 53
Machinist 9 27 11 47
Professional Course (AAT,
Accounting, CIMA, …..etc.) 14 21 6 41
Not Mention 10 26 5 41
Aluminum Fabricator 11 26 3 40
Plumber 13 16 3 32
Information And Communication
Technology Technician 9 16 3 28
Outboard Motor Mechanic 3 19 6 28
Draughts person 9 16 2 27
Assistant Quantity Surveyor 1 16 7 24
Cook 8 13 1 22
Industrial Electronic Craftsman 3 12 4 19
Wood Craftsman (Buildings) 3 11 4 18
Radio, TV And Allied Equipment
Repairer 6 8 4 18
Construction Equipment
Mechanic 3 13 1 17
Languages 7 9 0 16
Hair Dresser 3 9 4 16

76
Automobile Electrician 3 10 3 16
Industrial Sewing Machine
Operator 8 3 2 13
Electric Motor Winder 3 8 1 12
Household Electrical Appliance
Repairer 5 6 1 12
Computer Network Technician 2 7 3 12
Waiter/ Steward 5 5 1 11
Automobile Air Conditioning
Mechanic 4 6 1 11
Baker 2 6 3 11
Pattern Maker 6 4 1 11
Offset Litho Machine Operator 2 8 1 11
Landscaping Technician 2 4 3 9
Automobile Painter 2 5 2 9
Automobile Tinker 0 7 1 8
Municipal Solid Waste Operation
Assistant 2 6 0 8
Photographer 1 5 0 6
Secretary(Secretarial Practices) 1 5 0 6
Printing Machine Mechanic 2 2 2 6
Basic Competencies to Work 2 2 1 5
Construction Site Supervisor 1 3 1 5
Quality Controller(Apparel
Production) 4 1 0 5
Store Keeper 0 4 1 5
Jeweler Maker (Goldsmith) 0 3 2 5
Footwear Craftsman 3 2 0 5
Bar Bender 1 3 0 4
Domestic House Keeping
Assistant 1 3 0 4
Fitter (General) 2 1 1 4
Production Supervisor (Sewing ) 1 3 0 4
Three Wheeler Mechanic 0 3 0 3
Pre-School Teacher 0 2 1 3
Make-Up Artist 2 1 0 3
Agricultural Equipment
Mechanic 2 0 0 2
Telecommunication Technician 0 2 0 2
Sewing Machine Mechanic 0 2 0 2

77
Computer Aided Colour Matcher 2 0 0 2
Construction Equipment Operator 1 1 0 2
Desk Top Publisher 2 0 0 2
Fabricator (Metal) 2 0 0 2
Vehicle Serviceman and Interior
Cleaner 0 1 1 2
Heavy Vehicle Operator 0 1 0 1
Plant Nursery Development
Assistant 1 0 0 1
Jeweler Stone Setter 0 1 0 1
Linesman (Electrical) 0 1 0 1
Nurse Assistant 0 1 0 1
Pneumatic Technician 0 1 0 1
Video Editor / Assistant Editor 0 1 0 1
Work Study Officer 0 1 0 1
Animal Feed Production
Assistant ( Field Operations ) 0 1 0 1
Industrial Plumber 0 1 0 1
Milking Machine Operator 0 1 0 1
Painter (Building) 0 0 1 1
Road Construction Site
Equipment Operator 1 0 0 1
Tea Factory Mechanic 0 0 1 1
Room Attendant 0 0 0 0
Boiler Operator 0 0 0 0
Fabric Cutter 0 0 0 0
Florist 0 0 0 0
Fruit & Vegetable Processor 0 0 0 0
Animal Feed Mill Operator 0 0 0 0
Bartender 0 0 0 0
Clerk (General) 0 0 0 0
Lapidaries 0 0 0 0
Survey Field Assistant 0 0 0 0
Wharf Clerk 0 0 0 0
Degree 0 0 0 0
Total 677 1175 260 114 2226
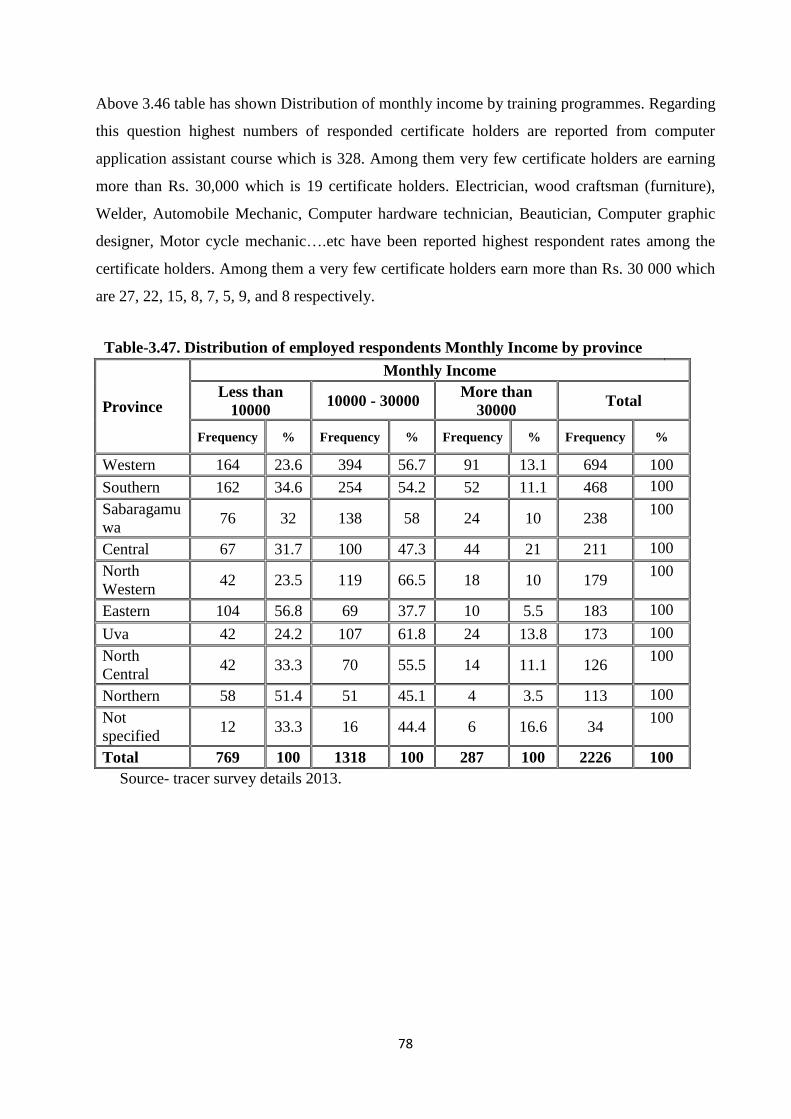
78
Above 3.46 table has shown Distribution of monthly income by training programmes. Regarding
this question highest numbers of responded certificate holders are reported from computer
application assistant course which is 328. Among them very few certificate holders are earning
more than Rs. 30,000 which is 19 certificate holders. Electrician, wood craftsman (furniture),
Welder, Automobile Mechanic, Computer hardware technician, Beautician, Computer graphic
designer, Motor cycle mechanic….etc have been reported highest respondent rates among the
certificate holders. Among them a very few certificate holders earn more than Rs. 30 000 which
are 27, 22, 15, 8, 7, 5, 9, and 8 respectively.
Table-3.47. Distribution of employed respondents Monthly Income by province
Province
Monthly Income
Less than
10000 10000 - 30000
More than
30000 Total
Frequency % Frequency % Frequency % Frequency %
Western 164 23.6 394 56.7 91 13.1 694 100
Southern 162 34.6 254 54.2 52 11.1 468 100
Sabaragamu
wa 76 32 138 58 24 10 238
100
Central 67 31.7 100 47.3 44 21 211 100
North
Western 42 23.5 119 66.5 18 10 179
100
Eastern 104 56.8 69 37.7 10 5.5 183 100
Uva 42 24.2 107 61.8 24 13.8 173 100
North
Central 42 33.3 70 55.5 14 11.1 126
100
Northern 58 51.4 51 45.1 4 3.5 113 100
Not
specified 12 33.3 16 44.4 6 16.6 34
100
Total 769 100 1318 100 287 100 2226 100
Source- tracer survey details 2013.

79
Figure-3.47. Distribution of employed respondents Monthly Income by province
Source- tracer survey details 2013.
Above 3.47 table and 3.47 figure have shown the distribution of certificate holders’ monthly
income by province. Only 2374 have responded to this question. Western, southern province,
Sabaragamuwa, North western, North, central and Uva provinces have shown majority of
employed certificate holders who earn between Rs.10 000 – Rs.30 000 income per month.
Especially in the central province 21 % certificate holders earn more than 30 000 salary per
month. Northern Province and Eastern province show majority of employed certificate holders
earn less than 10 000 income per month i.e. 51.4 % and 51.8 % respectively.
Table-3.48. Distribution of employed respondents Monthly Income by gender
Gender
Monthly Income
Less than
10000
% 10000 -
30000
% More than
30000 %
Male 428 25.2 1033 60.8 237 14
Female 330 50.6 273 42 48 7.4
Not specified 11 44 12 48 2 8
Source- tracer survey details 2013.
Figure-3.48. Distribution of employed respondents Monthly Income by gender
Source- tracer survey details 2013.
0
100
200
300
400
500
Western Southern Sabaragamuwa Central North Western Eastern Uva North Central Northern
Less than 10000 10000 - 30000 More than 30000
0
500
1000
1500
Less than 10000 10000 - 30000 More than 30000
42
8
10
33
23
7
33
0
27
3
48
Male Female
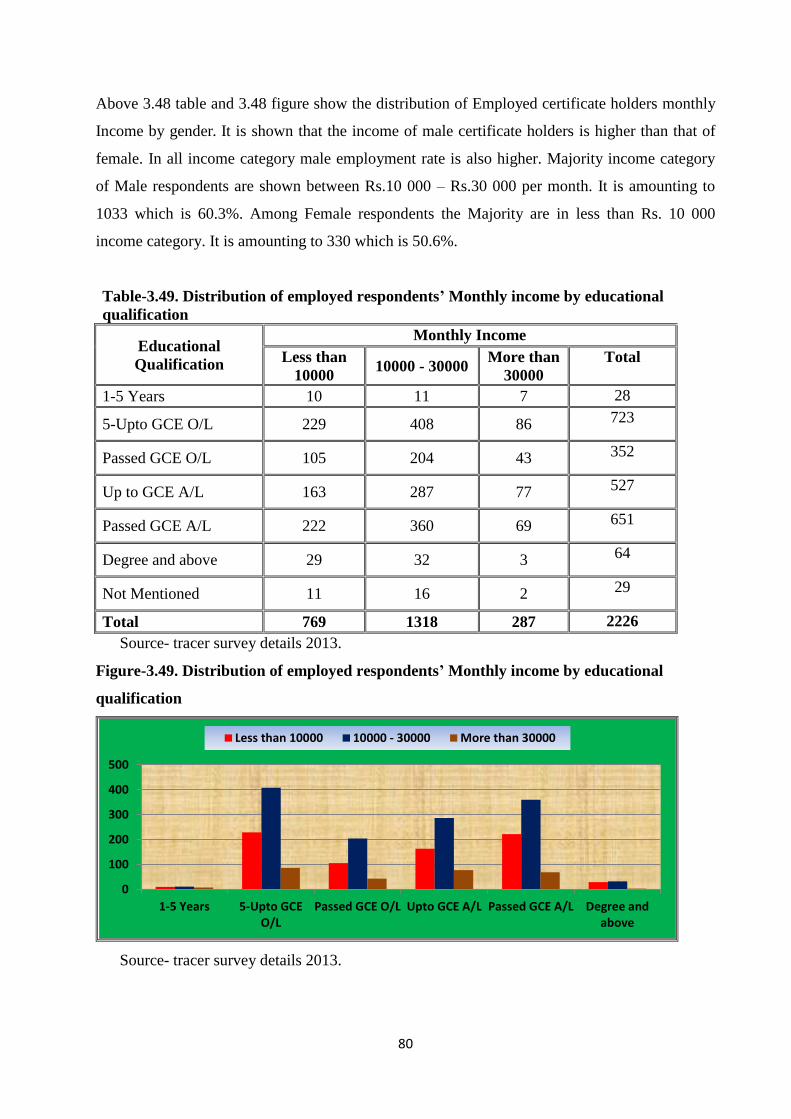
80
Above 3.48 table and 3.48 figure show the distribution of Employed certificate holders monthly
Income by gender. It is shown that the income of male certificate holders is higher than that of
female. In all income category male employment rate is also higher. Majority income category
of Male respondents are shown between Rs.10 000 – Rs.30 000 per month. It is amounting to
1033 which is 60.3%. Among Female respondents the Majority are in less than Rs. 10 000
income category. It is amounting to 330 which is 50.6%.
Table-3.49. Distribution of employed respondents’ Monthly income by educational
qualification
Educational
Qualification
Monthly Income
Less than
10000 10000 - 30000
More than
30000
Total
1-5 Years 10 11 7 28
5-Upto GCE O/L 229 408 86 723
Passed GCE O/L 105 204 43 352
Up to GCE A/L 163 287 77 527
Passed GCE A/L 222 360 69 651
Degree and above 29 32 3 64
Not Mentioned 11 16 2 29
Total 769 1318 287 2226
Source- tracer survey details 2013.
Figure-3.49. Distribution of employed respondents’ Monthly income by educational
qualification
Source- tracer survey details 2013.
0
100
200
300
400
500
1-5 Years 5-Upto GCEO/L
Passed GCE O/L Upto GCE A/L Passed GCE A/L Degree andabove
Less than 10000 10000 - 30000 More than 30000
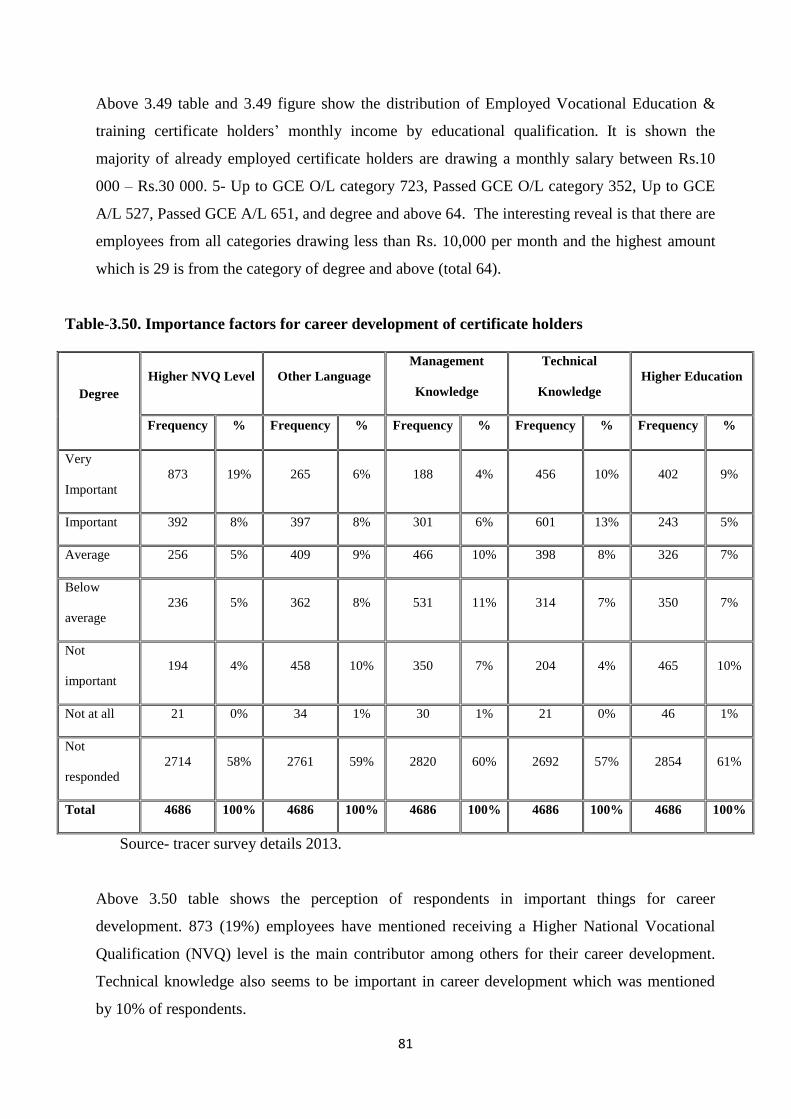
81
Above 3.49 table and 3.49 figure show the distribution of Employed Vocational Education &
training certificate holders’ monthly income by educational qualification. It is shown the
majority of already employed certificate holders are drawing a monthly salary between Rs.10
000 – Rs.30 000. 5- Up to GCE O/L category 723, Passed GCE O/L category 352, Up to GCE
A/L 527, Passed GCE A/L 651, and degree and above 64. The interesting reveal is that there are
employees from all categories drawing less than Rs. 10,000 per month and the highest amount
which is 29 is from the category of degree and above (total 64).
Table-3.50. Importance factors for career development of certificate holders
Degree
Higher NVQ Level Other Language
Management
Knowledge
Technical
Knowledge
Higher Education
Frequency % Frequency % Frequency % Frequency % Frequency %
Very
Important
873 19% 265 6% 188 4% 456 10% 402 9%
Important 392 8% 397 8% 301 6% 601 13% 243 5%
Average 256 5% 409 9% 466 10% 398 8% 326 7%
Below
average
236 5% 362 8% 531 11% 314 7% 350 7%
Not
important
194 4% 458 10% 350 7% 204 4% 465 10%
Not at all 21 0% 34 1% 30 1% 21 0% 46 1%
Not
responded
2714 58% 2761 59% 2820 60% 2692 57% 2854 61%
Total 4686 100% 4686 100% 4686 100% 4686 100% 4686 100%
Source- tracer survey details 2013.
Above 3.50 table shows the perception of respondents in important things for career
development. 873 (19%) employees have mentioned receiving a Higher National Vocational
Qualification (NVQ) level is the main contributor among others for their career development.
Technical knowledge also seems to be important in career development which was mentioned
by 10% of respondents.
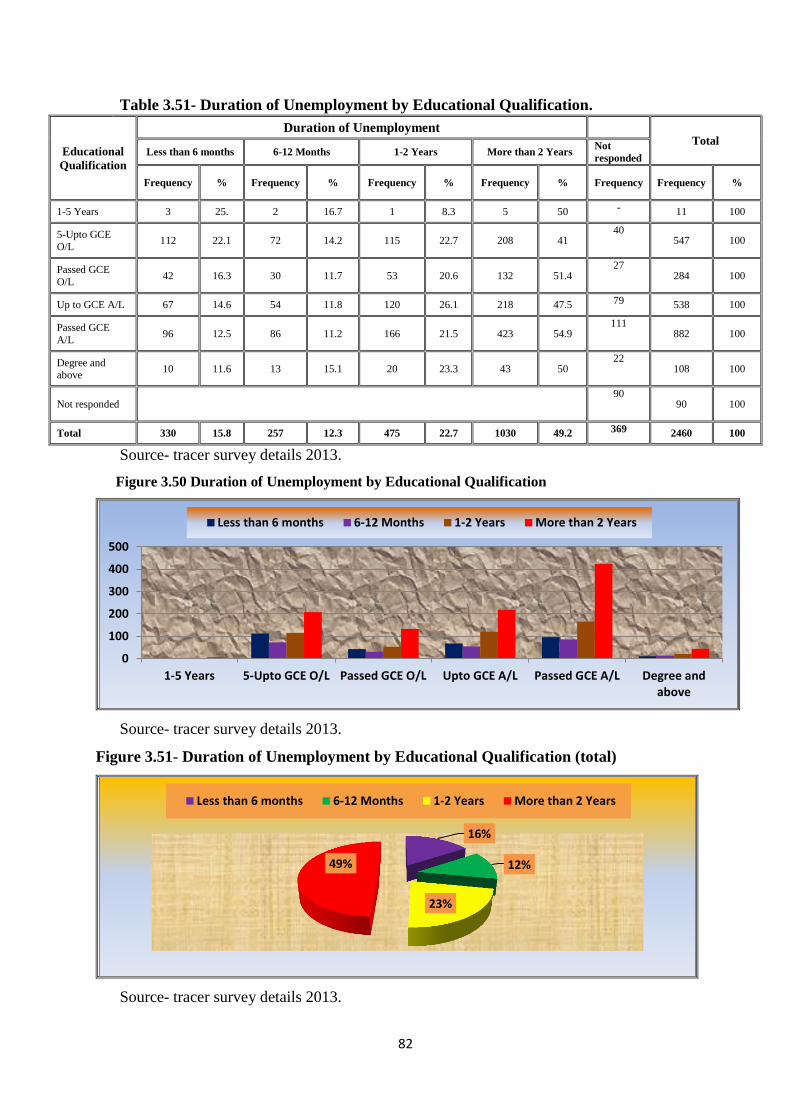
82
Table 3.51- Duration of Unemployment by Educational Qualification.
Educational
Qualification
Duration of Unemployment
Total Less than 6 months 6-12 Months 1-2 Years More than 2 Years
Not
responded
Frequency % Frequency % Frequency % Frequency % Frequency Frequency %
1-5 Years 3 25. 2 16.7 1 8.3 5 50 - 11 100
5-Upto GCE
O/L 112 22.1 72 14.2 115 22.7 208 41
40 547 100
Passed GCE
O/L 42 16.3 30 11.7 53 20.6 132 51.4
27 284 100
Up to GCE A/L 67 14.6 54 11.8 120 26.1 218 47.5 79 538 100
Passed GCE
A/L 96 12.5 86 11.2 166 21.5 423 54.9
111 882 100
Degree and above
10 11.6 13 15.1 20 23.3 43 50 22
108 100
Not responded
90 90 100
Total 330 15.8 257 12.3 475 22.7 1030 49.2 369 2460 100
Source- tracer survey details 2013.
Figure 3.50 Duration of Unemployment by Educational Qualification
Source- tracer survey details 2013.
Figure 3.51- Duration of Unemployment by Educational Qualification (total)
Source- tracer survey details 2013.
0
100
200
300
400
500
1-5 Years 5-Upto GCE O/L Passed GCE O/L Upto GCE A/L Passed GCE A/L Degree andabove
Less than 6 months 6-12 Months 1-2 Years More than 2 Years
16%
12%
23%
49%
Less than 6 months 6-12 Months 1-2 Years More than 2 Years
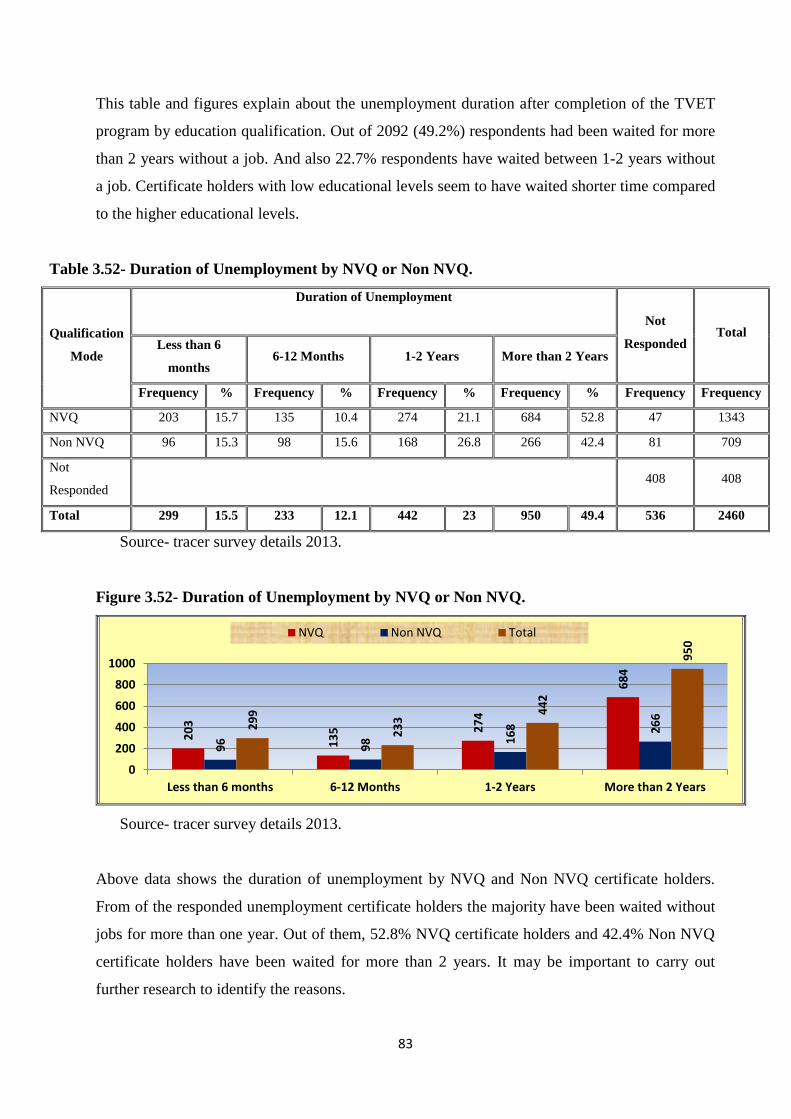
83
This table and figures explain about the unemployment duration after completion of the TVET
program by education qualification. Out of 2092 (49.2%) respondents had been waited for more
than 2 years without a job. And also 22.7% respondents have waited between 1-2 years without
a job. Certificate holders with low educational levels seem to have waited shorter time compared
to the higher educational levels.
Table 3.52- Duration of Unemployment by NVQ or Non NVQ.
Qualification
Mode
Duration of Unemployment
Not
Responded Total
Less than 6
months 6-12 Months 1-2 Years More than 2 Years
Frequency % Frequency % Frequency % Frequency % Frequency Frequency
NVQ 203 15.7 135 10.4 274 21.1 684 52.8 47 1343
Non NVQ 96 15.3 98 15.6 168 26.8 266 42.4 81 709
Not
Responded 408 408
Total 299 15.5 233 12.1 442 23 950 49.4 536 2460
Source- tracer survey details 2013.
Figure 3.52- Duration of Unemployment by NVQ or Non NVQ.
Source- tracer survey details 2013.
Above data shows the duration of unemployment by NVQ and Non NVQ certificate holders.
From of the responded unemployment certificate holders the majority have been waited without
jobs for more than one year. Out of them, 52.8% NVQ certificate holders and 42.4% Non NVQ
certificate holders have been waited for more than 2 years. It may be important to carry out
further research to identify the reasons.
20
3
13
5 27
4
68
4
96
98
16
8
26
6
29
9
23
3 4
42
95
0
0
200
400
600
800
1000
Less than 6 months 6-12 Months 1-2 Years More than 2 Years
NVQ Non NVQ Total

84
Table 3.53 - Duration of Unemployment Duration by Gender.
Gender
Duration of Unemployment Not
responded Total Less than 6 months 6-12 Months 1-2 Years More than 2 Years
Frequency % Frequency % Frequency % Frequency %
Male 212 18.6 152 13.4 250 22 524 46.0 137 1275
Female 120 12.5 105 11 224 23.4 509 53.1 144 1102
Not
specified 3 9.1 4 12.1 9 27.3 17 51.5 50 83
Total 335 15.7 261 12.3 483 22.7 1050 49.3 331 2460
Source- tracer survey details 2013.
Figure 3.53- Duration of Unemployment Duration by Gender
Source- tracer survey details 2013.
The above 3.53 table shows the duration of unemployment of certificate holders by gender. 524
out of 1275 male respondents have been waited for more than 2 years which is 46%. And also,
509 out of 1102 female respondents have been waited for more than 2 years which is 53.1%.
(Percentage was calculated from responded certificate holders)
21
2
15
2
25
0
52
4
12
0
10
5
22
4
50
9
0
100
200
300
400
500
600
Less than 6 months 6-12 Months 1-2 Years More than 2 Years
Male Female
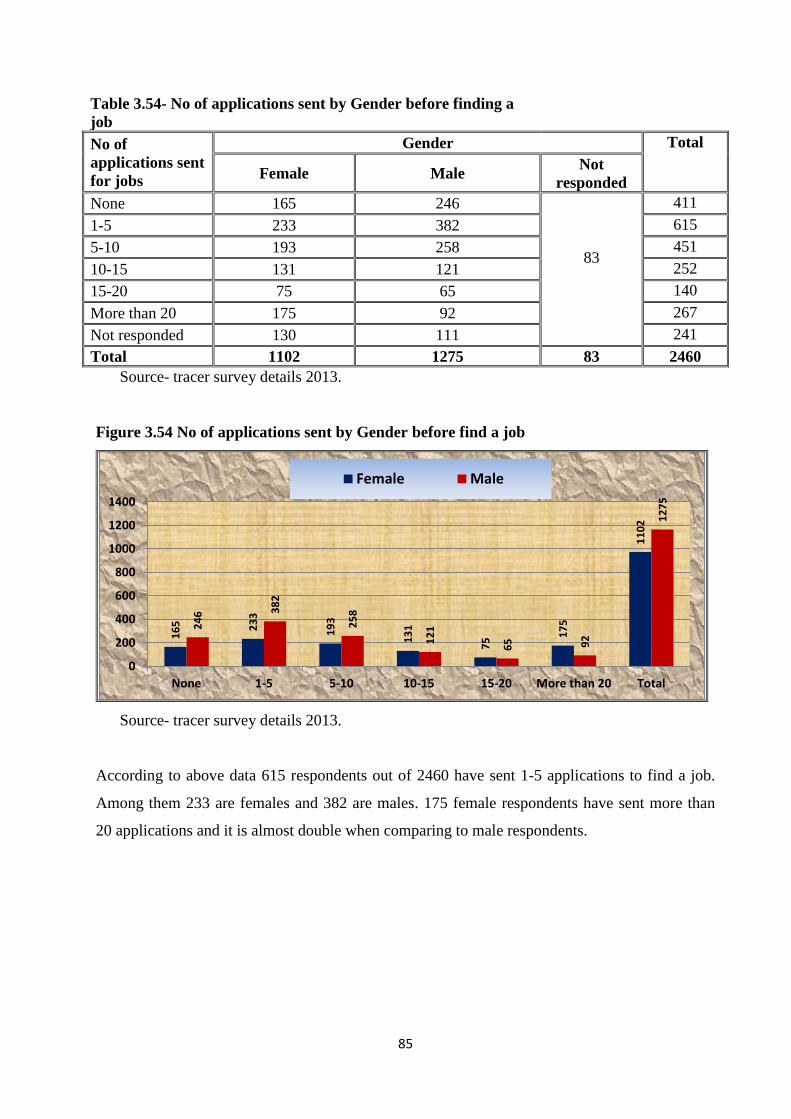
85
Table 3.54- No of applications sent by Gender before finding a
job
No of
applications sent
for jobs
Gender Total
Female Male Not
responded
None 165 246
83
411
1-5 233 382 615
5-10 193 258 451
10-15 131 121 252
15-20 75 65 140
More than 20 175 92 267
Not responded 130 111 241
Total 1102 1275 83 2460
Source- tracer survey details 2013.
Figure 3.54 No of applications sent by Gender before find a job
Source- tracer survey details 2013.
According to above data 615 respondents out of 2460 have sent 1-5 applications to find a job.
Among them 233 are females and 382 are males. 175 female respondents have sent more than
20 applications and it is almost double when comparing to male respondents.
16
5
23
3
19
3
13
1
75
17
5
11
02
24
6 38
2
25
8
12
1
65
92
12
75
0
200
400
600
800
1000
1200
1400
None 1-5 5-10 10-15 15-20 More than 20 Total
Female Male
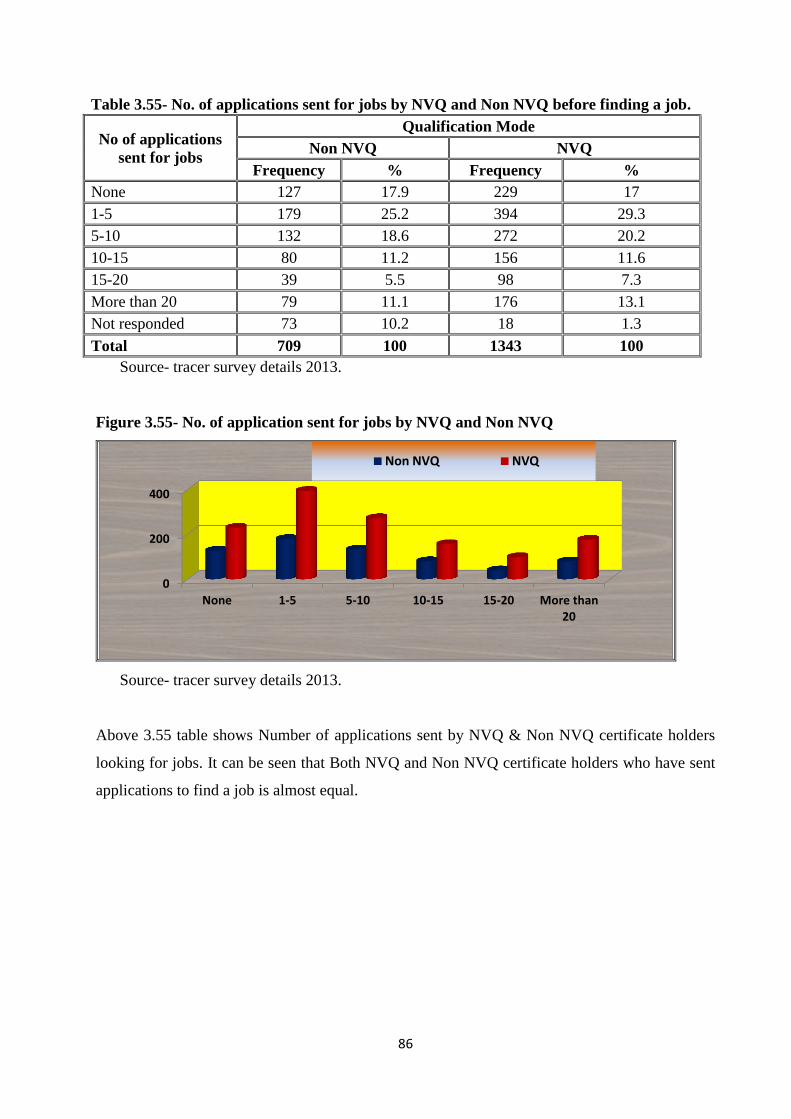
86
Table 3.55- No. of applications sent for jobs by NVQ and Non NVQ before finding a job.
No of applications
sent for jobs
Qualification Mode
Non NVQ NVQ
Frequency % Frequency %
None 127 17.9 229 17
1-5 179 25.2 394 29.3
5-10 132 18.6 272 20.2
10-15 80 11.2 156 11.6
15-20 39 5.5 98 7.3
More than 20 79 11.1 176 13.1
Not responded 73 10.2 18 1.3
Total 709 100 1343 100
Source- tracer survey details 2013.
Figure 3.55- No. of application sent for jobs by NVQ and Non NVQ
Source- tracer survey details 2013.
Above 3.55 table shows Number of applications sent by NVQ & Non NVQ certificate holders
looking for jobs. It can be seen that Both NVQ and Non NVQ certificate holders who have sent
applications to find a job is almost equal.
0
200
400
None 1-5 5-10 10-15 15-20 More than20
Non NVQ NVQ

87
Table 3.56- Importance of Reason for Unemployment
Reason for
Unemployment
education
mismatch for
the job
Not
enough VT
training
No
information
about
vacancies
Not given
good
salary
engaged
Higher
Education
Very Important 748 166 371 199 273
Important 333 204 360 307 167
Average 225 294 247 308 155
Below average 115 322 227 265 188
Not important 52 218 121 228 402
Not at all 11 20 7 14 32
Not responded 976 1246 1127 1139 1243
Total 2460 2460 2460 2460 2460
Source- tracer survey details 2013.
Figure 3.56- Importance of Reason for Unemployment
Source- tracer survey details 2013.
Above 3.56 table and 3.56 figure explains about the reasons for unemployment among
Vocational Training certificate holders. According to data education mismatch for the job is the
main reason for their unemployment. It can be listed that other reasons for unemployment as
lack of information on vacancies, poor salary, engaged in higher education and not enough
Vocational training.
0
100
200
300
400
500
600
700
800
education mismatchfor the job
Not enough VTtraining
No informationabout vacancies
Not given goodsalary
engaged HigherEducation
Very Important Important Agerage Below average Not important

88
Chapter- 04
Conclusion
Final summary
&
Suggestions

89
04.1. Conclusion and final summary
The private vocational training institutes are offering more non NVQ courses than NVQ
courses which is 70.4%.
The majority of Both NVQ and Non NVQ respondents are male of which the percentage
is 63%.
The majority of TVET certificate holders represent the government VT centers which are
72 %.
Participation from Northern and Eastern provinces for vocational education programmes
are significantly less compared to western, Southern, sabaragamuwa and central
provinces. This might be a major factor for prevailing unemployment issues in those
areas which is given in the central bank statistics.
Highest respondents are from western province which is 1056. Other high responded
provinces are Southern, Sabaragamuwa and Central. Those are 848, 449 and 371
respectively. Lowest both NVQ and Non NVQ certificate holders response is from
Northern Province. The total amount is 142. Other low responded provinces are North
central, Uva, and Eastern. Those are 208, 293 and 324 respectively.
Highest numbers of responded certificate holders are from computer application assistant
course. Electrician, wood craftsman (furniture), Welder, Automobile Mechanic,
Computer hardware technician, Beautician, Computer graphic designer, Motor cycle
mechanic also have been reported highest respondent rates among the certificate holders.
The majority respondents’ age group is 15-29 years which is 81.5%. And More than 91%
of certificate holders are less than 40 years.
The majority of responses are unmarried which is 80.1%.
1485 respondents have passed advance level and 3300 certificate holders have passed
Ordinary level. 168 vocational certificate holders have completed a degree or above.
77 % of certificate holders are residing within 20 Km from their residence.

90
2226 certificate holders are already employed which is 47.5 %. And 2460 Certificate
holders are currently unemployed which is 52.5 %.
1361 of NVQ certificate holders, are employed which is 50%. 667 Non NVQ certificate
holders are employed which is 48% and 709 are Unemployed which is 52%. However,
there is no significant different in employability of NVQ and non-NVQ holders.
59.4% of respondents with GCE A/L are unemployed and the percentage for
unemployment with degree and above is 64.3%. Conversely, most respondents with
lower educational qualifications seem to be employed. The employed rate for 1-5 Year
education is 69.4% and up to GCE O/L is 55.5 %. Unemployment of 15-29 age group is
55.1%. Majority of elders are employed. The employment rate of the age group of 30-40
is 64.8 % and that of above 40 is 68.9 %.
Male employability is higher than that of the female. Of Total male respondents, 1612
are employed which is 55.8% and 1275 are unemployed which is 44.2%. Of Female
respondents, 589 are employed which is 34.8% and 1102 are Unemployed which is
65.2%.
Respondents working in the private sector seem higher which percentage is around 44%.
Government, NGO and self employment sector contributions are 29%, 13% and 14%
respectively and those employed on permanent basis is 41.1%. Percentage on casual
basis is 38.1% and on contract is 20.8%.
769 certificate holders are drawing less than Rs.10, 000 salaries per month which is 32%.
And 1318 are drawing between Rs.10,000 and Rs. 30,000 salary which is 56%. Only 287
which is 12 % are drawing more than Rs.30 000 income per month. Among them 101 are
earning more than Rs.50 000 per month.
With regard to employability, the majority (which is 1248) have undergone 3-6 months
duration. Among them 57% are unemployed and 43% employed. For 3 months courses
employment rate is 50.8%. For the courses of 1-2 Years duration, the employability rate
is 53.2% and more than 2 years courses have reported 52.5% employability rate.

91
The employability of NVQ certificate holders by provinces, Southern, Sabaragamuwa,
North western, Eastern and Uva provinces have shown high employability. And
Western, North Central, Northern and Central Provinces have shown high
unemployment. I.e. Western province unemployment rate is 56.3 % and Northern
provinces unemployment is 68.1%.
The majority of VT certificate holders which percentage is 78% have stated that the
training provided by TVET institutes is directly relevant to their job
Most of the certificate holders seem to have waited long time without a job after their
training. I.e. 49.2% of respondents had been waited for more than 2 years without a job.
And only 22.7% of Certificate holders were waited between 1-2 years.
615 respondents out of 2460 have sent 1-5 applications to find a job. Among them 233
are female and 382 are male. 175 female respondents have sent more than 20
applications.
04.3. Suggestions
As reasons for joining TVET, Influence of Parents (27%), friends (26%), and advertising
(19%) and Vocational awareness programs (15%) are most effective ways to attract
youth for TVET. Workshops (5%), radio and TV (2%), and other modes of advertizing
including TVEC website (6%) seem to be of very low effectiveness with the aggregate of
13%. Therefore, it is suggested to use the most influential and effective methods as a
strategy for the social marketing of the TVET sector.
The private vocational training institutes are offering more Non NVQ courses (70.4%)
and awarding non NVQ certificates. Tertiary and vocational education commission
should have to promote the National Vocational Qualification among private vocational
training centers.
The finding of this study says that over 52% of respondents are still unemployed. This
significant factor needs to be further studied and also will question the quality and
relevance of training programs.

92
Many students at certificate levels have not travelled long distances for their VT training.
Both government and private VT centers should have been established considering this.
In this study it was found that degree holders have faced unemployment and under
employment problem. It is therefore, proposed to conduct a research to find the reasons
for unemployment and the under employment of degree holders.
Western province has shown high unemployment rate (56.3 %) among the NVQ holders.
As there are more vacancies and opportunities in western province, it is proposed to
conduct further research to find the reasons of unemployment in western province.