Embed Size (px)
Citation preview
A Simultaneous 2D/3D Autostereo Workstation
Dennis Chaua , Bradley McGinnisa , Jonas Talandisa , Jason Leigha , Tom Peterkab , Aaron Knollb ,Aslihan Sumerb , Michael Papkab , and Julius Jellinekb
aElectronic Visualization Laboratory, University of Illinois at ChicagobArgonne National Laboratory
ABSTRACTWe present a novel immersive workstation environment that scientists can use for 3D data exploration and as their everyday2D computer monitor. Our implementation is based on an autostereoscopic dynamic parallax barrier 2D/3D display, inter-active input devices, and a software infrastructure that allows client/server software modules to couple the workstation toscientists’ visualization applications. This paper describes the hardware construction and calibration, software components,and a demonstration of our system in nanoscale materials science exploration.
Keywords: Information interfaces and presentation; Multimedia information systems; Artificial, augmented, and virtualrealities.
1. INTRODUCTIONScientific data, fueled by growth in computing power and physical sensor resolution, offer the possibility to explore phe-nomena from the scale of the universe to subatomic particles. While our ability to simulate and collect scientific datais unprecedented, it brings with it new challenges for interactive exploration. Along with increased data size, datasetsare increasing in complexity, with many quantities represented over complex field geometries. These geometries arefrequently 3D spatial or 4D spatio-temporal, and 2D visualizations alone cannot capture the information contained inhigh-dimensional data.
This paper presents our development of an immersive desktop autostereoscopic workstation, driven by the needs ofnanoscale materials science for the exploration of structures used in energy research. One example of energy researchbeing conducted at Argonne National Laboratory is the design of amorphous carbon structures for new anode materialsin next-generation batteries. These structures, consisting of diamond cores surrounded by sheaths of graphite, provideincreased area for trapping lithium ions in electrolytes. Figure 1 shows that complex models consisting of 700,000 atomsare difficult to view and understand using traditional display techniques that flatten deep structures onto a single view plane.Motivated by this example and others encountered in the United States Department of Energy’s Energy Frontier ResearchCenters, we propose a new work environment for scientists.
Send correspondence to [email protected]
Figure 1. Ball-and-stick rendering without and with volume visualization. Stereo display is indispensable for visualizing such large andcomplex structures.
One of our objectives was to deploy a transparent environment that directs the user’s focus on the science probleminstead of the technology. Toward this end, we employed innovative autostereoscopic hardware and software that affordsnovel user interactions. Another goal was to support existing workflows so that scientists need not give up tools uponwhich they rely to be productive. We coupled our workstation to remote visualization applications to satisfy this goal,instead of developing a new system for producing virtual imagery. Lastly, we wanted an accessible environment is alwaysavailable and requires little or no added effort on the part of the user. Today’s science work day is fluid and consists ofmany interleaved tasks, so having to plan and reserve “3D time” to use high-end resources such as CAVEs can cause suchfacilities to be underutilized. Instead, we bring the immersive environment to the scientist’s desktop, where it is always on,requires minimal gear to use, and supports 3D data exploration at the same time as 2D tasks such as email and documentwriting.
This paper summarizes our implementation of the next generation of the Dynallax dynamic parallax barrier autostere-oscopy system in a desktop form factor and a demonstration of its use in materials science. It is driven by a software systemcalled DVC, or dynamic view client, that couples existing visualization applications to the hardware. DVC consists of twoparts: a server-side library that enables streaming of stereo image pairs to the client side and interacts with applications toprocess client input; and a client-side library that displays stereo images, supports interaction devices, and combines 2Dand 3D work spaces.
2. BACKGROUNDA review of earlier stereo and autostereo virtual environments shows that usability for science can be an elusive goal.Anaglyph stereo discards much of the color spectrum and hence is not useful for scientific visualization. Field-sequentialand passive polarized stereo require glasses, which inhibit multitasking between 2D and 3D tools. Lenticular automulti-scopic displays compress depth and are not first-person head-tracked. Varrier1 static parallax barrier displays cannot switchbetween 2D and 3D mode because of the presence of a fixed parallax barrier.
In their paper Lee et al.2 discuss the development of the field of autostereo and how it must accommodate 2D content.With the majority of content currently available being 2D, it is easy to see why this is so. The authors explain how currentparallax barrier devices use a time-multiplexed barrier to achieve a ”2D only” mode. However, our device goes beyondhaving a separate 2D and 3D modality and offers a mixed 2D/3D paradigm, allowing users to view both types of contentsimultaneously. Steinicke et al.3 research this concept of mixed 2D/3D content on autostereo displays and refer to itas interscopic. In their research they outline a method for mixing the 2D user interface for CAD software with a stereorendering of the model being designed. In their research, an informal survey showed that interscopic user interface designmay benefit certain technical applications.
There are a number of other parallax barrier devices being developed commercially as well as in academia. One suchdevice was Varrier,4 that used a static barrier printed on glass. There is also the device produced by Lanman et al.5 whichhas two LCDs layered, with one acting as a dynamic barrier. This is a very similar design to our own except the Dynallaxalters the barrier based on head position, where as Lanman’s device alters the barrier based on the content of the scenebeing rendered. This solves some of the issues that are present in our system but it also introduces some new issues such asflickering. Finally, Stolle et al.6 introduce an autostereo device being developed in industry. Although it does not utilize aparallax barrier, it has many common goals with the Dynallax workstation including autostereo, simultaneous 2D/3D, andcompatibility with existing OpenGL applications. Its main target audience is ”hardcore” game players.
There have been many advances in immersive stereoscopic systems and technology over the last two decades. Oneapplication area that has the potential to take advantage of these advances is domain science. For example, in their projectGROPE, Brooks et al.7 provided visualizations of molecules and their force fields to chemists trying to discern dockingpatterns of drugs. The authors report that because of the immersive interactions with the GROPE system, chemists had anew understanding of drug docking and receptor site interactions, increasing their situational awareness.
Another project, called Crumbs, was developed by Brady et al.8 at the University of Illinois Urbana-Champaign foruse in a CAVE9 system. Crumbs visualized volumetric data and provided easy and intuitive ways for users to navigate andinspect the datasets. When used by biologists from various domains, they reported that Crumbs improved workflow andcontributed to increased understanding of the data, acknowledging its educational possibilities.
As a final science application, Bohrer et al.10 showed that a group of interdisciplinary scientists could collaboratein an immersive stereo environment, in this case the Duke Immersive Virtual Environment. Using a visualization, these
scientists were able to explore a large complex dataset whose variables interacted in a nonlinear way. Their access tothis immersive stereo environment proved to be fundamental to synthesising a hypothesis about the dataset. Unlike theselarge-scale specialty displays, we attempt to bring the advantages of these immersive stereoscopic displays to the scientistwhere they work, and to accommodate daily activities in addition to providing novel data exploration.
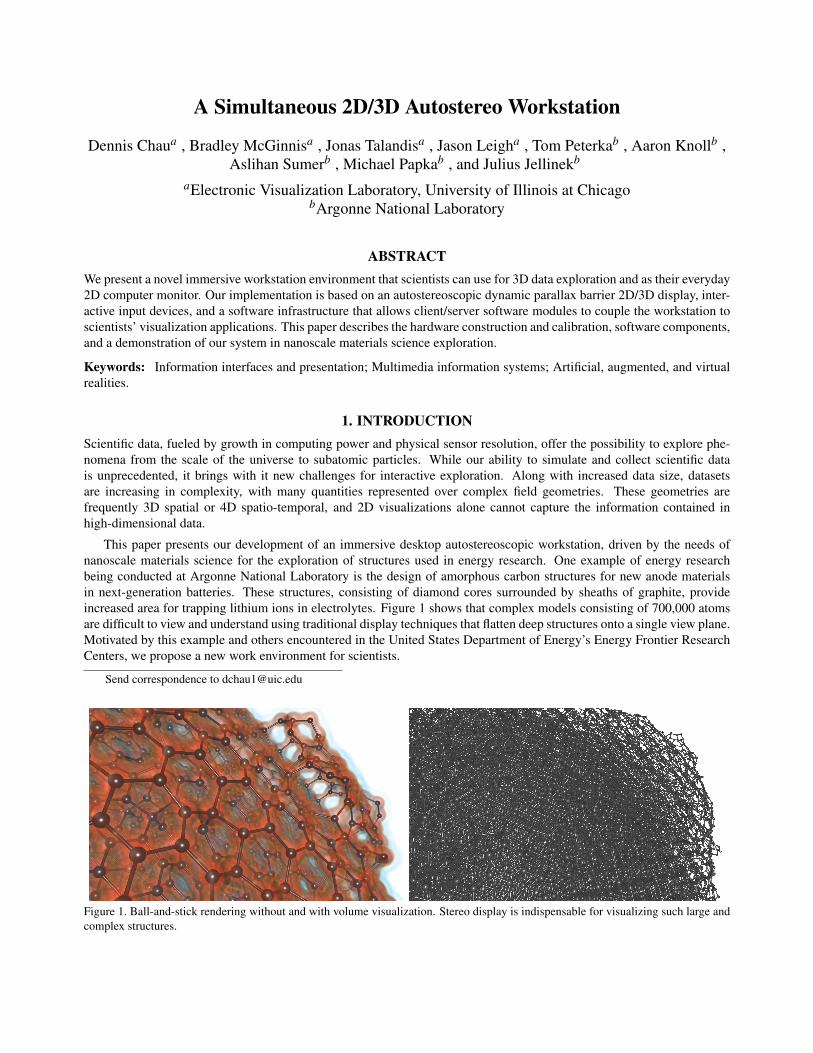
Figure 2. The Dynallax display system
The work presented here is a continuation of the Dynal-lax system11, 12 development and the software that drives it,Dynamic View Client (DVC).13 DVC leverages OpenGLshaders and MPI14 to maintain a dynamic parallax barrierand a corresponding interlaced stereo image. Previously,developing Dynallax applications often required alteringthe DVC library itself to manage custom input events andnew input devices. DVC also did not include a mechanismfor modifying coupled visualization applications, nor didit afford 2D/3D simultaneous workflows. The new workpresented in this paper streamlines the application devel-opment process on both the client and server sides by ab-stracting more of these details.
3. METHODDynallax incorporates a hardware and software infrastruc-
ture in order to create a hybrid 2D/3D scientific workstation. The hardware infrastructure is described by the specificationsand parameters for our dynamic parallax barrier display. The software infrastructure provides a transparent environmentfor both developers and scientists, achieved by abstracting stereoscopic rendering, input from novel user interfaces, and2D/3D windowing.
3.1 HardwareOur display assembly can be seen in Figure 2 and uses the Dynallax method to create 3D images by means of a dynamicparallax barrier.11 This method leverages the stacking of two LCD panels, one in front of the other. The interleaved sceneimage is drawn on the rear screen, with the dynamic parallax barrier generated on the front screen. Altering this dynamicparallax barrier programmatically provides the 2D/3D windowing capabilities not found in static parallax barrier devicessuch as Varrier.4
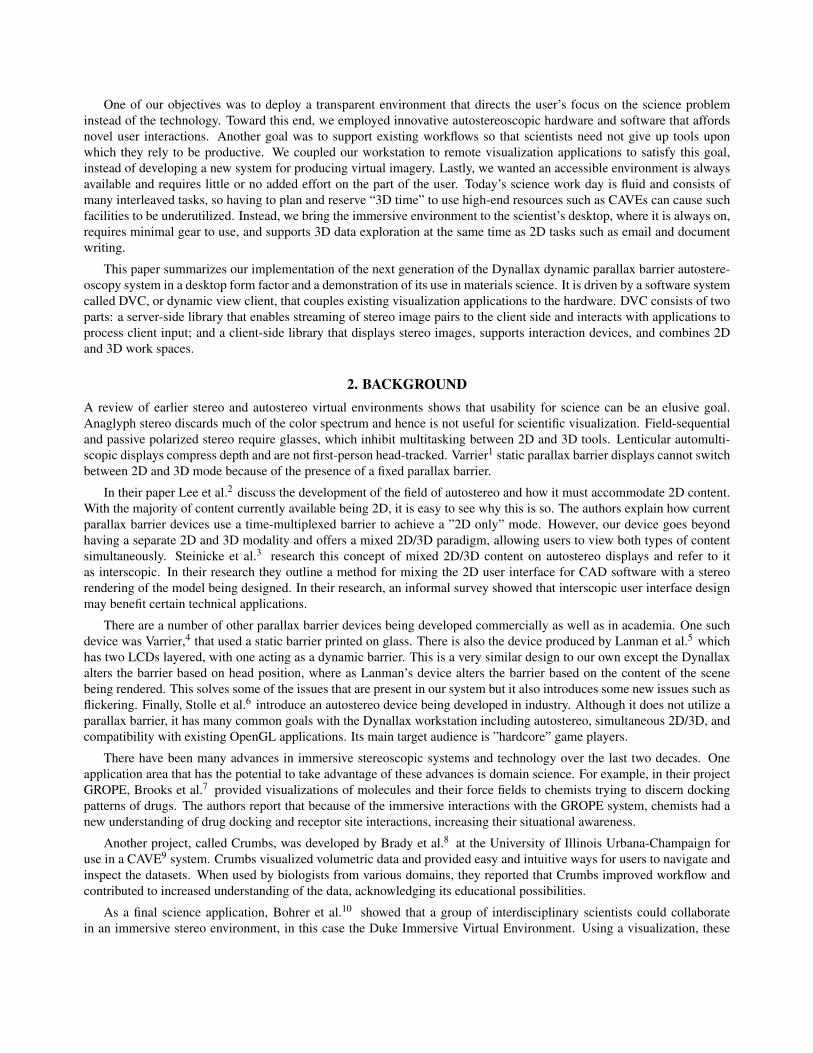
Figure 3. User multitouch interaction
The rear ’data’ screen, is a stock Apple Cinema 30 inch LCD display.This display was chosen for its high (2560 x1600 pixel) resolution, bright-ness (400 cd/m2) and professional image quality. The front ’barrier’ screenis the LCD panel extracted from a Dell 3007WFP-HC display of the samesize and resolution. The Dell’s power and display components are retained inorder to operate and drive the LCD panel. Its enclosure, backlight and inter-face electronics are not required and removed. The LCD panels are stackedface-to-face to align their interior polarization layers and allow light to passthrough both panels and eliminate the need to remove any polarization layersfrom the bonded panel assemblies. The two LCD panels are visually alignedby pixel row using simple line patterns drawn on each LCD prior to mechan-ical fixing.
The combined display assembly is mounted to an extruded aluminumframing enclosure providing for +/- 20 degree view angle adjustment. To assist in scientific discovery, lightweight userinteraction devices are included. Touch capability is provided by a PQ Labs Multi-Touch 32” G3Plus touch screen, aninfrared-based overlay framing the display surface and providing up to 32 simultaneous touches and/or gestures for ap-plication control and interaction with images. Additionally, head tracking is provided by a TrackIR v.5 tracking system,requiring users only to wear a lightweight visor and providing nonintrusive head tracking capability. A Wiimote 3D con-troller is also provided. User interaction is shown in Figure 3.

Dynallax is powered by an Ubuntu Linux workstation with dual Intel Xeon 2.4GHz processors, two NVIDIA GTX 460(1 GB) GPUs, and 12 GB RAM.
3.1.1 System Configuration
The front and rear screens are each connected to a different graphics card, but the screens are combined side-by-side intoa single canvas using Xinerama mode, so that the front screen is to the right of the rear screen in the configuration.
USB drivers for the TrackIR camera and the PQLabs touch screen are not available for Linux, so we installed a virtualmachine (VM) running a Windows-7 64-bit enterprise edition guest operating system (OS) on top of the Linux host OS.We selected the free VMware player over other VM software because of its support for USB devices. We set the networkto bridged mode, so that the guest and host each have their own IP address, and we allotted 2GB of memory to the guest.The remaining VM settings remained at their default values.
The Windows guest OS runs two utility programs that we wrote. A tracker server utility grabs raw head trackercoordinates and sends them over the loopback network interface to the Linux host on a specified port, and a touch serverutility does the same for touch screen data. The virtual machine and utility programs only need to be started once andexecute continuously in a minimized state. We have not experienced any noticeable lag due to using a virtual machine todrive the head tracker and touch screen.
3.1.2 Optical Parameters
The Nyquist Sampling Theorem states that each ray of light entering an eye be generated from at least two pixels, makingthe minimum barrier period 4 pixels wide.4 A larger period means that more pixel samples contribute to each channel,contain larger guard regions, and further improve image quality. A larger barrier period, however, results in barrier linesthat are more visible, so there is a trade off between crosstalk and barrier visibility. In our experiments, we empiricallyfound that an ideal compromise for Dynallax is a barrier period of 6 pixels (0.060 in., or 1.5 mm). Table 1, a complete listof optical parameters, shows that we are slightly below that target in our construction, approximately 5.25 pixels.
Table 1. Major Optical ParametersParameter ValueScreen Size 25.6 in x 16.0 in (650 mm x
406 mm)Screen Base Resolution 2560 x 1600Effective Resolution 640 x 1600 per eyeLCD Pixel Pitch 0.010 in (0.25 mm)Barrier Period 0.052 in (1.32 mm)Barrier Duty Cycle 0.75 black, 0.25 whiteScreen Separation 0.212 in (5.38 mm) air + 0.078
in (1.98 mm) glassOptical Thickness 0.264 in (6.71 mm)Optimal View Distance 24 in (609 mm)Interocular Distance 2.5 in (63.50 mm)
From the target barrier period, the physical separationbetween screens is computed as follows. From Peterka etal.,12 optical thickness t is a function of the optimal view-ing distance zopt , interocular distance e, and barrier periodp, and t ≈ zopt p/2e. For a desktop display, we use zopt = 24in. (609 mm), resulting in an optical thickness of t = 0.288in. (7.3 mm) To find the physical separation between thetwo LCD panels, we subtract the thickness of one LCDglass, divided by its refractive index, resulting in a 0.236in. (5.99 mm) air space between the LCDs. We then se-lected spacer materials that were readily available in stockthicknesses, which resulted in the parameters in Table 1.
3.2 Software : Dynamic View Client (DVC)The overall system architecture is shown in Figure 4. Dy-nallax’s Dynamic View Client (DVC) software consists oftwo parts: DVCLib and DVCSdk. DVCLib is linked to a rendering application running on our workstation, and DVCSdkis linked to a visualization application that could be running on the same or a remote machine. DVCLib and DVCSdk worktogether to couple local rendering with remote visualizations as follows. DVCSdk sends stereo image pairs from the remotevisualization to DVCLIb, which renders autostereoscopic imagery, manages simultaneous 2D/3D windows, catches userinput events, and sends them to DVCSdk. DVCSdk receives user inputs and makes them available to the visualization ap-plication so that it can update its state accordingly. The three main abstractions used to achieve this coupling: stereoscopicrendering, input device handling, and 2D/3D window management, are described in further detail below.
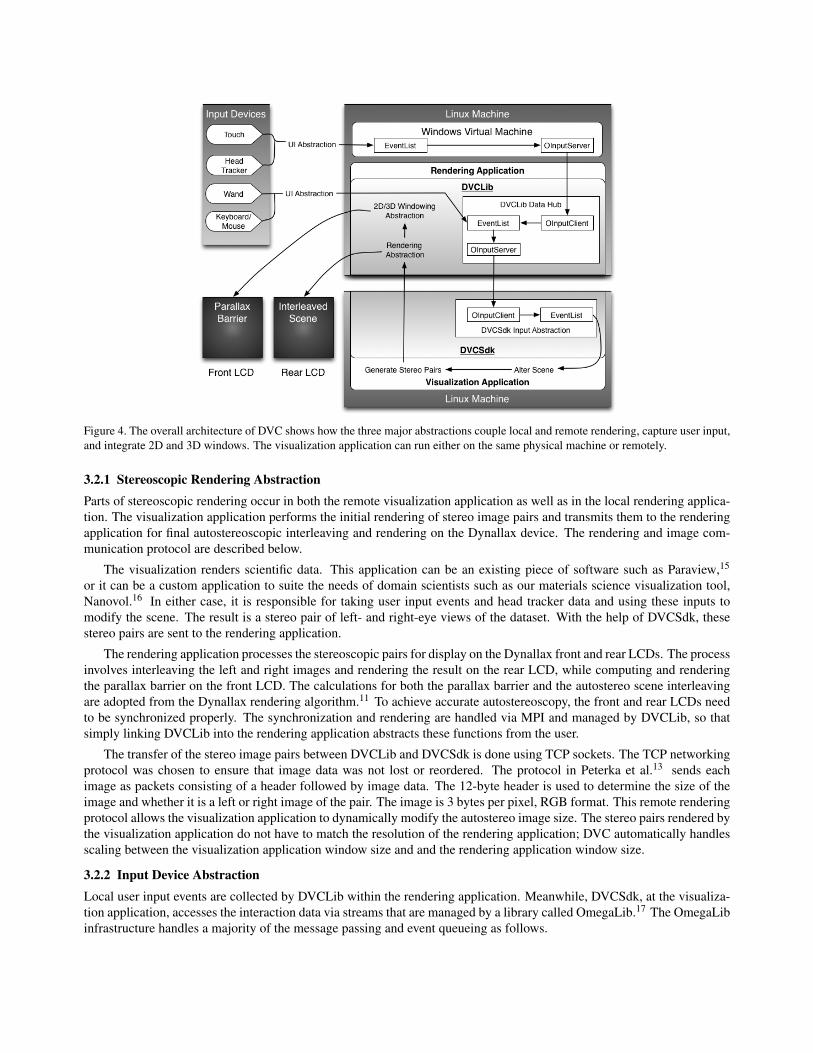
Figure 4. The overall architecture of DVC shows how the three major abstractions couple local and remote rendering, capture user input,and integrate 2D and 3D windows. The visualization application can run either on the same physical machine or remotely.
3.2.1 Stereoscopic Rendering AbstractionParts of stereoscopic rendering occur in both the remote visualization application as well as in the local rendering applica-tion. The visualization application performs the initial rendering of stereo image pairs and transmits them to the renderingapplication for final autostereoscopic interleaving and rendering on the Dynallax device. The rendering and image com-munication protocol are described below.
The visualization renders scientific data. This application can be an existing piece of software such as Paraview,15
or it can be a custom application to suite the needs of domain scientists such as our materials science visualization tool,Nanovol.16 In either case, it is responsible for taking user input events and head tracker data and using these inputs tomodify the scene. The result is a stereo pair of left- and right-eye views of the dataset. With the help of DVCSdk, thesestereo pairs are sent to the rendering application.
The rendering application processes the stereoscopic pairs for display on the Dynallax front and rear LCDs. The processinvolves interleaving the left and right images and rendering the result on the rear LCD, while computing and renderingthe parallax barrier on the front LCD. The calculations for both the parallax barrier and the autostereo scene interleavingare adopted from the Dynallax rendering algorithm.11 To achieve accurate autostereoscopy, the front and rear LCDs needto be synchronized properly. The synchronization and rendering are handled via MPI and managed by DVCLib, so thatsimply linking DVCLib into the rendering application abstracts these functions from the user.
The transfer of the stereo image pairs between DVCLib and DVCSdk is done using TCP sockets. The TCP networkingprotocol was chosen to ensure that image data was not lost or reordered. The protocol in Peterka et al.13 sends eachimage as packets consisting of a header followed by image data. The 12-byte header is used to determine the size of theimage and whether it is a left or right image of the pair. The image is 3 bytes per pixel, RGB format. This remote renderingprotocol allows the visualization application to dynamically modify the autostereo image size. The stereo pairs rendered bythe visualization application do not have to match the resolution of the rendering application; DVC automatically handlesscaling between the visualization application window size and and the rendering application window size.
3.2.2 Input Device AbstractionLocal user input events are collected by DVCLib within the rendering application. Meanwhile, DVCSdk, at the visualiza-tion application, accesses the interaction data via streams that are managed by a library called OmegaLib.17 The OmegaLibinfrastructure handles a majority of the message passing and event queueing as follows.
Omegalib is a middleware designed to ease the development of applications on virtual reality and immersive systemsby encapsulating a wide range of input peripherals: controllers, motion capture systems, touch surfaces, and so forth. Itsabstraction helps users connect to various devices and grab input data. The input data are processed and repackaged as ageneric event packet that consists of an event type and related data. Two examples of event types include rotations andscreen touches, with corresponding data consisting of degree of rotation and touch position. OmegaLib also supports thegeneration of custom event packets. Once generated, the event packets are stored in an EventList.
Additionally, OmegaLib has server/client capabilities, as it was developed to be an effective method of transferringabstracted user input from a local system to a remote system. The OmegaLib server, OInputService, abstracts input intoevent packets and stores them in an EventList. The event packets can be streamed to any connected external application.The external application can also include the OmegaLib client, OInputClient. This allows the application to receive theabstracted events and place them in a separate event list for easy access.
DVCLib wraps both an OInputClient and an OInputService in a DVCDataHub. The DVCDataHub acts as a clientby receiving event data from the Windows virtual machine. The virtual machine executes OInputService to gather inputdata from devices such as the touch screen and the head tracker, and additional abstraction functions were also writtento generate custom event packets for the 3D remote controller, mouse, and keyboard. Once collected and processed, theevents are streamed to the DVCDataHub and collected in the EventList. In the visualization application, DVCSdk usesa thread to continuously poll and stream events from DVCLib’s data hub. This provides user interaction data from noveldevices to the visualization application so that it can alter the scene and render new stereo pairs.
3.2.3 2D/3D Window Abstraction
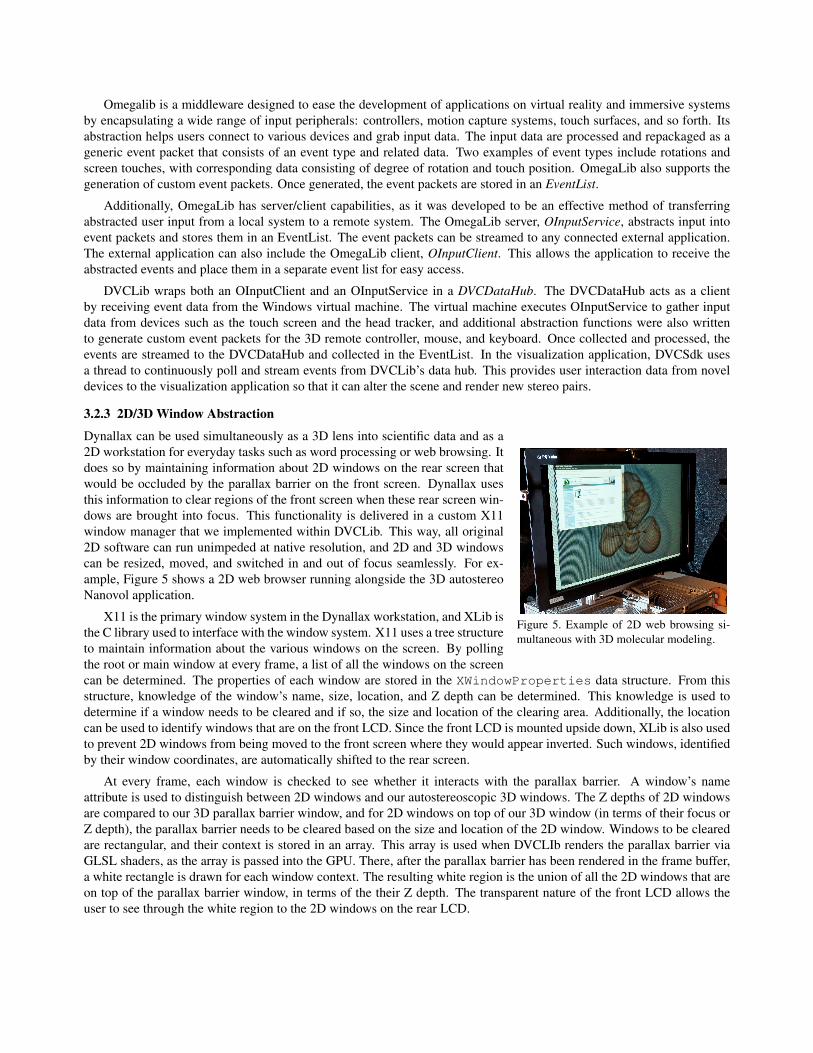
Figure 5. Example of 2D web browsing si-multaneous with 3D molecular modeling.
Dynallax can be used simultaneously as a 3D lens into scientific data and as a2D workstation for everyday tasks such as word processing or web browsing. Itdoes so by maintaining information about 2D windows on the rear screen thatwould be occluded by the parallax barrier on the front screen. Dynallax usesthis information to clear regions of the front screen when these rear screen win-dows are brought into focus. This functionality is delivered in a custom X11window manager that we implemented within DVCLib. This way, all original2D software can run unimpeded at native resolution, and 2D and 3D windowscan be resized, moved, and switched in and out of focus seamlessly. For ex-ample, Figure 5 shows a 2D web browser running alongside the 3D autostereoNanovol application.
X11 is the primary window system in the Dynallax workstation, and XLib isthe C library used to interface with the window system. X11 uses a tree structureto maintain information about the various windows on the screen. By pollingthe root or main window at every frame, a list of all the windows on the screencan be determined. The properties of each window are stored in the XWindowProperties data structure. From thisstructure, knowledge of the window’s name, size, location, and Z depth can be determined. This knowledge is used todetermine if a window needs to be cleared and if so, the size and location of the clearing area. Additionally, the locationcan be used to identify windows that are on the front LCD. Since the front LCD is mounted upside down, XLib is also usedto prevent 2D windows from being moved to the front screen where they would appear inverted. Such windows, identifiedby their window coordinates, are automatically shifted to the rear screen.
At every frame, each window is checked to see whether it interacts with the parallax barrier. A window’s nameattribute is used to distinguish between 2D windows and our autostereoscopic 3D windows. The Z depths of 2D windowsare compared to our 3D parallax barrier window, and for 2D windows on top of our 3D window (in terms of their focus orZ depth), the parallax barrier needs to be cleared based on the size and location of the 2D window. Windows to be clearedare rectangular, and their context is stored in an array. This array is used when DVCLIb renders the parallax barrier viaGLSL shaders, as the array is passed into the GPU. There, after the parallax barrier has been rendered in the frame buffer,a white rectangle is drawn for each window context. The resulting white region is the union of all the 2D windows that areon top of the parallax barrier window, in terms of the their Z depth. The transparent nature of the front LCD allows theuser to see through the white region to the 2D windows on the rear LCD.
4. RESULTS AND CASE STUDIES
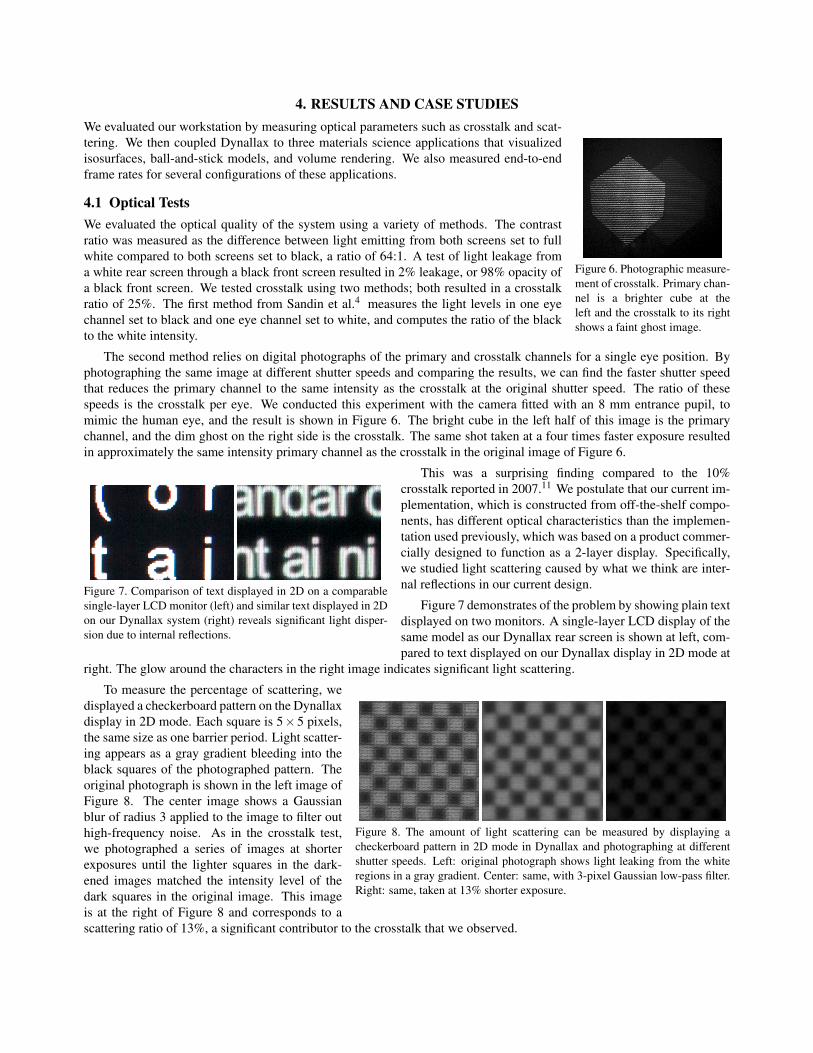
Figure 6. Photographic measure-ment of crosstalk. Primary chan-nel is a brighter cube at theleft and the crosstalk to its rightshows a faint ghost image.
We evaluated our workstation by measuring optical parameters such as crosstalk and scat-tering. We then coupled Dynallax to three materials science applications that visualizedisosurfaces, ball-and-stick models, and volume rendering. We also measured end-to-endframe rates for several configurations of these applications.
4.1 Optical TestsWe evaluated the optical quality of the system using a variety of methods. The contrastratio was measured as the difference between light emitting from both screens set to fullwhite compared to both screens set to black, a ratio of 64:1. A test of light leakage froma white rear screen through a black front screen resulted in 2% leakage, or 98% opacity ofa black front screen. We tested crosstalk using two methods; both resulted in a crosstalkratio of 25%. The first method from Sandin et al.4 measures the light levels in one eyechannel set to black and one eye channel set to white, and computes the ratio of the blackto the white intensity.
The second method relies on digital photographs of the primary and crosstalk channels for a single eye position. Byphotographing the same image at different shutter speeds and comparing the results, we can find the faster shutter speedthat reduces the primary channel to the same intensity as the crosstalk at the original shutter speed. The ratio of thesespeeds is the crosstalk per eye. We conducted this experiment with the camera fitted with an 8 mm entrance pupil, tomimic the human eye, and the result is shown in Figure 6. The bright cube in the left half of this image is the primarychannel, and the dim ghost on the right side is the crosstalk. The same shot taken at a four times faster exposure resultedin approximately the same intensity primary channel as the crosstalk in the original image of Figure 6.
Figure 7. Comparison of text displayed in 2D on a comparablesingle-layer LCD monitor (left) and similar text displayed in 2Don our Dynallax system (right) reveals significant light disper-sion due to internal reflections.
This was a surprising finding compared to the 10%crosstalk reported in 2007.11 We postulate that our current im-plementation, which is constructed from off-the-shelf compo-nents, has different optical characteristics than the implemen-tation used previously, which was based on a product commer-cially designed to function as a 2-layer display. Specifically,we studied light scattering caused by what we think are inter-nal reflections in our current design.
Figure 7 demonstrates of the problem by showing plain textdisplayed on two monitors. A single-layer LCD display of thesame model as our Dynallax rear screen is shown at left, com-pared to text displayed on our Dynallax display in 2D mode at
right. The glow around the characters in the right image indicates significant light scattering.
Figure 8. The amount of light scattering can be measured by displaying acheckerboard pattern in 2D mode in Dynallax and photographing at differentshutter speeds. Left: original photograph shows light leaking from the whiteregions in a gray gradient. Center: same, with 3-pixel Gaussian low-pass filter.Right: same, taken at 13% shorter exposure.
To measure the percentage of scattering, wedisplayed a checkerboard pattern on the Dynallaxdisplay in 2D mode. Each square is 5×5 pixels,the same size as one barrier period. Light scatter-ing appears as a gray gradient bleeding into theblack squares of the photographed pattern. Theoriginal photograph is shown in the left image ofFigure 8. The center image shows a Gaussianblur of radius 3 applied to the image to filter outhigh-frequency noise. As in the crosstalk test,we photographed a series of images at shorterexposures until the lighter squares in the dark-ened images matched the intensity level of thedark squares in the original image. This imageis at the right of Figure 8 and corresponds to ascattering ratio of 13%, a significant contributor to the crosstalk that we observed.
4.2 Use CasesWe employed our autostereo environment in three applications visualizing molecular models in materials research. Thisfield in particular benefits from stereo vision, as it frequently involves ball-and-stick models that suffer from occlusionas the number of atoms increases. To accomplish this, we coupled DVC with Nanovol, an interactive visualization tooldesigned for mixed ball-and-stick and volume rendering for these materials applications.16 Since many materials volumedatasets are low-resolution, Nanovol employs tricubic B-spline filtering to improve visual quality and reconstruction ofsharp features. However, our autostereo framework would extend to any application that can output stereo images andreceive appropriate inputs.
Figure 9. Comparative visualization of amorphous aluminumnanobowls demonstrates arranging and viewing models in 3D spaceaccording to different model parameters.
The first materials application involves comparison ofamorphous aluminum oxide nanobowls, which serve ascatalyst support structures. A molecular dynamics systemsimulates atomic diffusion at various temperatures. De-pending on the radius of the bowl and temperature of thesystem, the compound may lose its structure. Domainscientists wish to examine the output of multiple simula-tions, and compare which parameters lead to stable or un-stable bowl structures. We model this geometry as solvent-accessible molecular surfaces using SURF,18 and use DVCto visualize the resulting triangle meshes. Conventionally,depth in these models is indicated by a RGB colormap,which can be difficult to perceive in anaglyph stereo sys-tems. Autostereo displays allow for 3D depth perceptionwithout sacrificing color range (Figure 9).
Larger ball-and-stick models benefit strongly fromstereo display. Ball-and-stick is the conventional rendering modality for most chemistry applications. However, it isoften impractical to render even moderate-size models (1,000 atoms or more) in this fashion. In current materials researchit is common to work with models with thousands to millions of atoms. While fog and volume rendering improve depthintuition, they obscure objects in the background. Figure 1 shows a portion of a 740,000 atom carbon nanosphere structure,with and without volume rendering, and displayed with our autostereo system.
Figure 10. DFT-optimized ge-ometry of a 7-atom platinumnanocatalyst with a carbonmonoxide molecule adsorbedon it and two electron densityisosurfaces around the nuclei ofthe Pt, C and O atoms (see thetext for details).
Another use case for stereo rendering is visualization of the atomic and electronicstructure of various atomic and molecular systems, as well as their combinations.20 Oneof the tasks faced by the researchers is to get a correct perception of the 3D atomic con-formation of the nuclei and the 3D spatial distribution of the electronic charge densityaround these nuclei, which “glues” them together. The nuclei may change their posi-tions either as a consequence of optimization of the geometric structure of the system,or because of a dynamical response to an excess energy (alternatively, temperature). Thechange in the nuclear positions is accompanied by a change (response) in the “cloud” ofthe electronic density surrounding them. The computations involved are usually based onthe density functional theory (DFT).19 Sequential display of frames that represent stereorenderings of the evolving positions of the nuclei with the corresponding distributions ofelectron density creates an informative visual representation of the interplay between thenuclear and electronic structures. The illustration given in Figure 10 shows the optimizedstructure of a 7-atom platinum nanocatalyst with a carbon monoxide molecule adsorbedon it (the Pt, C, and O nuclei are depicted in yellow, green and red colors, respectively).The lobes around the nuclei are electron density isosurfaces (two are shown). The greenbackground is added for a visual effect solely.
4.3 End-to-End PerformanceFrame rate performance of various use cases, at various frame buffer sizes, is shown in Ta-ble 2. In all examples, we ran Dynallax at 2500x1600 resolution, on an NVIDIA GTX 480GPU. In the top two cases, we ran DVC in a standalone mode rendering a previously generated mesh, while in the bottom
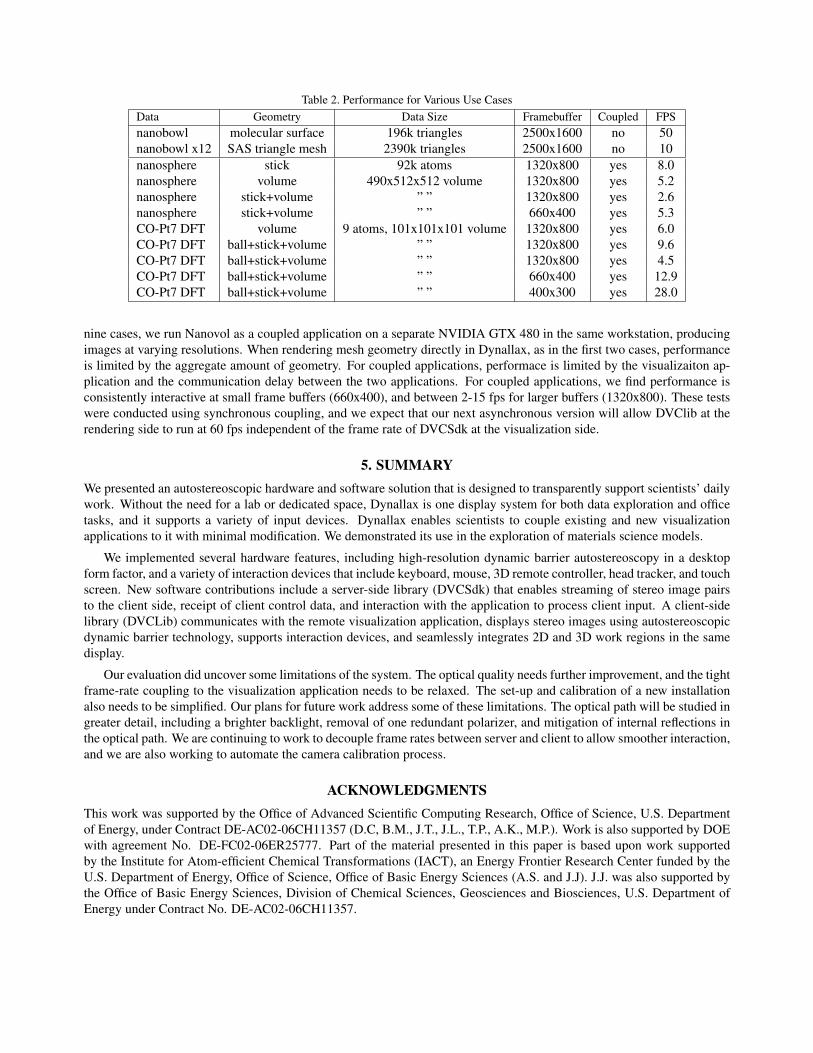
Table 2. Performance for Various Use CasesData Geometry Data Size Framebuffer Coupled FPSnanobowl molecular surface 196k triangles 2500x1600 no 50nanobowl x12 SAS triangle mesh 2390k triangles 2500x1600 no 10nanosphere stick 92k atoms 1320x800 yes 8.0nanosphere volume 490x512x512 volume 1320x800 yes 5.2nanosphere stick+volume ” ” 1320x800 yes 2.6nanosphere stick+volume ” ” 660x400 yes 5.3CO-Pt7 DFT volume 9 atoms, 101x101x101 volume 1320x800 yes 6.0CO-Pt7 DFT ball+stick+volume ” ” 1320x800 yes 9.6CO-Pt7 DFT ball+stick+volume ” ” 1320x800 yes 4.5CO-Pt7 DFT ball+stick+volume ” ” 660x400 yes 12.9CO-Pt7 DFT ball+stick+volume ” ” 400x300 yes 28.0
nine cases, we run Nanovol as a coupled application on a separate NVIDIA GTX 480 in the same workstation, producingimages at varying resolutions. When rendering mesh geometry directly in Dynallax, as in the first two cases, performanceis limited by the aggregate amount of geometry. For coupled applications, performace is limited by the visualizaiton ap-plication and the communication delay between the two applications. For coupled applications, we find performance isconsistently interactive at small frame buffers (660x400), and between 2-15 fps for larger buffers (1320x800). These testswere conducted using synchronous coupling, and we expect that our next asynchronous version will allow DVClib at therendering side to run at 60 fps independent of the frame rate of DVCSdk at the visualization side.
5. SUMMARYWe presented an autostereoscopic hardware and software solution that is designed to transparently support scientists’ dailywork. Without the need for a lab or dedicated space, Dynallax is one display system for both data exploration and officetasks, and it supports a variety of input devices. Dynallax enables scientists to couple existing and new visualizationapplications to it with minimal modification. We demonstrated its use in the exploration of materials science models.
We implemented several hardware features, including high-resolution dynamic barrier autostereoscopy in a desktopform factor, and a variety of interaction devices that include keyboard, mouse, 3D remote controller, head tracker, and touchscreen. New software contributions include a server-side library (DVCSdk) that enables streaming of stereo image pairsto the client side, receipt of client control data, and interaction with the application to process client input. A client-sidelibrary (DVCLib) communicates with the remote visualization application, displays stereo images using autostereoscopicdynamic barrier technology, supports interaction devices, and seamlessly integrates 2D and 3D work regions in the samedisplay.
Our evaluation did uncover some limitations of the system. The optical quality needs further improvement, and the tightframe-rate coupling to the visualization application needs to be relaxed. The set-up and calibration of a new installationalso needs to be simplified. Our plans for future work address some of these limitations. The optical path will be studied ingreater detail, including a brighter backlight, removal of one redundant polarizer, and mitigation of internal reflections inthe optical path. We are continuing to work to decouple frame rates between server and client to allow smoother interaction,and we are also working to automate the camera calibration process.
ACKNOWLEDGMENTSThis work was supported by the Office of Advanced Scientific Computing Research, Office of Science, U.S. Departmentof Energy, under Contract DE-AC02-06CH11357 (D.C, B.M., J.T., J.L., T.P., A.K., M.P.). Work is also supported by DOEwith agreement No. DE-FC02-06ER25777. Part of the material presented in this paper is based upon work supportedby the Institute for Atom-efficient Chemical Transformations (IACT), an Energy Frontier Research Center funded by theU.S. Department of Energy, Office of Science, Office of Basic Energy Sciences (A.S. and J.J). J.J. was also supported bythe Office of Basic Energy Sciences, Division of Chemical Sciences, Geosciences and Biosciences, U.S. Department ofEnergy under Contract No. DE-AC02-06CH11357.
REFERENCES[1] Peterka, T., Kooima, R., Girado, J., Ge, J., Sandin, D., and DeFanti, T., “Evolution of the varrier autostereoscopic vr
display,” in [Proceedings of IS&T / SPIE Electronic Imaging 2007 ], (2007).[2] Lee, B., Choi, H., Kim, J., Kim, Y., and Cho, S.-W., “Status and prospects of autostereoscopic 3d display technolo-
gies,” in [Lasers and Electro-Optics Society, 2007. LEOS 2007. The 20th Annual Meeting of the IEEE], 354 –355(oct. 2007).
[3] Stenicke, F., Ropinski, T., Bruder, G., and Hinrichs, K., “Inerscopic user interface concepts for fish tank virtual realitysystems,” in [Proceedings of IEEE Virtual Reality 2007 ], (2007).
[4] Sandin, D., Margolis, T., Ge, J., Girado, J., Peterka, T., and DeFanti, T., “The varrier autostereoscopic virtual realitydisplay,” ACM Transactions on Graphics, Proceedings of ACM 24(3), 894–903 (2005).
[5] Lanman, D., Hirsch, M., Kim, Y., and Raskar, R., “Content-adaptive parallax barriers: optimizing dual-layer 3ddisplays using low-rank light field factorization,” in [ACM SIGGRAPH Asia 2010 papers ], SIGGRAPH ASIA ’10,163:1–163:10, ACM, New York, NY, USA (2010).
[6] Stolle, H., Olaya, J.-C., Buschbeck, S., Sahm, H., and Schwerdtner, A., “Technical solutions for a full-resolutionautostereoscopic 2d/3d display technology,” Stereoscopic Displays and Applications XIX 6803(1), 68030Q, SPIE(2008).
[7] Brooks, Jr., F. P., Ouh-Young, M., Batter, J. J., and Jerome Kilpatrick, P., “Project gropehaptic displays for scientificvisualization,” in [Proceedings of the 17th annual conference on Computer graphics and interactive techniques ],SIGGRAPH ’90, 177–185, ACM, New York, NY, USA (1990).
[8] Brady, R., Pixton, J., Baxter, G., Moran, P., Potter, C., Carragher, B., and Belmont, A., “Crumbs: a virtual environ-ment tracking tool for biological imaging,” in [Biomedical Visualization, 1995. Proceedings. ], 18 –25, 82 (oct-3 nov1995).
[9] Cruz-Neira, C., Sandin, D., DeFanti, T., Kenyon, R., and Hart, J., “The cave: Audio visual experience automaticvirtual environment,” Communications of the ACM 35(6), 64–72 (1992).
[10] Bohrer, G., Longo, M., Zielinski, D., and Brady, R., “Vr visualisation as an interdisciplinary collaborative dataexploration tool for large eddy simulations of biosphere-atmosphere interactions,” in [Advances in Visual Computing],Bebis, G., Boyle, R., Parvin, B., Koracin, D., Remagnino, P., Porikli, F., Peters, J., Klosowski, J., Arns, L., Chun, Y.,Rhyne, T.-M., and Monroe, L., eds., Lecture Notes in Computer Science 5358, 856–866, Springer Berlin / Heidelberg(2008).
[11] Peterka, T., Kooima, R., Girado, J., Ge, J., Sandin, D., Johnson, A., Leigh, J., Schulze, J., and DeFanti, T., “Dynallax:Solid state dynamic barrier autostereoscopic vr display,” in [Proceedings of IEEE Virtual Reality 2007 ], (2007).
[12] Peterka, T., Kooima, R., Sandin, D., Johnson, A., Leigh, J., and DeFanti, T., “Advances in the dynallax solid-statedynamic parallax barrier autostereoscopic visualization display system,” IEEE Transactions on Visualization andComputer Graphics 14(3), 487–499 (2008).
[13] Peterka, T., Ross, R., Yu, H., Ma, K.-L., Kooima, R., and Girado, J., “Autostereoscopic display of large-scale scientificvisualization,” Stereoscopic Displays and Applications XX 7237(1), 723706, SPIE (2009).
[14] Geist, A., Gropp, W., Huss-Lederman, S., Lumsdaine, A., Lusk, E., Saphir, W., and Skjellum, T., “Mpi-2: Extendingthe message-passing interface,” in [Proceedings of Euro-Par’96 ], (1996).
[15] Moreland, K., Avila, L., and Fisk, L. A., “Parallel unstructured volume rendering in paraview,” in [Proceedings ofIS&T SPIE Visualization and Data Analysis 2007], (2007).
[16] Knoll, A., Peterka, T., Hereld, M., Papka, M. E., Liu, B., Chan, M., and Greeley, J., “A Volumetric Frameworkfor Registration, Analysis and Visualization of Nanostructured Materials,” in [Online Proceedings of SciDAC 2011 ],SciDAC (2011).
[17] Febretti, A., Mateevitsi, V., Chau, D., Nishimoto, A., McGinnis, B., Misterka, J., Johnson, A., and Leigh, J., “Theomegadesk: Towards a hybrid 2d and 3d work desk,” in [Advances in Visual Computing ], Bebis, G., Boyle, R.,Parvin, B., Koracin, D., Wang, S., Kyungnam, K., Benes, B., Moreland, K., Borst, C., DiVerdi, S., Yi-Jen, C., andMing, J., eds., Lecture Notes in Computer Science 6939, 13–23, Springer Berlin / Heidelberg (2011).
[18] Varshney, A., Brooks, Jr., F. P., Richardson, D. C., Wright, W. V., and Manocha, D., “Defining, computing, andvisualizing molecular interfaces,” in [IEEE Visualization ’95 Proceedings ], Nielson, G. M. and Silver, D., eds., 36–43 (1995).

[19] Valiev, M., Bylaska, E., Govind, N., Kowalski, K., Straatsma, T., Van Dam, H., Wang, D., Nieplocha, J., Apra, E.,Windus, T., et al., “Nwchem: a comprehensive and scalable open-source solution for large scale molecular simula-tions,” Computer Physics Communications 181(9), 1477–1489 (2010).
[20] Avogadro: an open-source molecular builder and visualization tool, http://avogadro.openmolecules.net/.


![ASCR WORKSHOP Priority Research Directions …tpeterka/talks/2019/peterka-works19-talk.pdfStacks. In Situ Yesterday 8 [Zajac, 1964] Simulation Visualization Simulation Visualization](https://img.pdfslide.us/doc/110x75/5ed0f2ee2a742537f26e9f82/ascr-workshop-priority-research-directions-tpeterkatalks2019peterka-works19-talkpdf.jpg)