Embed Size (px)
Citation preview
STATE OF CONNECTICUT DEPARTMENT OF ENVIRONMENTAL PROTECTION 79 Elm Street Hartford, CT 06106-5127 (860) 424-3020 Gina McCarthy, Commissioner
A Total Maximum Daily Load Analysis for the Norwalk River Regional Basin
Final – November 29, 2005
This document has been established pursuant to the requirements of Section 303(d) of the Federal Clean Water Act Jane Stahl 12/1/05 ___________________________ ________ Jane Stahl, Deputy Commissioner Date Yvonne Bolton 11/30/05 ___________________________ ________ Yvonne Bolton, Chief Date Bureau of Water Management
Final E.coil TMDL Norwalk River Regional Basin November 29, 2005
i
TABLE OF CONTENTS
Introduction 1 Priority Ranking 2 Description of Waterbody 2 Pollutant of Concern and Pollutant Sources 3 Applicable Surface Water Quality Standards 3 Numeric Water Quality Target 4 Margin of Safety 5 Seasonal Analysis 6 TMDL Implementation 6 Water Quality Monitoring Plan 9 Reasonable Assurance 10 Provisions for Revising the TMDL 11 Public Participation 11 References 12
TABLES
Table 1 The status of impairment for each of the subject waterbodies based on the 2004 List
Table 2 Potential sources of bacteria for each of the subject waterbodies Table 3 Applicable indicator bacteria criteria for the subject waterbodies Table 4 Summary of the TMDL analysis
FIGURES
Figure 1 Basin Location Map 13 Figure 2 Designated MS4 Areas Map 14 Figure 3 Basin Land Use and TMDL Percent Reductions Map 15
APPENDICES
Appendix A Site Specific Information and TMDL Calculations Appendix B Technical Support Documents for the Cumulative Distribution Function Method Appendix C Status of Action Items from the Norwalk River Watershed Action Plan
Final E.coil TMDL Norwalk River Regional Basin November 29, 2005
1
INTRODUCTION
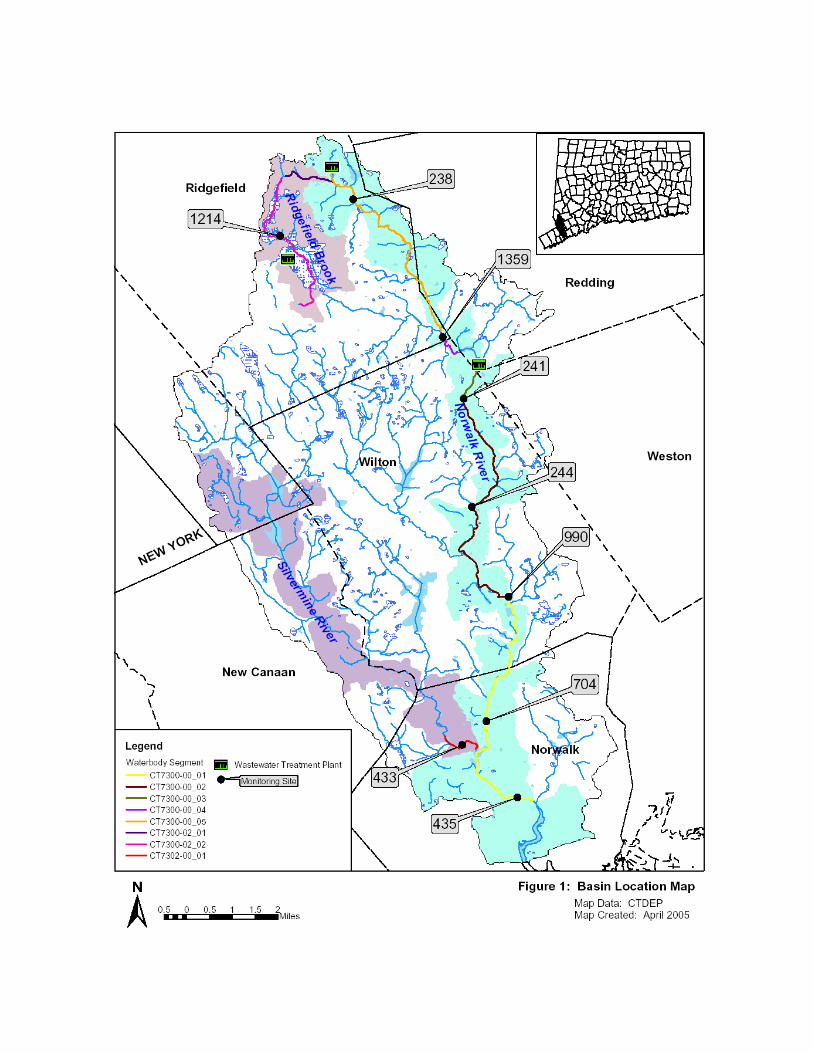
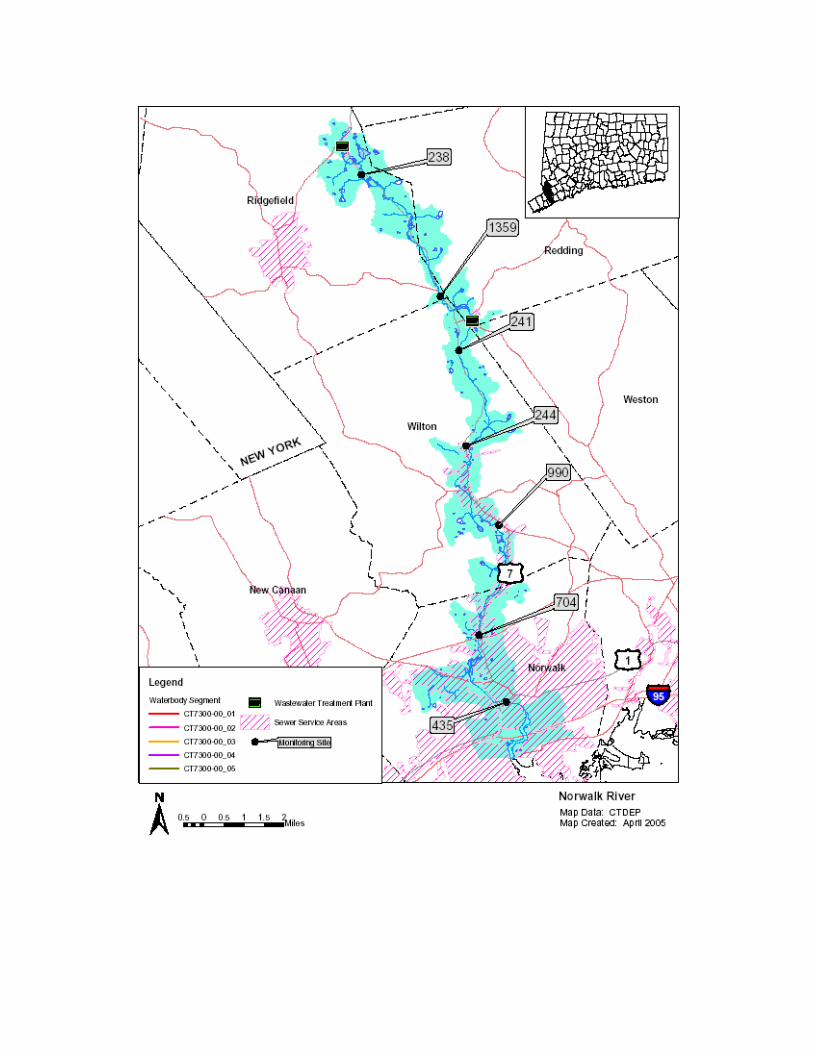
A Total Maximum Daily Load (TMDL) analysis was completed for indicator bacteria in the Norwalk River Regional Basin. The waterbodies included in the TMDL analysis are the Norwalk River, Ridgefield Brook, and Silvermine River (Figure 1). These waterbodies are included on the 2004 List of Connecticut Waterbodies Not Meeting Water Quality Standards1 (2004 List) due to exceedences of the indicator bacteria criteria contained within the State Water Quality Standards (WQS)2. Under section 303(d) of the Federal Clean Water Act (CWA), States are required to develop TMDLs for waters impaired by pollutants that are included on the 2004 List for which technology-based controls are insufficient to achieve water quality standards. Please refer to the 2004 List for more information on impaired waterbodies throughout the State, and the 2004 Water Quality Report to Congress3 for information regarding all assessed waterbodies in the State. In general, the TMDL represents the maximum loading that a waterbody can receive without exceeding the water quality criteria, which have been adopted into the WQS for that parameter. In this TMDL, loadings are expressed as the average percent reduction from current loadings that must be achieved to meet water quality standards. Federal regulations require that the TMDL analysis identify the portion of the total loading which is allocated to point source discharges (termed the Wasteload Allocation or WLA) and the portion attributed to nonpoint sources (termed the Load Allocation or LA), which contribute that pollutant to the waterbody. In addition, TMDLs must include a Margin of Safety (MOS) to account for uncertainty in establishing the relationship between pollutant loadings and water quality. Seasonal variability in the relationship between pollutant loadings and WQS attainment was also considered in these TMDL analyses.
The Norwalk River Regional Basin extends into the Connecticut municipalities of
Norwalk, Wilton, Weston, Redding, Ridgefield, and New Canaan. Within these municipalities are designated urban areas, as defined by the US Census Bureau4 (Figure 2). Such municipalities are required to comply with the General Permit for the Discharge of Stormwater from Small Municipal Separate Storm Sewer Systems (MS4 permit). The general permit is applicable to municipalities that contain designated urban areas (or MS4 communities) and discharge stormwater via a separate storm sewer system to surface waters of the State. The permit requires municipalities to develop a program aimed at reducing the discharge of pollutants, as well as to protect water quality. The permit includes a provision requiring towns to focus their stormwater plans on waterbodies for which TMDLs have been developed. Such a program must include the following six control measures: public education and outreach; public participation; illicit discharge detection and elimination; construction stormwater management (greater than 1 acre); post-construction stormwater management; and pollution prevention and good housekeeping. Specific requirements have been developed within each of these control measures. Additional information regarding the general permit can be obtained on the Department of Environmental Protection (DEP) website at http://www.dep.state.ct.us/wtr/stormwater/ms4index.htm.
TMDLs that have been established by states are submitted to the Regional Office of the
Federal Environmental Protection Agency (EPA) for review. The EPA can either approve the TMDL or disapprove the TMDL and act in lieu of the State. TMDLs provide a scientific basis for local stakeholders to develop and implement Watershed Based Management Plans (Plan),
Final E.coil TMDL Norwalk River Regional Basin November 29, 2005
2
which describe the control measures necessary to achieve acceptable water quality conditions. Therefore, Plans derived from TMDLs typically include an implementation schedule and a description of ongoing monitoring activities to confirm that the TMDL will be effectively implemented and that WQS are achieved and maintained where technically and economically feasible. Public participation during development of the TMDL analysis and subsequent preparation of the Plans is vital to the success of resolving water quality impairments.
TMDL analyses for indicator bacteria in the Norwalk River Regional Basin are provided
herein. As required in a TMDL analysis, load allocations have been determined, a margin of safety has been included, and seasonal variation has been considered. This document also includes recommendations for a water quality monitoring plan, as well as a discussion of TMDL Implementation.
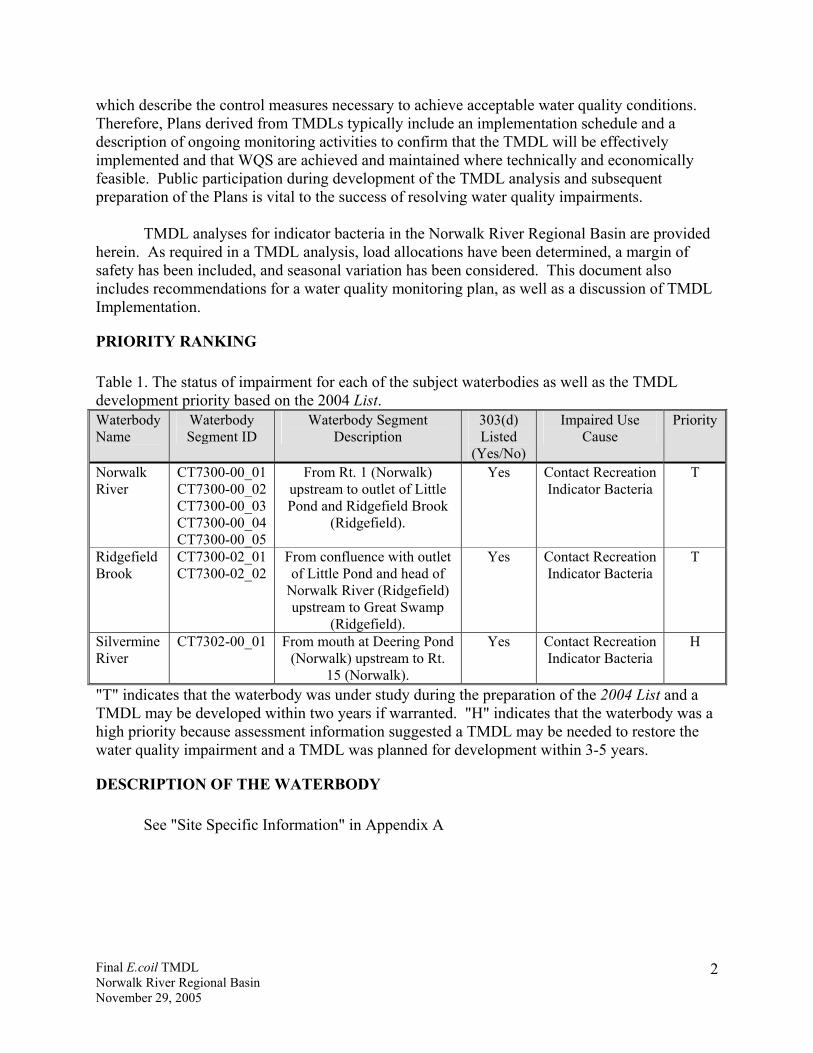
PRIORITY RANKING Table 1. The status of impairment for each of the subject waterbodies as well as the TMDL development priority based on the 2004 List. Waterbody Name
Waterbody Segment ID
Waterbody Segment Description
303(d) Listed
(Yes/No)
Impaired Use Cause
Priority
Norwalk River
CT7300-00_01 CT7300-00_02 CT7300-00_03 CT7300-00_04 CT7300-00_05
From Rt. 1 (Norwalk) upstream to outlet of Little Pond and Ridgefield Brook
(Ridgefield).
Yes Contact Recreation Indicator Bacteria
T
Ridgefield Brook
CT7300-02_01 CT7300-02_02
From confluence with outlet of Little Pond and head of
Norwalk River (Ridgefield) upstream to Great Swamp
(Ridgefield).
Yes Contact Recreation Indicator Bacteria
T
Silvermine River
CT7302-00_01 From mouth at Deering Pond (Norwalk) upstream to Rt.
15 (Norwalk).
Yes Contact Recreation Indicator Bacteria
H
"T" indicates that the waterbody was under study during the preparation of the 2004 List and a TMDL may be developed within two years if warranted. "H" indicates that the waterbody was a high priority because assessment information suggested a TMDL may be needed to restore the water quality impairment and a TMDL was planned for development within 3-5 years.
DESCRIPTION OF THE WATERBODY
See "Site Specific Information" in Appendix A
Final E.coil TMDL Norwalk River Regional Basin November 29, 2005
3
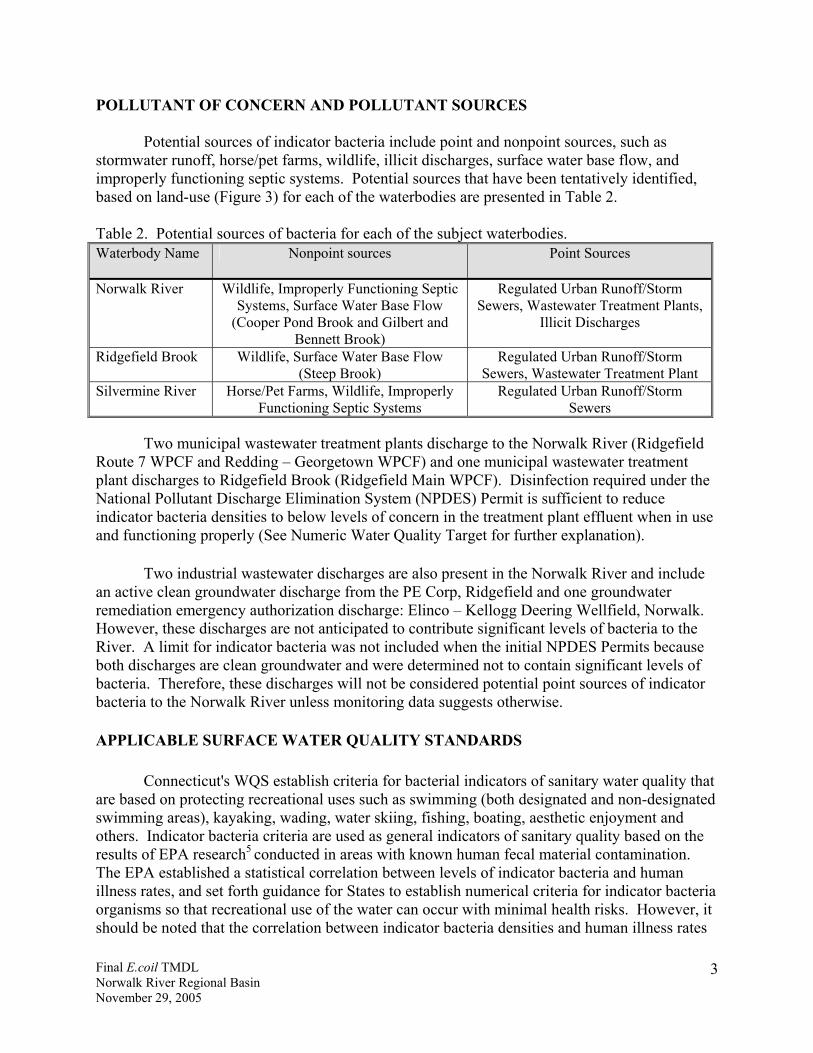
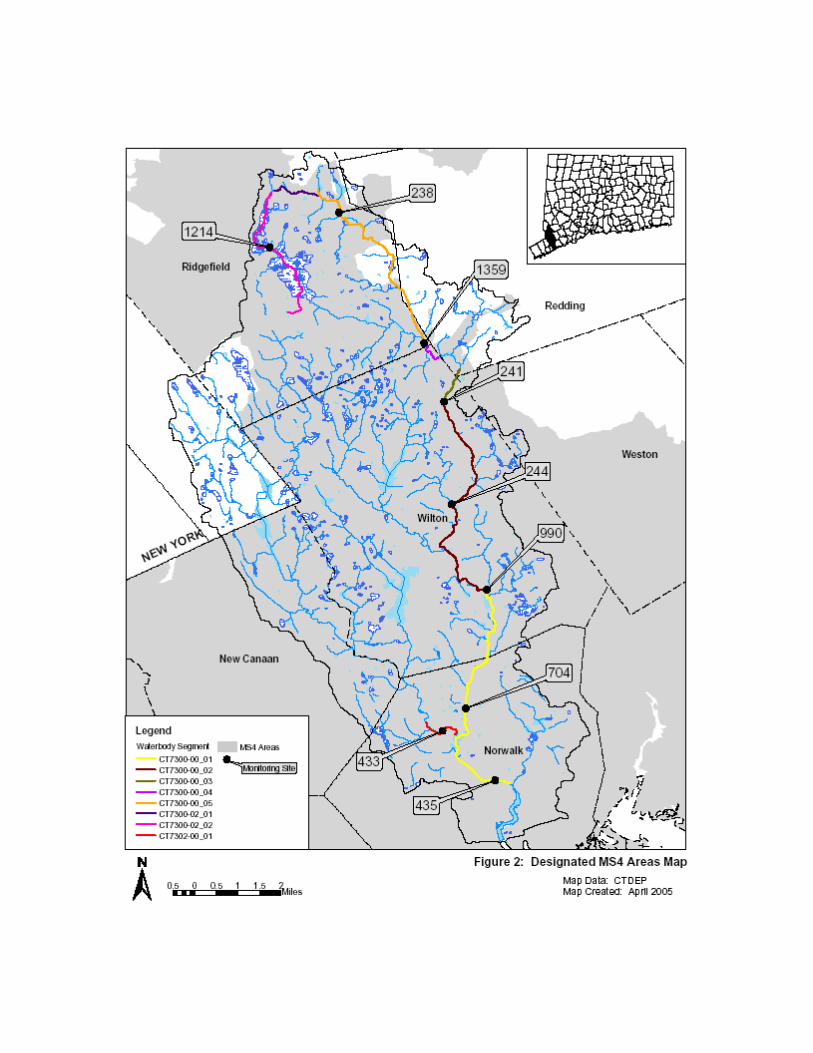
POLLUTANT OF CONCERN AND POLLUTANT SOURCES
Potential sources of indicator bacteria include point and nonpoint sources, such as stormwater runoff, horse/pet farms, wildlife, illicit discharges, surface water base flow, and improperly functioning septic systems. Potential sources that have been tentatively identified, based on land-use (Figure 3) for each of the waterbodies are presented in Table 2. Table 2. Potential sources of bacteria for each of the subject waterbodies. Waterbody Name
Nonpoint sources Point Sources
Norwalk River Wildlife, Improperly Functioning Septic Systems, Surface Water Base Flow
(Cooper Pond Brook and Gilbert and Bennett Brook)
Regulated Urban Runoff/Storm Sewers, Wastewater Treatment Plants,
Illicit Discharges
Ridgefield Brook Wildlife, Surface Water Base Flow (Steep Brook)
Regulated Urban Runoff/Storm Sewers, Wastewater Treatment Plant
Silvermine River Horse/Pet Farms, Wildlife, Improperly Functioning Septic Systems
Regulated Urban Runoff/Storm Sewers
Two municipal wastewater treatment plants discharge to the Norwalk River (Ridgefield Route 7 WPCF and Redding – Georgetown WPCF) and one municipal wastewater treatment plant discharges to Ridgefield Brook (Ridgefield Main WPCF). Disinfection required under the National Pollutant Discharge Elimination System (NPDES) Permit is sufficient to reduce indicator bacteria densities to below levels of concern in the treatment plant effluent when in use and functioning properly (See Numeric Water Quality Target for further explanation).
Two industrial wastewater discharges are also present in the Norwalk River and include an active clean groundwater discharge from the PE Corp, Ridgefield and one groundwater remediation emergency authorization discharge: Elinco – Kellogg Deering Wellfield, Norwalk. However, these discharges are not anticipated to contribute significant levels of bacteria to the River. A limit for indicator bacteria was not included when the initial NPDES Permits because both discharges are clean groundwater and were determined not to contain significant levels of bacteria. Therefore, these discharges will not be considered potential point sources of indicator bacteria to the Norwalk River unless monitoring data suggests otherwise.
APPLICABLE SURFACE WATER QUALITY STANDARDS
Connecticut's WQS establish criteria for bacterial indicators of sanitary water quality that are based on protecting recreational uses such as swimming (both designated and non-designated swimming areas), kayaking, wading, water skiing, fishing, boating, aesthetic enjoyment and others. Indicator bacteria criteria are used as general indicators of sanitary quality based on the results of EPA research5 conducted in areas with known human fecal material contamination. The EPA established a statistical correlation between levels of indicator bacteria and human illness rates, and set forth guidance for States to establish numerical criteria for indicator bacteria organisms so that recreational use of the water can occur with minimal health risks. However, it should be noted that the correlation between indicator bacteria densities and human illness rates
Final E.coil TMDL Norwalk River Regional Basin November 29, 2005
4
varies greatly between sites and the presence of indicator bacteria does not necessarily indicate that human fecal material is present since indicator bacteria occur in all warm-blooded animals.
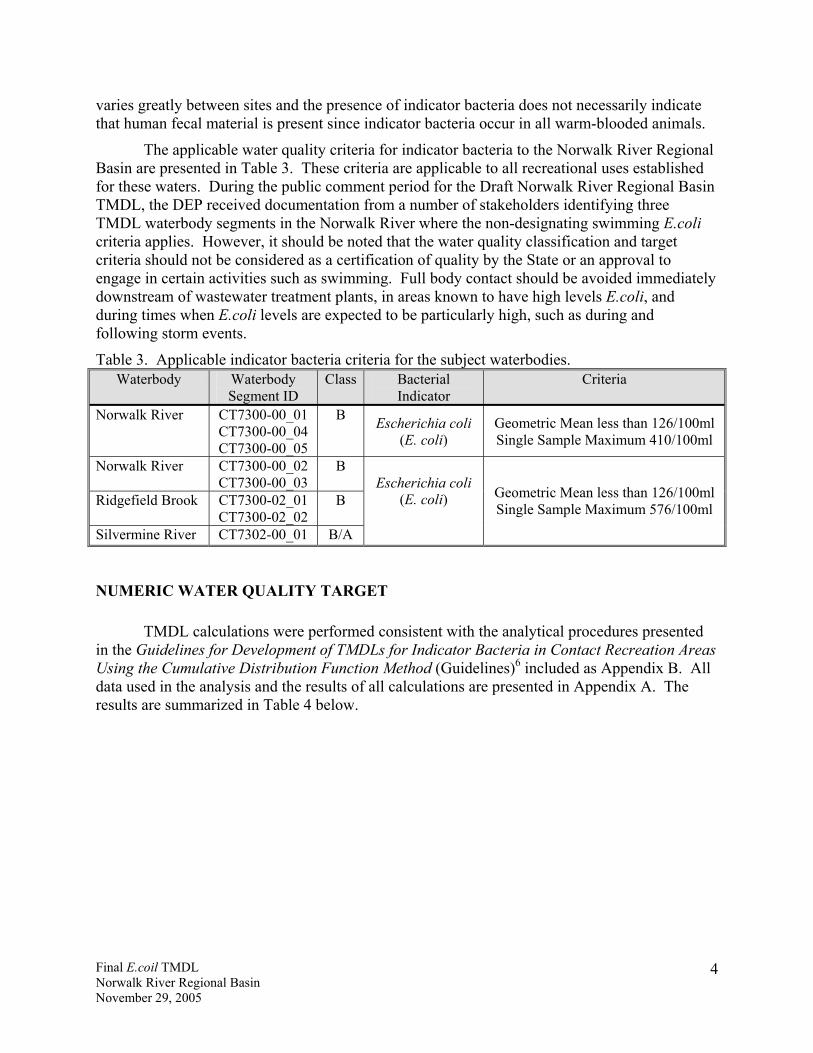
The applicable water quality criteria for indicator bacteria to the Norwalk River Regional Basin are presented in Table 3. These criteria are applicable to all recreational uses established for these waters. During the public comment period for the Draft Norwalk River Regional Basin TMDL, the DEP received documentation from a number of stakeholders identifying three TMDL waterbody segments in the Norwalk River where the non-designating swimming E.coli criteria applies. However, it should be noted that the water quality classification and target criteria should not be considered as a certification of quality by the State or an approval to engage in certain activities such as swimming. Full body contact should be avoided immediately downstream of wastewater treatment plants, in areas known to have high levels E.coli, and during times when E.coli levels are expected to be particularly high, such as during and following storm events.
Table 3. Applicable indicator bacteria criteria for the subject waterbodies. Waterbody Waterbody
Segment ID Class Bacterial
Indicator Criteria
Norwalk River CT7300-00_01 CT7300-00_04 CT7300-00_05
B Escherichia coli (E. coli)
Geometric Mean less than 126/100ml Single Sample Maximum 410/100ml
Norwalk River CT7300-00_02 CT7300-00_03
B
Ridgefield Brook CT7300-02_01 CT7300-02_02
B
Silvermine River CT7302-00_01 B/A
Escherichia coli
(E. coli) Geometric Mean less than 126/100ml Single Sample Maximum 576/100ml
NUMERIC WATER QUALITY TARGET
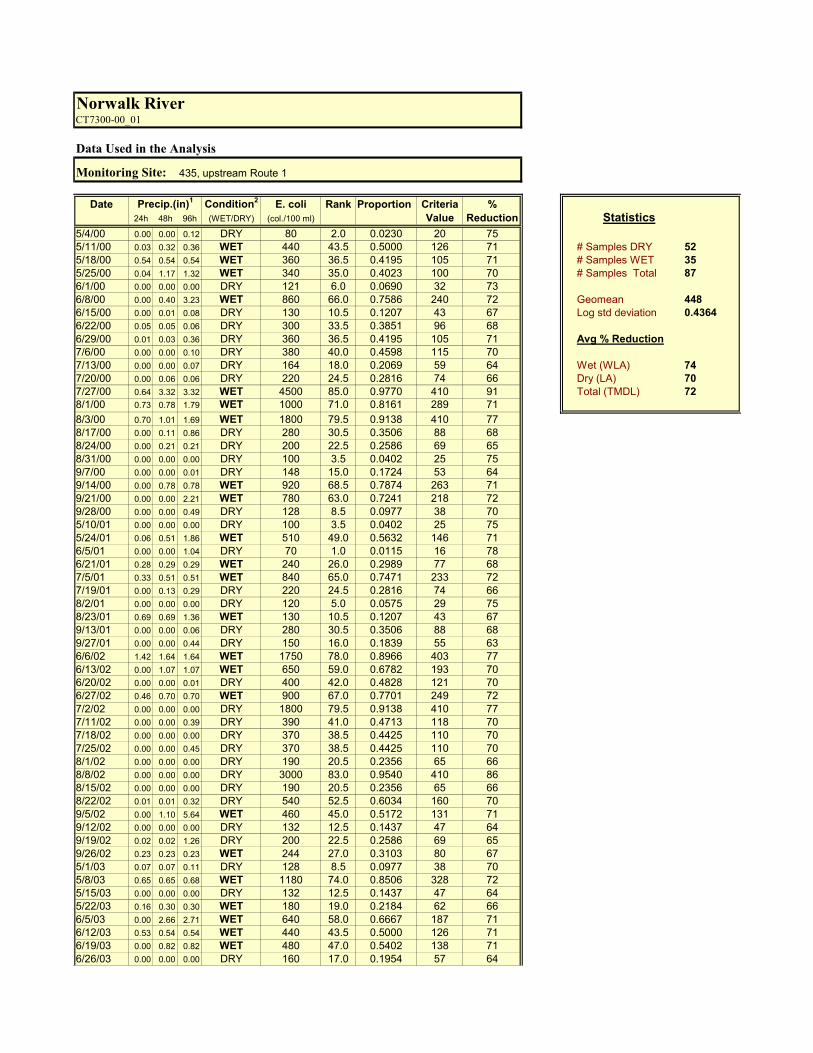
TMDL calculations were performed consistent with the analytical procedures presented in the Guidelines for Development of TMDLs for Indicator Bacteria in Contact Recreation Areas Using the Cumulative Distribution Function Method (Guidelines)6 included as Appendix B. All data used in the analysis and the results of all calculations are presented in Appendix A. The results are summarized in Table 4 below.
Final E.coil TMDL Norwalk River Regional Basin November 29, 2005
5
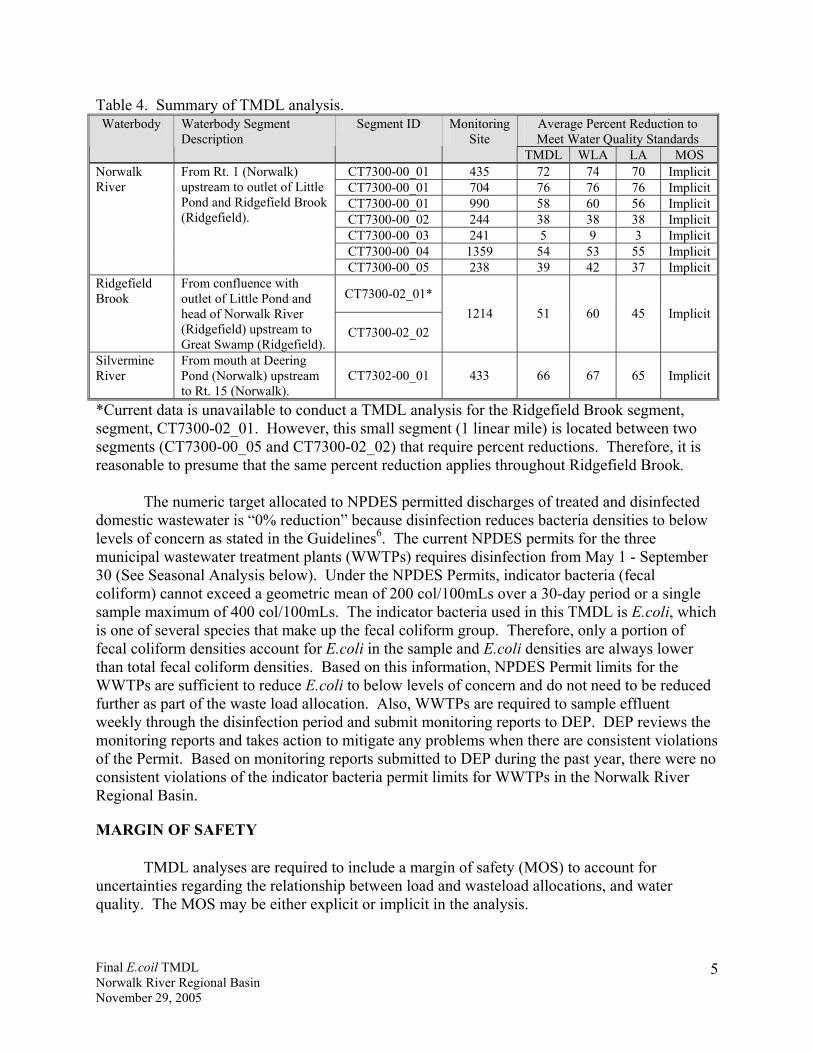
Table 4. Summary of TMDL analysis. Average Percent Reduction to Meet Water Quality Standards
Waterbody Waterbody Segment Description
Segment ID Monitoring Site
TMDL WLA LA MOS CT7300-00_01 435 72 74 70 Implicit CT7300-00_01 704 76 76 76 Implicit CT7300-00_01 990 58 60 56 Implicit CT7300-00_02 244 38 38 38 Implicit CT7300-00_03 241 5 9 3 Implicit CT7300-00_04 1359 54 53 55 Implicit
Norwalk River
From Rt. 1 (Norwalk) upstream to outlet of Little Pond and Ridgefield Brook (Ridgefield).
CT7300-00_05 238 39 42 37 Implicit
CT7300-02_01* Ridgefield Brook
From confluence with outlet of Little Pond and head of Norwalk River (Ridgefield) upstream to Great Swamp (Ridgefield).
CT7300-02_02 1214 51 60 45 Implicit
Silvermine River
From mouth at Deering Pond (Norwalk) upstream to Rt. 15 (Norwalk).
CT7302-00_01 433 66 67 65 Implicit
*Current data is unavailable to conduct a TMDL analysis for the Ridgefield Brook segment, segment, CT7300-02_01. However, this small segment (1 linear mile) is located between two segments (CT7300-00_05 and CT7300-02_02) that require percent reductions. Therefore, it is reasonable to presume that the same percent reduction applies throughout Ridgefield Brook.
The numeric target allocated to NPDES permitted discharges of treated and disinfected domestic wastewater is “0% reduction” because disinfection reduces bacteria densities to below levels of concern as stated in the Guidelines6. The current NPDES permits for the three municipal wastewater treatment plants (WWTPs) requires disinfection from May 1 - September 30 (See Seasonal Analysis below). Under the NPDES Permits, indicator bacteria (fecal coliform) cannot exceed a geometric mean of 200 col/100mLs over a 30-day period or a single sample maximum of 400 col/100mLs. The indicator bacteria used in this TMDL is E.coli, which is one of several species that make up the fecal coliform group. Therefore, only a portion of fecal coliform densities account for E.coli in the sample and E.coli densities are always lower than total fecal coliform densities. Based on this information, NPDES Permit limits for the WWTPs are sufficient to reduce E.coli to below levels of concern and do not need to be reduced further as part of the waste load allocation. Also, WWTPs are required to sample effluent weekly through the disinfection period and submit monitoring reports to DEP. DEP reviews the monitoring reports and takes action to mitigate any problems when there are consistent violations of the Permit. Based on monitoring reports submitted to DEP during the past year, there were no consistent violations of the indicator bacteria permit limits for WWTPs in the Norwalk River Regional Basin.
MARGIN OF SAFETY
TMDL analyses are required to include a margin of safety (MOS) to account for uncertainties regarding the relationship between load and wasteload allocations, and water quality. The MOS may be either explicit or implicit in the analysis.
Final E.coil TMDL Norwalk River Regional Basin November 29, 2005
6
The indicator bacteria criteria used in this TMDL analysis were developed exclusively from data derived from studies conducted by EPA at high use designated public bathing areas with known human fecal contamination5. Therefore, the criteria provide an additional level of protection when applied to waters not used as designated swimming areas or contaminated by human fecal material. As a result, achieving the criteria results in an "implicit MOS". Additional explanation concerning the implicit MOS incorporated into the analysis is provided in the Guidelines6. SEASONAL ANALYSIS
Previous investigations by the DEP into seasonal trends of indicator bacteria densities in surface waters indicates that the summer months typically exhibit the highest densities of any season (Water Quality Summary)7. This phenomena is likely due to the enhanced ability of indicator bacteria to survive in surface waters and sediment when ambient temperatures more closely approximate those of warm-blooded animals, from which the bacteria originate. In addition, resident wildlife populations are likely to be more active during the warmer months and more migratory species are present during the summer. These factors combine to make the summer, recreational period representative of "worst-case" conditions.
During the public comment period, the DEP received several requests to extend the
current disinfection period (May 1 to September 30). Based on this request, the TMDLs presented in this document are applicable from April 1 to October 31 to account for recreational uses that occur during those months. A 1990 survey8 indicated fishing occurs throughout the Norwalk River and the River is currently considered a heavily stocked stream by the DEP Fisheries Division9. In 2002 the upper portion of the Norwalk River in Wilton and Ridgefield was designated a Class 3 Wild Trout Management Area (WTMA). A Class 3 WTMA supplements hatchery-stocked trout to wild trout streams to provide greater fishing opportunities for anglers. Fishing pressure is most intense during the start of the season (April) and continues at a moderate level through October. This TMDL is applicable from April 1 to October 31 to provide a level of protection for fishing and wading activities that occur during these months. Achieving consistency with the TMDLs from April 1 to October 31 will result in achieving full support of recreational uses throughout the remainder of the year.
TMDL IMPLEMENTATION
The percent reductions established in this TMDL can be achieved by implementing control actions where technically and economically feasible that are designed to reduce E. coli loading from nonpoint sources (Load Allocation) and point sources (Waste Load Allocation). These actions may be taken by State and Local government, academia, volunteer citizens groups, and individuals to promote effective watershed management.
It is important to note that the TMDLs are effective for the entire watershed because they
are a measurement of compounded impacts at a single point. As such, corrective actions must be undertaken at the source(s) whether it is a tributary or illicit discharge pipe, in order to achieve the required percent reductions. Also, the approach to TMDL Implementation is anticipated to
Final E.coil TMDL Norwalk River Regional Basin November 29, 2005
7
be on a watershed wide scale, which will require that all sources within the regional basin that are contributing to the in-stream impairment be addressed. The DEP advocates that a watershed based plan for the Norwalk River Regional Basin be developed to implement the TMDLs. The plan should follow guidelines provided by the EPA and include participation for all watershed towns. The following guidance offers suggestions regarding BMP implementation, however the goal is to allow responsible parties flexibility in developing a TMDL implementation plan (watershed based plan). The DEP supports an adaptive and iterative management approach where reasonable controls are implemented and water quality is monitored in order to evaluate for achievement of the TMDL goals and modification of controls as necessary.
The numeric target allocated to NPDES permitted discharges of treated and disinfected domestic wastewater is “0% reduction” because disinfection reduces bacteria densities to below levels of concern as stated in the Guidelines6. The current NPDES permits for the three municipal wastewater treatment plants requires disinfection from May 1 - September 30. The DEP has received a number of requests from stakeholders during the development of the TMDL to extend the period of disinfection due to the volume of fishing and wading use the Norwalk River experiences during April and October. As such, implementation of the TMDL will require extending the current disinfection period to include the months of April and October in the NPDES permits for the three municipal wastewater treatment plants. Extending the disinfection season will be required when the permits are renewed. All three permits, Redding-Georgetown WPCF, Ridgefield Main WPCF, and Ridgefield Route 7 WPCF expire on January 27, 2008, September 29, 2009, and October 4, 2009, respectively. This is proposed in addition to the percent reductions to other sources to provide a level of protection during the fishing season, where wading occurs and the potential for full body immersion exists.
Point sources of E. coli to the Norwalk River Regional Basin also include regulated stormwater. Control actions for regulated stormwater include the General Permit for the Discharge of Stormwater from Small Municipal Separate Storm Sewer Systems (MS4 Permit). Under this permit, municipalities are required to implement minimum control measures in their Stormwater Management Plans to reduce the discharge of pollutants, protect water quality, and satisfy the appropriate water quality requirements of the Clean Water Act. The six minimum control measures are:
• Public Education and Outreach • Public Participation/Involvement • Illicit Discharge Detection and Elimination • Construction Site Runoff Control • Post-construction Runoff Control • Pollution Prevention/Good Housekeeping
The minimum control measures include a number of Best Management Practices (BMP)
for which an implementation schedule must be developed and submitted to the DEP as Part B Registration. Under the MS4 permit, all minimum control measures must be implemented by January 8, 2009. Information regarding Connecticut's MS4 permit can be found on the DEP's website at http://www.dep.state.ct.us/pao/download.htm#MS4GP. In addition, the EPA has
Final E.coil TMDL Norwalk River Regional Basin November 29, 2005
8
developed fact sheets, which provide an overview of the Phase II final rule and MS4 permit, and provide detail regarding the minimum control measures, as well as optional BMPs not required in Connecticut's MS4 permit. The fact sheets can be found on the EPA's website at: http://cfpub.epa.gov/npdes/stormwater/swphases.cfm. Some of the information includes guidance for the development and implementation of Stormwater Management Plans, as well as guidance for establishing measurable goals for BMP implementation.
Section 6(K) of the MS4 Permit requires the municipality to modify their Stormwater Management Plan to implement the TMDL (achieve reductions) within four months of TMDL approval by EPA. It is recommended that municipalities focus their revised Stormwater Management Plans on the TMDL waterbodies for Section 6(a)(1)(A)(i) - implement public education program, Section 6(a)(3)(A)(i, ii, iii) and 6(a)(3)(A)(i, ii, iii, iv) - illicit discharge detection, Section 6(a)(6)(A)(iv) - stormwater structures cleaning, and Section 6(a)(6)(A)(v) - prioritize stormwater structures for repair or upgrade, of the MS4 permit.
It should be noted that the Norwalk River Watershed Initiative (NRWI) formulated the Norwalk River Watershed Action Plan10 in 1998. The Plan was signed by numerous stakeholders, including elected officials from the watershed municipalities, chairpersons from NRWI, and officials from federal and state agencies including DEP. The Watershed Plan addresses action items in four categories (Habitat Restoration, Land Use/Flood Protection/Open Space, Water Quality, and Stewardship and Education) designed to protect and restore the Norwalk River watershed. Action items have been assigned to appropriate stakeholders, such as local municipalities, federal, state, and regional agencies, watershed coordinators, Nonpoint Education for Municipality Officials, private conservation and civic community organizations, public and private water companies, advisory committee, and Norwalk River Watershed Association, for implementation of the Plan. This Action Plan provides direction for implementation of the TMDL, as well as fulfills some of the minimum control measures required in the MS4 permit. A status of action items in the Norwalk River Watershed from the ‘Initiative Accomplishments’ section of the 2004 Supplement to the Action Plan11 is included in Appendix C. More recently (winter 2005), the NRWI began working with local officials to prepare nuisance wildlife control plans and septic system maintenance guidance.
The DEP encourages all local stakeholders to continue their efforts by working together to formulate a watershed based plan to implement the TMDL. A watershed based plan formulated at the local level will most efficiently make use of local resources by assigning tasks to responsible parties and serving as an agreed roadmap to reducing bacteria levels in the Basin.
The TMDLs establish a benchmark to measure the effectiveness of BMP implementation. Achievement of the TMDLs is directly linked to incorporation of the provisions of the MS4 permit by municipalities, as well as the implementation of other BMPs to address nonpoint sources. Nonpoint sources include wildlife, improperly functioning septic systems, surface water base flow, and horse/pet farms. BMPs for the management of nonpoint sources include septic system testing and maintenance, nuisance wildlife control plans, and pet waste ordinances. The contribution of bacteria from surface water base flow should be addressed by implementing nonpoint source BMPs in tributaries with known high levels of E.coli densities, such as Steep
Final E.coil TMDL Norwalk River Regional Basin November 29, 2005
9
Brook, Cooper Pond Brook, and Gilbert and Bennett Brook. As progress is made implementing BMPs, the “percent reduction” needed to meet criteria will decrease.
Guidance to local municipalities for the management of septic systems can be found on the EPA's website at http://cfpub.epa.gov/owm/septic/guidelines.cfm#7478. Additional general information regarding septic systems can be found at http://cfpub.epa.gov/owm/septic/home.cfm. Nuisance wildlife information can be found on the DEP's website at http://www.dep.state.ct.us/burnatr/wildlife/problem.htm. Guidance for the management of agricultural activities can be found on EPA’s website at http://www.epa.gov/owow/nps/agriculture.html.
In addition, the DEP's watershed coordinator will continue to provide technical and educational assistance to the local municipalities and other stakeholders, as well as identify potential funding sources, when available, for implementation of the TMDL and monitoring plan.
WATER QUALITY MONITORING PLAN
A comprehensive water quality monitoring program is necessary to guide TMDL implementation efforts. The monitoring program should be designed to accomplish two objectives: source detection to identify specific sources of bacterial loading and direct BMP implementation efforts with fixed station monitoring to quantify progress in achieving TMDL established goals. The MS4 Permit that is the basis of TMDL implementation efforts in MS4 communities includes the following monitoring requirement:
“Stormwater monitoring shall be conducted by the Regulated Small MS4 annually starting in 2004. At least two outfalls apiece shall be monitored from areas of primarily industrial development, commercial development and residential development, respectively, for a total of six (6) outfalls monitored. Each monitored outfall shall be selected based on an evaluation by the MS4 that the drainage area of such outfall is representative of the overall nature of its respective land use type.”
Section 6(h)(A) MS4 Permit This type of monitoring may be referred to as event monitoring because it is scheduled to coincide with a stormwater runoff event. Event monitoring can present numerous logistical difficulties for municipalities and may not be the most efficient way to measure progress in achieving water quality standards. This is particularly true for streams draining urbanized watersheds where many sources contribute to excursions above water quality criteria. However, the municipality may request written approval from the DEP for an alternative monitoring program:
“The municipality may submit a request to the Commissioner in writing for implementation of an alternate sampling plan of equivalent or greater scope. The Commissioner will approve or deny such a request in writing.
Section 6(h)(B) MS4 Permit
Final E.coil TMDL Norwalk River Regional Basin November 29, 2005
10
The DEP encourages municipalities faced with implementing a TMDL to request approval for an alternative monitoring program. Monitoring may be performed by municipal staff, citizen volunteers, or contracted to an environmental consulting firm. The program must include sampling to address both objectives (source detection and progress quantification). Source detection monitoring may include such activities as visual inspection of storm sewer outfalls under dry weather conditions, event sampling of individual storm sewer outfalls, and monitoring of ambient (in-stream) conditions at closely spaced intervals to identify “hot spots” for more detailed investigations leading to specific sources of high bacteria loads.
Progress in achieving TMDL established goals through BMP implementation may be most effectively gauged through implementing a fixed station ambient monitoring program. DEP strongly recommends that routine monitoring be performed at the same sites used to generate the data used to perform the TMDL calculations. Sampling should be scheduled at regularly spaced intervals during the recreational season. In this way the data set at the end of each season will include ambient values for both “wet” and “dry” conditions in relative proportion to the number of “wet” and “dry” days that occurred during that period. As additional data is generated over time it will be possible to repeat the TMDL calculations and compare the percent reductions needed under “dry” and “wet” conditions to the percent reductions needed at the time of TMDL adoption.
All pollutant parameters must be analyzed using methods prescribed in Title 40, CFR, Part 136 (1990). Electronic submission of data to DEP is highly encouraged. Results of monitoring that indicate unusually high levels of contamination or potentially illegal activities should be forwarded to the appropriate municipal or State agency for follow-up investigation and enforcement. Consistent with the requirements of the MS4 permit, the following parameters should be included in any monitoring program:
pH (SU) Hardness (mg/l) Conductivity (umos) Oil and grease (mg/l) Chemical Oxygen Demand (mg/l) Turbidity (NTU) Total Suspended Solids (mg/l) Total Phosphorous (mg/l) Ammonia (mg/l) Total Kjeldahl Nitrogen (mg/l) Nitrate plus Nitrite Nitrogen (mg/l) E. coli (col/100ml) precipitation (in)
DEP will continue to explore ways to provide funding support for monitoring efforts
linked to TMDL implementation or other activities that exceed the minimum requirements of the MS4 permit. DEP is also committed to providing technical assistance in monitoring program design and establishing procedures for electronic data submission.
Final E.coil TMDL Norwalk River Regional Basin November 29, 2005
11
REASONABLE ASSURANCE
The MS4 Permit is a legally enforceable document that provides reasonable assurance that the municipalities will take steps towards achieving the target TMDLs and reducing point sources of stormwater containing bacteria.
In addition, the Norwalk River Watershed Action Plan was signed by numerous
stakeholders, including elected officials from watershed towns, chairpersons from the NRWI, and officials from federal and state agencies. This represents a commitment on the local level to watershed restoration and protection. Effectiveness of the Plan is further demonstrated through the development of a watershed committee (NRWI) that focuses on the watershed and is not limited by town boundaries. Recent efforts by NRWI have focused on reducing E.coli levels in the Norwalk River by working with watershed towns to identify nonpoint sources of bacteria, such as improperly functioning septic systems and nuisance wildlife. The recent actions by the NRWI exemplify their commitment to improving water quality and provide reasonable assurance that future efforts will continue towards achieving target TMDLs.
The DEP further supports the development of a watershed based plan specific to bacteria reductions and source mitigation in order to implement the TMDLs. Such a plan may also make projects aimed at reducing nonpoint sources of bacteria in the Norwalk River Regional Basin eligible for funding, as along as such projects are not used for permit compliance. PROVISIONS FOR REVISING THE TMDLs
The DEP reserves the authority to modify the TMDLs as needed to account for new information made available during the implementation of the TMDLs. Modification of the TMDLs will only be made following an opportunity for public participation and will be subject to the review and approval of the EPA. New information, which will be generated during TMDL implementation includes monitoring data, new or revised State or Federal regulations adopted pursuant to Section 303(d) of the Clean Water Act, and the publication by EPA of national or regional guidance relevant to the implementation of the TMDL program. The DEP will propose modifications to the TMDL analysis only in the event that a review of the new information indicates that such a modification is warranted and is consistent with the anti-degradation provisions in Connecticut Water Quality Standards. The subject waterbodies of this TMDL analysis will continue to be included on the List of Connecticut Water bodies Not Meeting Water Quality Standards until monitoring data confirms that recreational uses are fully supported.
PUBLIC PARTICIPATION
The Norwalk River Regional Basin TMDL document was noticed for public comment in the Connecticut Post on July 11, 2005. In addition, the municipalities of Norwalk, Wilton, Weston, Redding, Ridgefield, and New Canaan, as well as several interested parties were notified by mail of the comment period. As of the end of the public review period (August 10, 2005), eight comment letters were received by the DEP. The final TMDL document was modified to reflect any reasonable requests submitted in the comment letters. A response to comments document was also prepared by the DEP.
Final E.coil TMDL Norwalk River Regional Basin November 29, 2005
12
REFERENCES (1) Connecticut Department of Environmental Protection, 2004. List of Connecticut Water
bodies Not Meeting Water Quality Standards. Bureau of Water Management, 79 Elm Street, Hartford, CT 06106-5127.
(2) Connecticut Department of Environmental Protection, 2002. Connecticut Water Quality
Standards. Bureau of Water Management, 79 Elm Street, Hartford, CT 06106-5127. (3) Connecticut Departmen of Environmental Protection, 2004. Water Quality Report to
Congress. Bureau of Water Management, 79 Elm Street, Hartford, CT 06106-5127. (4) U.S. Census Bureau, March 2002. www.census.gov/geo/www/ua/ua_2k.html. (5) United States Environmental Protection Agency, 1986. Ambient Water Quality Criteria
for Bacteria -1986. EPA 440/5-84-002. (6) Connecticut Department of Environmental Protection, 2004. Guidelines for Development
of TMDLs for Indicator Bacteria in Contact Recreation Areas Designated for All Other Uses Using the Cumulative Distribution Function Method. Bureau of Water Management, 79 Elm Street, Hartford, CT 06106-5127.
(7) Connecticut Department of Environmental Protection, 2002. Water Quality Summary
Report for Sasco Brook, Mill River, Rooster River, Fairfield County Connecticut. November 2002.
(8) Connecticut Department of Environmental Protection, 1991. A Survey of Connecticut
Streams and Rivers – Central Coastal and Western Coastal Drainages. Bureau of Recreation, 79 Elm Street, Hartford, CT 06106-5127.
(9) Connecticut Department of Environmental Protection, 2005. 2005 Connecticut Angler’s
Guide. Bureau of Natural Resources, 79 Elm Street, Hartford, CT 06106-5127. (10) Norwalk River Watershed Initiative Committee, 1998. The Norwalk River Watershed
Action Plan. (11) Norwalk River Watershed Initiative Committee, 2004. Supplement to the 1998 Norwalk
River Watershed Action Plan.
Appendix A
A-1 Site Specific Information for Norwalk River A-2 Site Specific Information for Ridgefield Brook A-3 Site Specific Information for Silvermine River
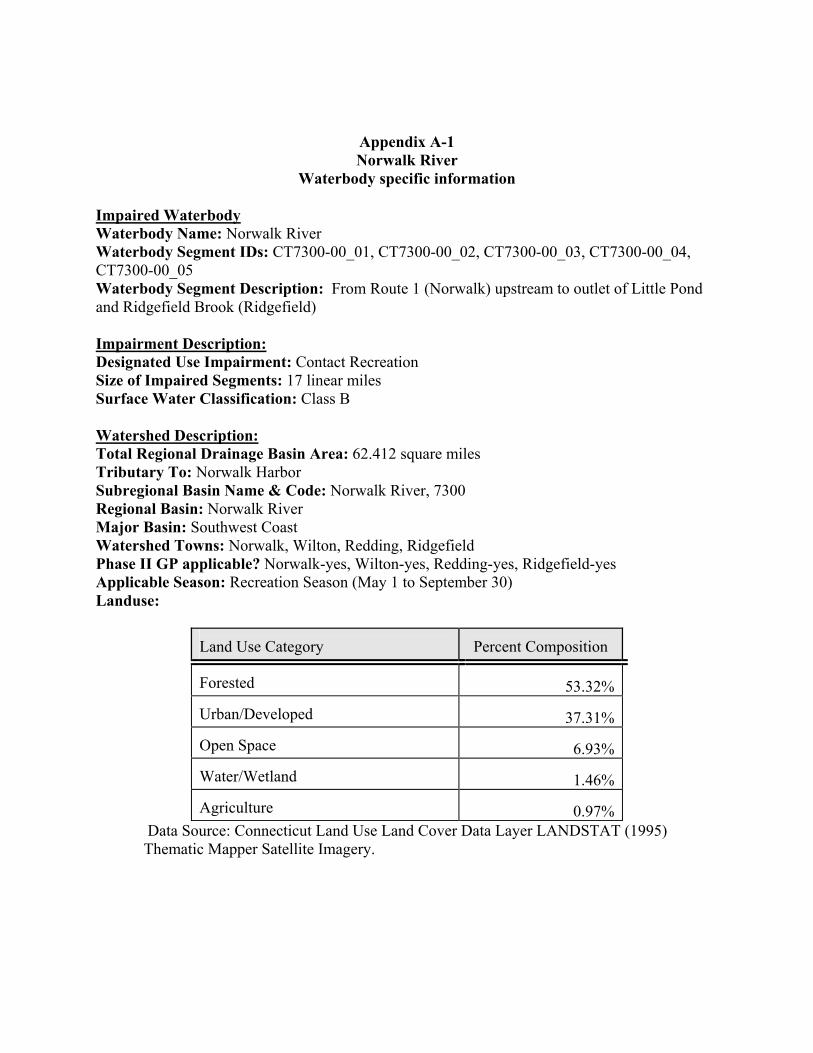
Appendix A-1 Norwalk River
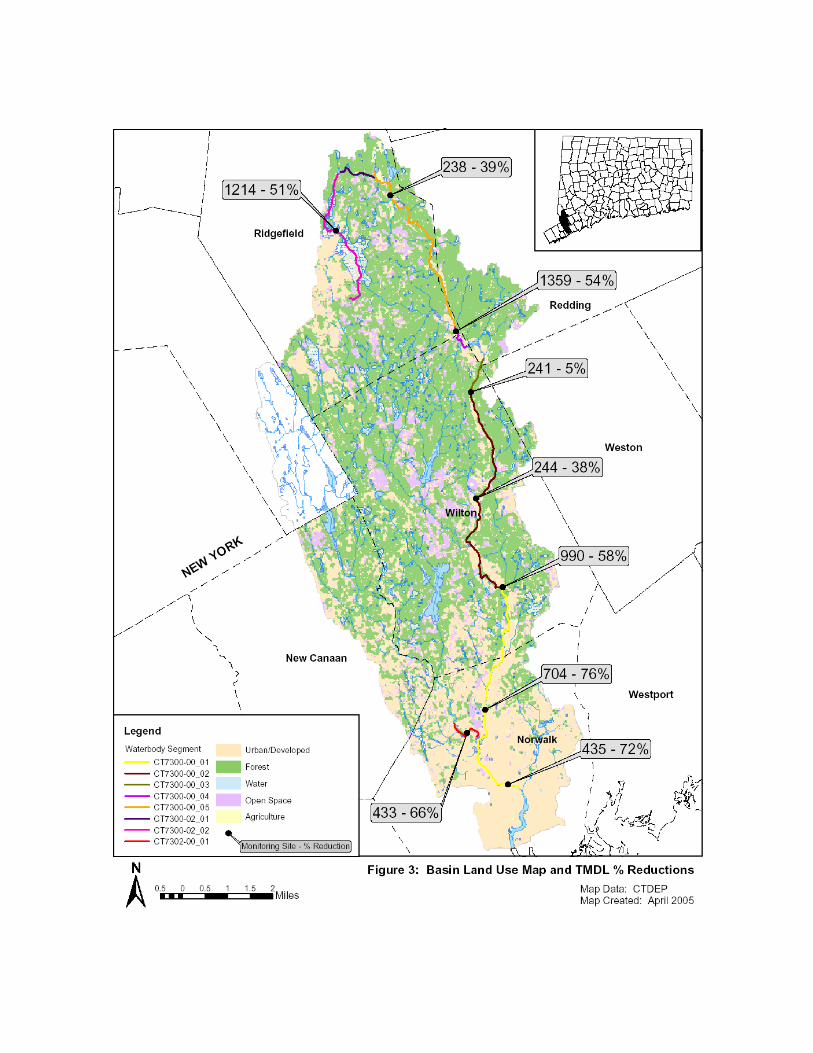
Waterbody specific information Impaired Waterbody Waterbody Name: Norwalk River Waterbody Segment IDs: CT7300-00_01, CT7300-00_02, CT7300-00_03, CT7300-00_04, CT7300-00_05 Waterbody Segment Description: From Route 1 (Norwalk) upstream to outlet of Little Pond and Ridgefield Brook (Ridgefield) Impairment Description: Designated Use Impairment: Contact Recreation Size of Impaired Segments: 17 linear miles Surface Water Classification: Class B Watershed Description: Total Regional Drainage Basin Area: 62.412 square miles Tributary To: Norwalk Harbor Subregional Basin Name & Code: Norwalk River, 7300 Regional Basin: Norwalk River Major Basin: Southwest Coast Watershed Towns: Norwalk, Wilton, Redding, Ridgefield Phase II GP applicable? Norwalk-yes, Wilton-yes, Redding-yes, Ridgefield-yes Applicable Season: Recreation Season (May 1 to September 30) Landuse:
Land Use Category
Percent Composition
Forested 53.32% Urban/Developed 37.31% Open Space 6.93% Water/Wetland 1.46% Agriculture 0.97%
Data Source: Connecticut Land Use Land Cover Data Layer LANDSTAT (1995) Thematic Mapper Satellite Imagery.
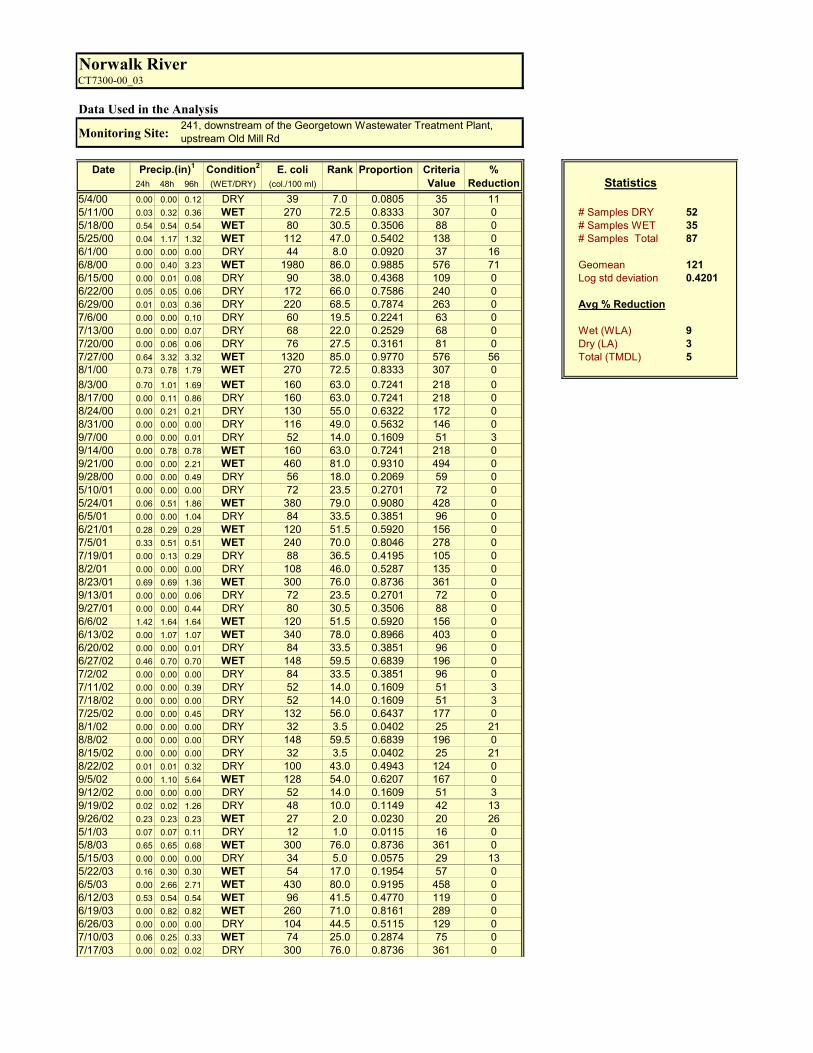
Data Used in the Analysis
Monitoring Site:
Date Precip.(in)1 Condition2 E. coli Rank Proportion Criteria %24h 48h 96h (WET/DRY) (col./100 ml) Value Reduction
5/4/00 0.00 0.00 0.12 DRY 80 2.0 0.0230 20 755/11/00 0.03 0.32 0.36 WET 440 43.5 0.5000 126 71 # Samples DRY 525/18/00 0.54 0.54 0.54 WET 360 36.5 0.4195 105 71 # Samples WET 355/25/00 0.04 1.17 1.32 WET 340 35.0 0.4023 100 70 # Samples Total 876/1/00 0.00 0.00 0.00 DRY 121 6.0 0.0690 32 736/8/00 0.00 0.40 3.23 WET 860 66.0 0.7586 240 72 Geomean 4486/15/00 0.00 0.01 0.08 DRY 130 10.5 0.1207 43 67 Log std deviation 0.43646/22/00 0.05 0.05 0.06 DRY 300 33.5 0.3851 96 686/29/00 0.01 0.03 0.36 DRY 360 36.5 0.4195 105 71 Avg % Reduction7/6/00 0.00 0.00 0.10 DRY 380 40.0 0.4598 115 707/13/00 0.00 0.00 0.07 DRY 164 18.0 0.2069 59 64 Wet (WLA) 747/20/00 0.00 0.06 0.06 DRY 220 24.5 0.2816 74 66 Dry (LA) 707/27/00 0.64 3.32 3.32 WET 4500 85.0 0.9770 410 91 Total (TMDL) 728/1/00 0.73 0.78 1.79 WET 1000 71.0 0.8161 289 718/3/00 0.70 1.01 1.69 WET 1800 79.5 0.9138 410 778/17/00 0.00 0.11 0.86 DRY 280 30.5 0.3506 88 688/24/00 0.00 0.21 0.21 DRY 200 22.5 0.2586 69 658/31/00 0.00 0.00 0.00 DRY 100 3.5 0.0402 25 759/7/00 0.00 0.00 0.01 DRY 148 15.0 0.1724 53 649/14/00 0.00 0.78 0.78 WET 920 68.5 0.7874 263 719/21/00 0.00 0.00 2.21 WET 780 63.0 0.7241 218 729/28/00 0.00 0.00 0.49 DRY 128 8.5 0.0977 38 705/10/01 0.00 0.00 0.00 DRY 100 3.5 0.0402 25 755/24/01 0.06 0.51 1.86 WET 510 49.0 0.5632 146 716/5/01 0.00 0.00 1.04 DRY 70 1.0 0.0115 16 786/21/01 0.28 0.29 0.29 WET 240 26.0 0.2989 77 687/5/01 0.33 0.51 0.51 WET 840 65.0 0.7471 233 727/19/01 0.00 0.13 0.29 DRY 220 24.5 0.2816 74 668/2/01 0.00 0.00 0.00 DRY 120 5.0 0.0575 29 758/23/01 0.69 0.69 1.36 WET 130 10.5 0.1207 43 679/13/01 0.00 0.00 0.06 DRY 280 30.5 0.3506 88 689/27/01 0.00 0.00 0.44 DRY 150 16.0 0.1839 55 636/6/02 1.42 1.64 1.64 WET 1750 78.0 0.8966 403 776/13/02 0.00 1.07 1.07 WET 650 59.0 0.6782 193 706/20/02 0.00 0.00 0.01 DRY 400 42.0 0.4828 121 706/27/02 0.46 0.70 0.70 WET 900 67.0 0.7701 249 727/2/02 0.00 0.00 0.00 DRY 1800 79.5 0.9138 410 777/11/02 0.00 0.00 0.39 DRY 390 41.0 0.4713 118 707/18/02 0.00 0.00 0.00 DRY 370 38.5 0.4425 110 707/25/02 0.00 0.00 0.45 DRY 370 38.5 0.4425 110 708/1/02 0.00 0.00 0.00 DRY 190 20.5 0.2356 65 668/8/02 0.00 0.00 0.00 DRY 3000 83.0 0.9540 410 868/15/02 0.00 0.00 0.00 DRY 190 20.5 0.2356 65 668/22/02 0.01 0.01 0.32 DRY 540 52.5 0.6034 160 709/5/02 0.00 1.10 5.64 WET 460 45.0 0.5172 131 719/12/02 0.00 0.00 0.00 DRY 132 12.5 0.1437 47 649/19/02 0.02 0.02 1.26 DRY 200 22.5 0.2586 69 659/26/02 0.23 0.23 0.23 WET 244 27.0 0.3103 80 675/1/03 0.07 0.07 0.11 DRY 128 8.5 0.0977 38 705/8/03 0.65 0.65 0.68 WET 1180 74.0 0.8506 328 725/15/03 0.00 0.00 0.00 DRY 132 12.5 0.1437 47 645/22/03 0.16 0.30 0.30 WET 180 19.0 0.2184 62 666/5/03 0.00 2.66 2.71 WET 640 58.0 0.6667 187 716/12/03 0.53 0.54 0.54 WET 440 43.5 0.5000 126 716/19/03 0.00 0.82 0.82 WET 480 47.0 0.5402 138 716/26/03 0.00 0.00 0.00 DRY 160 17.0 0.1954 57 64
Statistics
Norwalk RiverCT7300-00_01
435, upstream Route 1
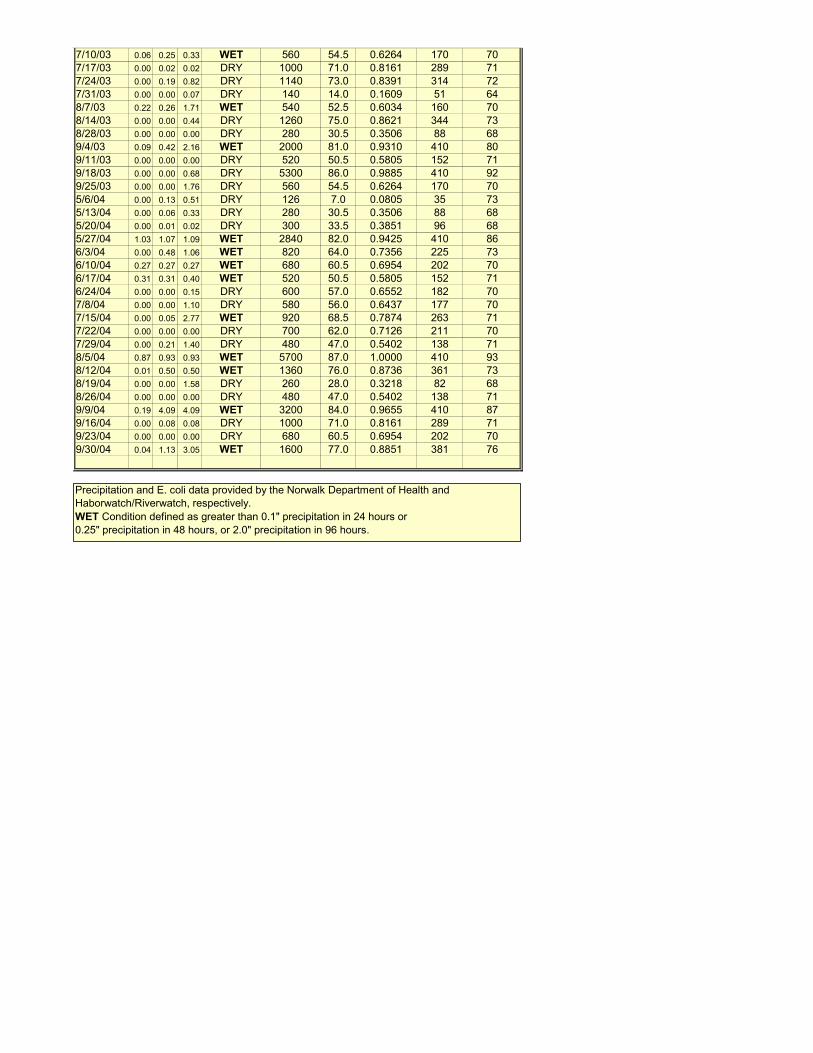
7/10/03 0.06 0.25 0.33 WET 560 54.5 0.6264 170 707/17/03 0.00 0.02 0.02 DRY 1000 71.0 0.8161 289 717/24/03 0.00 0.19 0.82 DRY 1140 73.0 0.8391 314 727/31/03 0.00 0.00 0.07 DRY 140 14.0 0.1609 51 648/7/03 0.22 0.26 1.71 WET 540 52.5 0.6034 160 708/14/03 0.00 0.00 0.44 DRY 1260 75.0 0.8621 344 738/28/03 0.00 0.00 0.00 DRY 280 30.5 0.3506 88 689/4/03 0.09 0.42 2.16 WET 2000 81.0 0.9310 410 809/11/03 0.00 0.00 0.00 DRY 520 50.5 0.5805 152 719/18/03 0.00 0.00 0.68 DRY 5300 86.0 0.9885 410 929/25/03 0.00 0.00 1.76 DRY 560 54.5 0.6264 170 705/6/04 0.00 0.13 0.51 DRY 126 7.0 0.0805 35 735/13/04 0.00 0.06 0.33 DRY 280 30.5 0.3506 88 685/20/04 0.00 0.01 0.02 DRY 300 33.5 0.3851 96 685/27/04 1.03 1.07 1.09 WET 2840 82.0 0.9425 410 866/3/04 0.00 0.48 1.06 WET 820 64.0 0.7356 225 736/10/04 0.27 0.27 0.27 WET 680 60.5 0.6954 202 706/17/04 0.31 0.31 0.40 WET 520 50.5 0.5805 152 716/24/04 0.00 0.00 0.15 DRY 600 57.0 0.6552 182 707/8/04 0.00 0.00 1.10 DRY 580 56.0 0.6437 177 707/15/04 0.00 0.05 2.77 WET 920 68.5 0.7874 263 717/22/04 0.00 0.00 0.00 DRY 700 62.0 0.7126 211 707/29/04 0.00 0.21 1.40 DRY 480 47.0 0.5402 138 718/5/04 0.87 0.93 0.93 WET 5700 87.0 1.0000 410 938/12/04 0.01 0.50 0.50 WET 1360 76.0 0.8736 361 738/19/04 0.00 0.00 1.58 DRY 260 28.0 0.3218 82 688/26/04 0.00 0.00 0.00 DRY 480 47.0 0.5402 138 719/9/04 0.19 4.09 4.09 WET 3200 84.0 0.9655 410 879/16/04 0.00 0.08 0.08 DRY 1000 71.0 0.8161 289 719/23/04 0.00 0.00 0.00 DRY 680 60.5 0.6954 202 709/30/04 0.04 1.13 3.05 WET 1600 77.0 0.8851 381 76
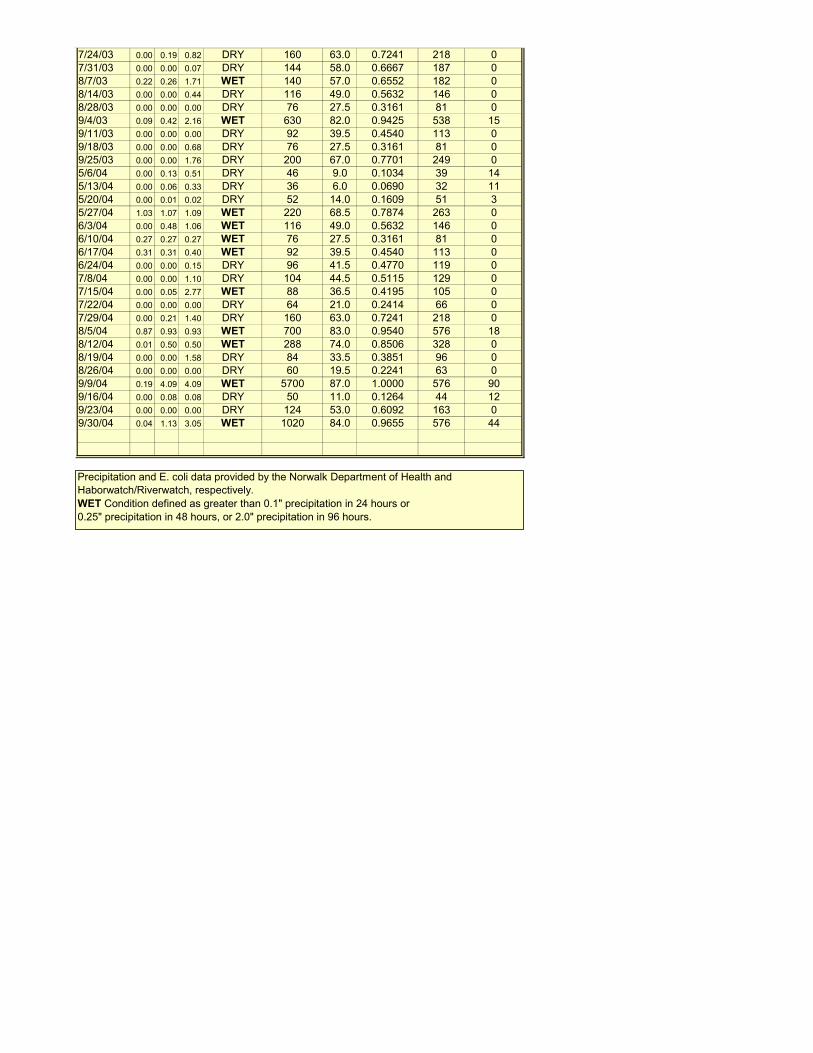
Precipitation and E. coli data provided by the Norwalk Department of Health and Haborwatch/Riverwatch, respectively.WET Condition defined as greater than 0.1" precipitation in 24 hours or0.25" precipitation in 48 hours, or 2.0" precipitation in 96 hours.
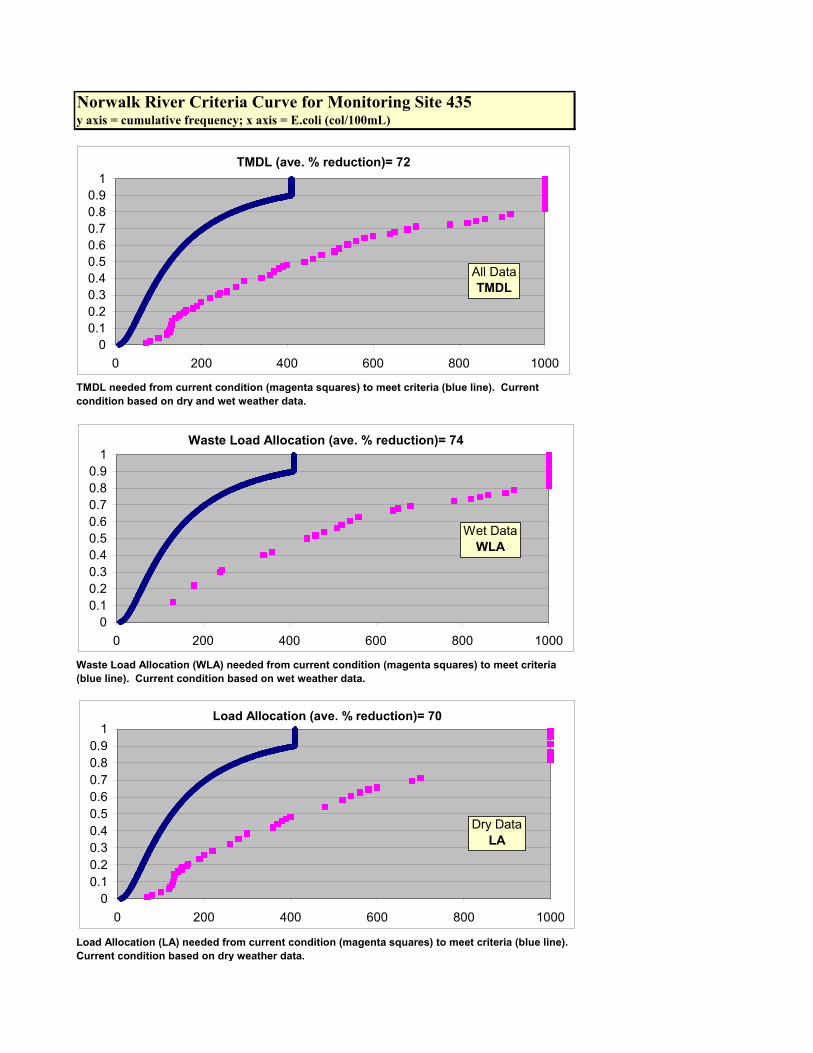
Norwalk River Criteria Curve for Monitoring Site 435y axis = cumulative frequency; x axis = E.coli (col/100mL)
TMDL needed from current condition (magenta squares) to meet criteria (blue line). Current condition based on dry and wet weather data.
Load Allocation (LA) needed from current condition (magenta squares) to meet criteria (blue line). Current condition based on dry weather data.
Waste Load Allocation (WLA) needed from current condition (magenta squares) to meet criteria (blue line). Current condition based on wet weather data.
TMDL (ave. % reduction)= 72
00.10.20.30.40.50.60.70.80.9
1
0 200 400 600 800 1000
Waste Load Allocation (ave. % reduction)= 74
00.10.20.30.40.50.60.70.80.9
1
0 200 400 600 800 1000
Load Allocation (ave. % reduction)= 70
00.10.20.30.40.50.60.70.80.9
1
0 200 400 600 800 1000
All DataTMDL
Wet DataWLA
Dry DataLA
Data Used in the Analysis
Monitoring Site:
Date Precip.(in)1 Condition2 E. coli Rank Proportion Criteria %24h 48h 96h (WET/DRY) (col./100 ml) Value Reduction
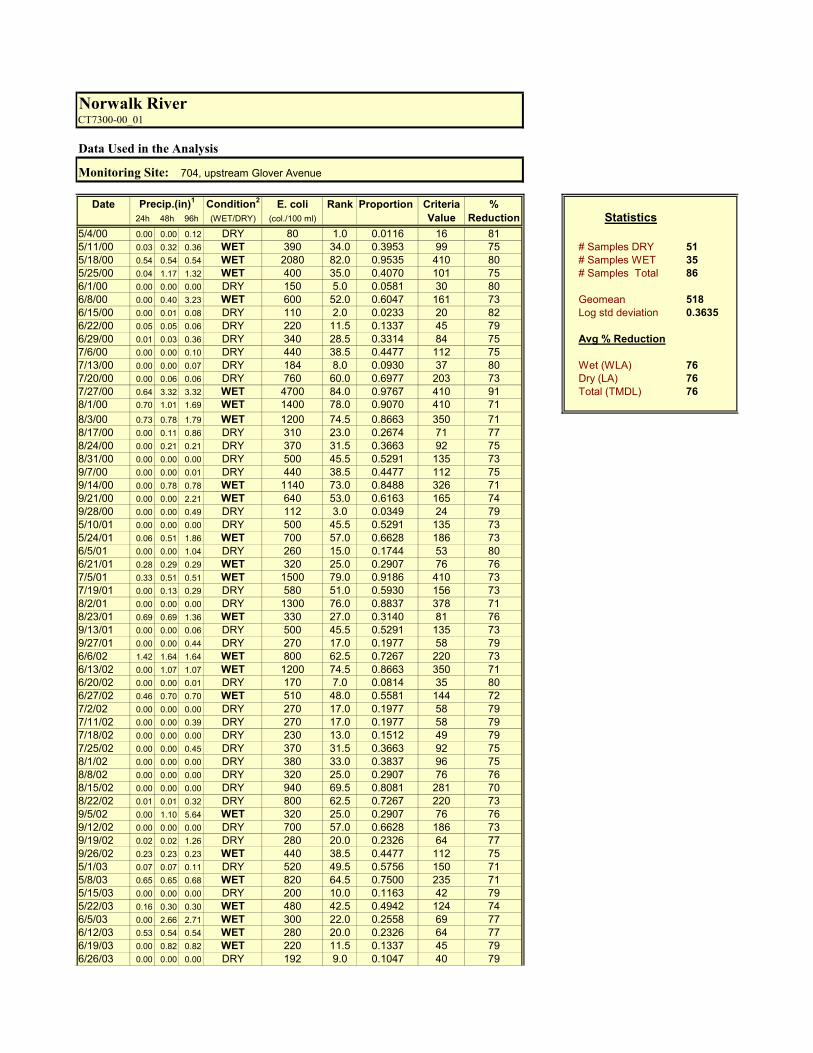
5/4/00 0.00 0.00 0.12 DRY 80 1.0 0.0116 16 815/11/00 0.03 0.32 0.36 WET 390 34.0 0.3953 99 75 # Samples DRY 515/18/00 0.54 0.54 0.54 WET 2080 82.0 0.9535 410 80 # Samples WET 355/25/00 0.04 1.17 1.32 WET 400 35.0 0.4070 101 75 # Samples Total 866/1/00 0.00 0.00 0.00 DRY 150 5.0 0.0581 30 806/8/00 0.00 0.40 3.23 WET 600 52.0 0.6047 161 73 Geomean 5186/15/00 0.00 0.01 0.08 DRY 110 2.0 0.0233 20 82 Log std deviation 0.36356/22/00 0.05 0.05 0.06 DRY 220 11.5 0.1337 45 796/29/00 0.01 0.03 0.36 DRY 340 28.5 0.3314 84 75 Avg % Reduction7/6/00 0.00 0.00 0.10 DRY 440 38.5 0.4477 112 757/13/00 0.00 0.00 0.07 DRY 184 8.0 0.0930 37 80 Wet (WLA) 767/20/00 0.00 0.06 0.06 DRY 760 60.0 0.6977 203 73 Dry (LA) 767/27/00 0.64 3.32 3.32 WET 4700 84.0 0.9767 410 91 Total (TMDL) 768/1/00 0.70 1.01 1.69 WET 1400 78.0 0.9070 410 718/3/00 0.73 0.78 1.79 WET 1200 74.5 0.8663 350 718/17/00 0.00 0.11 0.86 DRY 310 23.0 0.2674 71 778/24/00 0.00 0.21 0.21 DRY 370 31.5 0.3663 92 758/31/00 0.00 0.00 0.00 DRY 500 45.5 0.5291 135 739/7/00 0.00 0.00 0.01 DRY 440 38.5 0.4477 112 759/14/00 0.00 0.78 0.78 WET 1140 73.0 0.8488 326 719/21/00 0.00 0.00 2.21 WET 640 53.0 0.6163 165 749/28/00 0.00 0.00 0.49 DRY 112 3.0 0.0349 24 795/10/01 0.00 0.00 0.00 DRY 500 45.5 0.5291 135 735/24/01 0.06 0.51 1.86 WET 700 57.0 0.6628 186 736/5/01 0.00 0.00 1.04 DRY 260 15.0 0.1744 53 806/21/01 0.28 0.29 0.29 WET 320 25.0 0.2907 76 767/5/01 0.33 0.51 0.51 WET 1500 79.0 0.9186 410 737/19/01 0.00 0.13 0.29 DRY 580 51.0 0.5930 156 738/2/01 0.00 0.00 0.00 DRY 1300 76.0 0.8837 378 718/23/01 0.69 0.69 1.36 WET 330 27.0 0.3140 81 769/13/01 0.00 0.00 0.06 DRY 500 45.5 0.5291 135 739/27/01 0.00 0.00 0.44 DRY 270 17.0 0.1977 58 796/6/02 1.42 1.64 1.64 WET 800 62.5 0.7267 220 736/13/02 0.00 1.07 1.07 WET 1200 74.5 0.8663 350 716/20/02 0.00 0.00 0.01 DRY 170 7.0 0.0814 35 806/27/02 0.46 0.70 0.70 WET 510 48.0 0.5581 144 727/2/02 0.00 0.00 0.00 DRY 270 17.0 0.1977 58 797/11/02 0.00 0.00 0.39 DRY 270 17.0 0.1977 58 797/18/02 0.00 0.00 0.00 DRY 230 13.0 0.1512 49 797/25/02 0.00 0.00 0.45 DRY 370 31.5 0.3663 92 758/1/02 0.00 0.00 0.00 DRY 380 33.0 0.3837 96 758/8/02 0.00 0.00 0.00 DRY 320 25.0 0.2907 76 768/15/02 0.00 0.00 0.00 DRY 940 69.5 0.8081 281 708/22/02 0.01 0.01 0.32 DRY 800 62.5 0.7267 220 739/5/02 0.00 1.10 5.64 WET 320 25.0 0.2907 76 769/12/02 0.00 0.00 0.00 DRY 700 57.0 0.6628 186 739/19/02 0.02 0.02 1.26 DRY 280 20.0 0.2326 64 779/26/02 0.23 0.23 0.23 WET 440 38.5 0.4477 112 755/1/03 0.07 0.07 0.11 DRY 520 49.5 0.5756 150 715/8/03 0.65 0.65 0.68 WET 820 64.5 0.7500 235 715/15/03 0.00 0.00 0.00 DRY 200 10.0 0.1163 42 795/22/03 0.16 0.30 0.30 WET 480 42.5 0.4942 124 746/5/03 0.00 2.66 2.71 WET 300 22.0 0.2558 69 776/12/03 0.53 0.54 0.54 WET 280 20.0 0.2326 64 776/19/03 0.00 0.82 0.82 WET 220 11.5 0.1337 45 796/26/03 0.00 0.00 0.00 DRY 192 9.0 0.1047 40 79
Norwalk RiverCT7300-00_01
704, upstream Glover Avenue
Statistics

7/10/03 0.06 0.25 0.33 WET 1920 81.0 0.9419 410 797/17/03 0.00 0.02 0.02 DRY 1700 80.0 0.9302 410 767/31/03 0.00 0.00 0.07 DRY 360 30.0 0.3488 88 768/7/03 0.22 0.26 1.71 WET 450 41.0 0.4767 119 738/14/03 0.00 0.00 0.44 DRY 860 66.5 0.7733 251 718/28/03 0.00 0.00 0.00 DRY 520 49.5 0.5756 150 719/4/03 0.09 0.42 2.16 WET 2200 83.0 0.9651 410 819/11/03 0.00 0.00 0.00 DRY 660 54.0 0.6279 170 749/18/03 0.00 0.00 0.68 DRY 440 38.5 0.4477 112 759/25/03 0.00 0.00 1.76 DRY 280 20.0 0.2326 64 775/6/04 0.00 0.13 0.51 DRY 114 4.0 0.0465 27 765/13/04 0.00 0.06 0.33 DRY 158 6.0 0.0698 32 805/20/04 0.00 0.01 0.02 DRY 340 28.5 0.3314 84 755/27/04 1.03 1.07 1.09 WET 960 71.0 0.8256 299 696/3/04 0.00 0.48 1.06 WET 680 55.0 0.6395 175 746/10/04 0.27 0.27 0.27 WET 740 59.0 0.6860 197 736/17/04 0.31 0.31 0.40 WET 780 61.0 0.7093 209 736/24/04 0.00 0.00 0.15 DRY 480 42.5 0.4942 124 747/8/04 0.00 0.00 1.10 DRY 860 66.5 0.7733 251 717/15/04 0.00 0.05 2.77 WET 1320 77.0 0.8953 400 707/22/04 0.00 0.00 0.00 DRY 940 69.5 0.8081 281 707/29/04 0.00 0.21 1.40 DRY 700 57.0 0.6628 186 738/5/04 0.87 0.93 0.93 WET 5600 85.0 0.9884 410 938/12/04 0.01 0.50 0.50 WET 900 68.0 0.7907 265 718/19/04 0.00 0.00 1.58 DRY 820 64.5 0.7500 235 718/26/04 0.00 0.00 0.00 DRY 500 45.5 0.5291 135 739/9/04 0.19 4.09 4.09 WET 6000 86.0 1.0000 410 939/16/04 0.00 0.08 0.08 DRY 420 36.0 0.4186 104 759/23/04 0.00 0.00 0.00 DRY 248 14.0 0.1628 51 799/30/04 0.04 1.13 3.05 WET 1060 72.0 0.8372 312 71
Precipitation and E. coli data provided by the Norwalk Department of Health and Haborwatch/Riverwatch, respectively.WET Condition defined as greater than 0.1" precipitation in 24 hours or0.25" precipitation in 48 hours, or 2.0" precipitation in 96 hours.
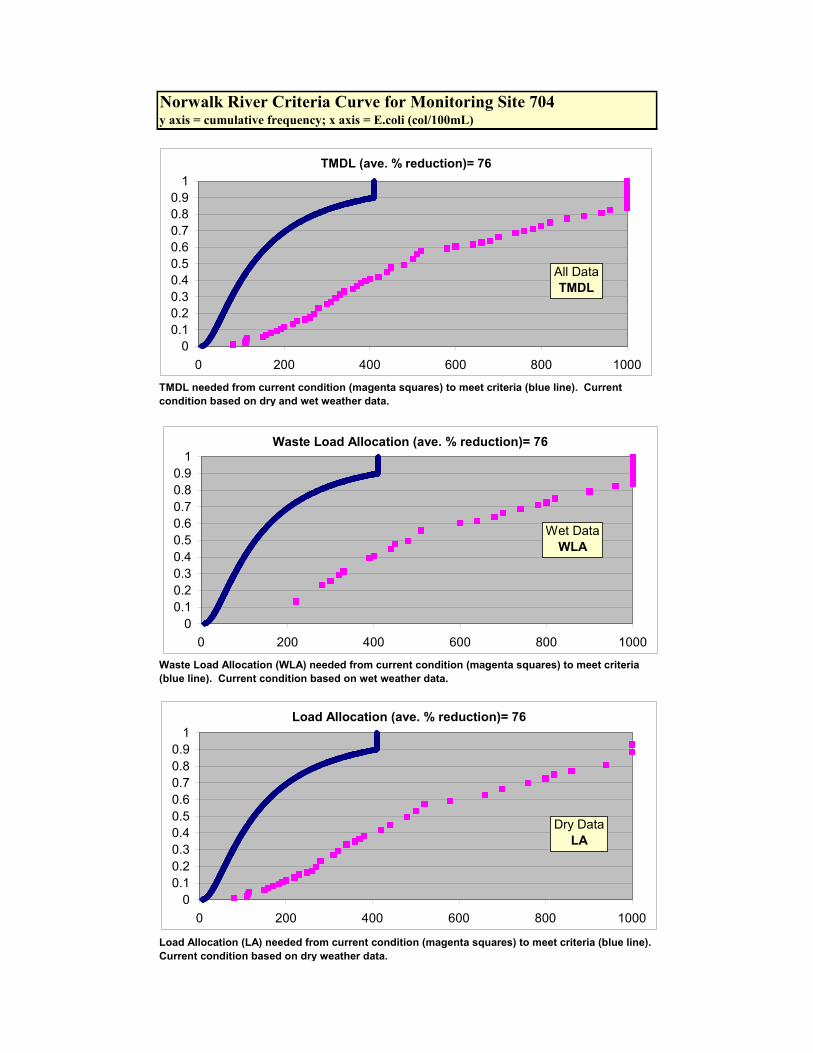
Norwalk River Criteria Curve for Monitoring Site 704y axis = cumulative frequency; x axis = E.coli (col/100mL)
TMDL needed from current condition (magenta squares) to meet criteria (blue line). Current condition based on dry and wet weather data.
Load Allocation (LA) needed from current condition (magenta squares) to meet criteria (blue line). Current condition based on dry weather data.
Waste Load Allocation (WLA) needed from current condition (magenta squares) to meet criteria (blue line). Current condition based on wet weather data.
TMDL (ave. % reduction)= 76
00.10.20.30.40.50.60.70.80.9
1
0 200 400 600 800 1000
Waste Load Allocation (ave. % reduction)= 76
00.10.20.30.40.50.60.70.80.9
1
0 200 400 600 800 1000
Load Allocation (ave. % reduction)= 76
00.10.20.30.40.50.60.70.80.9
1
0 200 400 600 800 1000
All DataTMDL
Wet DataWLA
Dry DataLA
Data Used in the Analysis
Monitoring Site:
Date Precip.(in)1 Condition2 E. coli Rank Proportion Criteria %24h 48h 96h (WET/DRY) (col./100 ml) Value Reduction
5/4/00 0.00 0.00 0.12 DRY 23 1.0 0.0115 16 335/11/00 0.03 0.32 0.36 WET 320 50.0 0.5747 150 53 # Samples DRY 525/18/00 0.54 0.54 0.54 WET 1300 81.0 0.9310 410 68 # Samples WET 355/25/00 0.04 1.17 1.32 WET 160 19.0 0.2184 62 62 # Samples Total 876/1/00 0.00 0.00 0.00 DRY 400 58.0 0.6667 187 536/8/00 0.00 0.40 3.23 WET 800 74.5 0.8563 336 58 Geomean 3116/15/00 0.00 0.01 0.08 DRY 132 14.0 0.1609 51 62 Log std deviation 0.47686/22/00 0.05 0.05 0.06 DRY 204 33.5 0.3851 96 536/29/00 0.01 0.03 0.36 DRY 240 40.0 0.4598 115 52 Avg % Reduction7/6/00 0.00 0.00 0.10 DRY 160 19.0 0.2184 62 627/13/00 0.00 0.00 0.07 DRY 200 30.0 0.3448 87 56 Wet (WLA) 607/20/00 0.00 0.06 0.06 DRY 176 24.5 0.2816 74 58 Dry (LA) 567/27/00 0.64 3.32 3.32 WET 1600 84.0 0.9655 410 74 Total (TMDL) 588/1/00 0.73 0.78 1.79 WET 576 71.0 0.8161 289 508/3/00 0.70 1.01 1.69 WET 100000 87.0 1.0000 410 1008/17/00 0.00 0.11 0.86 DRY 260 44.0 0.5057 128 518/24/00 0.00 0.21 0.21 DRY 220 36.5 0.4195 105 528/31/00 0.00 0.00 0.00 DRY 192 27.0 0.3103 80 589/7/00 0.00 0.00 0.01 DRY 224 38.0 0.4368 109 519/14/00 0.00 0.78 0.78 WET 300 48.5 0.5575 144 529/21/00 0.00 0.00 2.21 WET 460 62.5 0.7184 215 539/28/00 0.00 0.00 0.49 DRY 104 11.0 0.1264 44 585/10/01 0.00 0.00 0.00 DRY 240 40.0 0.4598 115 525/24/01 0.06 0.51 1.86 WET 560 70.0 0.8046 278 506/5/01 0.00 0.00 1.04 DRY 240 40.0 0.4598 115 526/21/01 0.28 0.29 0.29 WET 290 47.0 0.5402 138 527/5/01 0.33 0.51 0.51 WET 370 53.0 0.6092 163 567/19/01 0.00 0.13 0.29 DRY 250 42.0 0.4828 121 528/2/01 0.00 0.00 0.00 DRY 260 44.0 0.5057 128 518/23/01 0.69 0.69 1.36 WET 260 44.0 0.5057 128 519/13/01 0.00 0.00 0.06 DRY 200 30.0 0.3448 87 569/27/01 0.00 0.00 0.44 DRY 180 26.0 0.2989 77 576/6/02 1.42 1.64 1.64 WET 470 64.0 0.7356 225 526/13/02 0.00 1.07 1.07 WET 920 79.0 0.9080 410 556/20/02 0.00 0.00 0.01 DRY 100 10.0 0.1149 42 586/27/02 0.46 0.70 0.70 WET 380 54.5 0.6264 170 557/2/02 0.00 0.00 0.00 DRY 500 66.0 0.7586 240 527/11/02 0.00 0.00 0.39 DRY 380 54.5 0.6264 170 557/18/02 0.00 0.00 0.00 DRY 216 35.0 0.4023 100 547/25/02 0.00 0.00 0.45 DRY 176 24.5 0.2816 74 588/1/02 0.00 0.00 0.00 DRY 400 58.0 0.6667 187 538/8/02 0.00 0.00 0.00 DRY 640 73.0 0.8391 314 518/15/02 0.00 0.00 0.00 DRY 96 9.0 0.1034 39 598/22/02 0.01 0.01 0.32 DRY 400 58.0 0.6667 187 539/5/02 0.00 1.10 5.64 WET 142 15.0 0.1724 53 639/12/02 0.00 0.00 0.00 DRY 108 12.0 0.1379 46 579/19/02 0.02 0.02 1.26 DRY 88 7.5 0.0862 36 599/26/02 0.23 0.23 0.23 WET 60 2.0 0.0230 20 675/1/03 0.07 0.07 0.11 DRY 76 5.0 0.0575 29 615/8/03 0.65 0.65 0.68 WET 480 65.0 0.7471 233 525/15/03 0.00 0.00 0.00 DRY 88 7.5 0.0862 36 595/22/03 0.16 0.30 0.30 WET 166 22.0 0.2529 68 596/5/03 0.00 2.66 2.71 WET 200 30.0 0.3448 87 566/12/03 0.53 0.54 0.54 WET 82 6.0 0.0690 32 616/19/03 0.00 0.82 0.82 WET 300 48.5 0.5575 144 526/26/03 0.00 0.00 0.00 DRY 64 3.0 0.0345 24 63
Norwalk RiverCT7300-00_01
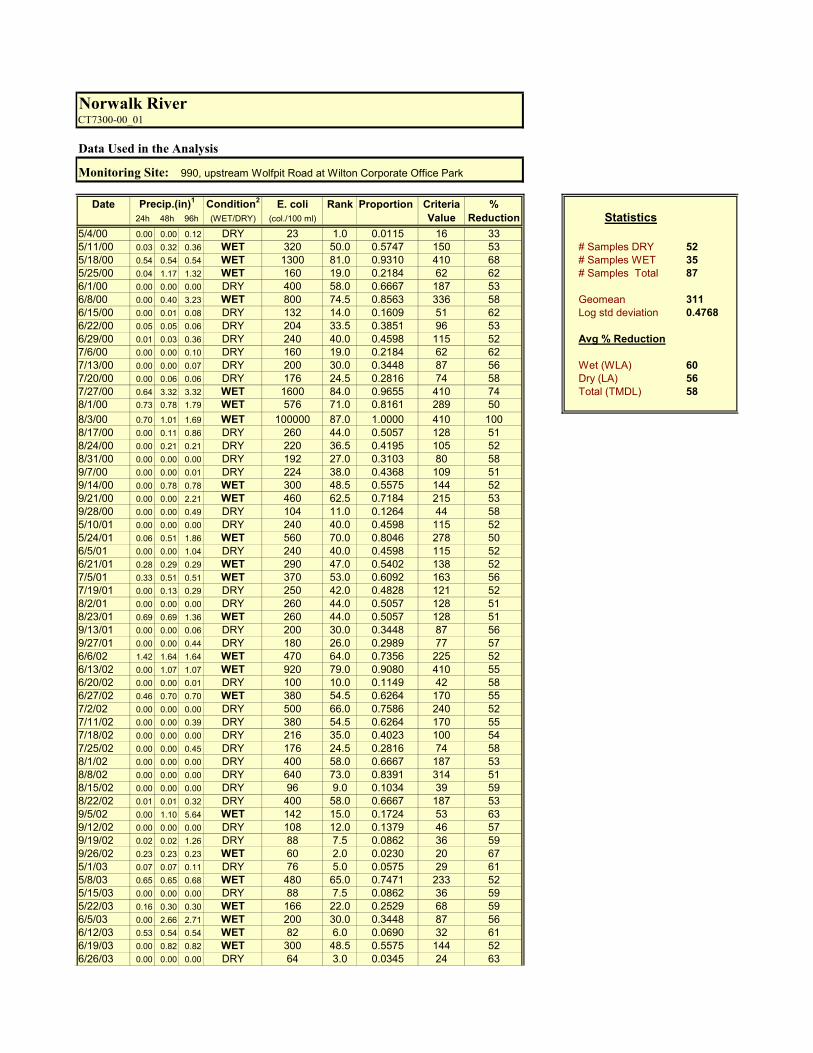
990, upstream Wolfpit Road at Wilton Corporate Office Park
Statistics

7/10/03 0.06 0.25 0.33 WET 280 46.0 0.5287 135 527/17/03 0.00 0.02 0.02 DRY 1500 82.0 0.9425 410 737/24/03 0.00 0.19 0.82 DRY 540 69.0 0.7931 267 507/31/03 0.00 0.00 0.07 DRY 164 21.0 0.2414 66 608/7/03 0.22 0.26 1.71 WET 160 19.0 0.2184 62 628/14/03 0.00 0.00 0.44 DRY 880 78.0 0.8966 403 548/28/03 0.00 0.00 0.00 DRY 148 16.5 0.1897 56 629/4/03 0.09 0.42 2.16 WET 800 74.5 0.8563 336 589/11/03 0.00 0.00 0.00 DRY 148 16.5 0.1897 56 629/18/03 0.00 0.00 0.68 DRY 220 36.5 0.4195 105 529/25/03 0.00 0.00 1.76 DRY 200 30.0 0.3448 87 565/6/04 0.00 0.13 0.51 DRY 74 4.0 0.0460 27 645/13/04 0.00 0.06 0.33 DRY 130 13.0 0.1494 48 635/20/04 0.00 0.01 0.02 DRY 340 51.0 0.5862 154 555/27/04 1.03 1.07 1.09 WET 860 77.0 0.8851 381 566/3/04 0.00 0.48 1.06 WET 520 67.5 0.7759 253 516/10/04 0.27 0.27 0.27 WET 420 58.0 0.6667 187 556/17/04 0.31 0.31 0.40 WET 460 62.5 0.7184 215 536/24/04 0.00 0.00 0.15 DRY 600 72.0 0.8276 301 507/8/04 0.00 0.00 1.10 DRY 440 61.0 0.7011 205 537/15/04 0.00 0.05 2.77 WET 520 67.5 0.7759 253 517/22/04 0.00 0.00 0.00 DRY 820 76.0 0.8736 361 567/29/04 0.00 0.21 1.40 DRY 360 52.0 0.5977 158 568/5/04 0.87 0.93 0.93 WET 3100 85.0 0.9770 410 878/12/04 0.01 0.50 0.50 WET 1580 83.0 0.9540 410 748/19/04 0.00 0.00 1.58 DRY 200 30.0 0.3448 87 568/26/04 0.00 0.00 0.00 DRY 168 23.0 0.2644 71 589/9/04 0.19 4.09 4.09 WET 5800 86.0 0.9885 410 939/16/04 0.00 0.08 0.08 DRY 420 58.0 0.6667 187 559/23/04 0.00 0.00 0.00 DRY 204 33.5 0.3851 96 539/30/04 0.04 1.13 3.05 WET 1060 80.0 0.9195 410 61
Precipitation and E. coli data provided by the Norwalk Department of Health and Haborwatch/Riverwatch, respectively.WET Condition defined as greater than 0.1" precipitation in 24 hours or0.25" precipitation in 48 hours, or 2.0" precipitation in 96 hours.
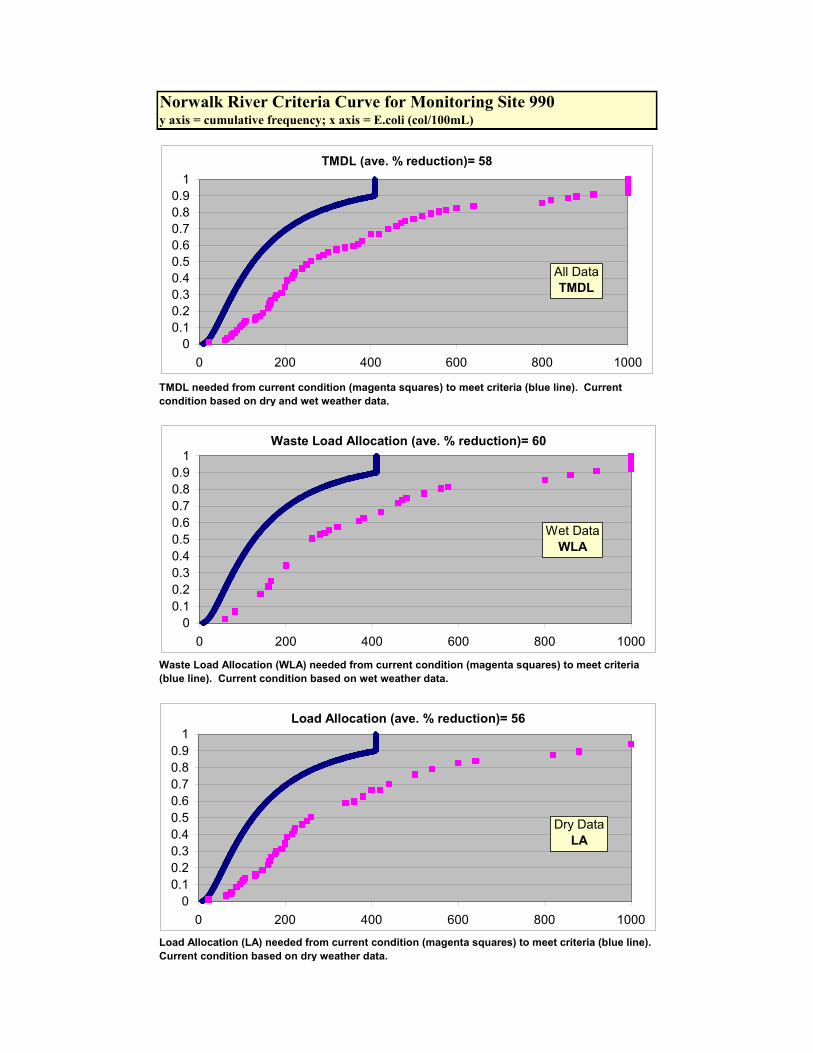
Norwalk River Criteria Curve for Monitoring Site 990y axis = cumulative frequency; x axis = E.coli (col/100mL)
TMDL needed from current condition (magenta squares) to meet criteria (blue line). Current condition based on dry and wet weather data.
Load Allocation (LA) needed from current condition (magenta squares) to meet criteria (blue line). Current condition based on dry weather data.
Waste Load Allocation (WLA) needed from current condition (magenta squares) to meet criteria (blue line). Current condition based on wet weather data.
TMDL (ave. % reduction)= 58
00.10.20.30.40.50.60.70.80.9
1
0 200 400 600 800 1000
Waste Load Allocation (ave. % reduction)= 60
00.10.20.30.40.50.60.70.80.9
1
0 200 400 600 800 1000
Load Allocation (ave. % reduction)= 56
00.10.20.30.40.50.60.70.80.9
1
0 200 400 600 800 1000
All DataTMDL
Wet DataWLA
Dry DataLA
Data Used in the Analysis
Monitoring Site:
Date Precip.(in)1 Condition2 E. coli Rank Proportion Criteria %24h 48h 96h (WET/DRY) (col./100 ml) Value Reduction
5/4/00 0.00 0.00 0.12 DRY 250 57.0 0.6552 182 275/11/00 0.03 0.32 0.36 WET 470 74.0 0.8506 328 30 # Samples DRY 525/18/00 0.54 0.54 0.54 WET 640 78.5 0.9023 415 35 # Samples WET 355/25/00 0.04 1.17 1.32 WET 106 20.0 0.2299 64 40 # Samples Total 876/1/00 0.00 0.00 0.00 DRY 74 10.0 0.1149 42 446/8/00 0.00 0.40 3.23 WET 980 81.0 0.9310 494 50 Geomean 2106/15/00 0.00 0.01 0.08 DRY 76 11.0 0.1264 44 42 Log std deviation 0.40556/22/00 0.05 0.05 0.06 DRY 236 54.0 0.6207 167 296/29/00 0.01 0.03 0.36 DRY 1460 84.0 0.9655 576 61 Avg % Reduction7/6/00 0.00 0.00 0.10 DRY 156 35.0 0.4023 100 367/13/00 0.00 0.00 0.07 DRY 60 6.5 0.0747 33 44 Wet (WLA) 387/20/00 0.00 0.06 0.06 DRY 108 21.0 0.2414 66 39 Dry (LA) 387/27/00 0.64 3.32 3.32 WET 1480 85.0 0.9770 576 61 Total (TMDL) 388/1/00 0.73 0.78 1.79 WET 900 80.0 0.9195 458 498/3/00 0.70 1.01 1.69 WET 210 48.0 0.5517 142 328/17/00 0.00 0.11 0.86 DRY 160 36.0 0.4138 103 368/24/00 0.00 0.21 0.21 DRY 360 67.5 0.7759 253 308/31/00 0.00 0.00 0.00 DRY 300 63.0 0.7241 218 279/7/00 0.00 0.00 0.01 DRY 92 14.0 0.1609 51 459/14/00 0.00 0.78 0.78 WET 540 77.0 0.8851 381 299/21/00 0.00 0.00 2.21 WET 420 71.0 0.8161 289 319/28/00 0.00 0.00 0.49 DRY 90 12.0 0.1379 46 495/10/01 0.00 0.00 0.00 DRY 56 5.0 0.0575 29 475/24/01 0.06 0.51 1.86 WET 280 60.0 0.6897 199 296/5/01 0.00 0.00 1.04 DRY 164 38.0 0.4368 109 346/21/01 0.28 0.29 0.29 WET 168 40.5 0.4655 116 317/5/01 0.33 0.51 0.51 WET 440 72.5 0.8333 307 307/19/01 0.00 0.13 0.29 DRY 164 38.0 0.4368 109 348/2/01 0.00 0.00 0.00 DRY 128 27.0 0.3103 80 388/23/01 0.69 0.69 1.36 WET 330 66.0 0.7586 240 279/13/01 0.00 0.00 0.06 DRY 150 34.0 0.3908 98 359/27/01 0.00 0.00 0.44 DRY 220 51.0 0.5862 154 306/6/02 1.42 1.64 1.64 WET 380 69.0 0.7931 267 306/13/02 0.00 1.07 1.07 WET 480 75.0 0.8621 344 286/20/02 0.00 0.00 0.01 DRY 100 18.0 0.2069 59 416/27/02 0.46 0.70 0.70 WET 224 52.0 0.5977 158 297/2/02 0.00 0.00 0.00 DRY 96 16.0 0.1839 55 437/11/02 0.00 0.00 0.39 DRY 168 40.5 0.4655 116 317/18/02 0.00 0.00 0.00 DRY 120 23.5 0.2701 72 407/25/02 0.00 0.00 0.45 DRY 232 53.0 0.6092 163 308/1/02 0.00 0.00 0.00 DRY 40 2.0 0.0230 20 508/8/02 0.00 0.00 0.00 DRY 72 9.0 0.1034 39 458/15/02 0.00 0.00 0.00 DRY 92 14.0 0.1609 51 458/22/02 0.01 0.01 0.32 DRY 164 38.0 0.4368 109 349/5/02 0.00 1.10 5.64 WET 144 30.0 0.3448 87 399/12/02 0.00 0.00 0.00 DRY 280 60.0 0.6897 199 299/19/02 0.02 0.02 1.26 DRY 144 30.0 0.3448 87 399/26/02 0.23 0.23 0.23 WET 92 14.0 0.1609 51 455/1/03 0.07 0.07 0.11 DRY 60 6.5 0.0747 33 445/8/03 0.65 0.65 0.68 WET 440 72.5 0.8333 307 305/15/03 0.00 0.00 0.00 DRY 54 4.0 0.0460 27 515/22/03 0.16 0.30 0.30 WET 126 26.0 0.2989 77 386/5/03 0.00 2.66 2.71 WET 280 60.0 0.6897 199 296/12/03 0.53 0.54 0.54 WET 100 18.0 0.2069 59 416/19/03 0.00 0.82 0.82 WET 200 45.5 0.5230 133 346/26/03 0.00 0.00 0.00 DRY 46 3.0 0.0345 24 497/10/03 0.06 0.25 0.33 WET 100 18.0 0.2069 59 417/17/03 0.00 0.02 0.02 DRY 640 78.5 0.9023 415 35
Norwalk RiverCT7300-00_02
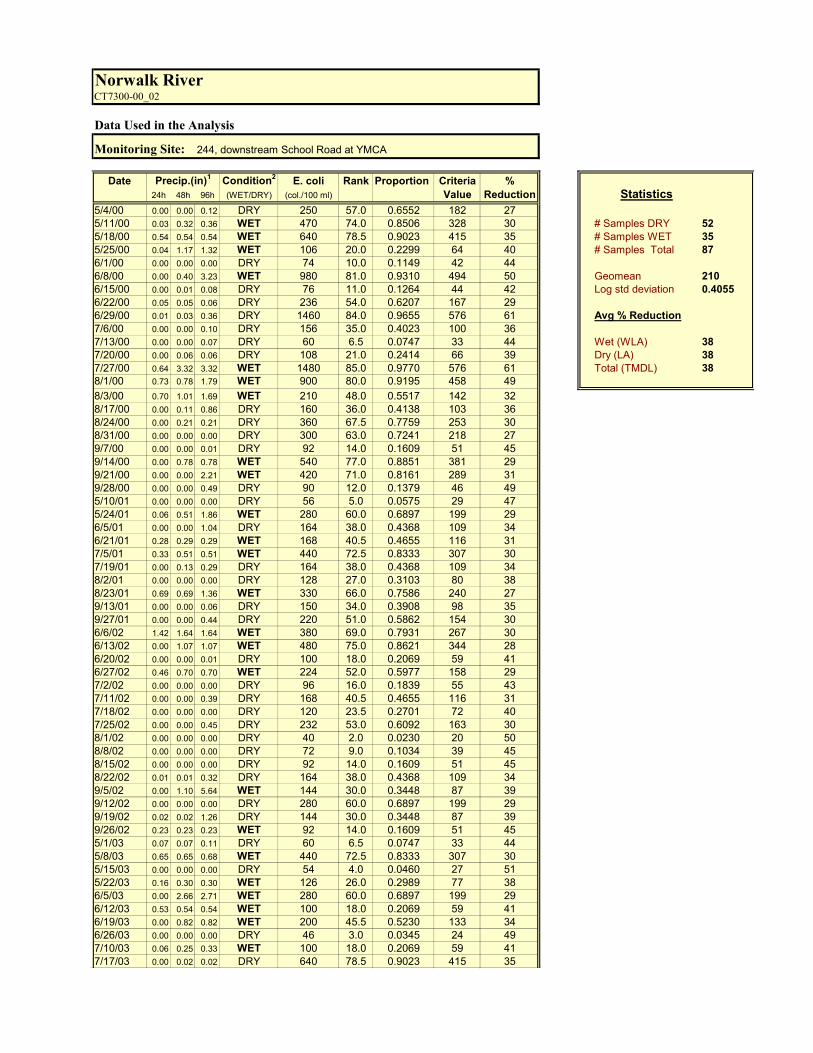
244, downstream School Road at YMCA
Statistics
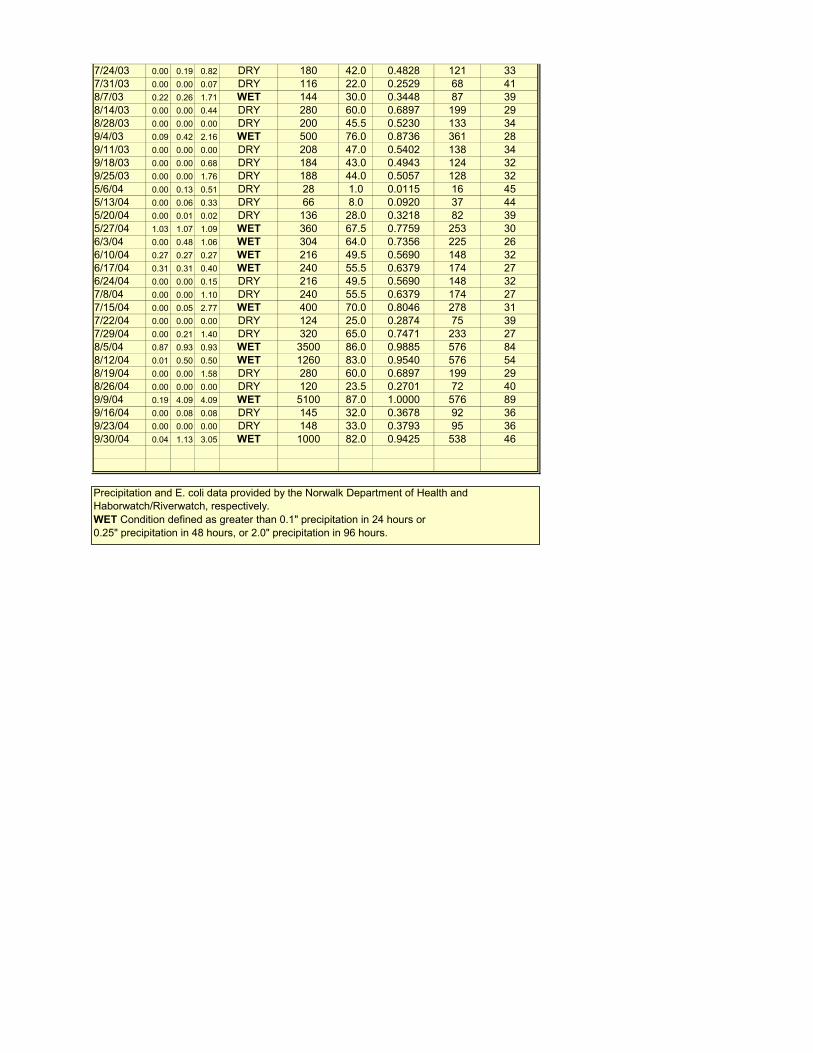
7/24/03 0.00 0.19 0.82 DRY 180 42.0 0.4828 121 337/31/03 0.00 0.00 0.07 DRY 116 22.0 0.2529 68 418/7/03 0.22 0.26 1.71 WET 144 30.0 0.3448 87 398/14/03 0.00 0.00 0.44 DRY 280 60.0 0.6897 199 298/28/03 0.00 0.00 0.00 DRY 200 45.5 0.5230 133 349/4/03 0.09 0.42 2.16 WET 500 76.0 0.8736 361 289/11/03 0.00 0.00 0.00 DRY 208 47.0 0.5402 138 349/18/03 0.00 0.00 0.68 DRY 184 43.0 0.4943 124 329/25/03 0.00 0.00 1.76 DRY 188 44.0 0.5057 128 325/6/04 0.00 0.13 0.51 DRY 28 1.0 0.0115 16 455/13/04 0.00 0.06 0.33 DRY 66 8.0 0.0920 37 445/20/04 0.00 0.01 0.02 DRY 136 28.0 0.3218 82 395/27/04 1.03 1.07 1.09 WET 360 67.5 0.7759 253 306/3/04 0.00 0.48 1.06 WET 304 64.0 0.7356 225 266/10/04 0.27 0.27 0.27 WET 216 49.5 0.5690 148 326/17/04 0.31 0.31 0.40 WET 240 55.5 0.6379 174 276/24/04 0.00 0.00 0.15 DRY 216 49.5 0.5690 148 327/8/04 0.00 0.00 1.10 DRY 240 55.5 0.6379 174 277/15/04 0.00 0.05 2.77 WET 400 70.0 0.8046 278 317/22/04 0.00 0.00 0.00 DRY 124 25.0 0.2874 75 397/29/04 0.00 0.21 1.40 DRY 320 65.0 0.7471 233 278/5/04 0.87 0.93 0.93 WET 3500 86.0 0.9885 576 848/12/04 0.01 0.50 0.50 WET 1260 83.0 0.9540 576 548/19/04 0.00 0.00 1.58 DRY 280 60.0 0.6897 199 298/26/04 0.00 0.00 0.00 DRY 120 23.5 0.2701 72 409/9/04 0.19 4.09 4.09 WET 5100 87.0 1.0000 576 899/16/04 0.00 0.08 0.08 DRY 145 32.0 0.3678 92 369/23/04 0.00 0.00 0.00 DRY 148 33.0 0.3793 95 369/30/04 0.04 1.13 3.05 WET 1000 82.0 0.9425 538 46
Precipitation and E. coli data provided by the Norwalk Department of Health and Haborwatch/Riverwatch, respectively.WET Condition defined as greater than 0.1" precipitation in 24 hours or0.25" precipitation in 48 hours, or 2.0" precipitation in 96 hours.
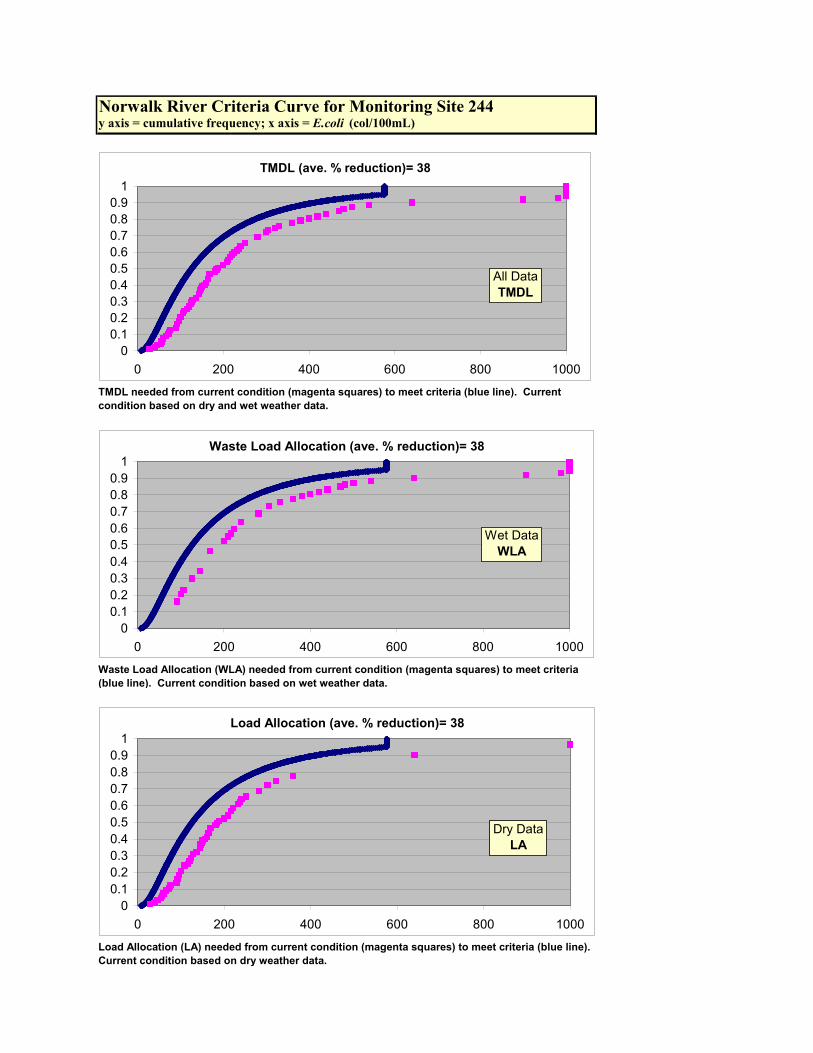
Norwalk River Criteria Curve for Monitoring Site 244y axis = cumulative frequency; x axis = E.coli (col/100mL)
TMDL needed from current condition (magenta squares) to meet criteria (blue line). Current condition based on dry and wet weather data.
Load Allocation (LA) needed from current condition (magenta squares) to meet criteria (blue line). Current condition based on dry weather data.
Waste Load Allocation (WLA) needed from current condition (magenta squares) to meet criteria (blue line). Current condition based on wet weather data.
TMDL (ave. % reduction)= 38
00.10.20.30.40.50.60.70.80.9
1
0 200 400 600 800 1000
Waste Load Allocation (ave. % reduction)= 38
00.10.20.30.40.50.60.70.80.9
1
0 200 400 600 800 1000
Load Allocation (ave. % reduction)= 38
00.10.20.30.40.50.60.70.80.9
1
0 200 400 600 800 1000
All DataTMDL
Wet DataWLA
Dry DataLA
Data Used in the Analysis
Monitoring Site:
Date Precip.(in)1 Condition2 E. coli Rank Proportion Criteria %24h 48h 96h (WET/DRY) (col./100 ml) Value Reduction
5/4/00 0.00 0.00 0.12 DRY 39 7.0 0.0805 35 115/11/00 0.03 0.32 0.36 WET 270 72.5 0.8333 307 0 # Samples DRY 525/18/00 0.54 0.54 0.54 WET 80 30.5 0.3506 88 0 # Samples WET 355/25/00 0.04 1.17 1.32 WET 112 47.0 0.5402 138 0 # Samples Total 876/1/00 0.00 0.00 0.00 DRY 44 8.0 0.0920 37 166/8/00 0.00 0.40 3.23 WET 1980 86.0 0.9885 576 71 Geomean 1216/15/00 0.00 0.01 0.08 DRY 90 38.0 0.4368 109 0 Log std deviation 0.42016/22/00 0.05 0.05 0.06 DRY 172 66.0 0.7586 240 06/29/00 0.01 0.03 0.36 DRY 220 68.5 0.7874 263 0 Avg % Reduction7/6/00 0.00 0.00 0.10 DRY 60 19.5 0.2241 63 07/13/00 0.00 0.00 0.07 DRY 68 22.0 0.2529 68 0 Wet (WLA) 97/20/00 0.00 0.06 0.06 DRY 76 27.5 0.3161 81 0 Dry (LA) 37/27/00 0.64 3.32 3.32 WET 1320 85.0 0.9770 576 56 Total (TMDL) 58/1/00 0.73 0.78 1.79 WET 270 72.5 0.8333 307 08/3/00 0.70 1.01 1.69 WET 160 63.0 0.7241 218 08/17/00 0.00 0.11 0.86 DRY 160 63.0 0.7241 218 08/24/00 0.00 0.21 0.21 DRY 130 55.0 0.6322 172 08/31/00 0.00 0.00 0.00 DRY 116 49.0 0.5632 146 09/7/00 0.00 0.00 0.01 DRY 52 14.0 0.1609 51 39/14/00 0.00 0.78 0.78 WET 160 63.0 0.7241 218 09/21/00 0.00 0.00 2.21 WET 460 81.0 0.9310 494 09/28/00 0.00 0.00 0.49 DRY 56 18.0 0.2069 59 05/10/01 0.00 0.00 0.00 DRY 72 23.5 0.2701 72 05/24/01 0.06 0.51 1.86 WET 380 79.0 0.9080 428 06/5/01 0.00 0.00 1.04 DRY 84 33.5 0.3851 96 06/21/01 0.28 0.29 0.29 WET 120 51.5 0.5920 156 07/5/01 0.33 0.51 0.51 WET 240 70.0 0.8046 278 07/19/01 0.00 0.13 0.29 DRY 88 36.5 0.4195 105 08/2/01 0.00 0.00 0.00 DRY 108 46.0 0.5287 135 08/23/01 0.69 0.69 1.36 WET 300 76.0 0.8736 361 09/13/01 0.00 0.00 0.06 DRY 72 23.5 0.2701 72 09/27/01 0.00 0.00 0.44 DRY 80 30.5 0.3506 88 06/6/02 1.42 1.64 1.64 WET 120 51.5 0.5920 156 06/13/02 0.00 1.07 1.07 WET 340 78.0 0.8966 403 06/20/02 0.00 0.00 0.01 DRY 84 33.5 0.3851 96 06/27/02 0.46 0.70 0.70 WET 148 59.5 0.6839 196 07/2/02 0.00 0.00 0.00 DRY 84 33.5 0.3851 96 07/11/02 0.00 0.00 0.39 DRY 52 14.0 0.1609 51 37/18/02 0.00 0.00 0.00 DRY 52 14.0 0.1609 51 37/25/02 0.00 0.00 0.45 DRY 132 56.0 0.6437 177 08/1/02 0.00 0.00 0.00 DRY 32 3.5 0.0402 25 218/8/02 0.00 0.00 0.00 DRY 148 59.5 0.6839 196 08/15/02 0.00 0.00 0.00 DRY 32 3.5 0.0402 25 218/22/02 0.01 0.01 0.32 DRY 100 43.0 0.4943 124 09/5/02 0.00 1.10 5.64 WET 128 54.0 0.6207 167 09/12/02 0.00 0.00 0.00 DRY 52 14.0 0.1609 51 39/19/02 0.02 0.02 1.26 DRY 48 10.0 0.1149 42 139/26/02 0.23 0.23 0.23 WET 27 2.0 0.0230 20 265/1/03 0.07 0.07 0.11 DRY 12 1.0 0.0115 16 05/8/03 0.65 0.65 0.68 WET 300 76.0 0.8736 361 05/15/03 0.00 0.00 0.00 DRY 34 5.0 0.0575 29 135/22/03 0.16 0.30 0.30 WET 54 17.0 0.1954 57 06/5/03 0.00 2.66 2.71 WET 430 80.0 0.9195 458 06/12/03 0.53 0.54 0.54 WET 96 41.5 0.4770 119 06/19/03 0.00 0.82 0.82 WET 260 71.0 0.8161 289 06/26/03 0.00 0.00 0.00 DRY 104 44.5 0.5115 129 07/10/03 0.06 0.25 0.33 WET 74 25.0 0.2874 75 07/17/03 0.00 0.02 0.02 DRY 300 76.0 0.8736 361 0
Statistics
Norwalk RiverCT7300-00_03
241, downstream of the Georgetown Wastewater Treatment Plant, upstream Old Mill Rd
7/24/03 0.00 0.19 0.82 DRY 160 63.0 0.7241 218 07/31/03 0.00 0.00 0.07 DRY 144 58.0 0.6667 187 08/7/03 0.22 0.26 1.71 WET 140 57.0 0.6552 182 08/14/03 0.00 0.00 0.44 DRY 116 49.0 0.5632 146 08/28/03 0.00 0.00 0.00 DRY 76 27.5 0.3161 81 09/4/03 0.09 0.42 2.16 WET 630 82.0 0.9425 538 159/11/03 0.00 0.00 0.00 DRY 92 39.5 0.4540 113 09/18/03 0.00 0.00 0.68 DRY 76 27.5 0.3161 81 09/25/03 0.00 0.00 1.76 DRY 200 67.0 0.7701 249 05/6/04 0.00 0.13 0.51 DRY 46 9.0 0.1034 39 145/13/04 0.00 0.06 0.33 DRY 36 6.0 0.0690 32 115/20/04 0.00 0.01 0.02 DRY 52 14.0 0.1609 51 35/27/04 1.03 1.07 1.09 WET 220 68.5 0.7874 263 06/3/04 0.00 0.48 1.06 WET 116 49.0 0.5632 146 06/10/04 0.27 0.27 0.27 WET 76 27.5 0.3161 81 06/17/04 0.31 0.31 0.40 WET 92 39.5 0.4540 113 06/24/04 0.00 0.00 0.15 DRY 96 41.5 0.4770 119 07/8/04 0.00 0.00 1.10 DRY 104 44.5 0.5115 129 07/15/04 0.00 0.05 2.77 WET 88 36.5 0.4195 105 07/22/04 0.00 0.00 0.00 DRY 64 21.0 0.2414 66 07/29/04 0.00 0.21 1.40 DRY 160 63.0 0.7241 218 08/5/04 0.87 0.93 0.93 WET 700 83.0 0.9540 576 188/12/04 0.01 0.50 0.50 WET 288 74.0 0.8506 328 08/19/04 0.00 0.00 1.58 DRY 84 33.5 0.3851 96 08/26/04 0.00 0.00 0.00 DRY 60 19.5 0.2241 63 09/9/04 0.19 4.09 4.09 WET 5700 87.0 1.0000 576 909/16/04 0.00 0.08 0.08 DRY 50 11.0 0.1264 44 129/23/04 0.00 0.00 0.00 DRY 124 53.0 0.6092 163 09/30/04 0.04 1.13 3.05 WET 1020 84.0 0.9655 576 44
Precipitation and E. coli data provided by the Norwalk Department of Health and Haborwatch/Riverwatch, respectively.WET Condition defined as greater than 0.1" precipitation in 24 hours or0.25" precipitation in 48 hours, or 2.0" precipitation in 96 hours.
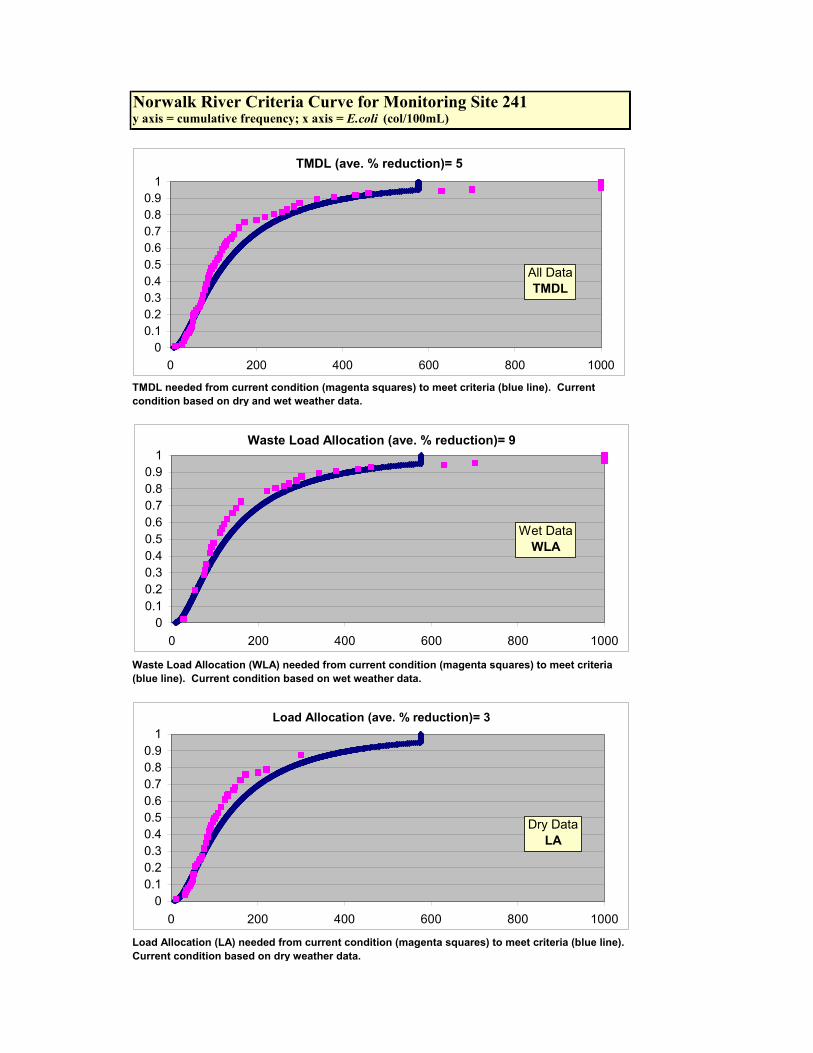
Norwalk River Criteria Curve for Monitoring Site 241y axis = cumulative frequency; x axis = E.coli (col/100mL)
TMDL needed from current condition (magenta squares) to meet criteria (blue line). Current condition based on dry and wet weather data.
Load Allocation (LA) needed from current condition (magenta squares) to meet criteria (blue line). Current condition based on dry weather data.
Waste Load Allocation (WLA) needed from current condition (magenta squares) to meet criteria (blue line). Current condition based on wet weather data.
TMDL (ave. % reduction)= 5
00.10.20.30.40.50.60.70.80.9
1
0 200 400 600 800 1000
Waste Load Allocation (ave. % reduction)= 9
00.10.20.30.40.50.60.70.80.9
1
0 200 400 600 800 1000
Load Allocation (ave. % reduction)= 3
00.10.20.30.40.50.60.70.80.9
1
0 200 400 600 800 1000
All DataTMDL
Wet DataWLA
Dry DataLA
Data Used in the Analysis
Monitoring Site:
Date Precip.(in)1 Condition2 E. coli Rank Proportion Criteria %24h 48h 96h (WET/DRY) (col./100 ml) Value Reduction
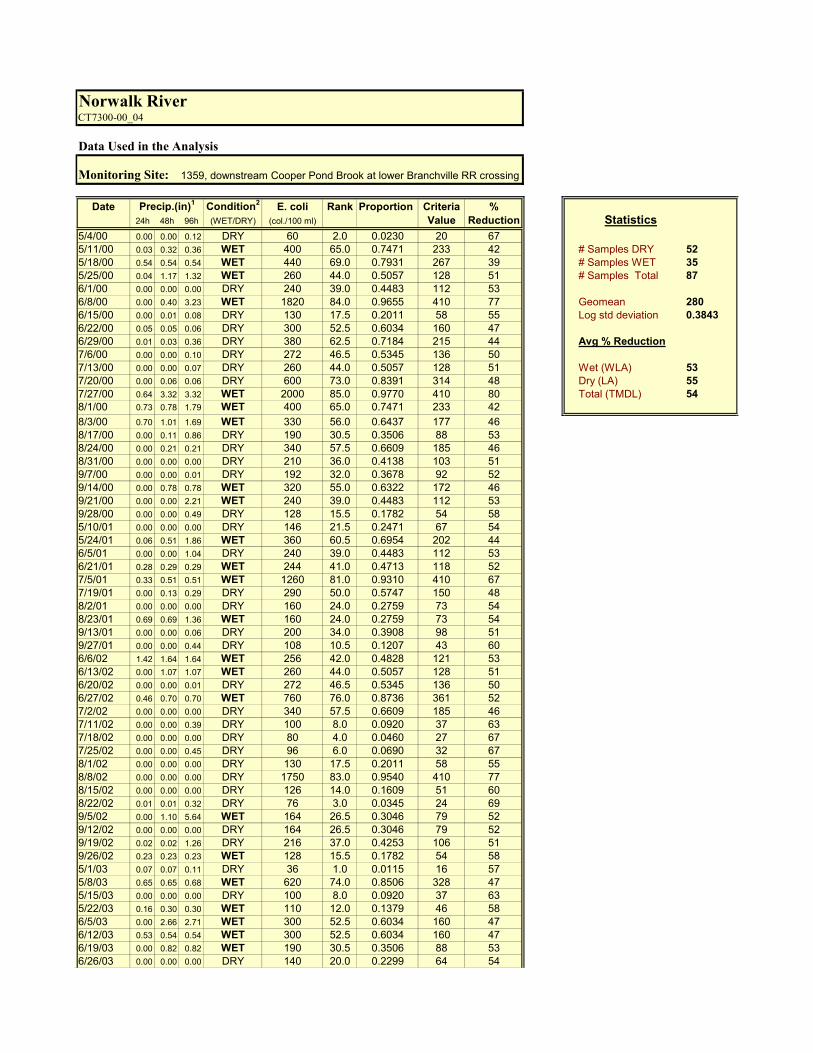
5/4/00 0.00 0.00 0.12 DRY 60 2.0 0.0230 20 675/11/00 0.03 0.32 0.36 WET 400 65.0 0.7471 233 42 # Samples DRY 525/18/00 0.54 0.54 0.54 WET 440 69.0 0.7931 267 39 # Samples WET 355/25/00 0.04 1.17 1.32 WET 260 44.0 0.5057 128 51 # Samples Total 876/1/00 0.00 0.00 0.00 DRY 240 39.0 0.4483 112 536/8/00 0.00 0.40 3.23 WET 1820 84.0 0.9655 410 77 Geomean 2806/15/00 0.00 0.01 0.08 DRY 130 17.5 0.2011 58 55 Log std deviation 0.38436/22/00 0.05 0.05 0.06 DRY 300 52.5 0.6034 160 476/29/00 0.01 0.03 0.36 DRY 380 62.5 0.7184 215 44 Avg % Reduction7/6/00 0.00 0.00 0.10 DRY 272 46.5 0.5345 136 507/13/00 0.00 0.00 0.07 DRY 260 44.0 0.5057 128 51 Wet (WLA) 537/20/00 0.00 0.06 0.06 DRY 600 73.0 0.8391 314 48 Dry (LA) 557/27/00 0.64 3.32 3.32 WET 2000 85.0 0.9770 410 80 Total (TMDL) 548/1/00 0.73 0.78 1.79 WET 400 65.0 0.7471 233 428/3/00 0.70 1.01 1.69 WET 330 56.0 0.6437 177 468/17/00 0.00 0.11 0.86 DRY 190 30.5 0.3506 88 538/24/00 0.00 0.21 0.21 DRY 340 57.5 0.6609 185 468/31/00 0.00 0.00 0.00 DRY 210 36.0 0.4138 103 519/7/00 0.00 0.00 0.01 DRY 192 32.0 0.3678 92 529/14/00 0.00 0.78 0.78 WET 320 55.0 0.6322 172 469/21/00 0.00 0.00 2.21 WET 240 39.0 0.4483 112 539/28/00 0.00 0.00 0.49 DRY 128 15.5 0.1782 54 585/10/01 0.00 0.00 0.00 DRY 146 21.5 0.2471 67 545/24/01 0.06 0.51 1.86 WET 360 60.5 0.6954 202 446/5/01 0.00 0.00 1.04 DRY 240 39.0 0.4483 112 536/21/01 0.28 0.29 0.29 WET 244 41.0 0.4713 118 527/5/01 0.33 0.51 0.51 WET 1260 81.0 0.9310 410 677/19/01 0.00 0.13 0.29 DRY 290 50.0 0.5747 150 488/2/01 0.00 0.00 0.00 DRY 160 24.0 0.2759 73 548/23/01 0.69 0.69 1.36 WET 160 24.0 0.2759 73 549/13/01 0.00 0.00 0.06 DRY 200 34.0 0.3908 98 519/27/01 0.00 0.00 0.44 DRY 108 10.5 0.1207 43 606/6/02 1.42 1.64 1.64 WET 256 42.0 0.4828 121 536/13/02 0.00 1.07 1.07 WET 260 44.0 0.5057 128 516/20/02 0.00 0.00 0.01 DRY 272 46.5 0.5345 136 506/27/02 0.46 0.70 0.70 WET 760 76.0 0.8736 361 527/2/02 0.00 0.00 0.00 DRY 340 57.5 0.6609 185 467/11/02 0.00 0.00 0.39 DRY 100 8.0 0.0920 37 637/18/02 0.00 0.00 0.00 DRY 80 4.0 0.0460 27 677/25/02 0.00 0.00 0.45 DRY 96 6.0 0.0690 32 678/1/02 0.00 0.00 0.00 DRY 130 17.5 0.2011 58 558/8/02 0.00 0.00 0.00 DRY 1750 83.0 0.9540 410 778/15/02 0.00 0.00 0.00 DRY 126 14.0 0.1609 51 608/22/02 0.01 0.01 0.32 DRY 76 3.0 0.0345 24 699/5/02 0.00 1.10 5.64 WET 164 26.5 0.3046 79 529/12/02 0.00 0.00 0.00 DRY 164 26.5 0.3046 79 529/19/02 0.02 0.02 1.26 DRY 216 37.0 0.4253 106 519/26/02 0.23 0.23 0.23 WET 128 15.5 0.1782 54 585/1/03 0.07 0.07 0.11 DRY 36 1.0 0.0115 16 575/8/03 0.65 0.65 0.68 WET 620 74.0 0.8506 328 475/15/03 0.00 0.00 0.00 DRY 100 8.0 0.0920 37 635/22/03 0.16 0.30 0.30 WET 110 12.0 0.1379 46 586/5/03 0.00 2.66 2.71 WET 300 52.5 0.6034 160 476/12/03 0.53 0.54 0.54 WET 300 52.5 0.6034 160 476/19/03 0.00 0.82 0.82 WET 190 30.5 0.3506 88 536/26/03 0.00 0.00 0.00 DRY 140 20.0 0.2299 64 54
Norwalk RiverCT7300-00_04
1359, downstream Cooper Pond Brook at lower Branchville RR crossing
Statistics

7/10/03 0.06 0.25 0.33 WET 350 59.0 0.6782 193 457/17/03 0.00 0.02 0.02 DRY 1500 82.0 0.9425 410 737/24/03 0.00 0.19 0.82 DRY 280 48.5 0.5575 144 497/31/03 0.00 0.00 0.07 DRY 360 60.5 0.6954 202 448/7/03 0.22 0.26 1.71 WET 160 24.0 0.2759 73 548/14/03 0.00 0.00 0.44 DRY 1080 79.0 0.9080 410 628/28/03 0.00 0.00 0.00 DRY 280 48.5 0.5575 144 499/4/03 0.09 0.42 2.16 WET 430 68.0 0.7816 258 409/11/03 0.00 0.00 0.00 DRY 300 52.5 0.6034 160 479/18/03 0.00 0.00 0.68 DRY 100 8.0 0.0920 37 639/25/03 0.00 0.00 1.76 DRY 200 34.0 0.3908 98 515/6/04 0.00 0.13 0.51 DRY 92 5.0 0.0575 29 685/13/04 0.00 0.06 0.33 DRY 146 21.5 0.2471 67 545/20/04 0.00 0.01 0.02 DRY 560 70.5 0.8103 283 495/27/04 1.03 1.07 1.09 WET 580 72.0 0.8276 301 486/3/04 0.00 0.48 1.06 WET 168 28.0 0.3218 82 516/10/04 0.27 0.27 0.27 WET 380 62.5 0.7184 215 446/17/04 0.31 0.31 0.40 WET 780 77.0 0.8851 381 516/24/04 0.00 0.00 0.15 DRY 560 70.5 0.8103 283 497/8/04 0.00 0.00 1.10 DRY 1220 80.0 0.9195 410 667/15/04 0.00 0.05 2.77 WET 400 65.0 0.7471 233 427/22/04 0.00 0.00 0.00 DRY 420 67.0 0.7701 249 417/29/04 0.00 0.21 1.40 DRY 200 34.0 0.3908 98 518/5/04 0.87 0.93 0.93 WET 2700 86.0 0.9885 410 858/12/04 0.01 0.50 0.50 WET 688 75.0 0.8621 344 508/19/04 0.00 0.00 1.58 DRY 136 19.0 0.2184 62 558/26/04 0.00 0.00 0.00 DRY 108 10.5 0.1207 43 609/9/04 0.19 4.09 4.09 WET 4000 87.0 1.0000 410 909/16/04 0.00 0.08 0.08 DRY 175 29.0 0.3333 85 529/23/04 0.00 0.00 0.00 DRY 120 13.0 0.1494 48 609/30/04 0.04 1.13 3.05 WET 980 78.0 0.8966 403 59
Precipitation and E. coli data provided by the Norwalk Department of Health and Haborwatch/Riverwatch, respectively.WET Condition defined as greater than 0.1" precipitation in 24 hours or0.25" precipitation in 48 hours, or 2.0" precipitation in 96 hours.
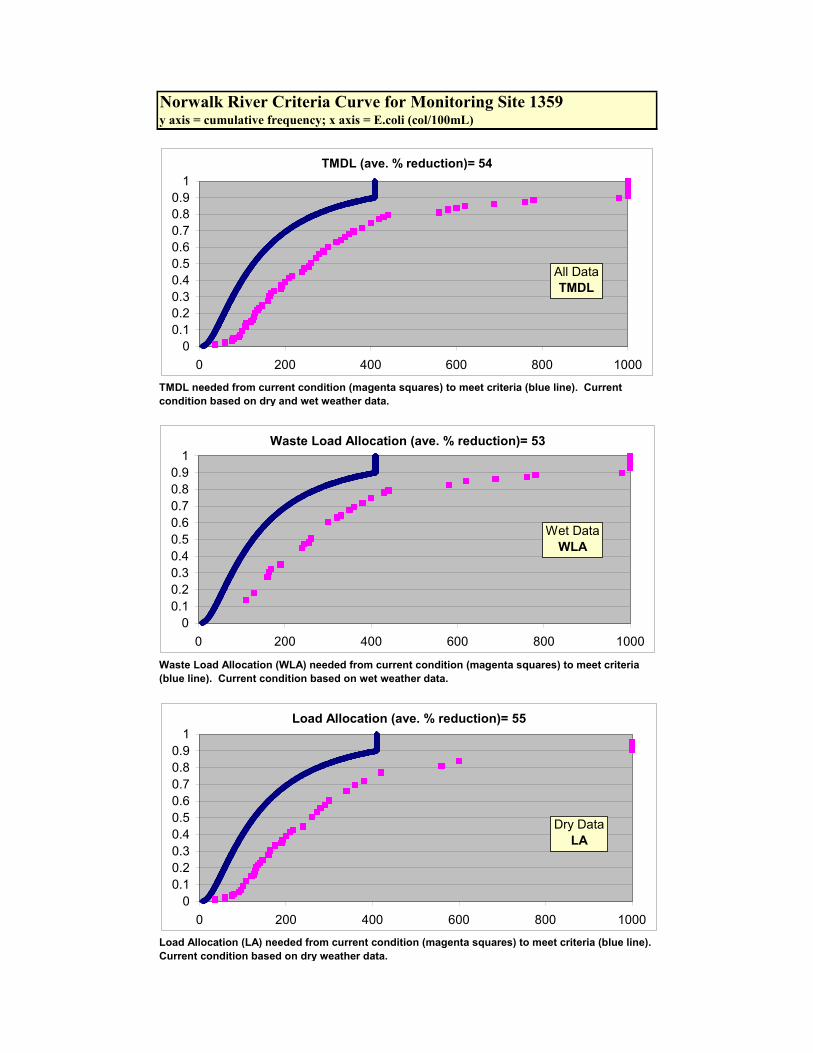
Norwalk River Criteria Curve for Monitoring Site 1359y axis = cumulative frequency; x axis = E.coli (col/100mL)
TMDL needed from current condition (magenta squares) to meet criteria (blue line). Current condition based on dry and wet weather data.
Load Allocation (LA) needed from current condition (magenta squares) to meet criteria (blue line). Current condition based on dry weather data.
Waste Load Allocation (WLA) needed from current condition (magenta squares) to meet criteria (blue line). Current condition based on wet weather data.
TMDL (ave. % reduction)= 54
00.10.20.30.40.50.60.70.80.9
1
0 200 400 600 800 1000
Waste Load Allocation (ave. % reduction)= 53
00.10.20.30.40.50.60.70.80.9
1
0 200 400 600 800 1000
Load Allocation (ave. % reduction)= 55
00.10.20.30.40.50.60.70.80.9
1
0 200 400 600 800 1000
All DataTMDL
Wet DataWLA
Dry DataLA
Data Used in the Analysis
Monitoring Site:
Date Precip.(in)1 Condition2 E. coli Rank Proportion Criteria %24h 48h 96h (WET/DRY) (col./100 ml) Value Reduction
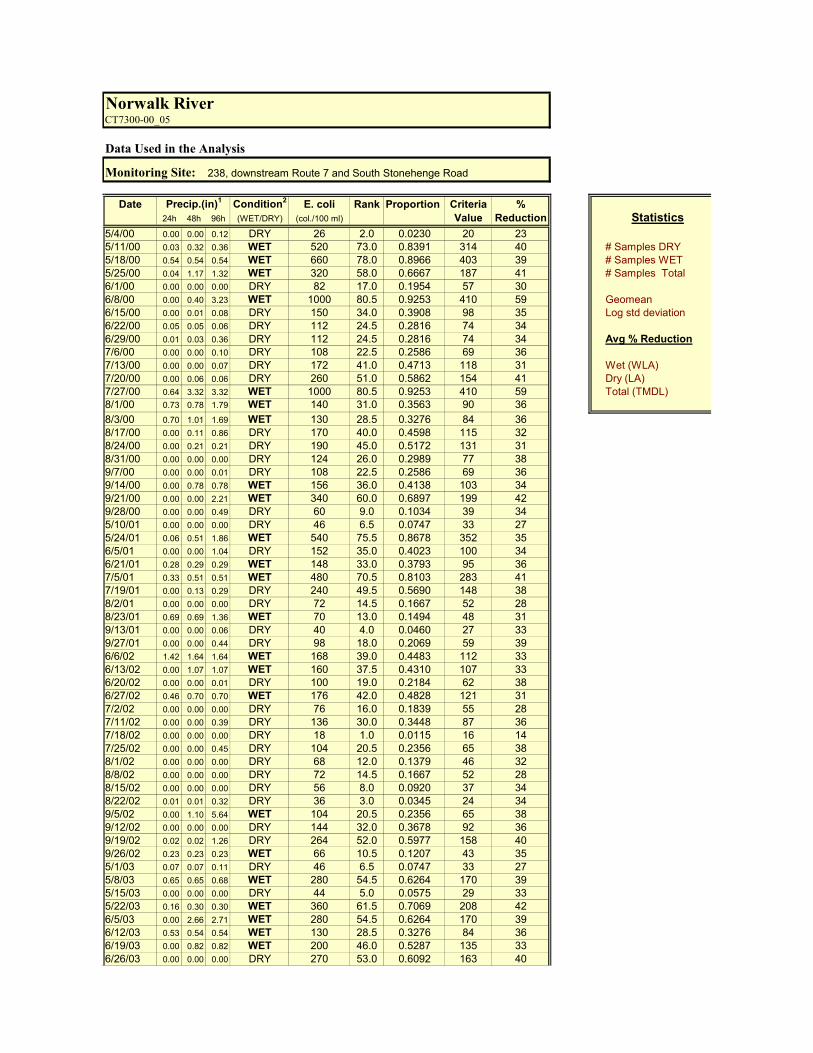
5/4/00 0.00 0.00 0.12 DRY 26 2.0 0.0230 20 235/11/00 0.03 0.32 0.36 WET 520 73.0 0.8391 314 40 # Samples DRY5/18/00 0.54 0.54 0.54 WET 660 78.0 0.8966 403 39 # Samples WET5/25/00 0.04 1.17 1.32 WET 320 58.0 0.6667 187 41 # Samples Total6/1/00 0.00 0.00 0.00 DRY 82 17.0 0.1954 57 306/8/00 0.00 0.40 3.23 WET 1000 80.5 0.9253 410 59 Geomean6/15/00 0.00 0.01 0.08 DRY 150 34.0 0.3908 98 35 Log std deviation6/22/00 0.05 0.05 0.06 DRY 112 24.5 0.2816 74 346/29/00 0.01 0.03 0.36 DRY 112 24.5 0.2816 74 34 Avg % Reduction7/6/00 0.00 0.00 0.10 DRY 108 22.5 0.2586 69 367/13/00 0.00 0.00 0.07 DRY 172 41.0 0.4713 118 31 Wet (WLA)7/20/00 0.00 0.06 0.06 DRY 260 51.0 0.5862 154 41 Dry (LA)7/27/00 0.64 3.32 3.32 WET 1000 80.5 0.9253 410 59 Total (TMDL)8/1/00 0.73 0.78 1.79 WET 140 31.0 0.3563 90 368/3/00 0.70 1.01 1.69 WET 130 28.5 0.3276 84 368/17/00 0.00 0.11 0.86 DRY 170 40.0 0.4598 115 328/24/00 0.00 0.21 0.21 DRY 190 45.0 0.5172 131 318/31/00 0.00 0.00 0.00 DRY 124 26.0 0.2989 77 389/7/00 0.00 0.00 0.01 DRY 108 22.5 0.2586 69 369/14/00 0.00 0.78 0.78 WET 156 36.0 0.4138 103 349/21/00 0.00 0.00 2.21 WET 340 60.0 0.6897 199 429/28/00 0.00 0.00 0.49 DRY 60 9.0 0.1034 39 345/10/01 0.00 0.00 0.00 DRY 46 6.5 0.0747 33 275/24/01 0.06 0.51 1.86 WET 540 75.5 0.8678 352 356/5/01 0.00 0.00 1.04 DRY 152 35.0 0.4023 100 346/21/01 0.28 0.29 0.29 WET 148 33.0 0.3793 95 367/5/01 0.33 0.51 0.51 WET 480 70.5 0.8103 283 417/19/01 0.00 0.13 0.29 DRY 240 49.5 0.5690 148 388/2/01 0.00 0.00 0.00 DRY 72 14.5 0.1667 52 288/23/01 0.69 0.69 1.36 WET 70 13.0 0.1494 48 319/13/01 0.00 0.00 0.06 DRY 40 4.0 0.0460 27 339/27/01 0.00 0.00 0.44 DRY 98 18.0 0.2069 59 396/6/02 1.42 1.64 1.64 WET 168 39.0 0.4483 112 336/13/02 0.00 1.07 1.07 WET 160 37.5 0.4310 107 336/20/02 0.00 0.00 0.01 DRY 100 19.0 0.2184 62 386/27/02 0.46 0.70 0.70 WET 176 42.0 0.4828 121 317/2/02 0.00 0.00 0.00 DRY 76 16.0 0.1839 55 287/11/02 0.00 0.00 0.39 DRY 136 30.0 0.3448 87 367/18/02 0.00 0.00 0.00 DRY 18 1.0 0.0115 16 147/25/02 0.00 0.00 0.45 DRY 104 20.5 0.2356 65 388/1/02 0.00 0.00 0.00 DRY 68 12.0 0.1379 46 328/8/02 0.00 0.00 0.00 DRY 72 14.5 0.1667 52 288/15/02 0.00 0.00 0.00 DRY 56 8.0 0.0920 37 348/22/02 0.01 0.01 0.32 DRY 36 3.0 0.0345 24 349/5/02 0.00 1.10 5.64 WET 104 20.5 0.2356 65 389/12/02 0.00 0.00 0.00 DRY 144 32.0 0.3678 92 369/19/02 0.02 0.02 1.26 DRY 264 52.0 0.5977 158 409/26/02 0.23 0.23 0.23 WET 66 10.5 0.1207 43 355/1/03 0.07 0.07 0.11 DRY 46 6.5 0.0747 33 275/8/03 0.65 0.65 0.68 WET 280 54.5 0.6264 170 395/15/03 0.00 0.00 0.00 DRY 44 5.0 0.0575 29 335/22/03 0.16 0.30 0.30 WET 360 61.5 0.7069 208 426/5/03 0.00 2.66 2.71 WET 280 54.5 0.6264 170 396/12/03 0.53 0.54 0.54 WET 130 28.5 0.3276 84 366/19/03 0.00 0.82 0.82 WET 200 46.0 0.5287 135 336/26/03 0.00 0.00 0.00 DRY 270 53.0 0.6092 163 40
Norwalk RiverCT7300-00_05
238, downstream Route 7 and South Stonehenge Road
Statistics

7/10/03 0.06 0.25 0.33 WET 180 43.5 0.5000 126 307/17/03 0.00 0.02 0.02 DRY 1600 84.0 0.9655 410 747/24/03 0.00 0.19 0.82 DRY 180 43.5 0.5000 126 307/31/03 0.00 0.00 0.07 DRY 204 47.0 0.5402 138 328/7/03 0.22 0.26 1.71 WET 160 37.5 0.4310 107 338/14/03 0.00 0.00 0.44 DRY 1040 82.0 0.9425 410 618/28/03 0.00 0.00 0.00 DRY 320 58.0 0.6667 187 419/4/03 0.09 0.42 2.16 WET 410 66.0 0.7586 240 419/11/03 0.00 0.00 0.00 DRY 300 56.0 0.6437 177 419/18/03 0.00 0.00 0.68 DRY 240 49.5 0.5690 148 389/25/03 0.00 0.00 1.76 DRY 224 48.0 0.5517 142 375/6/04 0.00 0.13 0.51 DRY 66 10.5 0.1207 43 355/13/04 0.00 0.06 0.33 DRY 320 58.0 0.6667 187 415/20/04 0.00 0.01 0.02 DRY 440 69.0 0.7931 267 395/27/04 1.03 1.07 1.09 WET 540 75.5 0.8678 352 356/3/04 0.00 0.48 1.06 WET 400 65.0 0.7471 233 426/10/04 0.27 0.27 0.27 WET 560 77.0 0.8851 381 326/17/04 0.31 0.31 0.40 WET 520 73.0 0.8391 314 406/24/04 0.00 0.00 0.15 DRY 520 73.0 0.8391 314 407/8/04 0.00 0.00 1.10 DRY 380 64.0 0.7356 225 417/15/04 0.00 0.05 2.77 WET 420 67.5 0.7759 253 407/22/04 0.00 0.00 0.00 DRY 1700 85.0 0.9770 410 767/29/04 0.00 0.21 1.40 DRY 372 63.0 0.7241 218 418/5/04 0.87 0.93 0.93 WET 2700 86.0 0.9885 410 858/12/04 0.01 0.50 0.50 WET 1500 83.0 0.9540 410 738/19/04 0.00 0.00 1.58 DRY 420 67.5 0.7759 253 408/26/04 0.00 0.00 0.00 DRY 360 61.5 0.7069 208 429/9/04 0.19 4.09 4.09 WET 5100 87.0 1.0000 410 929/16/04 0.00 0.08 0.08 DRY 480 70.5 0.8103 283 419/23/04 0.00 0.00 0.00 DRY 128 27.0 0.3103 80 389/30/04 0.04 1.13 3.05 WET 840 79.0 0.9080 410 51
Precipitation and E. coli data provided by the Norwalk Department of Health and Haborwatch/Riverwatch, respectively.WET Condition defined as greater than 0.1" precipitation in 24 hours or0.25" precipitation in 48 hours, or 2.0" precipitation in 96 hours.
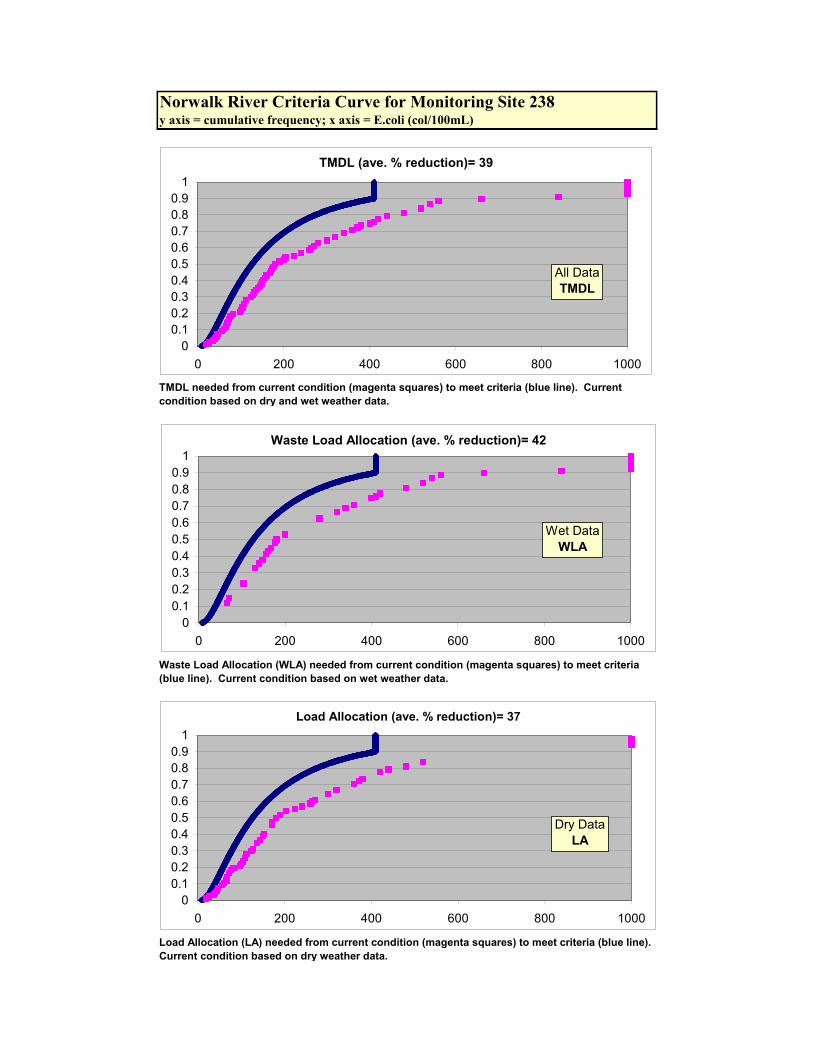
Norwalk River Criteria Curve for Monitoring Site 238y axis = cumulative frequency; x axis = E.coli (col/100mL)
TMDL needed from current condition (magenta squares) to meet criteria (blue line). Current condition based on dry and wet weather data.
Load Allocation (LA) needed from current condition (magenta squares) to meet criteria (blue line). Current condition based on dry weather data.
Waste Load Allocation (WLA) needed from current condition (magenta squares) to meet criteria (blue line). Current condition based on wet weather data.
TMDL (ave. % reduction)= 39
00.10.20.30.40.50.60.70.80.9
1
0 200 400 600 800 1000
Waste Load Allocation (ave. % reduction)= 42
00.10.20.30.40.50.60.70.80.9
1
0 200 400 600 800 1000
Load Allocation (ave. % reduction)= 37
00.10.20.30.40.50.60.70.80.9
1
0 200 400 600 800 1000
All DataTMDL
Wet DataWLA
Dry DataLA
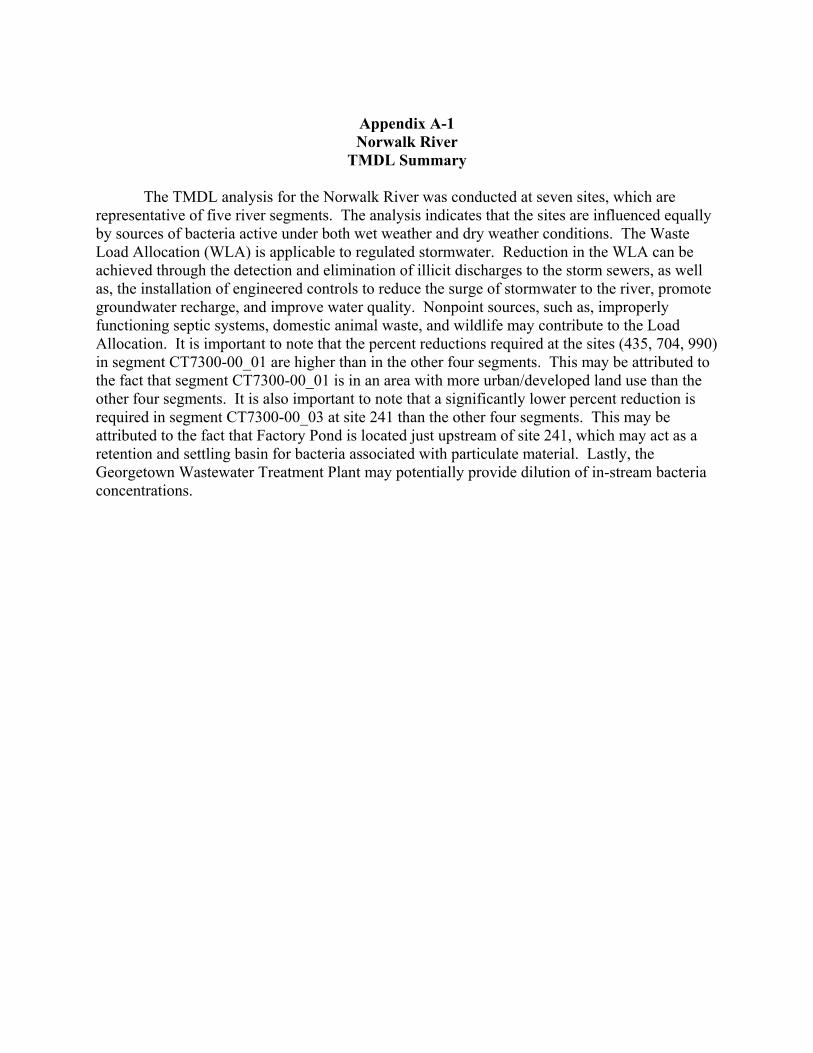
Appendix A-1 Norwalk River
TMDL Summary
The TMDL analysis for the Norwalk River was conducted at seven sites, which are representative of five river segments. The analysis indicates that the sites are influenced equally by sources of bacteria active under both wet weather and dry weather conditions. The Waste Load Allocation (WLA) is applicable to regulated stormwater. Reduction in the WLA can be achieved through the detection and elimination of illicit discharges to the storm sewers, as well as, the installation of engineered controls to reduce the surge of stormwater to the river, promote groundwater recharge, and improve water quality. Nonpoint sources, such as, improperly functioning septic systems, domestic animal waste, and wildlife may contribute to the Load Allocation. It is important to note that the percent reductions required at the sites (435, 704, 990) in segment CT7300-00_01 are higher than in the other four segments. This may be attributed to the fact that segment CT7300-00_01 is in an area with more urban/developed land use than the other four segments. It is also important to note that a significantly lower percent reduction is required in segment CT7300-00_03 at site 241 than the other four segments. This may be attributed to the fact that Factory Pond is located just upstream of site 241, which may act as a retention and settling basin for bacteria associated with particulate material. Lastly, the Georgetown Wastewater Treatment Plant may potentially provide dilution of in-stream bacteria concentrations.
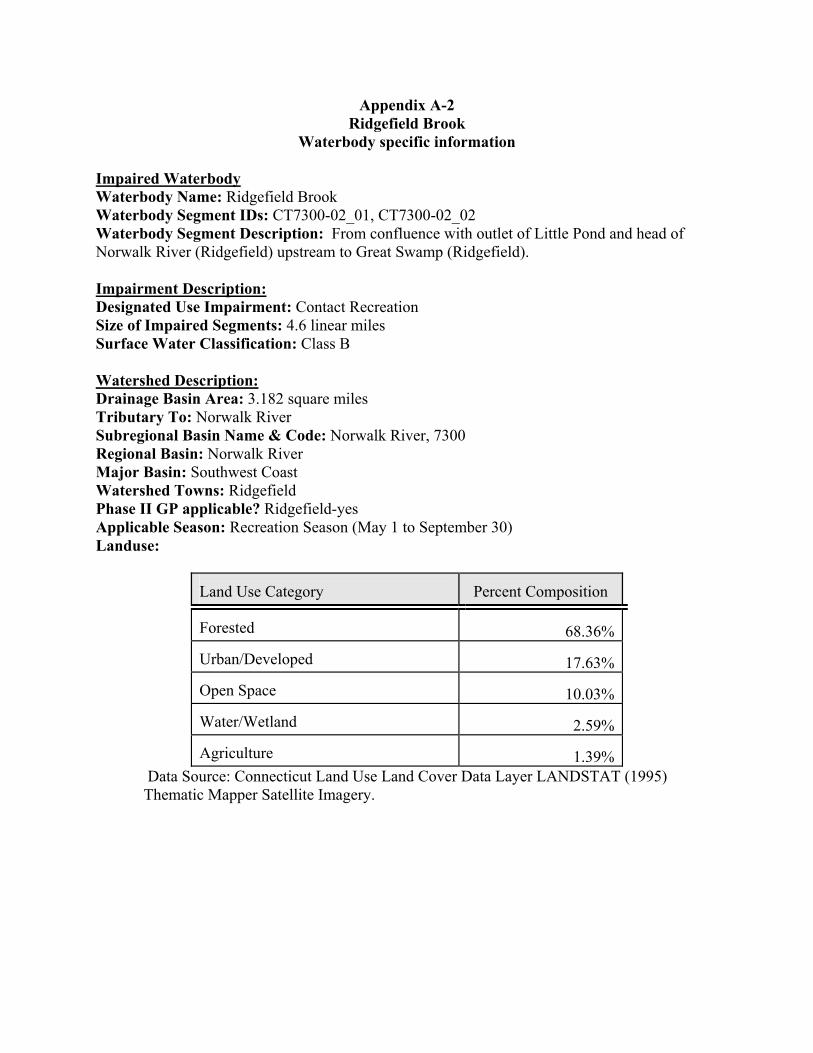
Appendix A-2 Ridgefield Brook
Waterbody specific information Impaired Waterbody Waterbody Name: Ridgefield Brook Waterbody Segment IDs: CT7300-02_01, CT7300-02_02 Waterbody Segment Description: From confluence with outlet of Little Pond and head of Norwalk River (Ridgefield) upstream to Great Swamp (Ridgefield). Impairment Description: Designated Use Impairment: Contact Recreation Size of Impaired Segments: 4.6 linear miles Surface Water Classification: Class B Watershed Description: Drainage Basin Area: 3.182 square miles Tributary To: Norwalk River Subregional Basin Name & Code: Norwalk River, 7300 Regional Basin: Norwalk River Major Basin: Southwest Coast Watershed Towns: Ridgefield Phase II GP applicable? Ridgefield-yes Applicable Season: Recreation Season (May 1 to September 30) Landuse:
Land Use Category
Percent Composition
Forested 68.36% Urban/Developed 17.63% Open Space 10.03% Water/Wetland 2.59% Agriculture 1.39%
Data Source: Connecticut Land Use Land Cover Data Layer LANDSTAT (1995) Thematic Mapper Satellite Imagery.
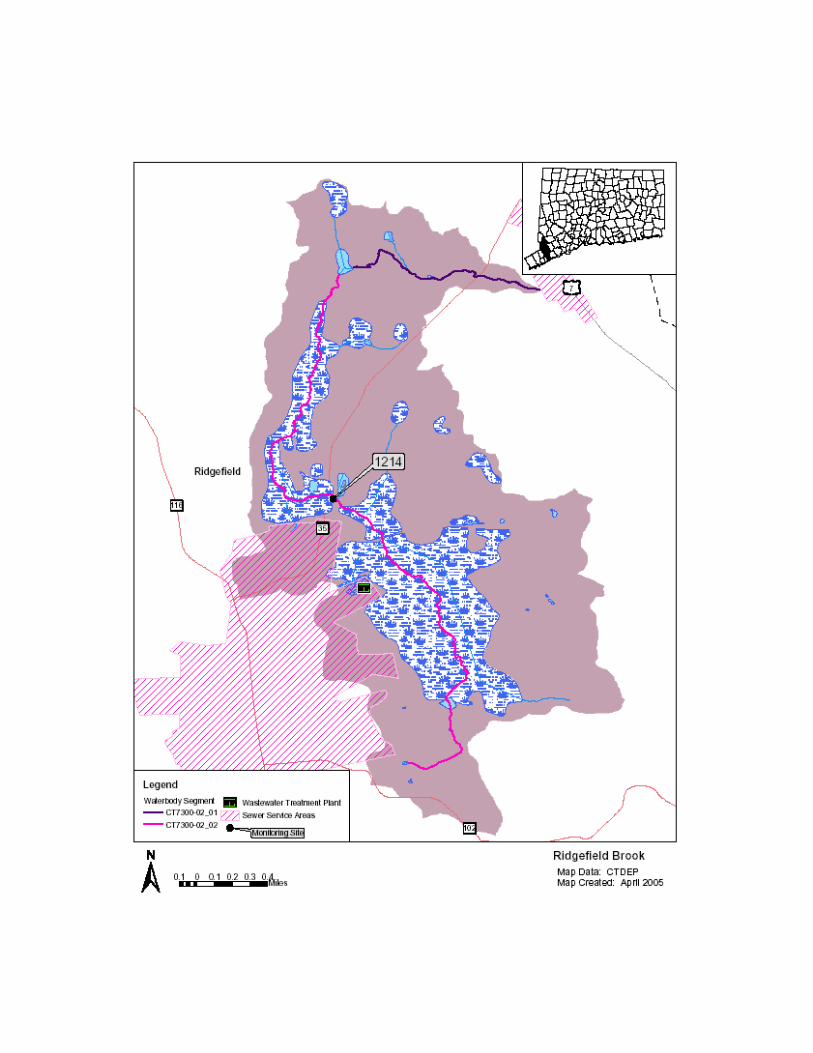
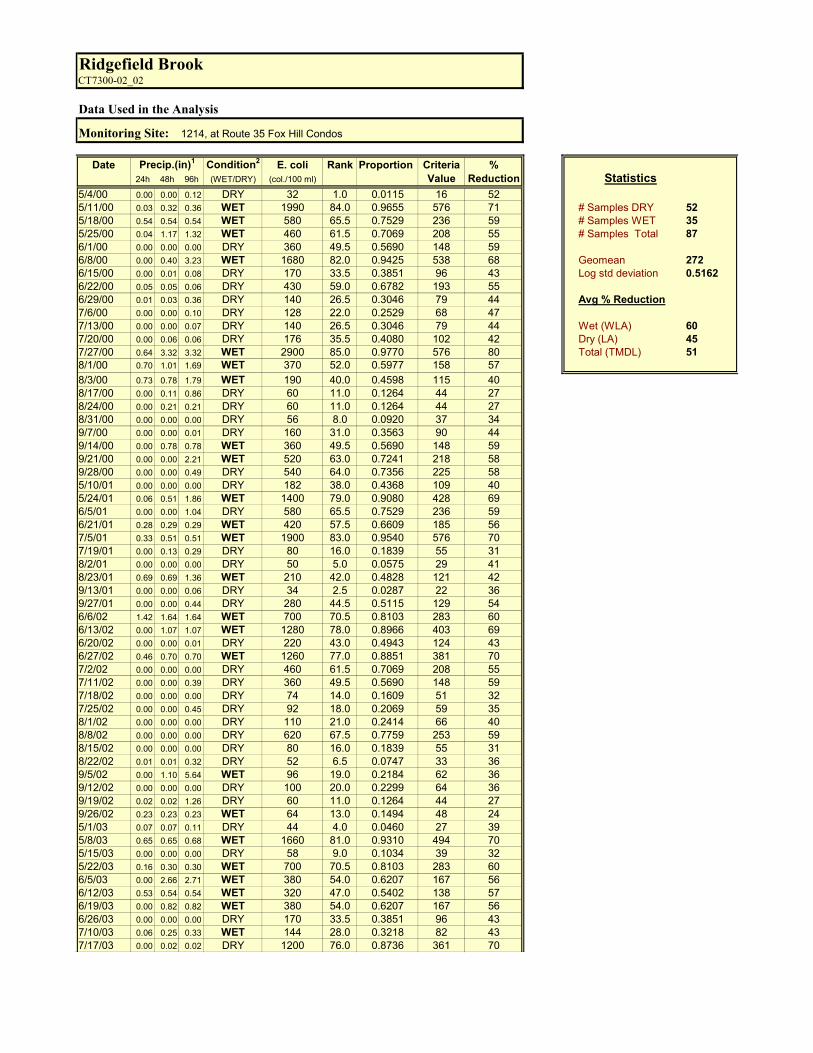
Data Used in the Analysis
Monitoring Site:
Date Precip.(in)1 Condition2 E. coli Rank Proportion Criteria %24h 48h 96h (WET/DRY) (col./100 ml) Value Reduction
5/4/00 0.00 0.00 0.12 DRY 32 1.0 0.0115 16 525/11/00 0.03 0.32 0.36 WET 1990 84.0 0.9655 576 71 # Samples DRY 525/18/00 0.54 0.54 0.54 WET 580 65.5 0.7529 236 59 # Samples WET 355/25/00 0.04 1.17 1.32 WET 460 61.5 0.7069 208 55 # Samples Total 876/1/00 0.00 0.00 0.00 DRY 360 49.5 0.5690 148 596/8/00 0.00 0.40 3.23 WET 1680 82.0 0.9425 538 68 Geomean 2726/15/00 0.00 0.01 0.08 DRY 170 33.5 0.3851 96 43 Log std deviation 0.51626/22/00 0.05 0.05 0.06 DRY 430 59.0 0.6782 193 556/29/00 0.01 0.03 0.36 DRY 140 26.5 0.3046 79 44 Avg % Reduction7/6/00 0.00 0.00 0.10 DRY 128 22.0 0.2529 68 477/13/00 0.00 0.00 0.07 DRY 140 26.5 0.3046 79 44 Wet (WLA) 607/20/00 0.00 0.06 0.06 DRY 176 35.5 0.4080 102 42 Dry (LA) 457/27/00 0.64 3.32 3.32 WET 2900 85.0 0.9770 576 80 Total (TMDL) 518/1/00 0.70 1.01 1.69 WET 370 52.0 0.5977 158 578/3/00 0.73 0.78 1.79 WET 190 40.0 0.4598 115 408/17/00 0.00 0.11 0.86 DRY 60 11.0 0.1264 44 278/24/00 0.00 0.21 0.21 DRY 60 11.0 0.1264 44 278/31/00 0.00 0.00 0.00 DRY 56 8.0 0.0920 37 349/7/00 0.00 0.00 0.01 DRY 160 31.0 0.3563 90 449/14/00 0.00 0.78 0.78 WET 360 49.5 0.5690 148 599/21/00 0.00 0.00 2.21 WET 520 63.0 0.7241 218 589/28/00 0.00 0.00 0.49 DRY 540 64.0 0.7356 225 585/10/01 0.00 0.00 0.00 DRY 182 38.0 0.4368 109 405/24/01 0.06 0.51 1.86 WET 1400 79.0 0.9080 428 696/5/01 0.00 0.00 1.04 DRY 580 65.5 0.7529 236 596/21/01 0.28 0.29 0.29 WET 420 57.5 0.6609 185 567/5/01 0.33 0.51 0.51 WET 1900 83.0 0.9540 576 707/19/01 0.00 0.13 0.29 DRY 80 16.0 0.1839 55 318/2/01 0.00 0.00 0.00 DRY 50 5.0 0.0575 29 418/23/01 0.69 0.69 1.36 WET 210 42.0 0.4828 121 429/13/01 0.00 0.00 0.06 DRY 34 2.5 0.0287 22 369/27/01 0.00 0.00 0.44 DRY 280 44.5 0.5115 129 546/6/02 1.42 1.64 1.64 WET 700 70.5 0.8103 283 606/13/02 0.00 1.07 1.07 WET 1280 78.0 0.8966 403 696/20/02 0.00 0.00 0.01 DRY 220 43.0 0.4943 124 436/27/02 0.46 0.70 0.70 WET 1260 77.0 0.8851 381 707/2/02 0.00 0.00 0.00 DRY 460 61.5 0.7069 208 557/11/02 0.00 0.00 0.39 DRY 360 49.5 0.5690 148 597/18/02 0.00 0.00 0.00 DRY 74 14.0 0.1609 51 327/25/02 0.00 0.00 0.45 DRY 92 18.0 0.2069 59 358/1/02 0.00 0.00 0.00 DRY 110 21.0 0.2414 66 408/8/02 0.00 0.00 0.00 DRY 620 67.5 0.7759 253 598/15/02 0.00 0.00 0.00 DRY 80 16.0 0.1839 55 318/22/02 0.01 0.01 0.32 DRY 52 6.5 0.0747 33 369/5/02 0.00 1.10 5.64 WET 96 19.0 0.2184 62 369/12/02 0.00 0.00 0.00 DRY 100 20.0 0.2299 64 369/19/02 0.02 0.02 1.26 DRY 60 11.0 0.1264 44 279/26/02 0.23 0.23 0.23 WET 64 13.0 0.1494 48 245/1/03 0.07 0.07 0.11 DRY 44 4.0 0.0460 27 395/8/03 0.65 0.65 0.68 WET 1660 81.0 0.9310 494 705/15/03 0.00 0.00 0.00 DRY 58 9.0 0.1034 39 325/22/03 0.16 0.30 0.30 WET 700 70.5 0.8103 283 606/5/03 0.00 2.66 2.71 WET 380 54.0 0.6207 167 566/12/03 0.53 0.54 0.54 WET 320 47.0 0.5402 138 576/19/03 0.00 0.82 0.82 WET 380 54.0 0.6207 167 566/26/03 0.00 0.00 0.00 DRY 170 33.5 0.3851 96 437/10/03 0.06 0.25 0.33 WET 144 28.0 0.3218 82 437/17/03 0.00 0.02 0.02 DRY 1200 76.0 0.8736 361 70
Ridgefield BrookCT7300-02_02
1214, at Route 35 Fox Hill Condos
Statistics

7/24/03 0.00 0.19 0.82 DRY 180 37.0 0.4253 106 417/31/03 0.00 0.00 0.07 DRY 80 16.0 0.1839 55 318/7/03 0.22 0.26 1.71 WET 160 31.0 0.3563 90 448/14/03 0.00 0.00 0.44 DRY 840 72.0 0.8276 301 648/28/03 0.00 0.00 0.00 DRY 132 24.0 0.2759 73 459/4/03 0.09 0.42 2.16 WET 400 56.0 0.6437 177 569/11/03 0.00 0.00 0.00 DRY 188 39.0 0.4483 112 419/18/03 0.00 0.00 0.68 DRY 176 35.5 0.4080 102 429/25/03 0.00 0.00 1.76 DRY 132 24.0 0.2759 73 455/6/04 0.00 0.13 0.51 DRY 34 2.5 0.0287 22 365/13/04 0.00 0.06 0.33 DRY 360 49.5 0.5690 148 595/20/04 0.00 0.01 0.02 DRY 380 54.0 0.6207 167 565/27/04 1.03 1.07 1.09 WET 860 73.0 0.8391 314 646/3/04 0.00 0.48 1.06 WET 620 67.5 0.7759 253 596/10/04 0.27 0.27 0.27 WET 680 69.0 0.7931 267 616/17/04 0.31 0.31 0.40 WET 300 46.0 0.5287 135 556/24/04 0.00 0.00 0.15 DRY 160 31.0 0.3563 90 447/8/04 0.00 0.00 1.10 DRY 52 6.5 0.0747 33 367/15/04 0.00 0.05 2.77 WET 440 60.0 0.6897 199 557/22/04 0.00 0.00 0.00 DRY 1630 80.0 0.9195 458 727/29/04 0.00 0.21 1.40 DRY 132 24.0 0.2759 73 458/5/04 0.87 0.93 0.93 WET 4100 86.0 0.9885 576 868/12/04 0.01 0.50 0.50 WET 960 74.0 0.8506 328 668/19/04 0.00 0.00 1.58 DRY 280 44.5 0.5115 129 548/26/04 0.00 0.00 0.00 DRY 152 29.0 0.3333 85 449/9/04 0.19 4.09 4.09 WET 8300 87.0 1.0000 576 939/16/04 0.00 0.08 0.08 DRY 420 57.5 0.6609 185 569/23/04 0.00 0.00 0.00 DRY 196 41.0 0.4713 118 409/30/04 0.04 1.13 3.05 WET 1100 75.0 0.8621 344 69
Precipitation and E. coli data provided by the Norwalk Department of Health and Haborwatch/Riverwatch, respectively.WET Condition defined as greater than 0.1" precipitation in 24 hours or0.25" precipitation in 48 hours, or 2.0" precipitation in 96 hours.
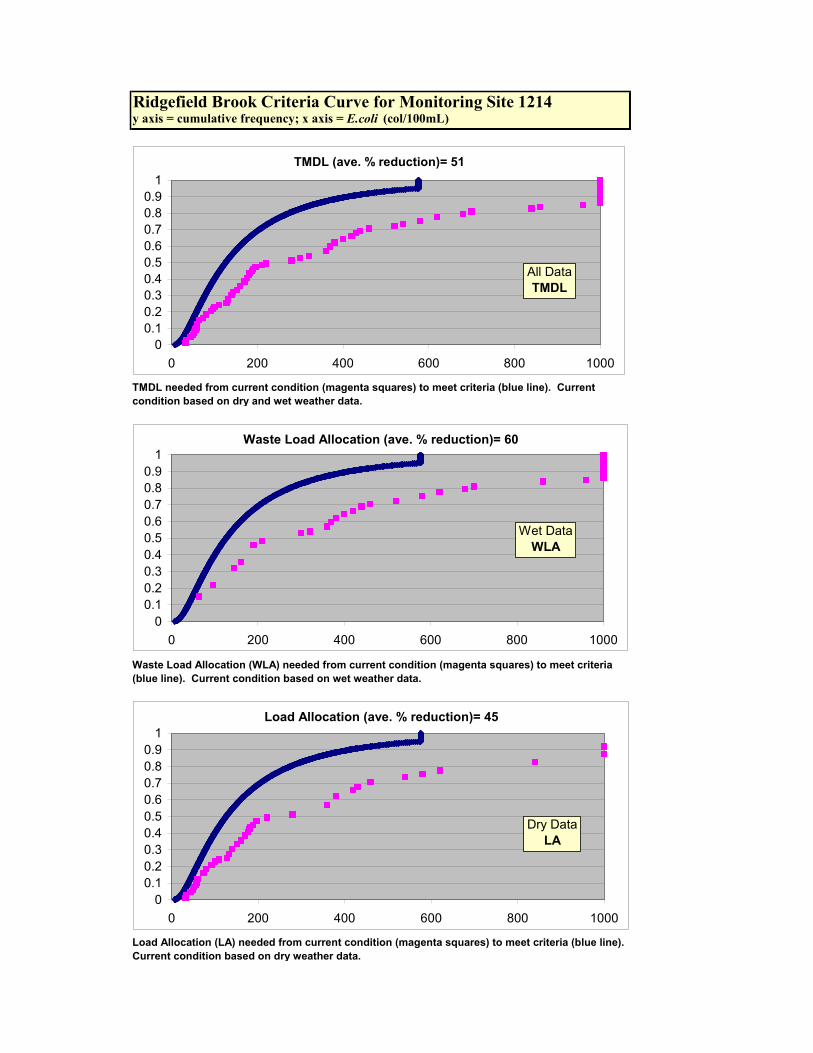
Ridgefield Brook Criteria Curve for Monitoring Site 1214y axis = cumulative frequency; x axis = E.coli (col/100mL)
TMDL needed from current condition (magenta squares) to meet criteria (blue line). Current condition based on dry and wet weather data.
Load Allocation (LA) needed from current condition (magenta squares) to meet criteria (blue line). Current condition based on dry weather data.
Waste Load Allocation (WLA) needed from current condition (magenta squares) to meet criteria (blue line). Current condition based on wet weather data.
TMDL (ave. % reduction)= 51
00.10.20.30.40.50.60.70.80.9
1
0 200 400 600 800 1000
Waste Load Allocation (ave. % reduction)= 60
00.10.20.30.40.50.60.70.80.9
1
0 200 400 600 800 1000
Load Allocation (ave. % reduction)= 45
00.10.20.30.40.50.60.70.80.9
1
0 200 400 600 800 1000
All DataTMDL
Wet DataWLA
Dry DataLA
Appendix A-2 Ridgefield Brook TMDL Summary
The TMDL analysis for Ridgefield Brook was conducted at site 1214, which is
representative of one river segment (CT7300-02_02). Current data is unavailable to conduct a TMDL analysis for the Ridgefield Brook segment, segment, CT7300-02_01. However, this small segment (1 linear mile) is located between two segments (CT7300-00_05 and CT7300-02_02) that require percent reductions. Therefore, it is reasonable to presume that the same percent reduction applies throughout Ridgefield Brook. The analysis indicates that the site is influenced by sources of bacteria active under both wet weather and dry weather conditions. The WLA (60% reduction) was significantly higher than the LA (44% reduction). This indicates that water quality at site 1214 is more strongly influenced by point source stormwater than non-point sources. Reduction in the WLA can be achieved through the installation of engineered controls to reduce the surge of stormwater to the river, promote groundwater recharge, and improve water quality, as well as, detection and elimination of illicit discharges to the storm sewers. Non-point sources such as improperly functioning septic systems, domestic animal waste, and nuisance wildlife may contribute to the LA.
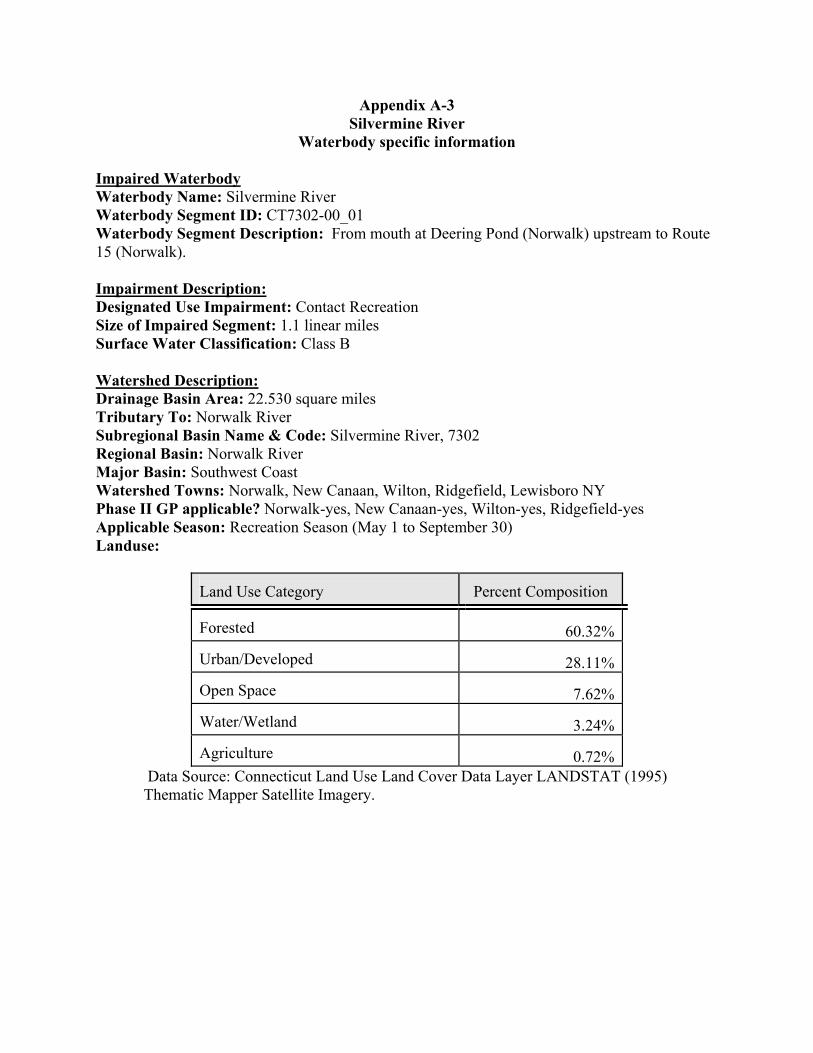
Appendix A-3 Silvermine River
Waterbody specific information Impaired Waterbody Waterbody Name: Silvermine River Waterbody Segment ID: CT7302-00_01 Waterbody Segment Description: From mouth at Deering Pond (Norwalk) upstream to Route 15 (Norwalk). Impairment Description: Designated Use Impairment: Contact Recreation Size of Impaired Segment: 1.1 linear miles Surface Water Classification: Class B Watershed Description: Drainage Basin Area: 22.530 square miles Tributary To: Norwalk River Subregional Basin Name & Code: Silvermine River, 7302 Regional Basin: Norwalk River Major Basin: Southwest Coast Watershed Towns: Norwalk, New Canaan, Wilton, Ridgefield, Lewisboro NY Phase II GP applicable? Norwalk-yes, New Canaan-yes, Wilton-yes, Ridgefield-yes Applicable Season: Recreation Season (May 1 to September 30) Landuse:
Land Use Category
Percent Composition
Forested 60.32% Urban/Developed 28.11% Open Space 7.62% Water/Wetland 3.24% Agriculture 0.72%
Data Source: Connecticut Land Use Land Cover Data Layer LANDSTAT (1995) Thematic Mapper Satellite Imagery.
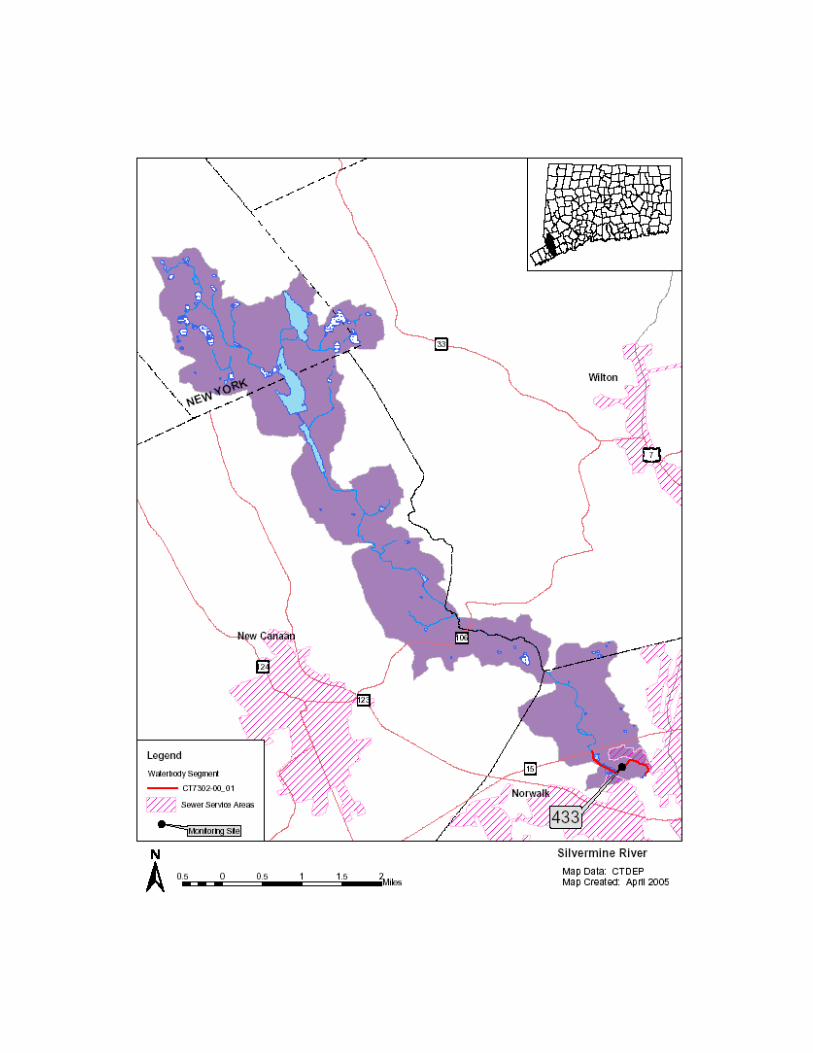
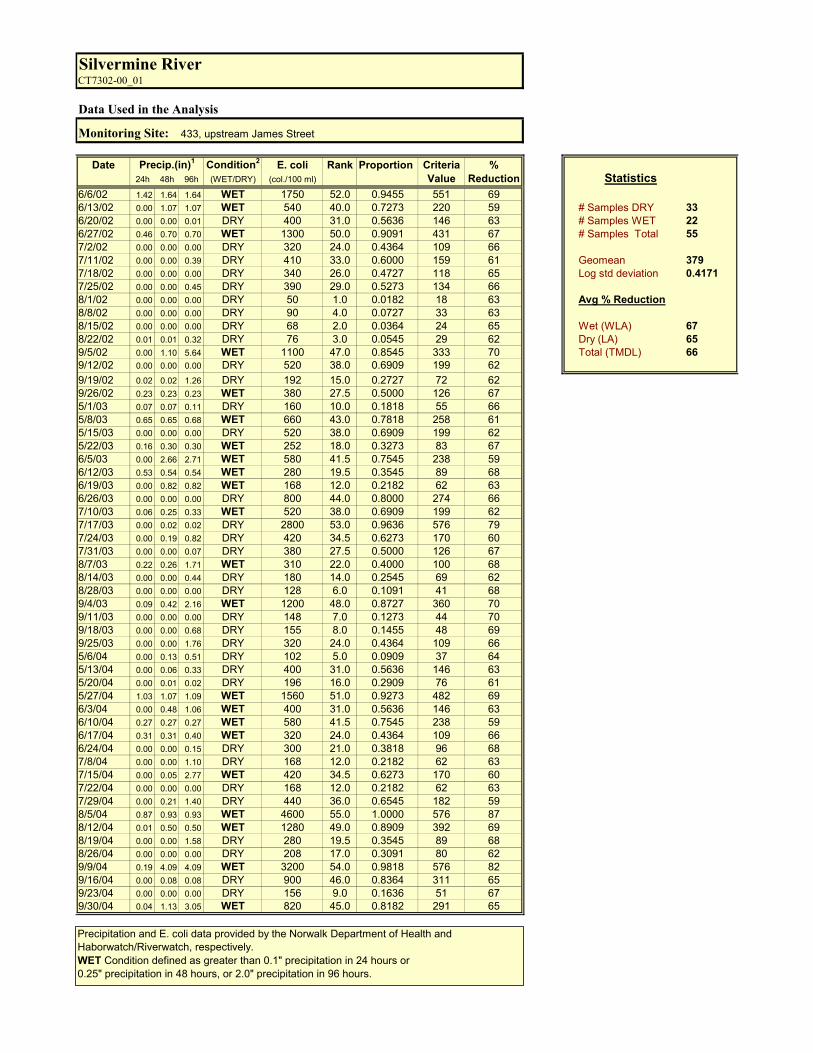
Data Used in the Analysis
Monitoring Site:
Date Precip.(in)1 Condition2 E. coli Rank Proportion Criteria %24h 48h 96h (WET/DRY) (col./100 ml) Value Reduction
6/6/02 1.42 1.64 1.64 WET 1750 52.0 0.9455 551 696/13/02 0.00 1.07 1.07 WET 540 40.0 0.7273 220 59 # Samples DRY 336/20/02 0.00 0.00 0.01 DRY 400 31.0 0.5636 146 63 # Samples WET 226/27/02 0.46 0.70 0.70 WET 1300 50.0 0.9091 431 67 # Samples Total 557/2/02 0.00 0.00 0.00 DRY 320 24.0 0.4364 109 667/11/02 0.00 0.00 0.39 DRY 410 33.0 0.6000 159 61 Geomean 3797/18/02 0.00 0.00 0.00 DRY 340 26.0 0.4727 118 65 Log std deviation 0.41717/25/02 0.00 0.00 0.45 DRY 390 29.0 0.5273 134 668/1/02 0.00 0.00 0.00 DRY 50 1.0 0.0182 18 63 Avg % Reduction8/8/02 0.00 0.00 0.00 DRY 90 4.0 0.0727 33 638/15/02 0.00 0.00 0.00 DRY 68 2.0 0.0364 24 65 Wet (WLA) 678/22/02 0.01 0.01 0.32 DRY 76 3.0 0.0545 29 62 Dry (LA) 659/5/02 0.00 1.10 5.64 WET 1100 47.0 0.8545 333 70 Total (TMDL) 669/12/02 0.00 0.00 0.00 DRY 520 38.0 0.6909 199 629/19/02 0.02 0.02 1.26 DRY 192 15.0 0.2727 72 629/26/02 0.23 0.23 0.23 WET 380 27.5 0.5000 126 675/1/03 0.07 0.07 0.11 DRY 160 10.0 0.1818 55 665/8/03 0.65 0.65 0.68 WET 660 43.0 0.7818 258 615/15/03 0.00 0.00 0.00 DRY 520 38.0 0.6909 199 625/22/03 0.16 0.30 0.30 WET 252 18.0 0.3273 83 676/5/03 0.00 2.66 2.71 WET 580 41.5 0.7545 238 596/12/03 0.53 0.54 0.54 WET 280 19.5 0.3545 89 686/19/03 0.00 0.82 0.82 WET 168 12.0 0.2182 62 636/26/03 0.00 0.00 0.00 DRY 800 44.0 0.8000 274 667/10/03 0.06 0.25 0.33 WET 520 38.0 0.6909 199 627/17/03 0.00 0.02 0.02 DRY 2800 53.0 0.9636 576 797/24/03 0.00 0.19 0.82 DRY 420 34.5 0.6273 170 607/31/03 0.00 0.00 0.07 DRY 380 27.5 0.5000 126 678/7/03 0.22 0.26 1.71 WET 310 22.0 0.4000 100 688/14/03 0.00 0.00 0.44 DRY 180 14.0 0.2545 69 628/28/03 0.00 0.00 0.00 DRY 128 6.0 0.1091 41 689/4/03 0.09 0.42 2.16 WET 1200 48.0 0.8727 360 709/11/03 0.00 0.00 0.00 DRY 148 7.0 0.1273 44 709/18/03 0.00 0.00 0.68 DRY 155 8.0 0.1455 48 699/25/03 0.00 0.00 1.76 DRY 320 24.0 0.4364 109 665/6/04 0.00 0.13 0.51 DRY 102 5.0 0.0909 37 645/13/04 0.00 0.06 0.33 DRY 400 31.0 0.5636 146 635/20/04 0.00 0.01 0.02 DRY 196 16.0 0.2909 76 615/27/04 1.03 1.07 1.09 WET 1560 51.0 0.9273 482 696/3/04 0.00 0.48 1.06 WET 400 31.0 0.5636 146 636/10/04 0.27 0.27 0.27 WET 580 41.5 0.7545 238 596/17/04 0.31 0.31 0.40 WET 320 24.0 0.4364 109 666/24/04 0.00 0.00 0.15 DRY 300 21.0 0.3818 96 687/8/04 0.00 0.00 1.10 DRY 168 12.0 0.2182 62 637/15/04 0.00 0.05 2.77 WET 420 34.5 0.6273 170 607/22/04 0.00 0.00 0.00 DRY 168 12.0 0.2182 62 637/29/04 0.00 0.21 1.40 DRY 440 36.0 0.6545 182 598/5/04 0.87 0.93 0.93 WET 4600 55.0 1.0000 576 878/12/04 0.01 0.50 0.50 WET 1280 49.0 0.8909 392 698/19/04 0.00 0.00 1.58 DRY 280 19.5 0.3545 89 688/26/04 0.00 0.00 0.00 DRY 208 17.0 0.3091 80 629/9/04 0.19 4.09 4.09 WET 3200 54.0 0.9818 576 829/16/04 0.00 0.08 0.08 DRY 900 46.0 0.8364 311 659/23/04 0.00 0.00 0.00 DRY 156 9.0 0.1636 51 679/30/04 0.04 1.13 3.05 WET 820 45.0 0.8182 291 65
Statistics
Silvermine RiverCT7302-00_01
433, upstream James Street
Precipitation and E. coli data provided by the Norwalk Department of Health and Haborwatch/Riverwatch, respectively.WET Condition defined as greater than 0.1" precipitation in 24 hours or0.25" precipitation in 48 hours, or 2.0" precipitation in 96 hours.
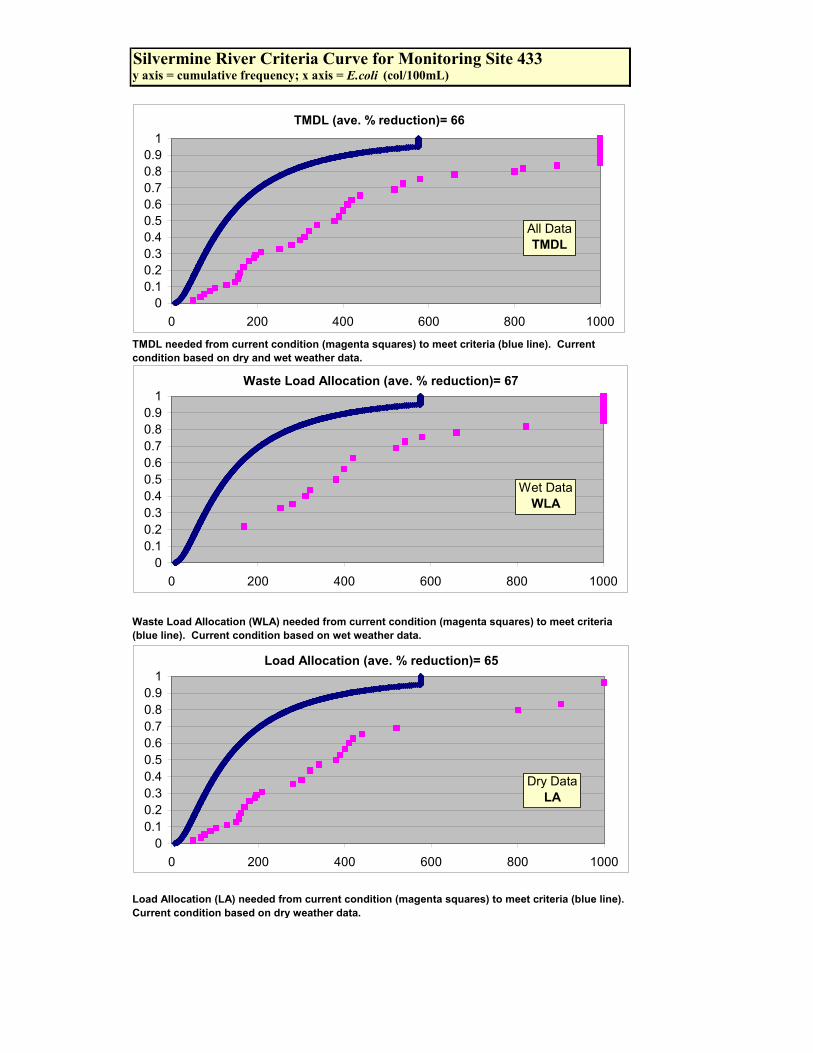
Silvermine River Criteria Curve for Monitoring Site 433y axis = cumulative frequency; x axis = E.coli (col/100mL)
TMDL needed from current condition (magenta squares) to meet criteria (blue line). Current condition based on dry and wet weather data.
Load Allocation (LA) needed from current condition (magenta squares) to meet criteria (blue line). Current condition based on dry weather data.
Waste Load Allocation (WLA) needed from current condition (magenta squares) to meet criteria (blue line). Current condition based on wet weather data.
TMDL (ave. % reduction)= 66
00.10.20.30.40.50.60.70.80.9
1
0 200 400 600 800 1000
Waste Load Allocation (ave. % reduction)= 67
00.10.20.30.40.50.60.70.80.9
1
0 200 400 600 800 1000
Load Allocation (ave. % reduction)= 65
00.10.20.30.40.50.60.70.80.9
1
0 200 400 600 800 1000
All DataTMDL
Wet DataWLA
Dry DataLA
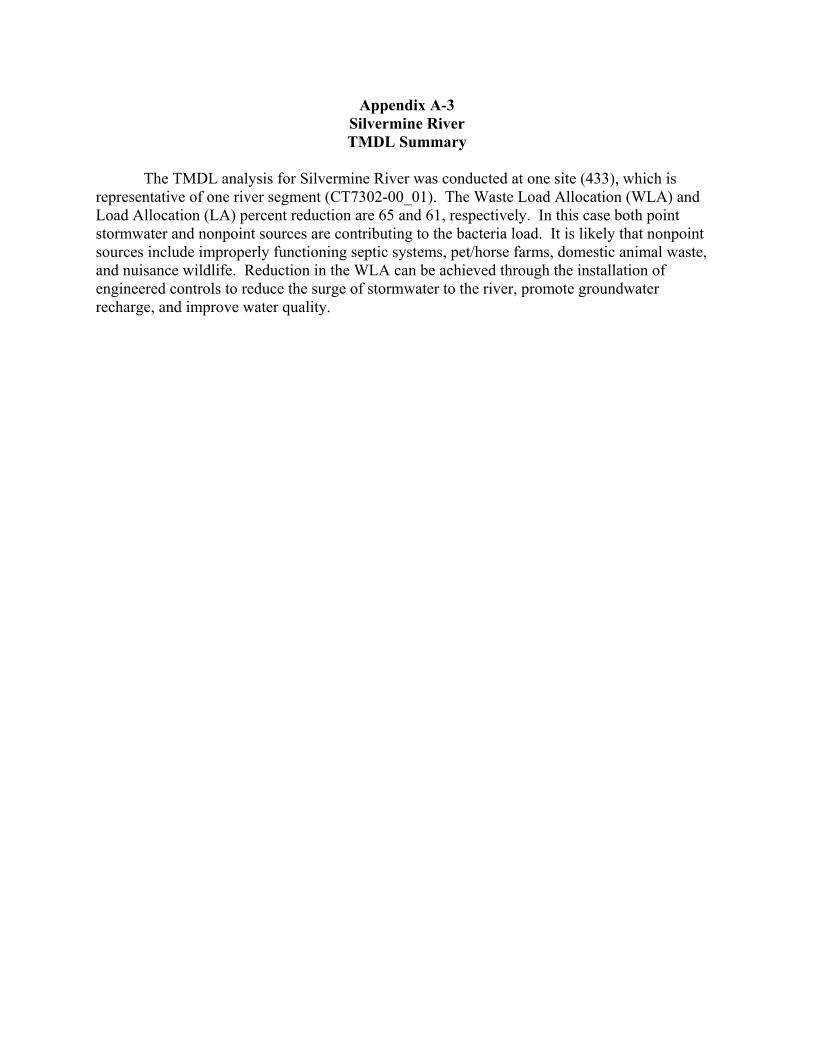
Appendix A-3 Silvermine River TMDL Summary
The TMDL analysis for Silvermine River was conducted at one site (433), which is
representative of one river segment (CT7302-00_01). The Waste Load Allocation (WLA) and Load Allocation (LA) percent reduction are 65 and 61, respectively. In this case both point stormwater and nonpoint sources are contributing to the bacteria load. It is likely that nonpoint sources include improperly functioning septic systems, pet/horse farms, domestic animal waste, and nuisance wildlife. Reduction in the WLA can be achieved through the installation of engineered controls to reduce the surge of stormwater to the river, promote groundwater recharge, and improve water quality.
Appendix B
Technical Support Document for the Cumulative Distribution Function Method
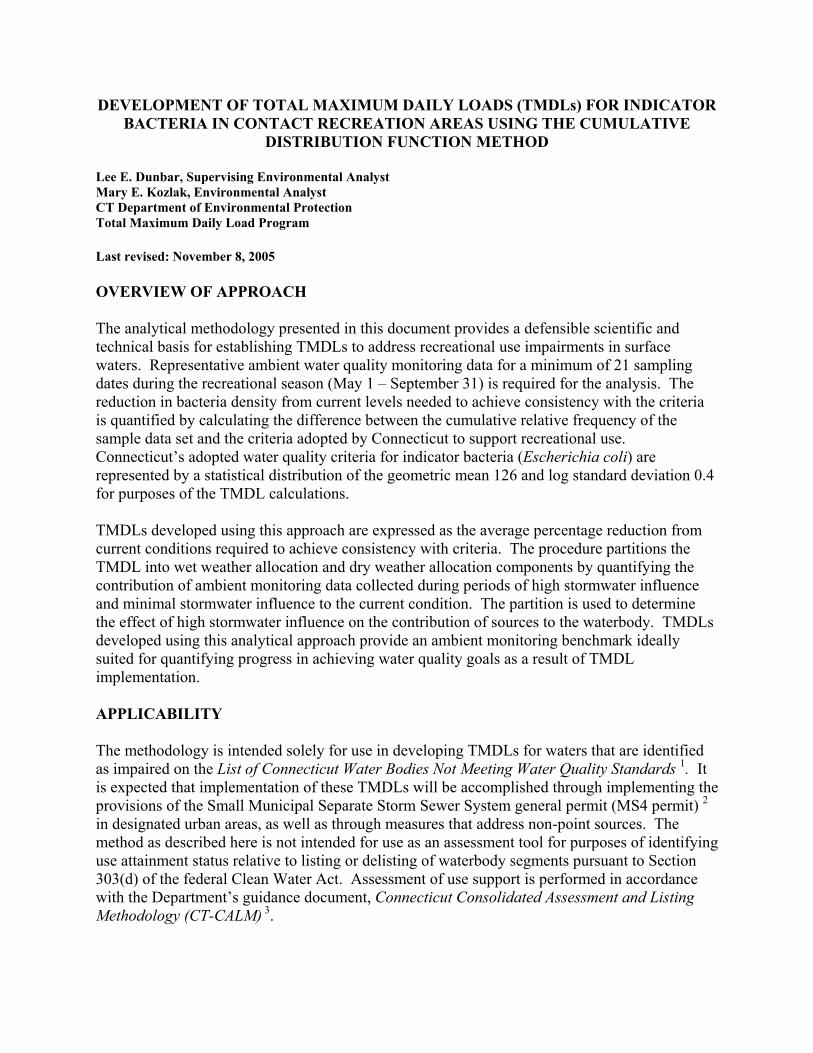
DEVELOPMENT OF TOTAL MAXIMUM DAILY LOADS (TMDLs) FOR INDICATOR BACTERIA IN CONTACT RECREATION AREAS USING THE CUMULATIVE
DISTRIBUTION FUNCTION METHOD Lee E. Dunbar, Supervising Environmental Analyst Mary E. Kozlak, Environmental Analyst CT Department of Environmental Protection Total Maximum Daily Load Program Last revised: November 8, 2005 OVERVIEW OF APPROACH The analytical methodology presented in this document provides a defensible scientific and technical basis for establishing TMDLs to address recreational use impairments in surface waters. Representative ambient water quality monitoring data for a minimum of 21 sampling dates during the recreational season (May 1 – September 31) is required for the analysis. The reduction in bacteria density from current levels needed to achieve consistency with the criteria is quantified by calculating the difference between the cumulative relative frequency of the sample data set and the criteria adopted by Connecticut to support recreational use. Connecticut’s adopted water quality criteria for indicator bacteria (Escherichia coli) are represented by a statistical distribution of the geometric mean 126 and log standard deviation 0.4 for purposes of the TMDL calculations. TMDLs developed using this approach are expressed as the average percentage reduction from current conditions required to achieve consistency with criteria. The procedure partitions the TMDL into wet weather allocation and dry weather allocation components by quantifying the contribution of ambient monitoring data collected during periods of high stormwater influence and minimal stormwater influence to the current condition. The partition is used to determine the effect of high stormwater influence on the contribution of sources to the waterbody. TMDLs developed using this analytical approach provide an ambient monitoring benchmark ideally suited for quantifying progress in achieving water quality goals as a result of TMDL implementation. APPLICABILITY The methodology is intended solely for use in developing TMDLs for waters that are identified as impaired on the List of Connecticut Water Bodies Not Meeting Water Quality Standards 1. It is expected that implementation of these TMDLs will be accomplished through implementing the provisions of the Small Municipal Separate Storm Sewer System general permit (MS4 permit) 2 in designated urban areas, as well as through measures that address non-point sources. The method as described here is not intended for use as an assessment tool for purposes of identifying use attainment status relative to listing or delisting of waterbody segments pursuant to Section 303(d) of the federal Clean Water Act. Assessment of use support is performed in accordance with the Department’s guidance document, Connecticut Consolidated Assessment and Listing Methodology (CT-CALM) 3.
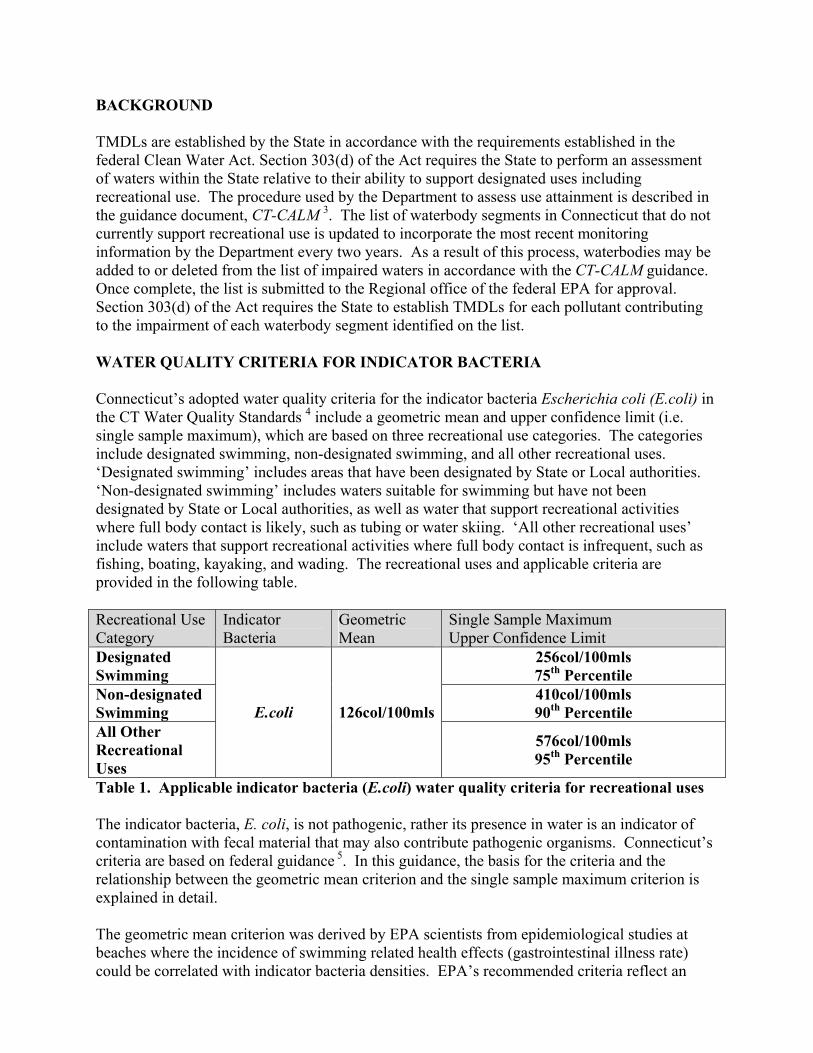
BACKGROUND TMDLs are established by the State in accordance with the requirements established in the federal Clean Water Act. Section 303(d) of the Act requires the State to perform an assessment of waters within the State relative to their ability to support designated uses including recreational use. The procedure used by the Department to assess use attainment is described in the guidance document, CT-CALM 3. The list of waterbody segments in Connecticut that do not currently support recreational use is updated to incorporate the most recent monitoring information by the Department every two years. As a result of this process, waterbodies may be added to or deleted from the list of impaired waters in accordance with the CT-CALM guidance. Once complete, the list is submitted to the Regional office of the federal EPA for approval. Section 303(d) of the Act requires the State to establish TMDLs for each pollutant contributing to the impairment of each waterbody segment identified on the list. WATER QUALITY CRITERIA FOR INDICATOR BACTERIA Connecticut’s adopted water quality criteria for the indicator bacteria Escherichia coli (E.coli) in the CT Water Quality Standards 4 include a geometric mean and upper confidence limit (i.e. single sample maximum), which are based on three recreational use categories. The categories include designated swimming, non-designated swimming, and all other recreational uses. ‘Designated swimming’ includes areas that have been designated by State or Local authorities. ‘Non-designated swimming’ includes waters suitable for swimming but have not been designated by State or Local authorities, as well as water that support recreational activities where full body contact is likely, such as tubing or water skiing. ‘All other recreational uses’ include waters that support recreational activities where full body contact is infrequent, such as fishing, boating, kayaking, and wading. The recreational uses and applicable criteria are provided in the following table. Recreational Use Category
Indicator Bacteria
Geometric Mean
Single Sample Maximum Upper Confidence Limit
Designated Swimming
256col/100mls 75th Percentile
Non-designated Swimming
410col/100mls 90th Percentile
All Other Recreational Uses
E.coli 126col/100mls
576col/100mls 95th Percentile
Table 1. Applicable indicator bacteria (E.coli) water quality criteria for recreational uses The indicator bacteria, E. coli, is not pathogenic, rather its presence in water is an indicator of contamination with fecal material that may also contribute pathogenic organisms. Connecticut’s criteria are based on federal guidance 5. In this guidance, the basis for the criteria and the relationship between the geometric mean criterion and the single sample maximum criterion is explained in detail. The geometric mean criterion was derived by EPA scientists from epidemiological studies at beaches where the incidence of swimming related health effects (gastrointestinal illness rate) could be correlated with indicator bacteria densities. EPA’s recommended criteria reflect an
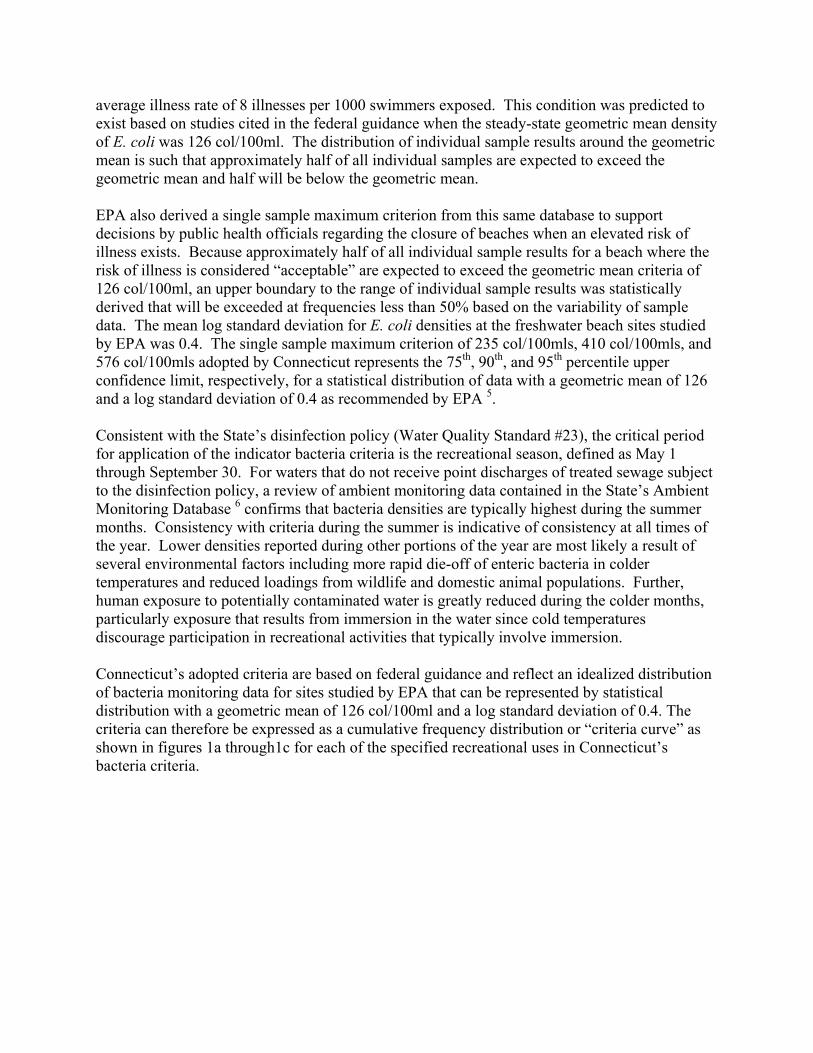
average illness rate of 8 illnesses per 1000 swimmers exposed. This condition was predicted to exist based on studies cited in the federal guidance when the steady-state geometric mean density of E. coli was 126 col/100ml. The distribution of individual sample results around the geometric mean is such that approximately half of all individual samples are expected to exceed the geometric mean and half will be below the geometric mean. EPA also derived a single sample maximum criterion from this same database to support decisions by public health officials regarding the closure of beaches when an elevated risk of illness exists. Because approximately half of all individual sample results for a beach where the risk of illness is considered “acceptable” are expected to exceed the geometric mean criteria of 126 col/100ml, an upper boundary to the range of individual sample results was statistically derived that will be exceeded at frequencies less than 50% based on the variability of sample data. The mean log standard deviation for E. coli densities at the freshwater beach sites studied by EPA was 0.4. The single sample maximum criterion of 235 col/100mls, 410 col/100mls, and 576 col/100mls adopted by Connecticut represents the 75th, 90th, and 95th percentile upper confidence limit, respectively, for a statistical distribution of data with a geometric mean of 126 and a log standard deviation of 0.4 as recommended by EPA 5. Consistent with the State’s disinfection policy (Water Quality Standard #23), the critical period for application of the indicator bacteria criteria is the recreational season, defined as May 1 through September 30. For waters that do not receive point discharges of treated sewage subject to the disinfection policy, a review of ambient monitoring data contained in the State’s Ambient Monitoring Database 6 confirms that bacteria densities are typically highest during the summer months. Consistency with criteria during the summer is indicative of consistency at all times of the year. Lower densities reported during other portions of the year are most likely a result of several environmental factors including more rapid die-off of enteric bacteria in colder temperatures and reduced loadings from wildlife and domestic animal populations. Further, human exposure to potentially contaminated water is greatly reduced during the colder months, particularly exposure that results from immersion in the water since cold temperatures discourage participation in recreational activities that typically involve immersion. Connecticut’s adopted criteria are based on federal guidance and reflect an idealized distribution of bacteria monitoring data for sites studied by EPA that can be represented by statistical distribution with a geometric mean of 126 col/100ml and a log standard deviation of 0.4. The criteria can therefore be expressed as a cumulative frequency distribution or “criteria curve” as shown in figures 1a through1c for each of the specified recreational uses in Connecticut’s bacteria criteria.
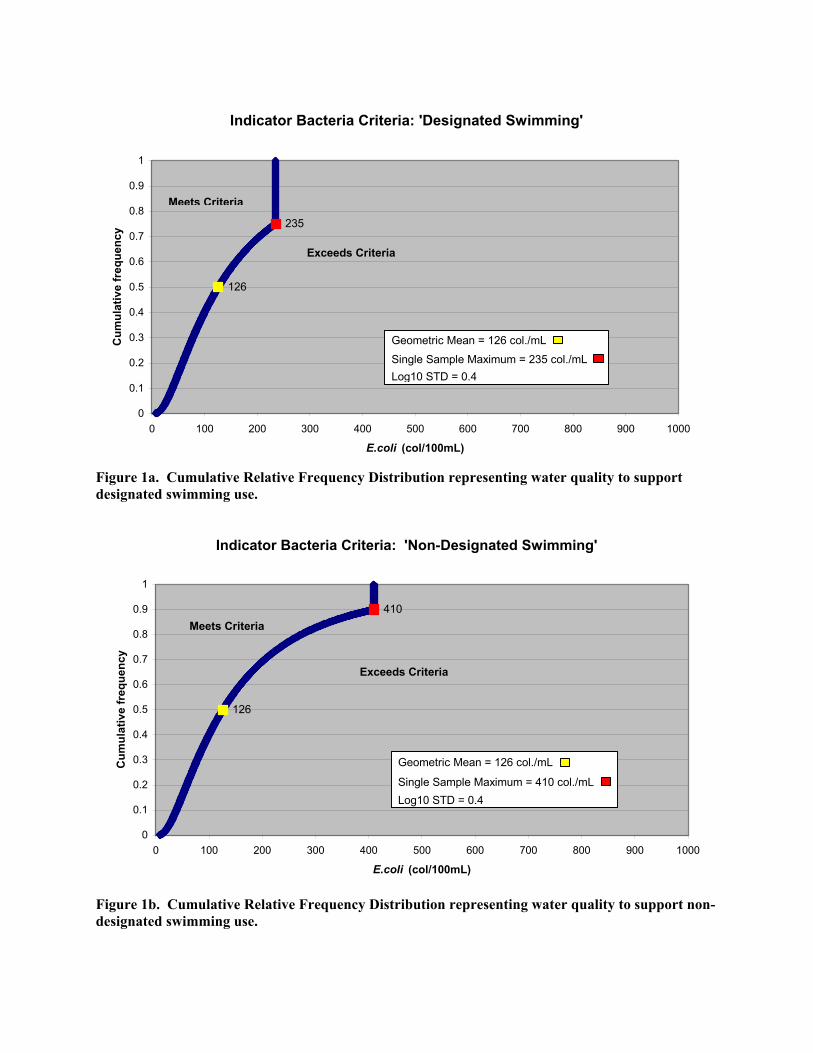
Indicator Bacteria Criteria: 'Designated Swimming'
235
126
0
0.1
0.2
0.3
0.4
0.5
0.6
0.7
0.8
0.9
1
0 100 200 300 400 500 600 700 800 900 1000
E.coli (col/100mL)
Cum
ulat
ive
freq
uenc
y
Meets Criteria
Exceeds Criteria
Log10 STD = 0.4Single Sample Maximum = 235 col./mL
Geometric Mean = 126 col./mL
Figure 1a. Cumulative Relative Frequency Distribution representing water quality to support designated swimming use.
Indicator Bacteria Criteria: 'Non-Designated Swimming'
126
410
0
0.1
0.2
0.3
0.4
0.5
0.6
0.7
0.8
0.9
1
0 100 200 300 400 500 600 700 800 900 1000
E.coli (col/100mL)
Cum
ulat
ive
freq
uenc
y
Meets Criteria
Exceeds Criteria
Log10 STD = 0.4Single Sample Maximum = 410 col./mL
Geometric Mean = 126 col./mL
Figure 1b. Cumulative Relative Frequency Distribution representing water quality to support non-designated swimming use.
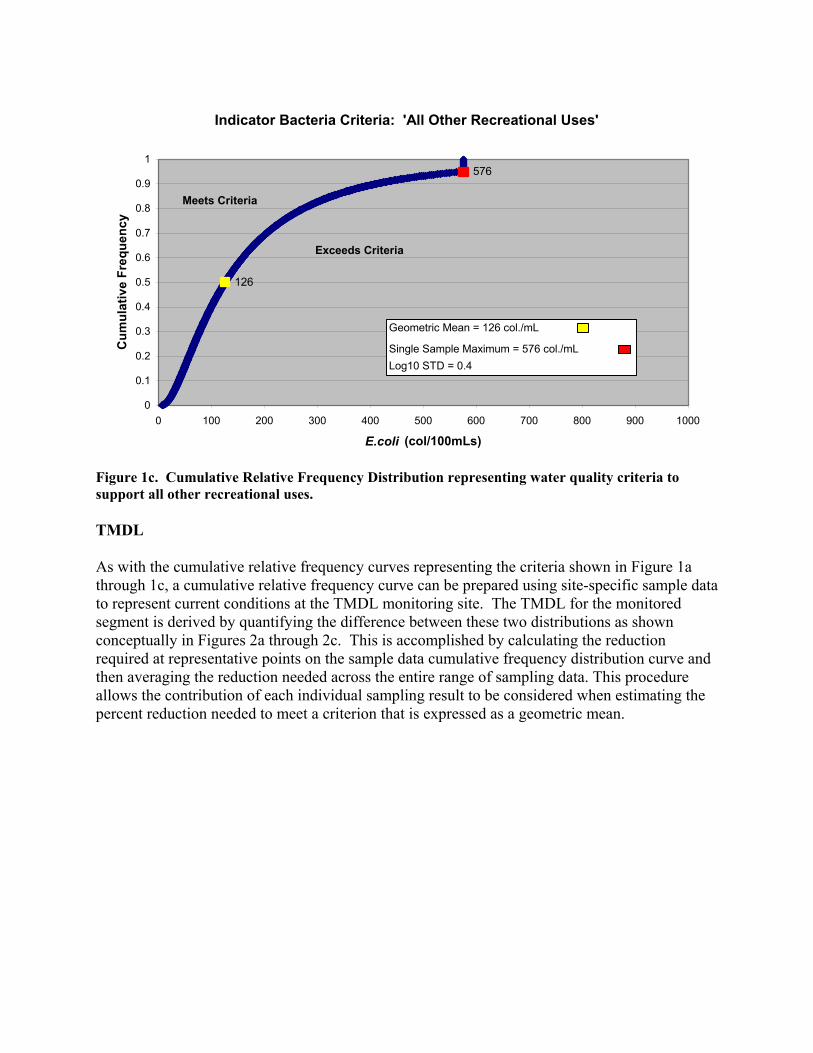
Indicator Bacteria Criteria: 'All Other Recreational Uses'
126
576
0
0.1
0.2
0.3
0.4
0.5
0.6
0.7
0.8
0.9
1
0 100 200 300 400 500 600 700 800 900 1000
E.coli (col/100mLs)
Cum
ulat
ive
Freq
uenc
y
Meets Criteria
Exceeds Criteria
Log10 STD = 0.4Single Sample Maximum = 576 col./mL
Geometric Mean = 126 col./mL
Figure 1c. Cumulative Relative Frequency Distribution representing water quality criteria to support all other recreational uses. TMDL As with the cumulative relative frequency curves representing the criteria shown in Figure 1a through 1c, a cumulative relative frequency curve can be prepared using site-specific sample data to represent current conditions at the TMDL monitoring site. The TMDL for the monitored segment is derived by quantifying the difference between these two distributions as shown conceptually in Figures 2a through 2c. This is accomplished by calculating the reduction required at representative points on the sample data cumulative frequency distribution curve and then averaging the reduction needed across the entire range of sampling data. This procedure allows the contribution of each individual sampling result to be considered when estimating the percent reduction needed to meet a criterion that is expressed as a geometric mean.
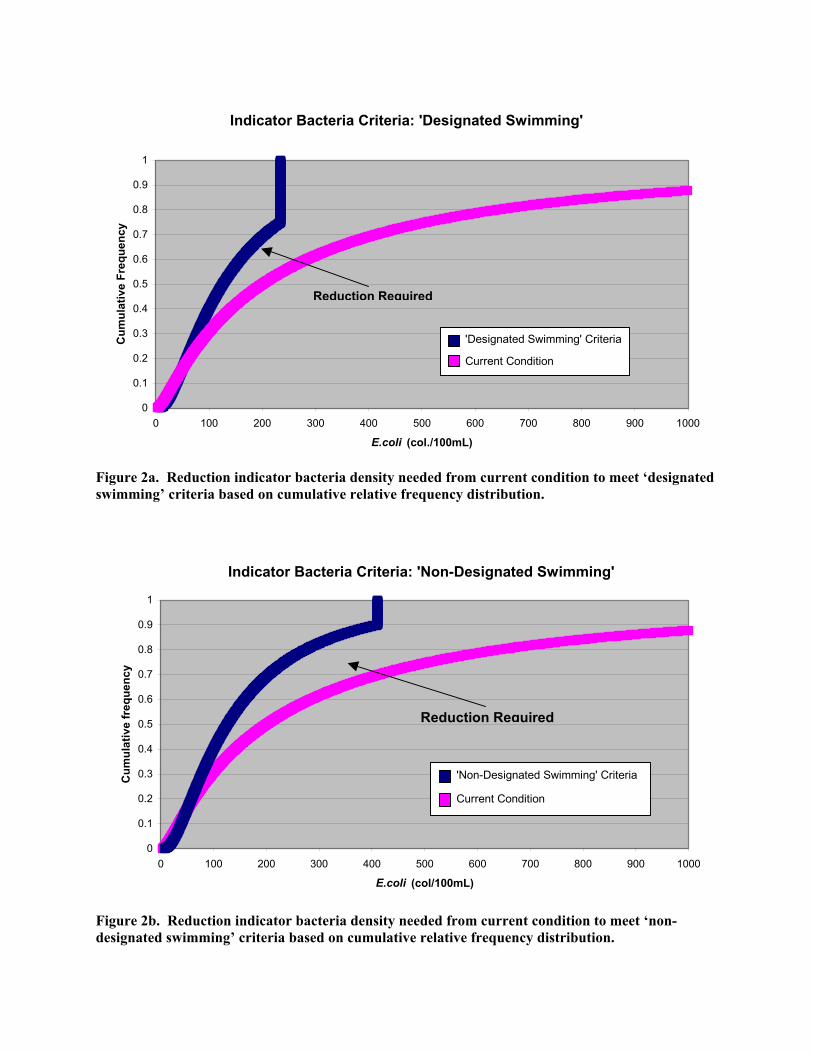
Indicator Bacteria Criteria: 'Designated Swimming'
0
0.1
0.2
0.3
0.4
0.5
0.6
0.7
0.8
0.9
1
0 100 200 300 400 500 600 700 800 900 1000
E.coli (col./100mL)
Cum
ulat
ive
Freq
uenc
y
Reduction Required
Current Condition
'Designated Swimming' Criteria
Figure 2a. Reduction indicator bacteria density needed from current condition to meet ‘designated swimming’ criteria based on cumulative relative frequency distribution.
Indicator Bacteria Criteria: 'Non-Designated Swimming'
0
0.1
0.2
0.3
0.4
0.5
0.6
0.7
0.8
0.9
1
0 100 200 300 400 500 600 700 800 900 1000
E.coli (col/100mL)
Cum
ulat
ive
freq
uenc
y
Reduction Required
Current Condition
'Non-Designated Swimming' Criteria
Figure 2b. Reduction indicator bacteria density needed from current condition to meet ‘non-designated swimming’ criteria based on cumulative relative frequency distribution.
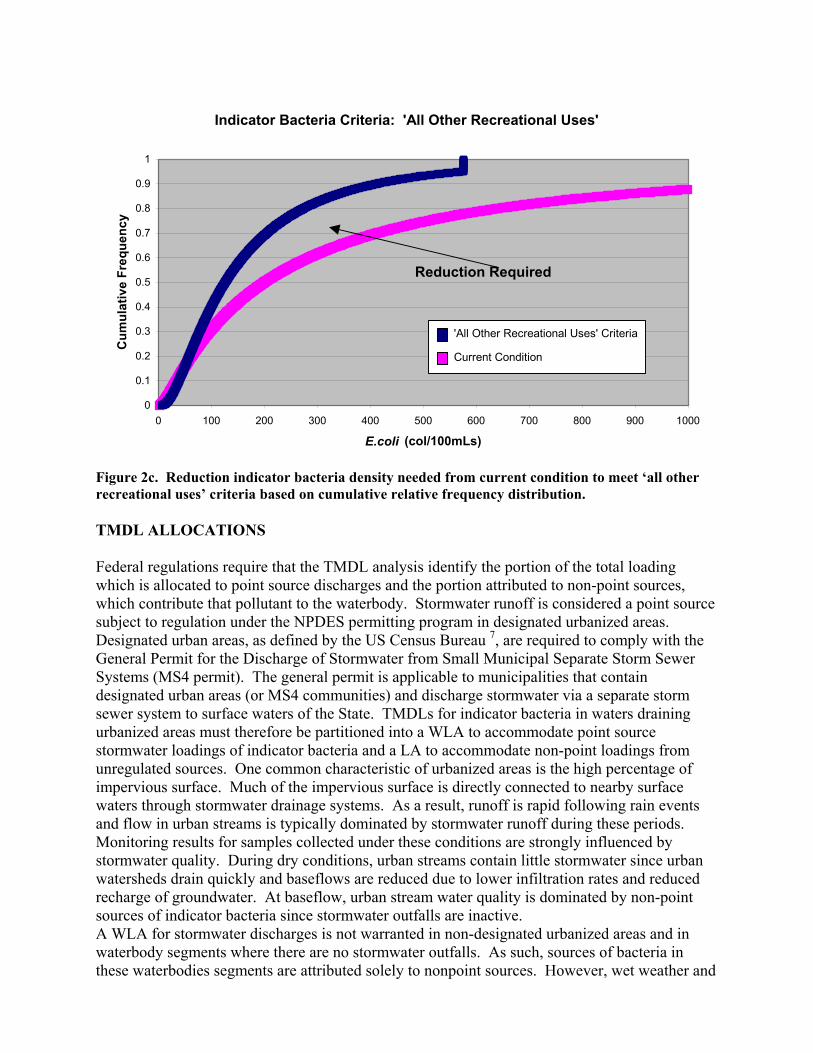
Indicator Bacteria Criteria: 'All Other Recreational Uses'
0
0.1
0.2
0.3
0.4
0.5
0.6
0.7
0.8
0.9
1
0 100 200 300 400 500 600 700 800 900 1000
E.coli (col/100mLs)
Cum
ulat
ive
Freq
uenc
y
Reduction Required
Current Condition
'All Other Recreational Uses' Criteria
Figure 2c. Reduction indicator bacteria density needed from current condition to meet ‘all other recreational uses’ criteria based on cumulative relative frequency distribution. TMDL ALLOCATIONS Federal regulations require that the TMDL analysis identify the portion of the total loading which is allocated to point source discharges and the portion attributed to non-point sources, which contribute that pollutant to the waterbody. Stormwater runoff is considered a point source subject to regulation under the NPDES permitting program in designated urbanized areas. Designated urban areas, as defined by the US Census Bureau 7, are required to comply with the General Permit for the Discharge of Stormwater from Small Municipal Separate Storm Sewer Systems (MS4 permit). The general permit is applicable to municipalities that contain designated urban areas (or MS4 communities) and discharge stormwater via a separate storm sewer system to surface waters of the State. TMDLs for indicator bacteria in waters draining urbanized areas must therefore be partitioned into a WLA to accommodate point source stormwater loadings of indicator bacteria and a LA to accommodate non-point loadings from unregulated sources. One common characteristic of urbanized areas is the high percentage of impervious surface. Much of the impervious surface is directly connected to nearby surface waters through stormwater drainage systems. As a result, runoff is rapid following rain events and flow in urban streams is typically dominated by stormwater runoff during these periods. Monitoring results for samples collected under these conditions are strongly influenced by stormwater quality. During dry conditions, urban streams contain little stormwater since urban watersheds drain quickly and baseflows are reduced due to lower infiltration rates and reduced recharge of groundwater. At baseflow, urban stream water quality is dominated by non-point sources of indicator bacteria since stormwater outfalls are inactive. A WLA for stormwater discharges is not warranted in non-designated urbanized areas and in waterbody segments where there are no stormwater outfalls. As such, sources of bacteria in these waterbodies segments are attributed solely to nonpoint sources. However, wet weather and
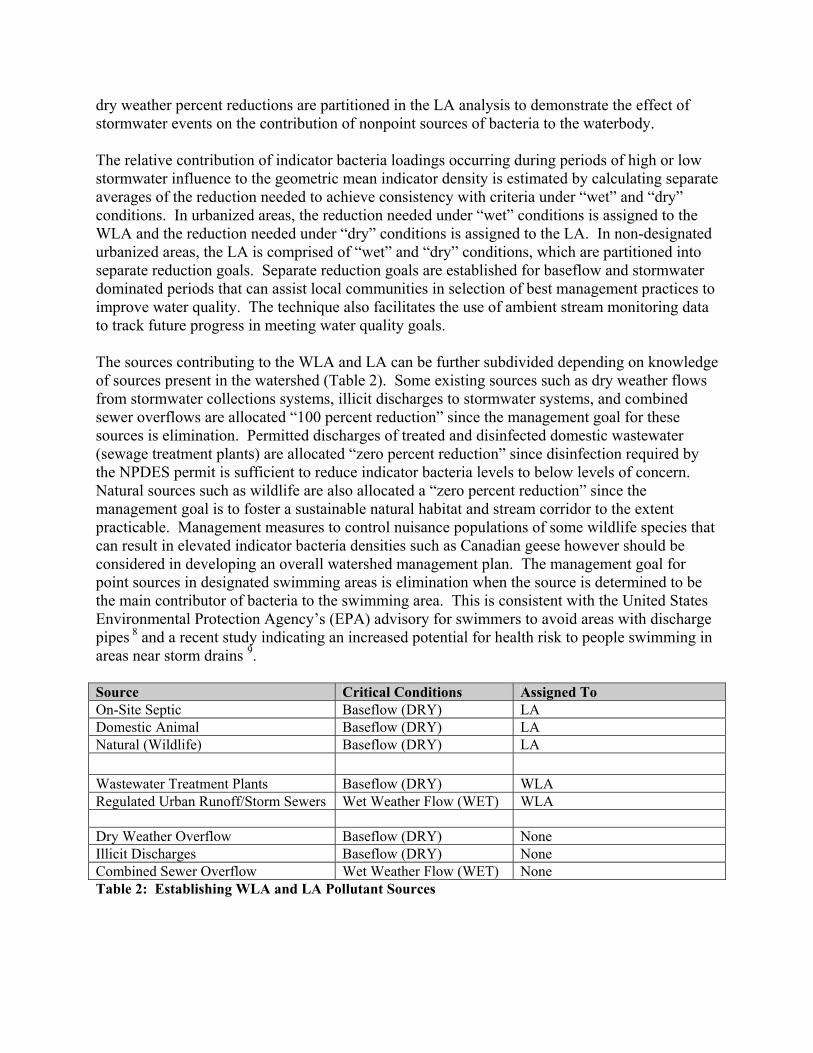
dry weather percent reductions are partitioned in the LA analysis to demonstrate the effect of stormwater events on the contribution of nonpoint sources of bacteria to the waterbody. The relative contribution of indicator bacteria loadings occurring during periods of high or low stormwater influence to the geometric mean indicator density is estimated by calculating separate averages of the reduction needed to achieve consistency with criteria under “wet” and “dry” conditions. In urbanized areas, the reduction needed under “wet” conditions is assigned to the WLA and the reduction needed under “dry” conditions is assigned to the LA. In non-designated urbanized areas, the LA is comprised of “wet” and “dry” conditions, which are partitioned into separate reduction goals. Separate reduction goals are established for baseflow and stormwater dominated periods that can assist local communities in selection of best management practices to improve water quality. The technique also facilitates the use of ambient stream monitoring data to track future progress in meeting water quality goals. The sources contributing to the WLA and LA can be further subdivided depending on knowledge of sources present in the watershed (Table 2). Some existing sources such as dry weather flows from stormwater collections systems, illicit discharges to stormwater systems, and combined sewer overflows are allocated “100 percent reduction” since the management goal for these sources is elimination. Permitted discharges of treated and disinfected domestic wastewater (sewage treatment plants) are allocated “zero percent reduction” since disinfection required by the NPDES permit is sufficient to reduce indicator bacteria levels to below levels of concern. Natural sources such as wildlife are also allocated a “zero percent reduction” since the management goal is to foster a sustainable natural habitat and stream corridor to the extent practicable. Management measures to control nuisance populations of some wildlife species that can result in elevated indicator bacteria densities such as Canadian geese however should be considered in developing an overall watershed management plan. The management goal for point sources in designated swimming areas is elimination when the source is determined to be the main contributor of bacteria to the swimming area. This is consistent with the United States Environmental Protection Agency’s (EPA) advisory for swimmers to avoid areas with discharge pipes 8 and a recent study indicating an increased potential for health risk to people swimming in areas near storm drains 9. Source Critical Conditions Assigned To On-Site Septic Baseflow (DRY) LA Domestic Animal Baseflow (DRY) LA Natural (Wildlife) Baseflow (DRY) LA Wastewater Treatment Plants Baseflow (DRY) WLA Regulated Urban Runoff/Storm Sewers Wet Weather Flow (WET) WLA Dry Weather Overflow Baseflow (DRY) None Illicit Discharges Baseflow (DRY) None Combined Sewer Overflow Wet Weather Flow (WET) None Table 2: Establishing WLA and LA Pollutant Sources
MARGIN OF SAFETY Federal regulations require that all TMDL analyses include either an implicit or explicit margin of safety (MOS). The analytical approach described here incorporates an implicit MOS. Factors contributing to the MOS include assigning a percent reduction of “zero” to sampling results that indicate quality better than necessary to achieve consistency with the criteria. The increase in loadings on those dates that could be assimilated by the stream without exceeding criteria is not quantified (as a negative percent reduction) and averaged with the load reductions needed on other sampling dates. Rather, this excess capacity is averaged as a zero value thereby contributing to the implicit MOS. The means of implementing the TMDL also contributes to the MOS. The loading reductions specified in the TMDL for regulated stormwater discharges and nonpoint sources must be sufficient to achieve water quality standards since confirmation that these reductions have been achieved will be based on ambient monitoring data documenting that water quality standards are met. Further, achieving compliance with the requirements of the MS4 permit includes elimination of high loading sources such as illicit discharges and dry weather overflows from storm sewer systems. Eliminating loads from these sources, as opposed to allocating a percent reduction equal to that given other sources, contributes to the implicit MOS. Further assurance that implementing the TMDL will meet water quality standards is provided by the iterative implementation required for compliance with the MS4 permit. This approach mandates that additional management efforts must be implemented until ambient monitoring data confirms that standards are met. Many of the best management practices that are implemented to address either wet or dry weather sources will have some degree of effectiveness in reducing loads under all conditions. For example, the TMDL allocates all the percent reduction needed to meet standards under wet weather conditions to the WLA. However, reductions resulting from best management practices implemented to reduce dry weather loads (LA) will provide some benefit during wet weather conditions as well. These reductions also contribute to the implicit MOS. DATA REQUIREMENTS Ambient monitoring data for a minimum of 21 sampling dates during the recreational season (May 1 – September 30) is required. Data collected at other times during the year are excluded from the analysis. In addition to data on indicator bacteria density, precipitation data for each sampling date and the week prior to the sampling is necessary. Sampling dates should be selected to insure that representative data is available for both wet and dry conditions. This may be accomplished most easily by selecting sampling dates without prior knowledge of the meteorological conditions likely to be encountered on that date. Data must reflect current conditions in the TMDL segment. The monitoring location where data is collected must therefore be sited in an area that can be considered representative of water quality throughout the TMDL segment. Data obtained under unusual circumstances may be excluded from the analysis provided the reason for excluding that data is provided in the TMDL. Potential reasons for excluding data may include such things as evidence that a spill, upset in wastewater treatment, or sewer line breakage occurred that resulted in a short-term excursion from normal conditions. Data that represent conditions during an extreme storm event that
resulted in widespread failure of wastewater treatment or stormwater best management practices may also be excluded. However, data for periods following typical rainfall events must be retained. Reasons for excluding any data must be provided in the TMDL Analysis. All data must be less than five years old. If circumstances in any watershed suggest that conditions have changed during the most recent five-year period, the analysis may be restricted to more recent data in order to be representative of the current status provided the minimum data requirements are met. Assurance of acceptable data quality must be provided. Typically, all data should be collected and results analyzed and reported pursuant to an EPA approved Quality Assurance Project Plan (QAPP). Data collected in the absence of a QAPP may be acceptable provided there is evidence that confirms acceptable data quality. ANALYTICAL PROCEDURE – TMDL 1. The E. coli monitoring data is ranked from lowest to highest. In the event of ties, monitoring results are assigned consecutive ranks in chronological order of sampling date. The sample proportion (p) is calculated for each monitoring result by dividing the assigned rank (r) for each sample by the total number of sample results (n): p = r / n 2. Next, a single sample criteria reference value is calculated for each monitoring result according to the specified recreational use (designated swimming, non-designated swimming, or all other) in a waterbody segment from the statistical distribution used to represent the criteria following the procedure described in steps 3 - 6 below: 3.
Designated Swimming Non-Designated Swimming
All Other Recreational Uses
If the sample proportion is ≥ 0.75, the single sample criteria reference value is equivalent to the single sample criterion adopted into the Water Quality Standards (235 col/100ml)
If the sample proportion is ≥ 0.90, the single sample criteria reference value is equivalent to the single sample criterion adopted into the Water Quality Standards (410 col/100ml)
If the sample proportion is ≥ 0.95, the single sample criteria reference value is equivalent to the single sample criterion adopted into the Water Quality Standards (576 col/100ml)
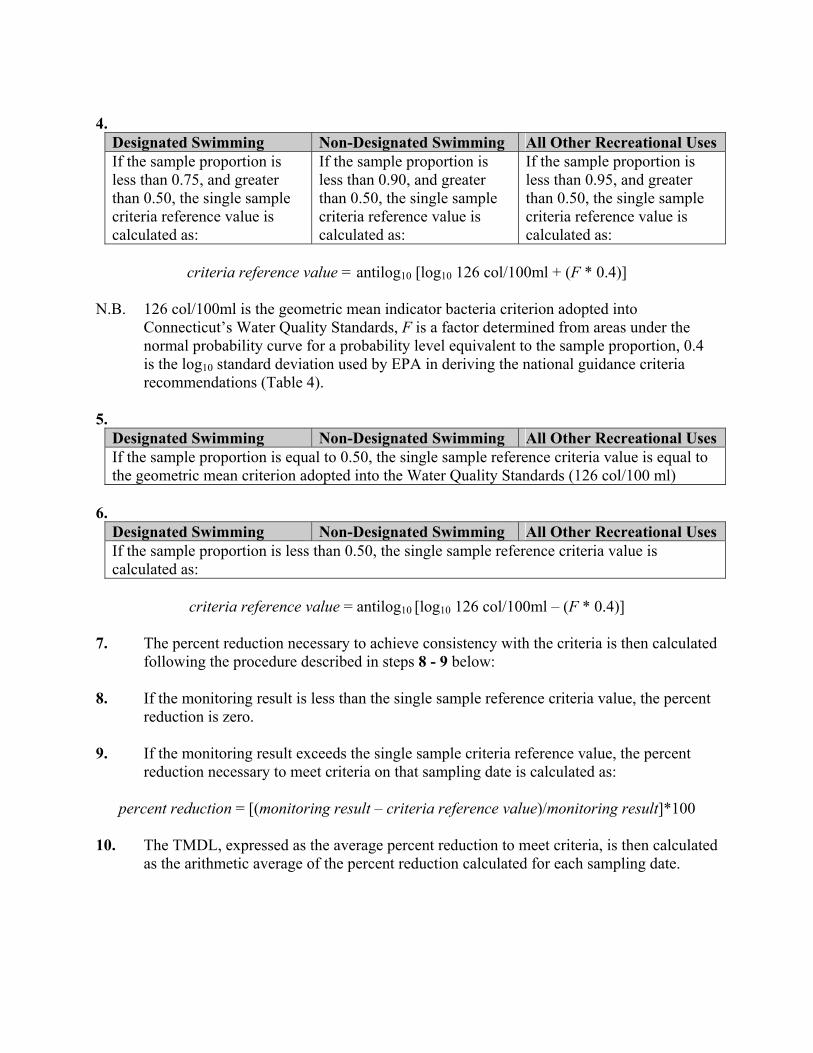
4.
Designated Swimming Non-Designated Swimming All Other Recreational Uses If the sample proportion is less than 0.75, and greater than 0.50, the single sample criteria reference value is calculated as:
If the sample proportion is less than 0.90, and greater than 0.50, the single sample criteria reference value is calculated as:
If the sample proportion is less than 0.95, and greater than 0.50, the single sample criteria reference value is calculated as:
criteria reference value = antilog10 [log10 126 col/100ml + (F * 0.4)]
N.B. 126 col/100ml is the geometric mean indicator bacteria criterion adopted into
Connecticut’s Water Quality Standards, F is a factor determined from areas under the normal probability curve for a probability level equivalent to the sample proportion, 0.4 is the log10 standard deviation used by EPA in deriving the national guidance criteria recommendations (Table 4).
5.
Designated Swimming Non-Designated Swimming All Other Recreational Uses If the sample proportion is equal to 0.50, the single sample reference criteria value is equal to the geometric mean criterion adopted into the Water Quality Standards (126 col/100 ml)
6.
Designated Swimming Non-Designated Swimming All Other Recreational Uses If the sample proportion is less than 0.50, the single sample reference criteria value is calculated as:
criteria reference value = antilog10 [log10 126 col/100ml – (F * 0.4)]
7. The percent reduction necessary to achieve consistency with the criteria is then calculated
following the procedure described in steps 8 - 9 below: 8. If the monitoring result is less than the single sample reference criteria value, the percent
reduction is zero. 9. If the monitoring result exceeds the single sample criteria reference value, the percent
reduction necessary to meet criteria on that sampling date is calculated as:
percent reduction = [(monitoring result – criteria reference value)/monitoring result]*100 10. The TMDL, expressed as the average percent reduction to meet criteria, is then calculated
as the arithmetic average of the percent reduction calculated for each sampling date.
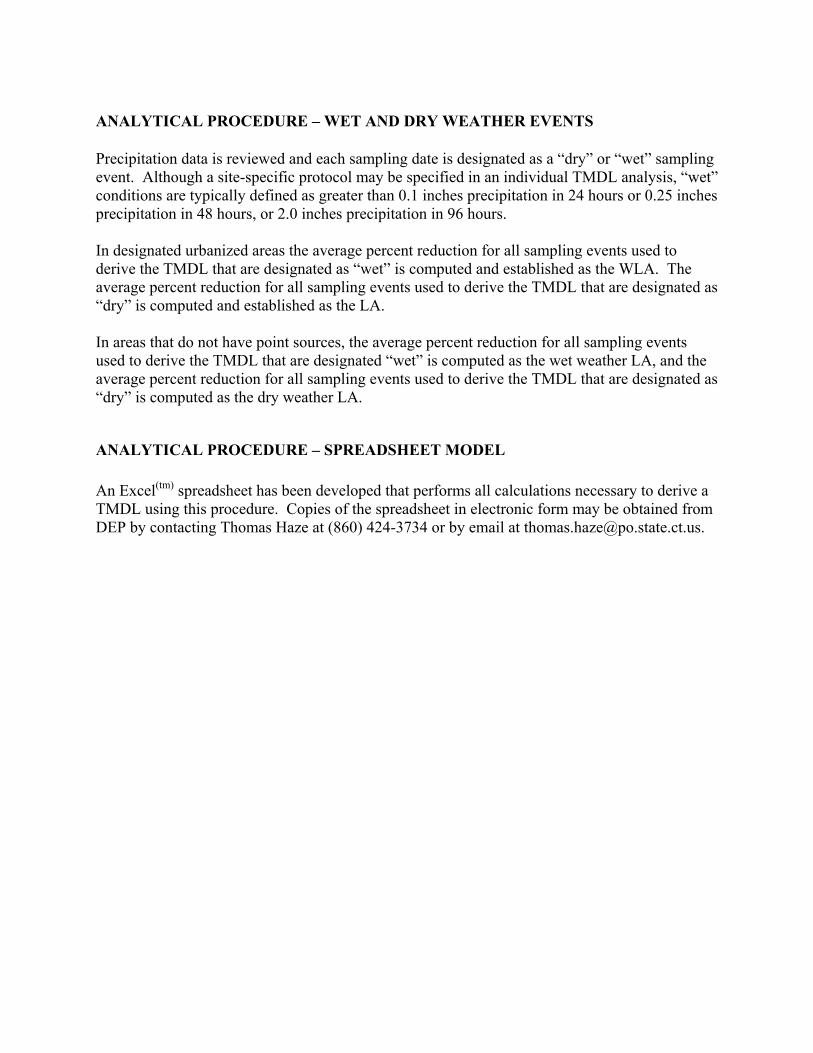
ANALYTICAL PROCEDURE – WET AND DRY WEATHER EVENTS Precipitation data is reviewed and each sampling date is designated as a “dry” or “wet” sampling event. Although a site-specific protocol may be specified in an individual TMDL analysis, “wet” conditions are typically defined as greater than 0.1 inches precipitation in 24 hours or 0.25 inches precipitation in 48 hours, or 2.0 inches precipitation in 96 hours. In designated urbanized areas the average percent reduction for all sampling events used to derive the TMDL that are designated as “wet” is computed and established as the WLA. The average percent reduction for all sampling events used to derive the TMDL that are designated as “dry” is computed and established as the LA. In areas that do not have point sources, the average percent reduction for all sampling events used to derive the TMDL that are designated “wet” is computed as the wet weather LA, and the average percent reduction for all sampling events used to derive the TMDL that are designated as “dry” is computed as the dry weather LA.
ANALYTICAL PROCEDURE – SPREADSHEET MODEL An Excel(tm) spreadsheet has been developed that performs all calculations necessary to derive a TMDL using this procedure. Copies of the spreadsheet in electronic form may be obtained from DEP by contacting Thomas Haze at (860) 424-3734 or by email at [email protected].
REFERENCES 1. 2004 List of Connecticut Water Bodies Not Meeting Water Quality Standards,
Connecticut Department of Environmental Protection, Adopted April 28, 2004, approved June 24, 2004.
2. General Permit for the Discharge of Stormwater from Small Municipal Separate Storm
Sewer Systems. Connecticut Department of Environmental Protection. Issued January 9, 2004.
3. Connecticut Consolidated Assessment and Listing Methodology for 305(b) and 303(d)
Reporting. Connecticut Department of Environmental Protection, April 2004. 4. Water Quality Standards. Connecticut Department of Environmental Protection. Effective
December 17, 2002. 5. Ambient Water Quality Criteria for Bacteria – 1986. U.S. Environmental Protection
Agency, Office of Water, January 1986. (EPA440/5-84-002). 6. Water Quality Database. Connecticut Department of Environmental Protection,
Monitoring and Assessment Program. 7. U.S. Census Bureau, March 2002. www.census.gov/geo/www/ua/ua_2k.html 8. Environmental Protection Agency, 2004. http://www.epa.gov/beaches/. 9. Haile, RW et al, 1999. The Health Effects of Swimming in Ocean Water Contaminated
by Storm Drain Runoff. Epidemiology. 10 (4) 355-363.
Appendix C
Status of Action Items included in the Norwalk River Watershed Action Plan (Pgs. 4-11, Supplement to the 1998 Norwalk River Watershed Action Plan, 2004)