Embed Size (px)
Citation preview

A Toroidal Imploding Detonation Wave Initiator for
Pulse Detonation Engines
S. I. Jackson∗ and J. E. Shepherd†
California Institute of Technology, Pasadena, CA 91125
Imploding toroidal detonation waves were used to initiate detonations in propane-air
and ethylene-air mixtures inside of a tube. The imploding wave was generated by an
initiator consisting of an array of channels filled with acetylene-oxygen gas and ignited
with a single spark. The initiator was designed as a low-drag initiator tube for use with
pulse detonation engines. In order to detonate hydrocarbon-air mixtures, the initiator
was overfilled so that some acetylene-oxygen spilled into the tube. The overfill amount
required to detonate propane-air was less than 2% of the volume of the 1-m-long, 76-mm-
diameter tube. The energy necessary to create an implosion strong enough to detonate
propane-air mixtures was estimated to be 13% more than that used by a typical initiator
tube, although the initiator was also estimated to use less oxygen. Images and pressure
traces show a regular, repeatable imploding wave that generates focal pressures in excess of
six times the Chapman-Jouguet pressure. A theoretical analysis of the imploding toroidal
wave performed using Whitham’s method was found to agree well with experimental data
and showed that, unlike imploding cylindrical and spherical geometries, imploding toroids
initially experience a period of diffraction before wave focusing occurs. A non-reacting
numerical simulation was used to assist in the interpretation of the experimental data.
∗Postdoctoral Scholar, Los Alamos National Laboratory, Los Alamos, NM 87545, Member AIAA†Professor, Aeronautics, Caltech MC 105-50, Pasadena, CA 91125, Member AIAA
1 of 40
Jackson et al., A Toroidal Imploding Detonation Wave Initiator for Pulse Detonation Engines

Nomenclature
A Area of the wave front
Cp Specific heat capacity at constant pressure
D Chapman-Jouguet detonation wave velocity
d Diameter
h Enthalpy
h0 Heat of formation
∆h0 Heat of reaction
L Length
M Mach number
P Pressure
Q Heat release
R Gas constant
Ri Radius of wavefront at initial conditions
Rs Varying wave radius
Rs Instantaneous velocity of wavefront
T Temperature
u Post-wave particle velocity
w Velocity in shock-fixed coordinates
V Volume
α Intermediate variable used in imploding wave analysis
γ Ratio of specific heats
θ Angle along toroidal wavefront
λ Cell size
ρ Density
φ Equivalence ratio
1 Initial gas condition
2 Post-wave gas condition
CJ Chapman-Jouguet detonation state
i Initial condition
d Initiator tube or driver property
toroidal Toroidal initiator property
2 of 40
Jackson et al., A Toroidal Imploding Detonation Wave Initiator for Pulse Detonation Engines
Introduction
Efficient detonation initiation of hydrocarbon-air (HC-air) mixtures is critical to the success of pulse det-
onation engine (PDE) technology.1 Existing engines2,3 rely on either deflagration-to-detonation transition
(DDT) or initiator tubes to detonate insensitive mixtures such as JP10-air or C3H8-air. Both of these
initiation schemes have drawbacks.
In DDT, induced flow turbulence is used to accelerate a weak flame to detonation.4 While the DDT process
permits detonation initiation with low energy sparks, it requires impractically long distances5,6 in the HC-
air mixtures. The presence of turbulence-inducing obstacles in the tube can also incur significant flow
losses.6
Initiator tubes are more appealing as they are able detonate HC-air mixtures over shorter distances. An
initiator tube is a tube filled with a sensitive (or easily detonable) mixture that is connected to a larger-
diameter tube filled with a less-sensitive mixture such as HC-air. Low-energy ignition and DDT are used to
create a detonation in the sensitive mixture over a short distance. That detonation then propagates out into
the larger tube and creates a decaying blast wave, which will develop into a detonation if the post-shock flow
is of sufficient overpressure and duration.7,8 To the frustration of airbreathing PDE designers, sensitization
of the initiator tube mixture is best accomplished by the addition of oxygen, requiring tanks of this gas to be
carried on any PDE system. To date, the performance of other sensitizing-additives has been found lacking.5
Thus, as initiator tubes remain prevalent as PDE initiators, efforts to decrease their oxygen dependence have
focused on increasing the transmission efficiency of the initiator tube through modification of its geometry.9,10
In this paper, work in this area is briefly summarized and followed by a detailed description of initiator tube
developments using shock wave focusing at the California Institute of Technology.
Increasing Transmission Efficiency with Shock Wave Focusing
In shock focusing, a collapsing shock or detonation wave generates a high-pressure and high-temperature
focal region by adiabatically compressing shocked gas as it flows into an ever-decreasing area.11–18 This
compression increases the post-detonation wave pressure higher than the Chapman-Jouguet (CJ) pressure,
resulting in an increasingly overdriven detonation wave.
The overdrive can be used to increase the overpressure of the shock transmitted from the initiator section
into the main tube of a PDE, and has been shown to increase the transmission efficiency.19 This technique
is dependent only on the geometry of the initiator wave and provides the means to dramatically increase
initiator effectiveness and reduce the amount of initiator gas used.
3 of 40
Jackson et al., A Toroidal Imploding Detonation Wave Initiator for Pulse Detonation Engines

Murray et al.19 experimentally noted an increase in transmission efficiency when the detonation in the
initiator was transmitted into the detonation tube through an annular orifice. With simulations, they
reasoned that the annular orifice generated an imploding toroidal wave in the test section. The high pressure
and temperature at the focus of the imploding toroid created a region of high energy density that was capable
of evolving into a self-sustaining detonation wave. In particular, they noted that the inclusion of the annular
orifice allowed successful detonation transmission for tubes with diameters 2.2 times smaller than tubes with
simple circular orifices.
Improving on this concept, a toroidal detonation initiator was developed10,20,21 to successfully detonate
HC-air mixtures in a 1-m-long tube with an imploding toroidal wave that was propagated into the HC-air
mixture from the tube walls. In order to generate the imploding wave, the toroidal initiator used a single
spark plug and a small amount of acetylene-oxygen gas.
More recent numerical22 and experimental23 and work investigated the ability of imploding toroidal shock
waves (rather than imploding detonation waves) to initiate detonations in HC-oxygen mixtures that are
highly diluted with nitrogen. Simulations by Li and Kailasanath22 of an imploding toroidal shock wave
driven by jets of air or fuel determined that an imploding annular jet with a Mach number of unity, a
pressure of 0.2 MPa, and a temperature of 250 K (corresponding to a total pressure and temperature of
0.38 MPa and 470 K, respectively) was able to initiate a detonation in a stoichiometric ethylene-air mixture
inside of a tube. However, subsequent experimental work23 with a design similar to that specified by Li and
Kailasanath22 was unable to initiate ethylene-air mixtures, even using sonic jets with total pressures and
temperatures in excess (1.68 MPa and 790 K) of those used in the numerical simulations.22
Through detailed analysis of the implosion process, simulations at Ohio State24,25 have shown that the
reflection of the primary explosion from the contact surface, which separates the gas initially in the tube
from the injected gas driving the implosion, creates a secondary implosion that is responsible for the creation
of the high pressures and temperatures that lead to detonation initiation in this geometry.
Witt et al.26 have also detonated ethylene-air mixtures from a 150 mJ spark in a distance of 1.47 m with shock
wave focusing. First, they used orifice plates to accelerate a flame in a tube and promote shock formation.
Once a shock of sufficient strength was developed, it was diffracted around a cone-shaped obstacle, creating
an imploding cylindrical wave downstream of the obstacle that was able to detonate the mixture.
Initiator Design
The toroidal initiator was created by mapping the geometry of a planar wave initiator27 to the surface
of an aluminum cylinder such that the exit of each channel lies on a circle with the channels exhausting
4 of 40
Jackson et al., A Toroidal Imploding Detonation Wave Initiator for Pulse Detonation Engines

inner sleeve
planar initiator
outer sleeve
(a)
(b)
(c)
Figure 1. The planar geometry (a) is mapped to a cylindrical geometry (b) to create the inner sleeve. The
inner sleeve is then inserted into the outer sleeve using shrink-fitting techniques (c).
inward. (A planar wave initiator is used to create a planar detonation front from a single ignition point and
an array of channels.) With this mapping, the metal substrate of the planar initiator became a cylinder
with the channels milled on its outer surface (Fig. 1). This inner cylinder or sleeve had an outer diameter
of 101.0 mm and an inner diameter of 76.2 mm, which formed the main tube. A second, 37.97-cm-long,
aluminum cylinder with inner and outer diameters of 100.9 mm and 139.7 mm respectively was used as the
outer sleeve shown in Fig. 1 to seal the open surface of channels machined on the inner sleeve. This seal
was accomplished by an interference fit, as the outer diameter of the inner sleeve was larger than the inner
diameter of the outer sleeve by 0.1 mm. Prior to assembly, the inner sleeve was cooled in liquid nitrogen
and the outer sleeve was kept at room temperature. The resulting thermal contraction decreased the outer
diameter of the inner sleeve so that it could be inserted into the outer sleeve. Once the temperature of the
5 of 40
Jackson et al., A Toroidal Imploding Detonation Wave Initiator for Pulse Detonation Engines

two pieces had equilibrated, the residual stress held the two sleeves together and maintained a tight seal at
the interface.
A ramp was placed at the exhaust of the secondary channels to focus the emerging wavelets inward toward
the axis of the device. This design allows the initiator to be incorporated into the walls of a PDE, minimizing
the drag losses by not obstructing the main tube flow path in PDE applications.
(b)(a)
Figure 2. The (a) static toroidal initiator and the (b) dynamic toroidal initiator.
Two toroidal initiators (Fig. 2) were constructed that were identical in all aspects except for their channel
geometries. A static initiator was designed and constructed as a prototype and a dynamic initiator was
constructed for PDE applications, which require sensitive driver gas injection into the small channels.27 All
results presented were obtained with the dynamic initiator, which shaped the implosion from six series of
square channels located on the inner cylinder. The dimensions of each channel series are shown in Table 1.
For visualization purposes, the channel geometry of the dynamic toroidal initiator has been mapped to
a planar surface in Fig. 3. Detailed design information on both initiators, including drawings, a parts
description, assembly instructions, and an example calculation of the shrink-fitting theory are available in
other work.21,28
During operation, the initiator channels were filled with a detonable mixture and a flame was ignited by
discharging a 46 mJ spark near the start of the primary channel. The flame front then underwent DDT due
to turbulence-inducing obstacles located immediately after the spark point, resulting in the emergence of a
detonation wave from the obstacle section. This detonation wave then continued to travel throughout the
6 of 40
Jackson et al., A Toroidal Imploding Detonation Wave Initiator for Pulse Detonation Engines

Table 1. Channel dimensions of the dynamic initiator shown in Fig. 2b.
Series Number of Channelnumber channels width
1 1 10.2 mm2 2 9.4 mm3 4 8.4 mm4 8 7.2 mm5 16 6.1 mm6 32 5.1 mm
obstacles
spark point
fill point
series 1
series 2
series 3
series 4
series 5
series 6
exit line
Figure 3. The channel geometry of the dynamic initiator (Fig. 2b) mapped to a planar surface.
device, branching off at each channel bifurcation. The distance between the spark point and the exit line
(Fig. 3) was identical for each channel such that detonation wavelets from the initial source simultaneously
passed the exhaust line and merged to form a ring-shaped detonation. A ramp located just past the exhaust
line deflected this detonation ring inwards towards its axis, sending an imploding detonation wave into the
tube as shown in Fig. 4. Depending on the sensitivity of the tube mixture, this wave would either continue
to propagate as an imploding detonation or shock wave.
Testing Modes
The toroidal initiator was tested with and without driver gas injection. Tests without gas injection were
intended to characterize the imploding wave created in the initiator, while tests with gas injection evaluated
7 of 40
Jackson et al., A Toroidal Imploding Detonation Wave Initiator for Pulse Detonation Engines

a)
spark point
obstacles
b)
channel
P1P2P3P4
productsreactants
detonation front
end flange
fill point
19 mm
ramp
Figure 4. Toroidal initiator a) inner sleeve and b) schematic of the assembled device in operation. In the
schematic, the gray areas are products, the white section is reactant, and the hatched areas are initiator
walls. Pressure transducers are labeled P1, P2, P3, and P4.
the effectiveness of the imploding wave at detonating HC-air mixtures. Each of the test configurations is
described below.
Operation without Gas Injection
During testing without dynamic gas injection, the toroidal initiator was filled with stoichiometric propane-
oxygen and ethylene-oxygen mixtures to 0.10 MPa initial pressure using the method of partial pressures.
A bellows pump was used to recirculate the gas throughout the initiator to ensure homogeneity. After
recirculation, the spark plug was discharged to ignite the mixture.
Pressure transducers and an intensified CCD camera were used to observe the imploding wave. The end flange
closest to the implosion could be instrumented with either pressure transducers or an optically clear window.
When the experiment was set up to record pressure transducer measurements, the flange was outfitted with
four pressure transducers (PCB 113A series) spaced along a radial line (Fig. 5). These pressure transducers
were spaced 10.7 mm apart with the central transducer located at the flange center and were mounted on a
surface that was 19 mm from the center of the exit of the initiator as shown in Fig. 4b. Pressure data was
recorded with two Tektronics TDS 460 oscilloscopes at a sampling rate of 2.5 MHz. Labview software was
8 of 40
Jackson et al., A Toroidal Imploding Detonation Wave Initiator for Pulse Detonation Engines
used to drive the oscilloscopes and process the traces.
pressure transducers
O-ring groove10.7 mm
P4
P3
P2
P1
Figure 5. A drawing of the end flange with the pressure transducer locations is shown. The central transducer
was a PCB model 113A24 and all other transducers were PCB model 113A26. The shaded region denotes
the 76-mm-diameter wetted area when the focusing ring is installed.
For optical access, the end flange containing the pressure transducers was replaced with a composite window
consisting of a thin sacrificial layer and a thicker structural portion. The structural portion was a 31.8-
mm-thick polycarbonate plate overlaid with a 6.35-mm-thick aluminum ring to to protect the polycarbonate
from the stress concentrations induced by the fastening bolts. The sacrificial layer was a 6.35-mm-thick
sheet of commercial glass sealed against the initiator via a 2.0-mm-thick Viton gasket. Previous testing20 had
determined that sacrificial glass windows were better able to withstand the heat generated by the combustion
without charring compared to polycarbonate windows. After approximately a dozen tests, the glass window
would develop cracks near the implosion focus, necessating window replacement. For image acquisition,
an intensified CCD (Princeton Instruments ITE/ICCD-576) camera was aligned with the centerline of the
initiator and positioned a short distance outside the viewing window. The camera was triggered by a pressure
transducer that was mounted at the exit line of the last series of channels.
Operation with Gas Injection
For tests with the gas injection, the initiator was attached to an extension tube to create a 1.0-m-long
test-section tube, with 0.4 m made up by the toroidal initiator. The extension tube contained pressure
transducers and ionization probes as shown in Fig. 6. Additional transducers were located on the flange near
the implosion focus. The facility was filled with stoichiometric ethylene-oxygen-nitrogen and propane-oxygen-
nitrogen test mixtures using the method of partial pressures and mixture homogeneity was accomplished by
gas circulation via a bellows pump. After mixing, a gas injection system29 injected an equimolar acetylene-
9 of 40
Jackson et al., A Toroidal Imploding Detonation Wave Initiator for Pulse Detonation Engines
P1
P2
P3 P4 P5
Ion Ion Ion Ion
0.44 m
1.01 m
0.19 m 0.19 m
0.15 m
initiator extension tube
spark plug fill port pressure transducers
bellows pump
implosion
Figure 6. A schematic and picture of the experimental setup used for initiation of HC-air mixtures. The
initiator is on the left; the extension tube is on the right. PCBs P3-P5 are spaced 19.0 cm apart. Ion probes
are spaced 15.0 cm apart.
oxygen mixture into the initiator channels for about 0.8 s, displacing the test mixture. Immediately following
gas injection, the spark plug was then discharged and pressure transducers and ionization probes located in
the toroidal initiator and tube detected the resulting combustion front. Pressure and ionization data were
recorded to a data acquisition system with a sampling rate of 1.0 MHz. No visualization was performed in
this configuration.
Results and Analysis
Toroidal Initiator without Gas Injection
Images obtained from testing with stoichiometric ethylene-oxygen mixtures without gas injection show a
repeatable and regular collapsing circular front. A series of images of the imploding wave are shown in
Fig. 7. The outermost black portion of each image is the initiator wall, which frames a 76-mm diameter
cross-section of the tube. In each image, the innermost circle corresponds to the collapsing detonation
front. In some images, a “flower-shaped” structure behind the collapsing front (between the innermost circle
and the initiator wall) is also visible. This structure is attributed to detonation wave reflection from the
window.
10 of 40
Jackson et al., A Toroidal Imploding Detonation Wave Initiator for Pulse Detonation Engines
a) b) c) d)
e) f) g) h)
i) j) k) l)
m) n) o) p)
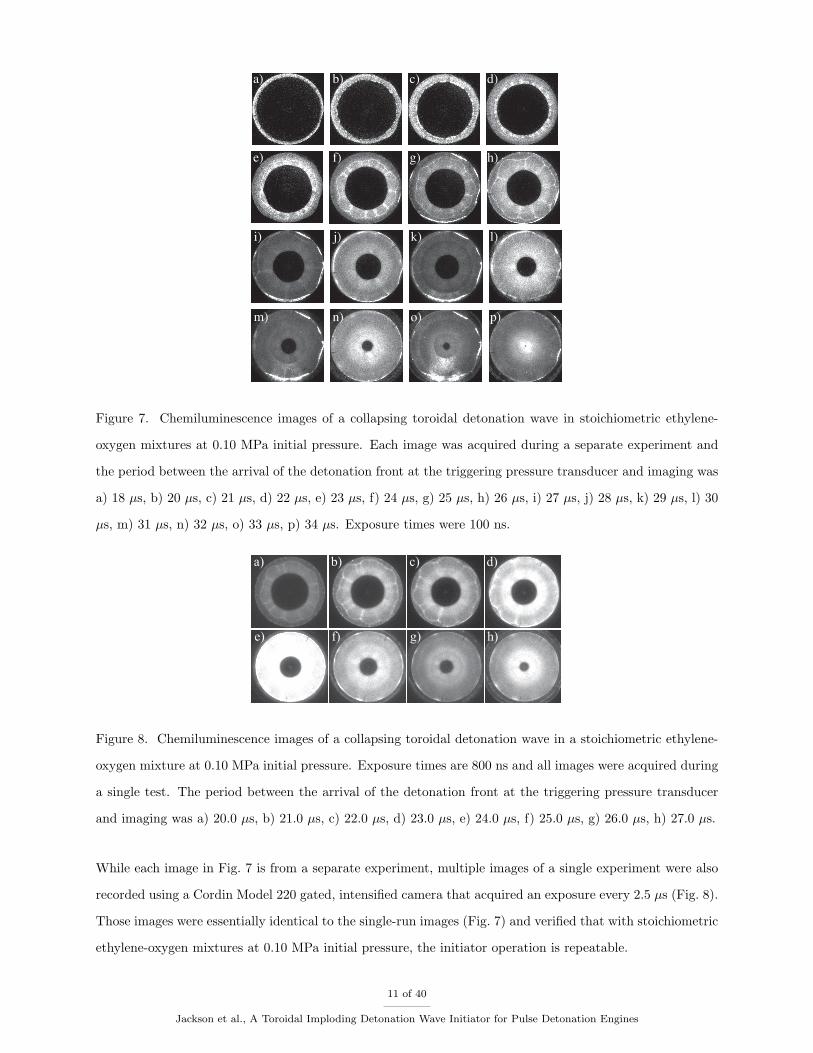
Figure 7. Chemiluminescence images of a collapsing toroidal detonation wave in stoichiometric ethylene-
oxygen mixtures at 0.10 MPa initial pressure. Each image was acquired during a separate experiment and
the period between the arrival of the detonation front at the triggering pressure transducer and imaging was
a) 18 µs, b) 20 µs, c) 21 µs, d) 22 µs, e) 23 µs, f) 24 µs, g) 25 µs, h) 26 µs, i) 27 µs, j) 28 µs, k) 29 µs, l) 30
µs, m) 31 µs, n) 32 µs, o) 33 µs, p) 34 µs. Exposure times were 100 ns.
a)
e)
b)
f)
c)
g)
d)
h)
Figure 8. Chemiluminescence images of a collapsing toroidal detonation wave in a stoichiometric ethylene-
oxygen mixture at 0.10 MPa initial pressure. Exposure times are 800 ns and all images were acquired during
a single test. The period between the arrival of the detonation front at the triggering pressure transducer
and imaging was a) 20.0 µs, b) 21.0 µs, c) 22.0 µs, d) 23.0 µs, e) 24.0 µs, f) 25.0 µs, g) 26.0 µs, h) 27.0 µs.
While each image in Fig. 7 is from a separate experiment, multiple images of a single experiment were also
recorded using a Cordin Model 220 gated, intensified camera that acquired an exposure every 2.5 µs (Fig. 8).
Those images were essentially identical to the single-run images (Fig. 7) and verified that with stoichiometric
ethylene-oxygen mixtures at 0.10 MPa initial pressure, the initiator operation is repeatable.
11 of 40
Jackson et al., A Toroidal Imploding Detonation Wave Initiator for Pulse Detonation Engines
Wave radius (cm)
Tim
e(µ
s)
0 1 2 3 415
20
25
30
35
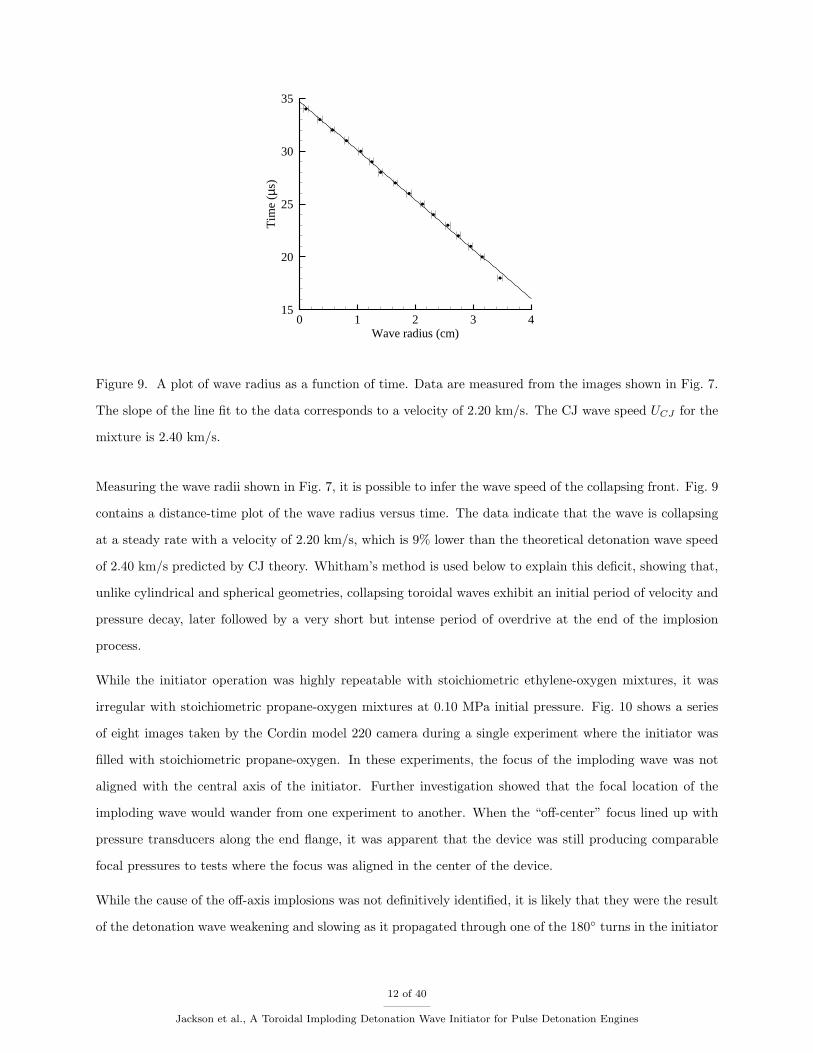
Figure 9. A plot of wave radius as a function of time. Data are measured from the images shown in Fig. 7.
The slope of the line fit to the data corresponds to a velocity of 2.20 km/s. The CJ wave speed UCJ for the
mixture is 2.40 km/s.
Measuring the wave radii shown in Fig. 7, it is possible to infer the wave speed of the collapsing front. Fig. 9
contains a distance-time plot of the wave radius versus time. The data indicate that the wave is collapsing
at a steady rate with a velocity of 2.20 km/s, which is 9% lower than the theoretical detonation wave speed
of 2.40 km/s predicted by CJ theory. Whitham’s method is used below to explain this deficit, showing that,
unlike cylindrical and spherical geometries, collapsing toroidal waves exhibit an initial period of velocity and
pressure decay, later followed by a very short but intense period of overdrive at the end of the implosion
process.
While the initiator operation was highly repeatable with stoichiometric ethylene-oxygen mixtures, it was
irregular with stoichiometric propane-oxygen mixtures at 0.10 MPa initial pressure. Fig. 10 shows a series
of eight images taken by the Cordin model 220 camera during a single experiment where the initiator was
filled with stoichiometric propane-oxygen. In these experiments, the focus of the imploding wave was not
aligned with the central axis of the initiator. Further investigation showed that the focal location of the
imploding wave would wander from one experiment to another. When the “off-center” focus lined up with
pressure transducers along the end flange, it was apparent that the device was still producing comparable
focal pressures to tests where the focus was aligned in the center of the device.
While the cause of the off-axis implosions was not definitively identified, it is likely that they were the result
of the detonation wave weakening and slowing as it propagated through one of the 180◦ turns in the initiator
12 of 40
Jackson et al., A Toroidal Imploding Detonation Wave Initiator for Pulse Detonation Engines

a) b) c) d)
e) f) g) h)
Figure 10. Chemiluminescence images of collapsing toroidal detonation wave in a stoichiometric propane-
oxygen mixture at 0.10 MPa initial pressure. Exposure times are 800 ns and all images were acquired during
a single test. The period between the arrival of the detonation front at the triggering pressure transducer
and imaging was a) 26.0 µs, b) 28.5 µs, c) 31.0 µs, d) 33.5 µs, e) 36.0 µs, f) 38.5 µs, g) 41.0 µs, h) 43.5 µs.
channels (shown at the left of Fig. 4a). In situations where the wave speed slowed more in one 180◦ turn
than in the other, the wavelets would emerge from each half of the initiator channels at different times,
creating the observed off-axis effect. This hypothesis is further supported by the observation that during
the collection of the imaging data, the initiator was aligned such that the wavelets coming from one 180◦
turn would emerge on the left half of the image and the wavelets from the other 180◦ turn would emerge
from the right half of the image and all observed off-axis implosions were skewed to the left or right of the
observation window. Additionally, the previously mentioned static initiator did not contain the 180◦ turns
and reliably produced regular implosions with propane-oxygen mixtures.20 The 180◦ turns only served to
make the dynamic initiator more compact and are not essential to the design. Elevating the initial gas
pressure would also increase the gas sensitivity and prevent wave failure through the 180◦ turn when testing
with propane-oxygen mixtures.
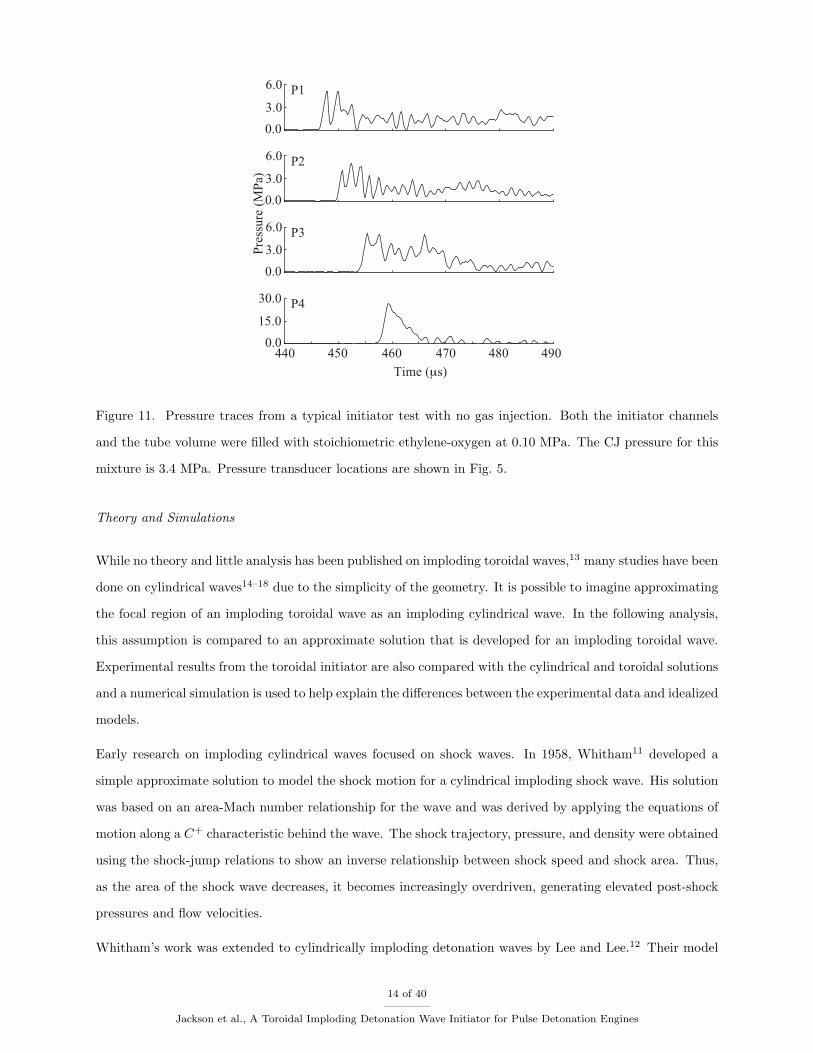
Pressure measurements from the end flange transducers indicate that the implosion is producing a high
pressure focal region. A typical trace is shown in Fig. 11 from the toroidal initiator filled with a stoichiometric
ethylene-oxygen mixture. Early in the implosion process, at P1, the peak wave pressure is 6.0 MPa, well
above the CJ pressure PCJ of 3.4 MPa. As the implosion process progresses, the pressure slightly decreases
at P2 to about 4.5 MPa, before increasing to 30.0 MPa (almost 10 times PCJ) at P4, the transducer closest to
the focus. It is important to note that since the wave front is not normal to the pressure measurement plane
the pressure measurements record the interaction of the imploding wave with the end flange wall and do
not directly measure the pressure behind the imploding wave along the implosion axis. The actual pressure
evolution along the implosion axis can be deduced by consideration of the toroidal wave geometry during
the implosion process, as is done below.
13 of 40
Jackson et al., A Toroidal Imploding Detonation Wave Initiator for Pulse Detonation Engines
0.0
3.0
6.0 P2
0.0
3.0
6.0 P1
0.0
3.0
6.0 P3
Pre
ssure
(M
Pa)
0.0
15.0
30.0 P4
450440 460 470 480 490
Time (μs)
Figure 11. Pressure traces from a typical initiator test with no gas injection. Both the initiator channels
and the tube volume were filled with stoichiometric ethylene-oxygen at 0.10 MPa. The CJ pressure for this
mixture is 3.4 MPa. Pressure transducer locations are shown in Fig. 5.
Theory and Simulations
While no theory and little analysis has been published on imploding toroidal waves,13 many studies have been
done on cylindrical waves14–18 due to the simplicity of the geometry. It is possible to imagine approximating
the focal region of an imploding toroidal wave as an imploding cylindrical wave. In the following analysis,
this assumption is compared to an approximate solution that is developed for an imploding toroidal wave.
Experimental results from the toroidal initiator are also compared with the cylindrical and toroidal solutions
and a numerical simulation is used to help explain the differences between the experimental data and idealized
models.
Early research on imploding cylindrical waves focused on shock waves. In 1958, Whitham11 developed a
simple approximate solution to model the shock motion for a cylindrical imploding shock wave. His solution
was based on an area-Mach number relationship for the wave and was derived by applying the equations of
motion along a C+ characteristic behind the wave. The shock trajectory, pressure, and density were obtained
using the shock-jump relations to show an inverse relationship between shock speed and shock area. Thus,
as the area of the shock wave decreases, it becomes increasingly overdriven, generating elevated post-shock
pressures and flow velocities.
Whitham’s work was extended to cylindrically imploding detonation waves by Lee and Lee.12 Their model
14 of 40
Jackson et al., A Toroidal Imploding Detonation Wave Initiator for Pulse Detonation Engines
showed good agreement with their experiments, demonstrating that a collapsing cylindrical detonation wave
is capable of producing pressures about 18 times higher than the normal CJ pressure.
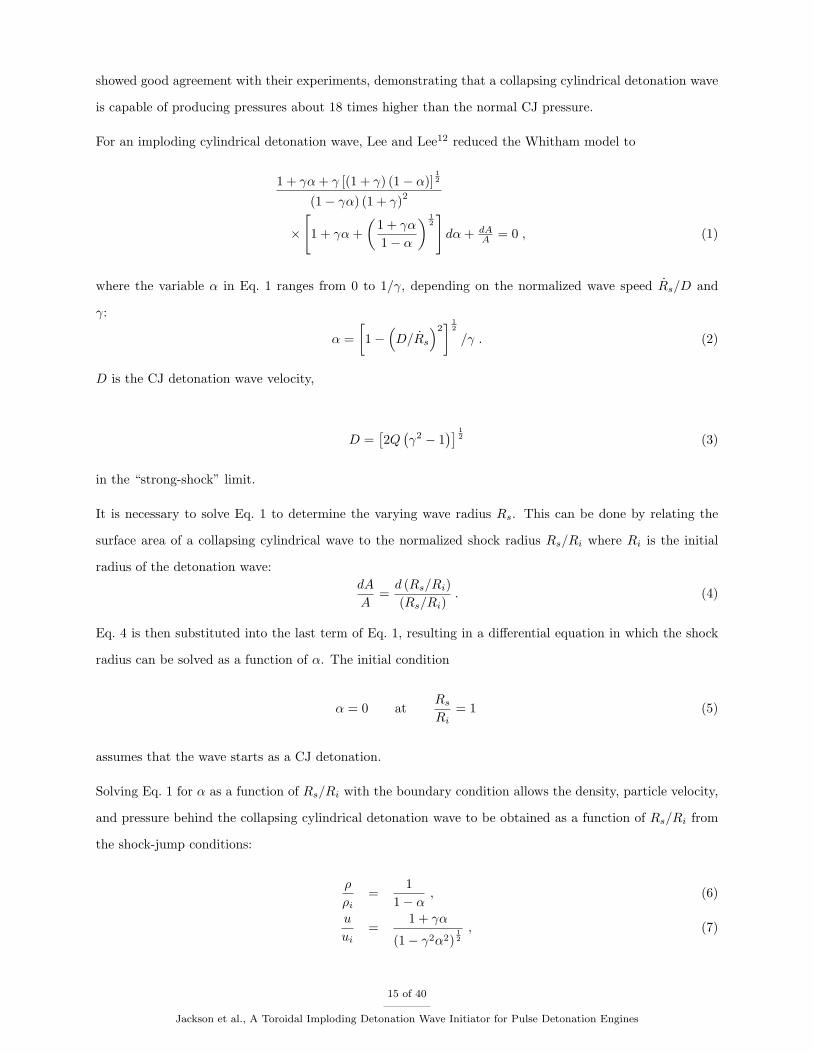
For an imploding cylindrical detonation wave, Lee and Lee12 reduced the Whitham model to
1 + γα + γ [(1 + γ) (1− α)]12
(1− γα) (1 + γ)2
×
[1 + γα +
(1 + γα
1− α
) 12]
dα + dAA = 0 , (1)
where the variable α in Eq. 1 ranges from 0 to 1/γ, depending on the normalized wave speed Rs/D and
γ:
α =[1−
(D/Rs
)2] 1
2
/γ . (2)
D is the CJ detonation wave velocity,
D =[2Q
(γ2 − 1
)] 12 (3)
in the “strong-shock” limit.
It is necessary to solve Eq. 1 to determine the varying wave radius Rs. This can be done by relating the
surface area of a collapsing cylindrical wave to the normalized shock radius Rs/Ri where Ri is the initial
radius of the detonation wave:dA
A=
d (Rs/Ri)(Rs/Ri)
. (4)
Eq. 4 is then substituted into the last term of Eq. 1, resulting in a differential equation in which the shock
radius can be solved as a function of α. The initial condition
α = 0 atRs
Ri= 1 (5)
assumes that the wave starts as a CJ detonation.
Solving Eq. 1 for α as a function of Rs/Ri with the boundary condition allows the density, particle velocity,
and pressure behind the collapsing cylindrical detonation wave to be obtained as a function of Rs/Ri from
the shock-jump conditions:
ρ
ρi=
11− α
, (6)
u
ui=
1 + γα
(1− γ2α2)12
, (7)
15 of 40
Jackson et al., A Toroidal Imploding Detonation Wave Initiator for Pulse Detonation Engines

p
pi=
11− γα
. (8)
It is also possible to modify the solution of Lee and Lee12 to approximate the motion of an imploding toroidal
detonation wave. Equations 1-3 and 6-8 remain valid as they are independent of geometry. However, Eq. 4
needs to be adapted to the toroidal geometry.
Rs
Ri
Δθ
Initiator wall
Detonation front
Figure 12. The geometry of the toroidal detonation front.
For the geometry in Fig. 12, the differential area of a central element of the imploding toroidal detonation
wave front initiated at a circle of radius Ri can be represented as
∆A = 2πRs ·∆θ (Ri −Rs) . (9)
This is the equation for a parabola. Thus, as Rs decreases (corresponding to an increase of the radius of
the torus), the differential surface area of a central element of the front first increases to a maximum at
Rs = Ri/2 and then decreases. With A represented as a function of Rs, dA/A can be represented in terms
of Rs/Ri. However, directly solving for the flow as was done in the cylindrical case is not possible without
an additional assumption that the detonation wave remains at CJ conditions throughout that region of
increasing area (Rs/Ri = 0 → 0.5). This is necessary since there are no solutions to the Whitham model
(Eq. 1) when Rs < D.
Experimentally, a CJ detonation wave emerging from the annulus at Ri could fail, becoming a non-reactive
shock as its area increases. While it is possible that the resulting decoupled shock and reaction zone could
reinitiate a detonation following the region of area increase, such analysis is beyond the scope of this dis-
cussion. Instead, it is assumed that the detonation is ideal and remains at the CJ condition throughout
the area-expansion process. Whitham’s method is applied only to the wave from Rs/Ri = 0.5 → 1. In this
16 of 40
Jackson et al., A Toroidal Imploding Detonation Wave Initiator for Pulse Detonation Engines
regime, area is decreasing, resulting in an overdriven (Rs > D) detonation wave.
In practice, the likelihood of failure depends on the speed of the emerging detonation and the thickness of
the detonation reaction zone as compared to the annular opening. While no results are available in the
literature for diffraction of waves through an annulus in the side wall of a tube, the results of Murray et
al19 for an annular opening at the end of a tube should be a useful guide. If the detonation is propagating
close to the CJ velocity, it will be transmitted as a detonation if the reaction zone length is sufficiently
small compared to the width of the annular opening. If the reaction zone is too thick in comparison to
the annular opening, failure of the detonation diffraction is anticipated. In the present case, the annular
opening is about 12.7 mm, which is 423 times larger than the estimated reaction zone length of 30 µm for
a stoichiometric propane-oxygen mixture at an initial pressure of 1 atm.30 Based on previous diffraction
experiments with slots,31 this should be adequate to achieve successful detonation. In terms of the more
conventional approach of using the detonation cell width to characterize the opening, the cell width is about
0.9 mm and the opening is, therefore, about 14 cell widths, greater than the six to ten cell widths previously
observed to be needed for successful diffraction from planar slots.31 Furthermore, in the experimental part
of this study, while the detonation wave was observed to propagate at a decreased velocity, it never failed
during the implosion.
Rs/Ri
P/P
i
0 0.2 0.4 0.6 0.8 1
1
2
3
4
56 cylindrical detonation γ = 1.29
toroidal detonation γ = 1.29toroidal initiator datanumerical simulation
Diffractiondominates
Implosiondominates
Figure 13. Comparison of imploding-cylindrical-detonation theory, imploding-toroidal-detonation theory,
toroidal-initiator data with ethylene-oxygen mixtures and numerical simulations of an imploding shock.
Experimental pressure data for the toroidal wave are plotted against the theoretical curves from Whitham’s
method for cylindrical and toroidal waves in Fig. 13. As exhibited in the experimental pressure history data
of Fig. 11, the pressure of the toroidal detonation wave initially decays before increasing to almost ten times
17 of 40
Jackson et al., A Toroidal Imploding Detonation Wave Initiator for Pulse Detonation Engines
PCJ during the final stages of focusing. Neither the cylindrical theory nor the toroidal theory exhibit a
pressure decay at any point during the focusing process, and the experimentally observed pressure decay is
at least partly due to the location of the measurement plane off the central axis of the toroidal implosion,
while the theoretical cylindrical and toroidal pressures were calculated on-axis. Thus, the measured pressures
show effects of off-axis diffraction and shock interaction with the end flange. The pressures measured by the
transducers on the end flange can be significantly influenced by the angle the detonation wave makes with
respect to the measurement surface. Only when the detonation front is normal to the wall can pressure be
considered representative of the actual pressure in the undisturbed waves, as waves not perpendicular to the
wall will form Mach stems or reflections.
A computer simulation of the experiment was used to help clarify this. A computationally simulated a strong
shock has been propagated through the geometry of the toroidal initiator with AMRITA.32 Although the
simulation is for non-reacting flow, it demonstrates how shock interaction with the pressure-sensing wall can
result in the observed pressures. A series of images of the simulated shock geometry and pressure profile along
the right wall is shown in Fig. 14. The simulation assumes an ideal gas in two-dimensional, axisymmetric
flow; the lower edge of each image is the axis of symmetry.
Figure 14. A series of images from numerical simulations showing an imploding toroidal shock wave. The
images are pseudo-schlieren visualizations of density gradients in the flow. The initial condition was a shock
wave with P2/P1 = 15 and T2/T1 = 10.
The simulation captures the experimental trend with initial pressure decay and the large increase in pressure
18 of 40
Jackson et al., A Toroidal Imploding Detonation Wave Initiator for Pulse Detonation Engines
toward the end of the focusing process. Figure 15 is a composite of several frames of the simulation showing
the leading shock at four different times along with the locations of the pressure transducers in the experiment.
Segments of the spatial pressure distribution are shown for each of these times. Note the interaction of the
shock with the wall at each location.
P1
P2
P3
P4
R
0 10 20 30 P/Pi
D
C
B
A
A
B
C
D
Figure 15. This composite image shows the shock front at four different times. The corresponding spatial
pressure profiles are also plotted. Transducers not to scale.
Initially, near transducer P1, the shock wave exhibits almost complete normal reflection from the wall.
Correspondingly, the measured pressure at location P1 is higher than the initial shock pressure. As the
wave progresses, the reflection develops into a small Mach stem at location P2, which results in a lower
measured pressure than was recorded at P1. As the Mach stem increases in size, the measured pressure at
the wall decreases. Between locations P3 and P4, the focusing processes, initially weak, begin to dominate
the system, and the pressure rises dramatically. Previous work18,33,34 has shown that the reflection type
will change from regular reflection to Mach reflection at the point where the included angle between the
wave front and the wall is about 55◦. For included angles between 0◦ and 55◦, the peak pressure will be
approximately 2.5 PCJ . Between 55◦ and 90◦, the pressure decreases monotonically to PCJ . Thus, this
variation of pressure with wave angle is responsible for the peak pressure values greater than the CJ values
as observed on the outer two transducers and the general trend from the four post-shock pressure histories
(Fig. 15) follows that of the post-shock pressures measured in the toroidal initiator (Fig. 13).
The measured pressure evolution can be thought of as a combination of three processes: detonation-wall
interaction, focusing effects, and diffraction. Initially, the wave diffracts and the detonation is not overdriven,
so focusing effects are weak. Detonation-wall interactions dominate the measured pressure, leading to the
apparent pressure decay. Later on in the process, after the Mach stem has developed, focusing processes
significantly overdrive the wave and dramatically increase the pressure. It is important to note that the
apparent pressure decay due to the wall reflection is not actually present along the focal axis of the device,
whereas the pressure increase due to focusing is present. Also, the experimental data points show that
the detonation wave experiences significantly less diffraction than the shock wave in the simulation, which
19 of 40
Jackson et al., A Toroidal Imploding Detonation Wave Initiator for Pulse Detonation Engines
supports the assumption that the reaction front remains coupled and continues to support the toroidal
detonation wave throughout the period of wave expansion.
Toroidal Initiator with Gas Injection
During testing, the amount of diluent in the tube mixture and the amount of injected acetylene-oxygen gas
were varied. The main criterion for successful initiation of the test-section mixture was that the experi-
mentally measured wave speed be not more than 10% below the CJ detonation velocity UCJ for the tube
mixture. The experimental uncertainty in the velocity measurements was less than 6%. If this criterion
was met, the peak pressure of the wave was examined to ensure that it was on the order of PCJ for the
test-section mixture. Additionally, ionization probe traces were used to verify that the shock wave measured
by the pressure transducers was accompanied by a tightly-coupled reaction zone. The measured wave speed
used in the above criterion was found by averaging the wave speeds measured between P3 and P4 and
between P4 and P5. (Transducer locations are shown in Fig. 6.)
The amount of acetylene-oxygen initiator gas used in each experiment is presented in terms of “initiator
overfill.” This refers to the amount of gas injected into the experiment that was in excess of the initiator
volume. A graphical interpretation of this concept is illustrated in Fig. 16. Negative values of initiator overfill
correspond to the initiator channels not being completely filled with initiator gas. The effective volume of
the initiator channels is 354 cc (21.6 in3), which accounts for the actual volume of the initiator (218 cc or
13.3 in3) and the volume of the tubing associated with the gas injection system (136 cc or 8.3 in3). The
total system volume of the initiator and the tube is 4980 cc (304 in3). An example of the overfill volume
calculation is provided for clarity: An overfill volume of 37% corresponds to the effective initiator volume in
addition to 37% of the actual initiator volume:
354 cc + 0.37(218 cc) = 435 cc . (10)
Thus, immediately after injection, the initiator is completely filled with driver gas and an additional 81 cc
of this acetylene-oxygen gas has spilled into the tube volume.
Example Data Traces
The result of each run was classified as either a successful initiation or a failed initiation depending on
whether a detonation was detected in the tube. To better characterize the wave created in the tube by the
initiator in the absence of combustion, calibration runs were also conducted with the tube filled with only
20 of 40
Jackson et al., A Toroidal Imploding Detonation Wave Initiator for Pulse Detonation Engines
initiator volume
test-section tube volume
overfill
volume
initiator volume
overfill
volume
Figure 16. The overfilled initiator gas shown as semicircular volumes in the test-section tube.
nitrogen.
Fig. 17 shows several pressure transducer and ionization probe traces from such a calibration run. Each
trace is labeled and corresponds to a transducer shown in Fig. 6. All ionization probe data are on the same
data acquisition channel. It is assumed that the ionization probes were triggered sequentially from left to
right as they are shown in Fig. 6. Pressure transducers P1 and P2 show data characteristic of the imploding
wave and measure pressures on the order of 10.0 MPa near the focal region. The implosion generates a shock
wave in the tube that decays as it propagates down the length of the tube. The flow behind the shock wave
has an overpressure of 0.4 MPa that agrees with the 0.65 km/s measured shock velocity corresponding to a
Mach 2 shock wave. The ionization probes indicate no ionization is present, as would be expected from an
inert mixture processed by a weak shock wave.
Fig. 18 shows data from a run with propane-air in the tube where a detonation was not successfully trans-
mitted from the initiator to the test-section mixture. Initiator overfill in this experiment was 24% of the
initiator volume. The data configuration is the same as with the previous example. Pressure transducer P1
shows a typical detonation wave that is overdriven to a very high pressure (20.0 MPa) as it implodes near
pressure transducer P2. Farther down the tube, a shock wave with an overpressure of 0.7 MPa is present.
As the wave propagates the length of the tube, it decays. The 0.7 MPa overpressure is higher than the
0.4 MPa overpressure measured in the calibration case where no combustion was present; however, it is far
below the CJ pressure of 1.9 MPa for stoichiometric propane-air mixtures. Inspection of the ionization probe
data shows the broad dips characteristic of a deflagration. Furthermore, the measured wave speeds are on
the order of 0.80-1.00 km/s, while CJ theory predicts UCJ to be 1.80 km/s. Thus, in this experiment, a
detonation did not propagate down the length of the tube. Instead, a shock wave was present, followed by
21 of 40
Jackson et al., A Toroidal Imploding Detonation Wave Initiator for Pulse Detonation Engines
-0.05
0.00
0.05
0.10
0 0.5 1.0 1.5 2.0 2.5 3.0
Ion
(V
)
Time (ms)
Ion
shot 355
0.00
0.20
0.40
P (
MP
a) P5
shot 355
0.00
0.20
0.40
P (
MP
a) P4
shot 355
0.00
0.20
0.40
P (
MP
a) P3
shot 355
0.00
5.00
10.00
P (
MP
a) P2
shot 355
0.00
2.00
4.00
P (
MP
a) P1shot 355
0 0.5 1.0 1.5 2.0 2.5 3.0
0 0.5 1.0 1.5 2.0 2.5 3.0
0 0.5 1.0 1.5 2.0 2.5 3.0
0 0.5 1.0 1.5 2.0 2.5 3.0
0 0.5 1.0 1.5 2.0 2.5 3.0
Figure 17. Pressure and ionization traces from a typical calibration shot. Test-section mixture was nitrogen
at 0.10 MPa initial pressure. Traces are labeled and correspond to locations shown in Fig. 6.
a deflagration.
Data from an experiment where a propane-air test-section mixture was successfully detonated are shown
in Fig. 19. The initiator overfill in the experiment was 37% of the volume of the initiator. The data
configuration is the same as in previous examples. Pressure transducers located near the implosion focus
register the same high-pressure focal region as in previous cases. This time, however, pressure transducer
P3 records the passing of a wave with an overpressure of 2.5 MPa which is 30% above PCJ . This wave
maintains its overpressure as it continues to propagate down the length of the tube. Measured wave speeds
of 1.81 km/s agree well with UCJ (1.80 km/s). Furthermore, the ionization probe traces show the sharp
spike characteristic of a detonation wave and also indicate that the combustion front is coupled with the
pressure wave.
22 of 40
Jackson et al., A Toroidal Imploding Detonation Wave Initiator for Pulse Detonation Engines

-0.80
-0.40
0.00
0 0.5 1.0 1.5 2.0 2.5 3.0 3.5
Ion
(V
)
Time (ms)
Ion
shot 362
0.00
0.50
1.00
1.50
P (
MP
a)
P5
shot 362
0.00
0.50
1.00
P (
MP
a) P4
shot 362
0.000.250.500.751.00
P (
MP
a) P3
shot 362
0.0
10.0
20.0
P (
MP
a) P2
shot 362
0.00
2.00
4.00
P (
MP
a) P1shot 362
0 0.5 1.0 1.5 2.0 2.5 3.0 3.5
0 0.5 1.0 1.5 2.0 2.5 3.0 3.5
0 0.5 1.0 1.5 2.0 2.5 3.0 3.5
0 0.5 1.0 1.5 2.0 2.5 3.0 3.5
0 0.5 1.0 1.5 2.0 2.5 3.0 3.5
Figure 18. Pressure and ionization traces from a typical failed initiation. Test-section mixture was stoichio-
metric propane-air at 0.10 MPa initial pressure. Traces are labeled and correspond to locations shown in
Fig. 6.
Transmission Limits
During investigation of the transmission efficiency of the initiator, the amount of initiator gas injected into the
device and the wall proximity to the implosion focus were varied. In order to vary the wall proximity to the
focus, two experimental configurations were used. In the first, the focus was only 19 mm from the end flange
(Fig. 20a). It was thought that the end flange would enhance the focusing by providing an additional surface
to reflect the waves. In order to remove this effect, separate tests were conducted with the initiator flipped
around such that the focus was about 0.4 m from the end flange (Fig. 20b). In experiments with the focus at
the end flange, stoichiometric propane-oxygen and ethylene-oxygen mixtures were used with varying amounts
of nitrogen dilution. Experiments with the focus far from the wall tested only stoichiometric propane-air
and ethylene-air mixtures. The results are separated into four categories according to wall proximity (wall
focusing or no wall focusing) and fuel used in the tube (propane or ethylene).
23 of 40
Jackson et al., A Toroidal Imploding Detonation Wave Initiator for Pulse Detonation Engines
-2.00
-1.00
0.00
0 0.5 1.0 1.5
Ion
(V
)
Time (ms)
Ion
shot 367
0.00
1.50
3.00
P (
MP
a) P5
shot 367
0.00
1.50
3.00
P (
MP
a) P4
shot 367
0.00
1.00
2.00
P (
MP
a) P3
shot 367
0.0
11.0
22.0
P (
MP
a) P2
shot 367
0.00
2.00
4.00
P (
MP
a) P1shot 367
0 0.5 1.0 1.5
0 0.5 1.0 1.5
0 0.5 1.0 1.5
0 0.5 1.0 1.5
0 0.5 1.0 1.5
Figure 19. Pressure and ionization traces from a typical successful initiation. Test-section mixture was
stoichiometric propane-air at 0.10 MPa initial pressure. Traces are labeled and correspond to locations
shown in Fig. 6.
Propane Mixtures with Focus Near Wall: Experimental results for the wave focus next to the end
flange wall with propane mixtures are shown in Table 2. The average wave velocity in the tube is compared
to the amount of diluent present in the test-section mixture (by mole percent). The table clearly shows that
as the amount of diluent is increased, it is necessary to inject more initiator gas in order to achieve a stronger
initiation event. The minimum amount of initiator gas that was able to initiate stoichiometric propane-air
was found to correspond to an initiator overfill of 37%. Experiments with propane-air are presented on a
separate plot (Fig. 21) in order to more clearly visualize the threshold. The wave appears to be overdriven
near the initiation threshold, hinting at the presence of a galloping wave, a phenomenon that occurs in
marginal detonations. Unfortunately, velocity measurements did not have sufficient resolution, and the tube
was not of sufficient length to study this effect in detail. Assuming the critical amount of gas overfill was
confined to a cylindrical slug at 0.1 MPa with the same diameter as the inside of the tube (76 mm), the
width of the cylinder would be 2.8 cm (1.1 in).
24 of 40
Jackson et al., A Toroidal Imploding Detonation Wave Initiator for Pulse Detonation Engines
approximately
36 cm(a)
(b)
Figure 20. Schematics illustrating the difference in the focal location of the imploding wave when the focus
was (a) near the end wall and (b) far from the end wall.
Table 2. Wave speed in the test-section tube as a function of test gas diluent and initiator overfill for
stoichiometric propane-oxygen-nitrogen mixtures with the focus near the end wall. The second row denotes
percent moles of nitrogen in the test-section tube mixture. The first column denotes initiator overfill. Values
of UCJ for each dilution listed on the bottom row. All other values are wave speeds (in km/s) measured in
the test-section tube. Wave speeds within 10% of UCJ are considered detonations. If a cell is filled with
“X”, no experiment was performed at that condition.
Diluent (mole %)Initiator Overfill 50% 60% 70% 75.8%
6% 2.08 0.94 0.81 X15% X 2.00 0.85 X24% X X 1.89 0.8432% X X X 0.8537% X X X 2.1641% X X X 1.8149% X X X 1.7861% X X X 1.7873% X X X 1.82UCJ 2.06 1.98 1.88 1.80
Ethylene Mixtures with Focus Near Wall: Results with ethylene fuel (Table 3) followed the same
trend as the propane cases; however, due to the increased sensitivity of ethylene-oxygen mixtures, less
initiator gas was required to initiate stoichiometric ethylene-air mixtures. The critical overfill value was
determined to be 6%. Fuel-air cases are plotted alone in Fig. 22. No overdriven waves are present in this
case. The critical amount of overfill corresponds to a disc of diameter 76 mm and width 0.45 cm (0.18 in).
25 of 40
Jackson et al., A Toroidal Imploding Detonation Wave Initiator for Pulse Detonation Engines
Initiator overfill (%)
Wav
esp
eed
(km
/s)
20 40 60 800.50
1.00
1.50
2.00
2.50
UCJ
Figure 21. Wave speed in the tube as a function of initiator overfill for stoichiometric propane-air mixtures
with the focus near the end wall. UCJ is 1.80 km/s.
Table 3. Wave speed in the test-section tube as a function of test gas diluent and initiator overfill for
stoichiometric ethylene-oxygen-nitrogen mixtures with the focus near the end wall. The second row denotes
percent moles of nitrogen in the test-section tube mixture. The first column denotes initiator overfill. Values
of UCJ for each dilution listed on the bottom row. All other values are wave speeds (in km/s) measured in
the test-section tube. Wave speeds within 10% of UCJ are considered detonations. If a cell is filled with
“X”, no experiment was performed at that condition.
Diluent (mole %)Initiator Overfill 50% 60% 70% 73.8%
-30% 2.05 1.98 0.63 0.59-7% X X X 0.833% X X X 0.855% X X X 0.866% X X X 1.8415% X X X 1.8561% X X X 1.79UCJ 2.06 1.98 1.87 1.82
Propane Mixtures with Focus Far from Wall: Increasing the distance of the end flange wall from
the focusing event necessitated more initiator gas being injected to detonate propane-air mixtures. Fig. 23
shows steadily increasing test-section wave velocities as initiator overfill is increased. The critical amount
26 of 40
Jackson et al., A Toroidal Imploding Detonation Wave Initiator for Pulse Detonation Engines

Initiator overfill (%)
Wav
esp
eed
(km
/s)
-30 -10 10 30 50 700.40
0.80
1.20
1.60
2.00UCJ
Figure 22. Wave speed in the tube as a function of initiator overfill for stoichiometric ethylene-air mixtures
with the focus near the end wall. UCJ is 1.83 km/s.
of overfill required for initiation of the propane-air mixture was found to be 73%. It should be noted that
while this is almost twice the critical overfill percent value for cases with the focus located next to the wall,
twice the amount of gas was not injected. Instead, it means that only twice the amount of overfill gas was
injected. The critical amount of overfill for this case corresponds to a cylinder of diameter 76 mm and a
width of 5.5 cm (2.2 in).
Initiator overfill (%)
Wav
esp
eed
(km
/s)
30 40 50 60 70 800.60
1.00
1.40
1.80
2.20
UCJ
Figure 23. Wave speed in the tube as a function of initiator overfill for stoichiometric propane-air mixtures
with the focus far from the wall. UCJ is 1.80 km/s.
27 of 40
Jackson et al., A Toroidal Imploding Detonation Wave Initiator for Pulse Detonation Engines
Ethylene Mixtures with Wave Focus Far from Wall: As with the propane cases, distancing the
end flange wall from the wave focus required more gas to be injected in order to initiate the ethylene-air
mixture in the tube (Fig. 24). The critical amount of overfill was found to be 20%, corresponding to a
cylinder with a diameter of 76 mm and a width of 1.5 cm (0.59 in). Table 4 summarizes the above results,
Initiator overfill (%)
Wav
esp
eed
(km
/s)
5 10 15 20 250.60
1.00
1.40
1.80
2.20
UCJ
Figure 24. Wave speed in the tube as a function of initiator overfill for stoichiometric ethylene-air mixtures
with the focus far from the wall. UCJ is 1.83 km/s.
comparing the amount of overfill necessary for detonation transmission from the initiator to the tube with
and without wall focusing for different fuels. Table 5 contains the length of the tube that the total amount
of gas used in the entire initiation process would fill, were it injected directly into the test-section tube
(Fig. 25), as would be done with a simple tube initiator.
Table 4. Critical amount of overfill necessary for detonation initiation with different experimental configu-
rations.
Near wall Far from wallC3H8–air 37% 73%C2H4–air 6% 20%
Table 5. Length of 76 mm tube that would be filled by critical amount of initiator gas were the gas injected
directly into the tube as is shown in Fig. 25.
Near wall Far from wallC3H8–air 9.3 cm 11.0 cmC2H4–air 7.8 cm 8.5 cm
28 of 40
Jackson et al., A Toroidal Imploding Detonation Wave Initiator for Pulse Detonation Engines

driver gas fill length
Figure 25. Accompanying schematic for Table 5, where critical amount of initiator gas (colored gray) is
injected into the test-section tube directly.
The proximity of the end flange wall is thought to reduce the amount of gas required for initiation by creating
symmetry and by promoting wave reflection. In a situation of perfect symmetry (Fig. 26), the wave focus
would occur at the end flange wall and the overfill volume would be half of the case where no end wall was
present. However, in the actual experiments with the wave focus near the end wall, the wave focus was still
19 mm away from the end wall, and only partial symmetry was achieved.
Figure 26. A schematic demonstrating the reduction in overfill volume due to symmetry. For pure symmetry,
the end flange wall would be located at the dashed line. The volume of overfill gas would be reduced to the
gas shaded gray, which is half of the volume required in the case where no end flange wall is present.
In addition to symmetry, the proximity of the end wall to the focus also enhances the initiation by providing
an additional surface from which the exploding waves can reflect. This additional level of confinement further
reduces the overfill volume. From Table 4, it can be seen that for propane-air mixtures, these two effects
reduced the overfill volume by half when the focus was near the wall. For ethylene-air mixtures, the overfill
reduction is even more dramatic; initiation near the wall requires only one-third the overfill volume compared
to situations where the focus was far from the end wall.
29 of 40
Jackson et al., A Toroidal Imploding Detonation Wave Initiator for Pulse Detonation Engines
-6.00
-3.00
0.00
0 1.0 2.0 3.0 4.0 5.0 6.0 7.0
Ion (
V)
Time (ms)
Ion
shot 382
0.00
0.40
0.80
P (
MP
a) P5
shot 382
0.00
0.40
0.80
P (
MP
a) P4
shot 382
0.00
5.50
11.00
P (
MP
a) P3
shot 382
0.00
0.50
1.00
1.50
P (
MP
a)
P1shot 382
0.00
0.50
1.00
1.50
P (
MP
a)
P2
shot 382
0 1.0 2.0 3.0 4.0 5.0 6.0 7.0
0 1.0 2.0 3.0 4.0 5.0 6.0 7.0
0 1.0 2.0 3.0 4.0 5.0 6.0 7.0
0 1.0 2.0 3.0 4.0 5.0 6.0 7.0
0 1.0 2.0 3.0 4.0 5.0 6.0 7.0
Figure 27. Pressure and ionization traces from a typical shock initiation experiment. Test-section mixture
was stoichiometric ethylene-air at 0.10 MPa initial pressure. Traces are labeled and correspond to locations
shown in Fig. 28.
P2
P3
P4 P5
Ion Ion Ion Ion
SparkP1
Figure 28. A schematic of the experimental setup used for attempted initiation of HC-air mixtures using an
imploding shock wave.
Initiation Attempts Using a Collapsing Shock Wave
The initiator was also used to generate an imploding shock wave in an attempt to initiate the test-section
mixture. Recent computational simulations by35 have suggested that it is possible to initiate JP10-air
mixtures using impulsively started jets of JP10 and air to create an annular shock wave.
30 of 40
Jackson et al., A Toroidal Imploding Detonation Wave Initiator for Pulse Detonation Engines
While this concept was experimentally studied in detail in later work,23 a preliminary investigation of this
notion was examined by conducting imploding shock experiments with the present setup. In order to generate
an imploding shock wave, the initiator was partially filled (roughly 30%–40%) with initiator gas. Detonation
of this gas propagated a shock wave followed by a deflagration through the channels of the device. This
shock wave then imploded at the focus, creating an imploding shock wave in the fuel-air mixture.
This technique was unsuccessful at initiating stoichiometric ethylene-air mixtures. Pressure traces from an
experiment where 41% of the initiator was filled with initiator mixture are shown in Fig. 27. The location
of the pressure and ionization probe traces from Fig. 27 are shown in the schematic in Fig. 28. The tube
mixture was ethylene-air.
Pressure transducer P2 shows a shock wave with an overpressure of 1.2 MPa that is propagated into the
test-section mixture from the initiator. As this wave implodes, the pressure measured near the focus is 10.0
MPa. Farther down the tube, pressure transducers P4 and P5 show a shock with an overpressure of 0.4
MPa. Measured wave speed in the tube is roughly 0.63 km/s while UCJ is 1.83 km/s. Thus, initiation
of the tube mixture was not successful as the pressure traces are similar to those previously presented for
the “failed initiation” case, where an imploding detonation wave (instead of a shock wave) was propagated
into the tube. In these experiments, the imploding shock wave was not of sufficient Mach number and the
post-shock flow was not of sufficient duration to initiate the ethylene-air mixture. This concept is addressed
more carefully using a different experimental geometry in other work.23
Experimental Uncertainty
The dominant source of experimental uncertainty was due to the sampling rate and finite size of the pressure
transducers used to detect the wave arrival in the experiments. The nominal wave velocities shown in the
previous sections were calculated by dividing the distance L between each transducer by the difference in
arrival times ∆t at each transducer, such that vnom = L/∆t. This calculation assumes that the wave was
centered on each transducer at the instant of data sampling.
In reality, this was likely not the case. Assuming that the transducer detects pressure changes over its entire
head of diameter d, a wave detected at the trailing edge of the first transducer and at the leading edge of
the second transducer has an actual velocity of
vmin =L− d
∆t(11)
but would be calculated to be traveling at vnom. This is the minimum wave velocity that could be mistaken
31 of 40
Jackson et al., A Toroidal Imploding Detonation Wave Initiator for Pulse Detonation Engines
for vnom. Alternatively, a wave detected at the leading edge of the first transducer and at the trailing edge
of the second transducer has an actual velocity of
vmax =L + d
∆t(12)
but would also be calculated to have a velocity of vnom. Thus, the range of values as a percent of vnom
isvmax − vmin
vnom× 100% =
2d
L× 100% (13)
where d was 5.54 mm and L was 0.19 m in the test section of these experiments, leading to a maximum
possible velocity uncertainty range of 5.8%. This uncertainty was assumed in all velocities derived from
transducer measurements. In reality, this is a conservative estimate as waves in this study travelled slower
than 2 mm/µs, while the data sampling rate in the test section was 1 MHz. Thus, it was unlikely that the
wave would even travel across half of the transducer head before being detected.
In the imaging experiments, the camera was triggered by the passage of the wave over a transducer located
at the exit of the initiator channels. The signal from the transducer was monitored by a delay generator,
which detected the arrival of the wave and triggered the CCD camera. The maximum uncertainty associated
with the delay and imaging system was less than 50 ns, thus the uncertainty associated with the imaging
times is ± 50 ns.
It is also possible to estimate the uncertainty in the initial mixtures used in the experiments. The maximum
leak rate of the experiment under vacuum was measured to be 20 Pa/min. After evacuation of the experiment,
five minutes was required to fill the vessel. Thus, a maximum air contamination of 100 Pa was possible
during the filling procedure. The experiment room was maintained at 295 ± 3 K. Assuming a worst case
compounding of uncertainty for the leak rates and temperature fluctuations, the uncertainty in the wave speed
UCJ as calculated by STANJAN37 does not exceed ± 2 m/s corresponding to 0.1% of the velocity.
Estimating the Effectiveness of the Toroidal Initiator
In this section, the effectiveness of the toroidal initiator will be compared to that of an initiator tube. Both
the amount of gas used and the chemical energy released to create the implosion will be used as figures of
merit in the comparison.
32 of 40
Jackson et al., A Toroidal Imploding Detonation Wave Initiator for Pulse Detonation Engines
Gas Usage of a Typical Initiator Tube
Little data is available for predicting the necessary initiator tube dimensions for equimolar acetylene-oxygen
mixtures, but recent work by Murray et al.8 has produced a model for stoichiometric acetylene-oxygen
initiator mixtures that predicts the necessary initiator tube dimensions based on an extensive data set. The
model predicts that for an initiator tube diameter to main tube diameter ratio of dd/d = 0.5, the initiator
tube length Ld necessary to initiate a stoichiometric propane-air test-section mixture with a cell size of λ =
50 mm (2 in) is approximately Ld/λ = 9 or Ld = 45.7 cm (18 in). For main tube diameter of d = 76 mm
(3 in) used in the toroidal initiator experiments, this corresponds to an initiator tube volume of
Vd =πd2
4Ld (14)
=π (0.75λ)2
49λ (15)
≈ 4λ3 (16)
= 524 cc or 32 in3. (17)
As previously determined, the toroidal initiator requires 434 cc of equimolar acetylene-oxygen gas to detonate
propane-air. The required mass of each gas is shown in Tab. 6.
Energy Input to the Toroidal Initiator
In the toroidal initiator, the implosion was created by detonating an equimolar acetylene-oxygen mixture. In
calculating the input energy Einp to the toroidal initiator, the chemical energy released is assumed to be the
dominant contribution to the initiation process and the energy input from mass flow will be neglected.
The 434 cc (26.5 in3) volume of equimolar acetylene-oxygen gas used by the toroidal initiator was initially at a
temperature of 295 K and a pressure of 0.10 MPa to initiate a detonation in a tube filled with stoichiometric
propane-air. The effective heat of reaction ∆h0 of the initiator gas mixture can be approximated in the
following fashion.36
The heat of reaction ∆h0 is defined as the difference in enthalpy of the gas, extrapolated from absolute zero
temperature
h1 = h01 + Cp1T1 (18)
h2 = h02 + Cp2T2 (19)
h01 − h02 = ∆h0 (20)
33 of 40
Jackson et al., A Toroidal Imploding Detonation Wave Initiator for Pulse Detonation Engines

where the subscript 1 denotes the initial gas state and subscript 2 is the state which has been processed by
the detonation wave.
Applying the above relations to the shock-jump condition for energy
h1 +12w2
1 = h2 +12w2
2 (21)
yields
∆h0 + Cp1T1 +12w2
1 = Cp2T2 +12w2
2 . (22)
Substituting
Pv = RT (23)
and
Cp =γ
γ − 1R (24)
into Eq. 22 and rearranging terms, the energy shock-jump condition for a perfect gas is obtained
∆h0 + R1T1
(γ1
γ1 − 1
) (1 +
γ1 − 12
M21
)(25)
= R2T2
(γ2
γ2 − 1
) (1 +
γ2 − 12
M22
).
Evaluating the post-detonation flow at the CJ surface will set M2 = 1. Solving for ∆h0, the heat of reaction
is
∆h0 = RCJTCJ
(γCJ
γCJ−1
) (1 + γCJ−1
2
)(26)
−R1T1
(γ1
γ1−1
) (1 + γ1−1
2 M2CJ
).
In this perfect gas, 2-γ, CJ detonation model, γ1 and γCJ are the ratios of specific heats of the gas at the
initial state and at the CJ surface respectively. TCJ is the temperature at the CJ surface and MCJ is the
Mach number of the CJ detonation wave.
STANJAN37 was used to perform the equilibrium calculations necessary to obtain the CJ parameters. For
acetylene-oxygen mixtures, the effective heat of reaction is shown in Fig. 29 as a function of equivalence
ratio φ. For the equimolar (φ = 2.5) mixtures used in the toroidal initiator, the effective heat of reaction
was determined to be ∆h0 = 7.07 MJ/kg of initiator mixture. Thus, the energy released by detonation of
34 of 40
Jackson et al., A Toroidal Imploding Detonation Wave Initiator for Pulse Detonation Engines
the initiator gas mixture for propane-air was found to be
Etoroidal = ∆h0 ρ1 Vtoroidal (27)
= 3.62 kJ .
4.0
5.0
6.0
7.0
8.0
0.5 1.0 1.5 2.0 2.5 3.0
Equivalence Ratio φ
Hea
t of
Rea
ctio
n (
MJ/
kg)
Figure 29. Effective heat of reaction of acetylene-oxygen mixtures as a function of equivalence ratio.
Since the Murray et al. model assumes a stoichiometric acetylene-oxygen initiator gas, the effective heat of
reaction of the mixture is found to be ∆h0 = 4.85 MJ. This corresponds to an energy release of
Ed = ∆h0 ρ1 Vd (28)
= 3.14 kJ . (29)
The amount of oxygen necessary for successful initiation is important in performance modeling for PDEs as
oxygen tanks will result in payload losses. The masses of fuel and oxygen initiator gas were also calculated
and are shown in Table 6. Examination of the amount of initiator gas used by each initiator reveals that
the toroidal initiator uses more fuel, but about half the amount of oxygen used by the model initiator tube.
Note that use of an acetylene-oxygen mixture on an actual engine would require storage systems for the
acetylene-oxygen gas, decreasing the efficiency of the system. The initiator mixture used in this study was
35 of 40
Jackson et al., A Toroidal Imploding Detonation Wave Initiator for Pulse Detonation Engines
Table 6. Critical values for a model initiator tube compared to the toroidal initiator.
Toroidal Initiator TubeEnergy 3.62 kJ 3.14 kJ
Mass C2H2 0.23 g 0.16 gMass O2 0.28 g 0.49 g
chosen only because it was part of an existing dynamic injection system.29 In practice, the possibility of
replacing the acetylene used for the initiation with the fuel for the primary tube could be explored in order
to eliminate the need for acetylene storage systems.
Designers of PDEs should note that the primary interest of this work was to evaluate the effectiveness of the
imploding detonation scheme as compared to DDT. Further effort would be required to evaluate the dynamic
initiator as a possible PDE initiator. While attempts were made during the design of these prototypes to
minimize the channel volume of the toroidal initiator, a systematic optimization of its gas usage was not
performed. Thus, it may be using more gas than is required to create the imploding waves. Initiator tubes,
on the other hand, have undergone significant optimization analyses7,8 to better understand the minimum
amount of gas required for detonation initiation.
Summary and Conclusions
A detonation initiation device has been presented that generates an imploding toroidal detonation wave using
an array of small channels filled with acetylene-oxygen gas and ignited with a single weak spark. The small
channels are incorporated inside the wall of the detonation tube to minimize both the size of the initiator and
its effect on the flow in the detonation tube. The imploding wave generated with this device is able to initiate
detonations in a tube filled with hydrocarbon-oxygen-nitrogen mixtures, including stoichiometric propane-air
and ethylene-air. The minimum volume of acetylene-oxygen gas required to detonate these hydrocarbon-air
mixtures was found to exceed the volume of the initiator channels and requiring overfilling of the initiator,
resulting in some gas spillage into the main tube. This overfill volume was found to increase as the sensitivity
of the mixture to be detonated decreased. Proximity of the end flange to the wave focus was found to reduce
the critical overfill volume by creating symmetry and providing surfaces for wave reflection. An analysis of
the effectiveness of the toroidal initiator estimated that it used 13% more chemical energy than a model
initiator tube19 to detonate propane-air mixtures. The same analysis determined that the toroidal initiator
used less oxygen but more hydrocarbon fuel than a model initiator tube. Optimization of the gas usage of
the initiator was not performed in this study and may result in increased initiator effectiveness.
An existing approximate solution12 for cylindrical and spherical imploding waves was adapted to the im-
36 of 40
Jackson et al., A Toroidal Imploding Detonation Wave Initiator for Pulse Detonation Engines
ploding toroidal geometry. Analysis of the imploding geometry established that the wave diffracts for the
first half of the toroidal implosion process, while focusing occurs during the last half. This diffraction is not
present in the cylindrical and spherical imploding geometries. In the approximate solution of the toroidal
imploding wave, it was assumed that the wave remained at the CJ velocity during the period of diffraction,
as experimental investigations31 have shown that diffraction will not significantly decay a wave that is suffi-
ciently wide relative to its cell size. This assumption was also supported by experimental observations of the
toroidal imploding wave in this study, which showed that only a small amount of diffraction occurred.
Imploding toroidal waves in ethylene-oxygen mixtures were observed to implode at a steady velocity 9%
lower than the CJ velocity of the mixture. Pressure measurements of the imploding wave taken off the
axis of symmetry were above the values of the approximate solution early in the diffraction process due to
the presence of regular reflection and Mach stems at the pressure-sensing wall. A non-reacting numerical
simulation of an imploding shock wave illustrated the reflection modes present at the wall and the postshock
pressure evolution of an imploding toroidal shock wave. Pressures measured at the focal axis ranged from 6
to 10 times PCJ .
The results are of interest to designers of pulse detonation engines in that they indicate that the locally high
pressures and temperatures associated with the toroidal implosion did not increase the effectiveness of the
toroidal initiator above that of a typical initiator tube. The study also provides experimental measurements
and an approximate solution for toroidal imploding detonation waves, which were not previously available.
Future work will focus on the ability of imploding shocks rather than detonations to initiate hydrocarbon-
oxygen-nitrogen mixtures.
Acknowledgments
This work was sponsored by the Office of Naval Research Grants “Pulse Detonation Engines: Initiation,
Propagation and Performance” and “Multidisciplinary Study of Pulse Detonation Engine,” by General Elec-
tric, and by the Department of Defense and Army Research Office through a National Defense Science and
Engineering Graduate Fellowship. The authors are grateful for the assistance of M. Grunthaner, J. Haggerty,
B. St. John, and F. Pintgen for their assistance with the design and testing of the toroidal initiator and to
H. Hornung for his assistance with the numerical simulation. The authors are also grateful to N. Nebeker
and P. Nagel at Cordin Scientific Imaging for use of their Model 220 CCD camera.
37 of 40
Jackson et al., A Toroidal Imploding Detonation Wave Initiator for Pulse Detonation Engines

References
1Roy, G., Frolov, S., Borisov, A., and Netzer, D., “Pulse Detonation Propulsion: Challenges, Current Status
and Future Perspective,” Progress in Energy and Combustion Science, Vol. 30, 2004, pp. 545–672.
2Brophy, C., Werner, S., and Sinibaldi, J., “Performance Characterization of a Valveless Pulse Detonation
Engine,” AIAA Paper 2003-1344, Jan. 2003.
3Schauer, F., Miser, C., Tucker, K., Bradley, R., and Hoke, J., “Detonation Initiation of Hydrocarbon-Air
Mixtures in a Pulse Detonation Engine,” AIAA Paper 2005-1343, Jan. 2005.
4Urtiew, P. and Oppenheim, A., “Experimental Observations of the Transition to Detonation in an Explosive
Gas,” Proceedings of the Royal Society of London Series A - Mathematical and Physical Sciences, Vol. 295,
1966, pp. 13–28.
5Higgins, A., Yoshinaka, P., and Lee, J., “Sensitization of Fuel-Air Mixtures for Deflagration to Detonation
Transition,” Proceedings of the International Colloquium on Control of Detonation Processes, Moscow,
Russia, July 4-7, 2000.
6Cooper, M., Jackson, S., Austin, J., Wintenberger, E., and Shepherd, J. E., “Direct Experimental Impulse
Measurements for Detonations and Deflagrations,” Journal of Propulsion and Power, Vol. 18, No. 5, 2002,
pp. 1033–1041.
7Kuznetsov, M., Dorofeev, S., Efimenko, A., Alekseev, V., and Breitung, W., “Experimental and Numerical
Studies on Transmission of Gaseous Detonation to a Less Sensitive Mixture,” Shock Waves, Vol. 7, No. 5,
1997, pp. 297–304.
8Murray, S., Zhang, D., and Gerrard, K., “Critical Parameters for Pulse Detonation Engine Pre-detonator
Tubes,” International Colloquium on the Dynamics of Explosions and Reactive Systems, Hakone, Japan,
July 27-August 14-7 2003.
9Brophy, C., Sinibaldi, J., and Damphousse, P., “Initiator Performance for Liquid-Fueled Pulse Detonation
Engines,” AIAA Paper 02-0472, Jan. 2002.
10Jackson, S., Grunthaner, M., and Shepherd, J., “Wave Implosion as an Initiation Mechanism for Pulse
Detonation Engines,” AIAA Paper 2003-4280, July 2006.
11Whitham, G., “On the Propagation of Shock Waves Through Regions of Non-Uniform Area or Flow,”
Journal of Fluid Mechanics, Vol. 4, 1958, pp. 337–360.
12Lee, J. and Lee, B., “Cylindrical Imploding Shock Waves,” The Physics of Fluids, Vol. 8, No. 12, 1965,
pp. 2148–2152.
38 of 40
Jackson et al., A Toroidal Imploding Detonation Wave Initiator for Pulse Detonation Engines

13Jiang, Z. and Takayama, K., “Reflection and Focusing of Toroidal Shock Waves from Coaxial Annular
Shock Tubes,” Computers and Fluids, Vol. 27, No. 5-6, 1998, pp. 553–562.
14Takayama, K., Kleine, H., and Gronig, H., “An Experimental Investigation of the Stability of Converging
Cylindrical Shock Waves in Air,” Experiments in Fluids, Vol. 5, No. 5, 1987, pp. 315–322.
15Devore, C. and Oran, E., “The Stability of Imploding Detonations in the Geometrical Shock Dynamics
(CCW) Model,” Physics of Fluids, Vol. A4, No. 4, 1992, pp. 835–844.
16Oran, E. and Devore, C., “The Stability of Imploding Detonations - Results of Numerical Simulations,”
Physics of Fluids, Vol. 6, No. 1, 1994, pp. 369–380.
17Terao, K., Akaba, H., and Shiraishi, H., “Spherically imploding detonation waves initiated by 2-step
divergent detonation,” Shock Waves, Vol. 4, No. 4, 1995, pp. 187–193.
18Akbar, R., Mach Reflection of Gaseous Detonations, Ph.D. thesis, Rensselaer Polytechnic Institute, Troy,
New York, 1997.
19Murray, S., Thibault, P., Zhang, F., Bjerketvedt, D., Sulmistras, A., Thomas, G., Jenssen, A., and Moen,
I., “The Role of Energy Distribution on the Transmission of Detonation,” Proceedings of the International
Colloquium on Control of Detonation Processes, Moscow, Russia, July 4-7, 2000.
20Jackson, S. and Shepherd, J., “Initiation Systems for Pulse Detonation Engines,” AIAA Paper 2002-3627,
July 2002.
21Jackson, S., Gaseous Detonation Initiation via Wave Implosion, Ph.D. thesis, California Institute of Tech-
nology, Pasadena, CA, 2005.
22Li, C. and Kailasanath, K., “Detonation Initiation by Annular-Jet-Induced Imploding Shocks,” AIAA
Journal of Propulsion and Power, Vol. 21, No. 1, 2005, pp. 183–186.
23Jackson, S. and Shepherd, J., “Detonation Initiation via Imploding Shock Waves,” AIAA Paper 2004-3919,
July 2004.
24Yu, S.-T. J., Wang, B., and He, H., “Direct Calculation of Wave Implosion for Detonation Initiation in
Pulsed Detonation Engines,” Proceedings of the Seventeenth ONR Propulsion Meeting, edited by G. Roy
and A. Ghoniem, Office of Naval Research, Arlington, VA 22217, June 2004, pp. 169–180.
25Wang, B., He, H., and Yu, S.-T., “Direct Calculation of Wave Implosion for Detonation Initiation in Pulsed
Detonation Engines,” AIAA Paper 2005-1306, Jan. 2005.
26de Witt, B., Ciccarelli, G., Zhang, F., and Murray, S., “Shock Reflection Detonation Initiation Studies for
Pulse Detonation Engines,” AIAA Paper 2004-3747, July 2004.
39 of 40
Jackson et al., A Toroidal Imploding Detonation Wave Initiator for Pulse Detonation Engines

27Jackson, S., Austin, J., and Shepherd, J., “Planar Detonation Wave Initiation in Large-Aspect-Ratio
Channels,” Accepted for publication in the AIAA Journal, 2006.
28Grunthaner, M., Jackson, S., and Shepherd, J., “Design and Construction of an Annular Detonation
Initiator,” GALCIT Technical Report 2001-005, Graduate Aeronautical Laboratories, California Institute of
Technology, Pasadena, CA, 2001.
29Austin, J., The Role of Instability in Gaseous Detonation, Ph.D. thesis, California Institute of Technology,
Pasadena, CA, 2003.
30Schultz, E. and Shepherd, J., “Validation of Detailed Reaction Mechanisms for Detonation Simulation,”
GALCIT Technical Report FM99-5, Graduate Aeronautical Laboratories, California Institute of Technology,
Pasadena, CA, 2000.
31Benedick, W., Knystautas, R., and Lee, J., “Large Scale Experiments on the Transmission of Fuel-Air
Detonations from Two-Dimensional Channels,” Dynamics of Detonations and Explosions, Vol. 94 of Prog.
Astro. Aero., AIAA, New York, 1984, pp. 546–555.
32Quirk, J., “AMRITA - A Computational Facility (for CFD Modelling),” VKI 29th CFD Lecture Series,
ISSN 0377-8312.
33Nettleton, M. A., Gaseous Detonations, Chapman and Hall, 1987.
34Meltzer, J., Shepherd, J. E., Akbar, R., and Sabet, A., “Mach Reflection of Detonation Waves,” Dynamics
of Detonations and Explosions, Vol. 153 of Prog. Astro. Aero., AIAA, New York, 1993, pp. 78–94.
35Li, C. and Kailasanath, K., “Detonation Initiation in Pulse Detonation Engines,” AIAA Paper 2003-1170,
Jan. 2003.
36Thompson, P., Compressible-Fluid Dynamics, McGraw-Hill, New York, 1988.
37Reynolds, W. C., “The Element Potential Method for Chemical Equilibrium Analysis: Implementation
in the Interactive Program STANJAN, Version 3,” Tech. rep., Dept. of Mechanical Engineering, Stanford
University, Stanford, CA, 1986.
40 of 40
Jackson et al., A Toroidal Imploding Detonation Wave Initiator for Pulse Detonation Engines