Embed Size (px)
Citation preview
A TOPSIS APPROACH TO EVALUATE THE FINANCIAL
PERFORMANCE OF SCHEDULED COMMERCIAL BANKS IN
INDIA
Dr.A.R.Rihana Banu*,Assistant Professor,Department of Commerce,
Avinashilingam Institute for Home Science and Higher Education for
Women, Coimbatore.
Dr.G.Santhiyavalli**,Professor,Department of Commerce,
Avinashilingam Institute for Home Science and Higher Education for
Women, Coimbatore.
Abstract
In a liberalizing economy, the banking and financial sector assume top
priority. Globalization requires adhering to standards and yardsticks that are universally
applicable. Although, prospects for the Indian banking industry remain optimistic, it is
being affected by the dynamic and highly competitive global banking environment. Hence,
the financial performance of the Scheduled Commercial Banks in India was assessed with
a view to explore the financial soundness of the banks using the multiple criteria decision -
making approach (TOPSIS). A total of 40 Scheduled Commercial Banks were selected on
the basis of the advances provided, amounting to a minimum of Rs.1,500 billions as on 31-
03-2014. The study covered a period of 16 years from 1999-2000 to 2014-2015. The data
was collected from the secondary sources and an expert opinion was obtained to assign the
weights to the ratios. The findings of the study indicated that the banks that effectively
reduce their risks garners more profit and upholds consistency in their business.
Keywords: Financial Performance, Efficiency, Business operations
Dr.A.R.Rihana Banu, Dr.G.Santhiyavalli, Int. J.Eco.Res, 2018, V9 i6, 71 – 92 ISSN:2229-6158
IJER – NOVEMBER - DEEMBER 2018 available online @ www.ijeronline.com
71

Introduction
The banking industry plays an important role in the economic development of a
country and is considered to be the most dominant segment of the financial sector. It plays
a crucial role in the attainment of macro-economic objectives, and acts as a catalyst for
socio-economic transformation by channelizing the savings into investments in different
sectors of the economy and fosters economic growth. The Scheduled Commercial Banks,
having massive share in the business operations have further diversified their activities to
cater to the needs of trade and industry.
The structure of Indian Banking Industry is vibrant since the reforms in 1991. The
financial sector reforms stirred the banking industry from a regulated arrangement to a
deregulated market economy, and have brought many private and foreign banks into the
Indian banking scenario. The economic development through liberalization and
globalization augmented the intermediation role of the banks. The expansion of
international integration enabled Indian banks to explore global markets, and deregulation
induced banks to explore new business opportunities. This increased the scope and
significance of the Indian banking industry. The WTO agreement in 2002 is of substantial
importance where the economy grew exponentially, not just by number but also by
magnitude. Many innovative financial products were introduced in the domestic financial
market due to the increasing international trade and competitive edge among the banks.
In the modern set up, the banks have stepped into various allied businesses like
merchant banking, housing finance, factoring, leasing, mutual funds, venture capital,
portfolio management, stock trading, etc. Therefore, the banks are no further considered as
dealers in money but as the leaders of development. The sustainability and the financial
stability of the banks strongly rely more on the management ability and innovative
strategies for facing both the physical and human challenges that wait ahead in the future.
Financial performance analysis is a process of synthesis and summarization of
financial and operative data with a view to get an insight into the operative activities of a
business enterprise. The banking system which constitutes the core of the financial sector
plays a substantial role in transmitting monetary policy impulses to the entire economic
Dr.A.R.Rihana Banu, Dr.G.Santhiyavalli, Int. J.Eco.Res, 2018, V9 i6, 71 – 92 ISSN:2229-6158
IJER – NOVEMBER - DEEMBER 2018 available online @ www.ijeronline.com
72

system. Thus, the performance evaluation indicates the strength and weakness of the banks
and influences the growth of the economy.
The performance of the commercial banks is influenced by the globalization,
competition and volatile market dynamic pressures. With the purpose to improve the
profitability, the banks are under pressure to efficiently manage their risks related with
their business. Moreover, the banks are under obligation to protect their stakeholders’
interest, besides meeting their regulatory requirements. Hence, an evaluation at all the
financial aspects having an effect on their operations, enables the management to
effectively deploy their resources, make efficient use of funds and thereby reduce their
risks. This approach of the banks ensures higher productivity by controlling the costs and
consecutively improves the overall profitability of the banks.
Objective of the Study
The prime objective of this research is to evaluate the financial
performance of the Scheduled Commercial Banks in India by applying the
multiple criteria decision making approach (TOPSIS) and to find the Top and
Low performing banks.
The secondary objective is to find the variables that discriminate the
Top and Low ranked banks.
Literature Review
Chao Li and Caiqin Ye (2014) used an improved TOPSIS method to evaluate the
performance of 16 listed commercial banks of China. In order to apply the principles of
comprehensiveness and representativeness, first, the study built a set of index system using
cluster analysis and multiple correlation coefficient method. Secondly, the Analytical
Hierarchy Process (AHP) was used to identify the weight coefficient. Finally, the operating
performance of the commercial banks was assessed and ranked, using the improved
TOPSIS method, and the comprehensive scores were assigned to each bank.Tamal Datta
Chaudhri and Indranil Ghosh (2014) applied multi-criteria decision making algorithms
to arrive at the financial health of the commercial banks in India, both in the public and
private sectors. The study considered various performance parameters of Basel guidelines.
They analyzed the performance of the banks over time and also investigated whether the
stock market has taken cognizance of these regulatory variables and have valued the banks
Dr.A.R.Rihana Banu, Dr.G.Santhiyavalli, Int. J.Eco.Res, 2018, V9 i6, 71 – 92 ISSN:2229-6158
IJER – NOVEMBER - DEEMBER 2018 available online @ www.ijeronline.com
73
accordingly. The study results indicated that the relative performance of private sector has
not undergone much change while some public sector banks have improved over time.
Further, the study also revealed that the stock market does not attach much importance to
these regulatory variables in the valuation of banks. Sanjeev C Panandikar (2014) used
the multi criteria method, TOPSIS, to obtain the entropy function of information theory, to
measure the metric efficiency ratings for Indian Commercial Banks on a (0,1) scale. In
order to rate and rank the banks, the bank-wise data, comprising seven financial ratios,
were used from the financial year 2001-02 to 2012-13. The non-performing assets and
business per employee were assigned highest weights. The hypotheses of equal and stable
performance were tested. The findings revealed that the public, private and foreign banks
do not differ in terms of average efficiency ratings but they differ from year to year.
Emrah Onder and Ali Hepsen (2013) forecasted the financial performance of 3 state
banks (Ziraat Bank, Halk Bank and Vakıflar Bank) 9 private banks (Akbank,
Anadolubank, Sekerbank, Tekstil Bank, Turkish Bank, Turk Ekonomi Bank, Garanti Bank,
Is Bank and Yapı Kredi Bank) and 5 foreign banks (Denizbank, Eurobank Tekfen, Finans
Bank, HSBC Bank and ING Bank) in Turkey during 2012-2015 for ten groups of financial
performance indicators including Capital Ratios, Balance Sheet Ratios, Assets Quality,
Liquidity, Profitability, Income-Expenditure Structure, Share in Sector, Share in Group,
Branch Ratios and Activity Ratios as described by the Banks Association of Turkey. The
forecasting analysis tools like classical time series methods such as moving averages,
exponential smoothing, Brown's single parameter linear exponential smoothing, Brown’s
second-order exponential smoothing, Holt's two parameter linear exponential smoothing
and decomposition methods were applied to financial ratios data (based on 2002-2011
data) for forecasting, after which the outranking was made using multi criteria decision
techniques like Analytical Hierarchy Process (AHP) and Technique for Order Preference
by Similarity to Ideal Solution (TOPSIS) methodologies. Results indicated that Garanti
Bank continue to be the leader followed by Ziraat Bank and Denizbank during years 2012-
2015. Emrah Onder, et al. (2013) evaluated the performance of 3 state banks, 9 private
banks and 5 foreign banks in Turkey using AHP and TOPSIS method for the period 2002
to 2011. The total performance of banks was divided into ten groups including Capital
Ratios, Balance Sheet Ratios, Assets Quality, Liquidity, Profitability, Income-Expenditure
Structure, Share in Sector, Share in Group, Branch Ratios and Activity Ratios. The five
Dr.A.R.Rihana Banu, Dr.G.Santhiyavalli, Int. J.Eco.Res, 2018, V9 i6, 71 – 92 ISSN:2229-6158
IJER – NOVEMBER - DEEMBER 2018 available online @ www.ijeronline.com
74

important ratios were identified using AHP method, and the ranking of the banks was made
using TOPSIS method. Their model showed that Akbank is the best performing bank
during the years 2007-2011 and 2009-2011. Soner Akkoc and Kemal Vatansever (2013)
opined that the banking sector is crucial for any economy. The performance measurement
of the bank concerns different segments of the society. The study was conducted to provide
decision support for decision makers about the performance of banks by using multi
criteria decision making techniques. For the purpose, the authors analysed financial
performance of twelve commercial banks in terms of seventeen financial performance
indicators by employing Fuzzy Analytic Hierarchy Process and Fuzzy Technique for Order
Preference by Similarity to Ideal Solution methods. The findings of the study proved that
these two methods rank banks in a similar manner. Here, the authors could have made
suggestions on the most relevant method of ranking. Abbas Toloie-Eshlaghy, et al. (2011)
proposed a conceptual approach to assess and rank the perceived service quality
dimensions such as SERVQUAL gap between two types of banks, namely Public and
Private Islamic Banks in Iran. The aim of the study was to introduce Fuzzy TOPSIS
approach for this purpose to evaluate the service quality of state and private banks. The
paper futher developed an evaluation model based on the Fuzzy Analytic Hierarchy
Process (FAHP) and Fuzzy Technique for Order of Preference by Similarity to Ideal
Solution (FTOPSIS) and Fuzzy Simple Additive Weighting (FSAW) methods.
Furthermore, the relative weights of the chosen evaluation indexes were calculated by
Fuzzy Analytic Hierarchy Process (FAHP), and FTOPSIS and FSAW were respectively
adopted to rank the four banks, and as a result both the approaches gave the same result. It
was concluded that service quality in private banks ranked far higher than state banks.
Hsu-Shih Shiha, et al. (2007) integrated TOPSIS (Technique for Order of Preference by
Similarity to Ideal Solution), a Multi-Attribute Decision Making (MADM) technique, to a
group decision environment which was found to be a practical and useful technique for
ranking and selection of a number of externally determined alternatives through distance
measures with the other decision makers. The proposed model developed by the authors
was mentioned as a unified process and readily applicable to many real-world decision
making situations without increasing the computational burden. The authors suggested that
the newly developed model proved to be both robust and efficient with less computational
complications.
Dr.A.R.Rihana Banu, Dr.G.Santhiyavalli, Int. J.Eco.Res, 2018, V9 i6, 71 – 92 ISSN:2229-6158
IJER – NOVEMBER - DEEMBER 2018 available online @ www.ijeronline.com
75

Research Methodology
Data Source
The data for the research was obtained primarily from the secondary sources.
Secondary Source
The data from the secondary sources were collected and analyzed for the study.
Most part of the data was gathered from RBI publications like RBI Bulletins, Reports on
Trend and Progress of Banking in India and Statistical Tables Relating to Banks in India
from the official website of RBI. In addition, data from the website of World Bank, the
annual reports of the banks, reports of researchers and committees, books, journals and
working papers were collected for the study.
Primary Source
For the purpose of assigning weights to the criteria (ratios), expert opinion was
obtained from a group of 50 experts constituting chartered accountants, academicians and
bank officials.
Period of the Study
The study covered a total period of 16 years from 1999-2000 to 2014-2015. The
financial sector reforms in 1991 and the launch of e-banking in 1996 improved the
operational environment of the banking sector in India while the global financial meltdown
experienced in the year 2008 posed a great challenge for the banks in maintaining their
financial stability. Thus, the period with opportunities and challenges was selected for the
study.
Sampling Design
With a view to measure the financial performance of the Scheduled Commercial
Banks operating in India, the following criteria was used to select the banks from the
universe of 95 Scheduled Commercial Banks excluding Regional Rural Banks. The
selection criteria are listed below:-
The advances provided by the banks, amounting to a minimum of Rs. 1,500
billions as on 31-03-2014,
The banks having positive capital adequacy during the study period from
Dr.A.R.Rihana Banu, Dr.G.Santhiyavalli, Int. J.Eco.Res, 2018, V9 i6, 71 – 92 ISSN:2229-6158
IJER – NOVEMBER - DEEMBER 2018 available online @ www.ijeronline.com
76

1999-2000 to 2014-2015, and
The banks with continuous availability of data from 1999-2000 to 2014-2015.
Thus, a total of 40 banks (4 Foreign Banks, 18 Nationalized Banks, 12 Private
Banks and 6 SBI and its Associates) were chosen. The composition of the selected banks
for the study is presented in Table 1.
Table 1
List of Select Scheduled Commercial Banks
Bank Group Name of the Bank Code
Foreign Banks Citibank F1
Deutsche Bank F2
Hongkong and Shanghai Bank F3
Standard Chartered Bank F4
Nationalized Banks Allahabad Bank N1
Andhra Bank N2
Bank of Baroda N3
Bank of India N4
Bank of Maharashtra N5
Canara Bank N6
Central Bank of India N7
Corporation Bank N8
Dena Bank N9
Indian Overseas Bank N10
Oriental Bank of Commerce N11
Punjab and Sind Bank N12
Punjab National Bank N13
Syndicate Bank N14
UCO Bank N15
Union Bank of India N16
United Bank of India N17
Vijaya Bank N18
Private Banks Axis Bank P1
City Union Bank Limited P2
Dr.A.R.Rihana Banu, Dr.G.Santhiyavalli, Int. J.Eco.Res, 2018, V9 i6, 71 – 92 ISSN:2229-6158
IJER – NOVEMBER - DEEMBER 2018 available online @ www.ijeronline.com
77

Bank Group Name of the Bank Code
Federal Bank P3
HDFC Bank P4
ICICI Bank P5
Indusind Bank P6
ING Vysya Bank P7
Jammu & Kashmir Bank Ltd P8
Karnataka Bank Ltd P9
Karur Vysya Bank P10
South Indian Bank P11
Tamilnadu Mercantile Bank Ltd P12
SBI and its Associates State Bank of Bikaner & Jaipur S1
State Bank of Hyderabad S2
State Bank of India S3
State Bank of Mysore S4
State Bank of Patiala S5
State Bank of Travancore S6
Statistical Design
The major financial components of the banks like capital adequacy, asset quality,
management ability, earning efficiency and liquidity management were assessed to
understand the financial performance of the Scheduled Commercial Banks by
applying ratio analysis, cluster analysis, rank-sum test TOPSIS and Discriminant
function analysis.
Dr.A.R.Rihana Banu, Dr.G.Santhiyavalli, Int. J.Eco.Res, 2018, V9 i6, 71 – 92 ISSN:2229-6158
IJER – NOVEMBER - DEEMBER 2018 available online @ www.ijeronline.com
78

Figure 2
Financial Performance - Components and Ratios
Findings
The results of the processed data are recorded in this section to bring out the
financial performance of the Scheduled Commercial Banks in India based on the multiple
criteria decision - making approach.
The following table shows the representative and comprehensive criteria by
applying cluster analysis and the weights assigned to them using rank-sum test method.
Capital Adequacy
•Capital Aedequacy Ratio (CA1)
•Debt - Equity Ratio (CA2)
•Ratio of Advances to Assets (CA3)
•Investments in Government Securities to Assets (CA4)
•Investments in Government Securities to Investments (CA5)
Asset Quality
•Return on Investments (AQ1)
•Return on Advances (AQ2)
•Net NPA to Advances (AQ3)
•Priority Sector Advances to Total Advances (AQ4)
•Interest Income to Total Assets (AQ5)
Management Ability
•CASA (MA1)
•Total Advances to Total Deposits (MA2)
•Business per Employee (MA3)
•Profit per Employee (MA4)
•Intermediation Cost to Total Assets (MA5)
•Burden to Total Assets (MA6)
Earning Efficiency
•Net Interest Margin (EE1)
•Return on Assets (EE2)
•Return on Equity (EE3)
•Non-interest Income to Total Assets (EE4)
•Operating Profits to Total Assets (EE5)
Liquidity Capability
•Cash- Deposit Ratio (LM1)
•Term Deposits to Total Deposits (LM2)
•Liquid Assets to Total Assets (LM3)
•Liquid Assets to Demand Deposits (LM4)
•Liquid Assets to Total Deposits (LM5)
Dr.A.R.Rihana Banu, Dr.G.Santhiyavalli, Int. J.Eco.Res, 2018, V9 i6, 71 – 92 ISSN:2229-6158
IJER – NOVEMBER - DEEMBER 2018 available online @ www.ijeronline.com
79

Table 2
Comprehensive and Representative Criteria Selection
Components No. of
Clusters Criteria R
2 Representative Criteria Weight
CAPITAL
ADEQUACY
CLUSTER 1
CA1 0.188 CA1
(Capital Adequacy Ratio) 0.018 CA2 0.168
CA4 0.050
CLUSTER 2
CA3 0.172 CA5
(Investment in Government
Securities to Investments)
0.164
CA5 0.172
ASSET
QUALITY CLUSTER 1
AQ1 0.250 AQ5
(Interest Income to Total
Assets)
0.091
AQ2 0.591
AQ3 0.158
AQ5 0.673
CLUSTER 2 AQ4
AQ4
(Priority sector Advances to
Advances)
0.127
MANAGEMENT
ABILITY
CLUSTER 1
MA1 0.757
MA5
(Intermediation Cost to
Total Assets)
0.182 MA4 0.612
MA5 0.798
MA6 0.568
CLUSTER 2 MA2 0.544 MA3
(Business per Employee) 0.073
MA3 0.544
EARNING
EFFICIENCY
CLUSTER 1
EE1 0.733
EE5
(Operating Profits to Total
Assets)
0.055 EE2 0.857
EE4 0.736
EE5 0.942
CLUSTER 2 EE3 EE3
(Return on Equity) 0.036
LIQUIDITY
MANAGEMENT
CLUSTER 1
LM1 0.523
LM5
(Liquidity Assets to Total
Deposits)
0.145 LM2 0.518
LM3 0.894
LM5 0.925
CLUSTER 2 LM4 LM4 0.109
Dr.A.R.Rihana Banu, Dr.G.Santhiyavalli, Int. J.Eco.Res, 2018, V9 i6, 71 – 92 ISSN:2229-6158
IJER – NOVEMBER - DEEMBER 2018 available online @ www.ijeronline.com
80
Components No. of
Clusters Criteria R
2 Representative Criteria Weight
(Liquidity Assets to
Demand Deposits)
Source: Computed data
Dr.A.R.Rihana Banu, Dr.G.Santhiyavalli, Int. J.Eco.Res, 2018, V9 i6, 71 – 92 ISSN:2229-6158
IJER – NOVEMBER - DEEMBER 2018 available online @ www.ijeronline.com
81

Table 3
Ranks of the Scheduled Commercial Banks between 2000 and 2015 using TOPSIS Method
Banks 2015 2014 2013 2012 2011 2010 2009 2008
Ci* Rank Ci* Rank Ci* Rank Ci* Rank Ci* Rank Ci* Rank Ci* Rank Ci* Rank
F1 0.429 12 0.510 4 0.538 4 0.581 1 0.621 1 0.613 1 0.593 1 0.564 1
F2 0.517 3 0.469 9 0.455 7 0.465 13 0.394 26 0.419 21 0.510 2 0.520 2
F3 0.512 4 0.495 5 0.396 19 0.433 21 0.369 34 0.379 31 0.400 16 0.424 15
F4 0.410 16 0.429 20 0.376 27 0.377 33 0.398 24 0.360 36 0.346 36 0.390 24
N1 0.450 8 0.455 11 0.416 13 0.491 9 0.436 17 0.419 22 0.335 38 0.379 28
N2 0.385 24 0.443 13 0.400 18 0.492 8 0.503 6 0.549 2 0.393 23 0.426 12
N3 0.534 2 0.589 1 0.556 2 0.579 2 0.547 2 0.521 4 0.440 10 0.465 6
N4 0.563 1 0.577 2 0.559 1 0.514 6 0.530 3 0.525 3 0.448 9 0.411 17
N5 0.364 33 0.379 33 0.347 32 0.379 32 0.348 37 0.435 18 0.350 34 0.351 35
N6 0.485 5 0.542 3 0.525 5 0.527 5 0.462 10 0.444 14 0.399 19 0.427 11
N7 0.378 28 0.365 37 0.363 30 0.401 30 0.404 23 0.442 15 0.365 28 0.365 31
N8 0.393 19 0.428 21 0.407 16 0.446 18 0.381 32 0.409 27 0.368 27 0.379 29
N9 0.413 15 0.392 30 0.436 10 0.410 29 0.417 19 0.430 20 0.448 8 0.409 18
N10 0.427 13 0.440 17 0.409 15 0.470 12 0.395 25 0.407 28 0.417 13 0.408 19
N11 0.373 31 0.442 14 0.372 28 0.422 24 0.449 12 0.520 5 0.469 6 0.430 10
N12 0.355 34 0.434 18 0.392 21 0.448 17 0.462 11 0.484 9 0.399 17 0.424 14
N13 0.442 10 0.453 12 0.380 23 0.431 22 0.438 15 0.431 19 0.396 22 0.382 27
N14 0.421 14 0.423 22 0.421 12 0.449 16 0.417 20 0.441 16 0.429 11 0.392 23
N15 0.377 29 0.373 35 0.307 38 0.483 10 0.514 4 0.352 38 0.404 15 0.387 26
N16 0.387 21 0.402 28 0.329 36 0.377 34 0.418 18 0.405 29 0.398 20 0.356 34
N17 0.339 38 0.411 24 0.376 26 0.386 31 0.365 35 0.363 35 0.357 32 0.332 38
N18 0.381 27 0.440 16 0.400 17 0.450 15 0.388 28 0.439 17 0.470 5 0.402 21
P1 0.350 35 0.359 38 0.299 39 0.331 40 0.371 33 0.336 39 0.327 40 0.334 3s7
P2 0.450 9 0.491 7 0.445 8 0.427 23 0.437 16 0.416 24 0.396 21 0.424 13
P3 0.382 26 0.417 23 0.379 24 0.437 20 0.442 14 0.446 13 0.501 3 0.472 5
P4 0.342 37 0.392 29 0.346 33 0.365 35 0.388 31 0.447 11 0.358 31 0.279 39
P5 0.276 40 0.340 39 0.336 34 0.362 36 0.331 38 0.416 25 0.408 14 0.445 7
P6 0.386 22 0.383 31 0.381 22 0.439 19 0.388 30 0.374 33 0.329 39 0.438 9
P7 0.346 36 0.381 32 0.276 40 0.333 39 0.329 39 0.380 30 0.346 37 0.373 30
P8 0.302 39 0.330 40 0.328 37 0.336 38 0.322 40 0.377 32 0.372 26 0.357 33
P9 0.365 32 0.371 36 0.331 35 0.360 37 0.354 36 0.357 37 0.362 29 0.402 22
P10 0.388 20 0.408 25 0.359 31 0.412 27 0.388 29 0.367 34 0.361 30 0.342 36
P11 0.434 11 0.462 10 0.547 3 0.512 7 0.489 8 0.489 8 0.484 4 0.492 4
P12 0.398 18 0.440 15 0.428 11 0.415 25 0.411 21 0.446 12 0.385 24 0.364 32
S1 0.463 6 0.489 8 0.442 9 0.461 14 0.510 5 0.454 10 0.420 12 0.439 8
S2 0.376 30 0.407 26 0.411 14 0.475 11 0.446 13 0.418 23 0.378 25 0.387 25
S3 0.400 17 0.403 27 0.370 29 0.411 28 0.392 27 0.334 40 0.351 33 0.274 40
S4 0.385 23 0.373 34 0.395 20 0.414 26 0.406 22 0.410 26 0.350 35 0.403 20
S5 0.383 25 0.432 19 0.378 25 0.551 3 0.501 7 0.495 7 0.458 7 0.419 16
S6 0.454 7 0.492 6 0.469 6 0.536 4 0.475 9 0.497 6 0.399 18 0.493 3
Source: Computed data (continued)
Dr.A.R.Rihana Banu, Dr.G.Santhiyavalli, Int. J.Eco.Res, 2018, V9 i6, 71 – 92 ISSN:2229-6158
IJER – NOVEMBER - DEEMBER 2018 available online @ www.ijeronline.com
82

Table 3
Ranks of the Scheduled Commercial Banks between 2000 and 2015 using TOPSIS Method
Banks 2007 2006 2005 2004 2003 2002 2001 2000 Mean
Rank Ci* Rank Ci* Rank Ci* Rank Ci* Rank Ci* Rank Ci* Rank Ci* Rank Ci* Rank
F1 0.484 2 0.424 3 0.402 3 0.436 4 0.512 2 0.486 4 0.582 2 0.482 4 1
F2 0.545 1 0.648 1 0.769 1 0.694 1 0.567 1 0.460 5 0.492 7 0.420 16 3
F3 0.415 9 0.298 36 0.322 29 0.282 39 0.336 37 0.452 6 0.474 12 0.410 19 20
F4 0.375 23 0.346 16 0.294 39 0.283 38 0.341 35 0.334 39 0.414 31 0.375 30 37
N1 0.336 35 0.342 18 0.350 18 0.325 23 0.368 20 0.404 20 0.446 22 0.390 26 19
N2 0.404 13 0.404 5 0.385 8 0.357 12 0.400 10 0.409 18 0.485 9 0.425 14 7
N3 0.433 7 0.365 7 0.343 21 0.307 31 0.357 29 0.390 24 0.485 10 0.456 8 5
N4 0.400 15 0.353 11 0.315 33 0.337 17 0.363 25 0.363 36 0.397 33 0.391 24 9
N5 0.331 37 0.311 31 0.388 5 0.439 3 0.412 7 0.404 19 0.466 15 0.386 28 29
N6 0.385 20 0.361 8 0.325 27 0.358 10 0.365 22 0.433 10 0.469 14 0.346 39 8
N7 0.356 27 0.287 39 0.351 16 0.314 28 0.348 32 0.401 21 0.423 27 0.366 32 34
N8 0.378 22 0.336 20 0.342 22 0.325 24 0.364 23 0.429 12 0.466 16 0.379 29 23
N9 0.348 29 0.338 19 0.321 30 0.305 32 0.345 34 0.372 32 0.410 32 0.356 37 28
N10 0.400 14 0.311 30 0.350 17 0.358 11 0.379 17 0.414 16 0.455 19 0.452 10 14
N11 0.409 10 0.348 15 0.403 2 0.345 15 0.364 24 0.412 17 0.424 26 0.396 21 11
N12 0.371 24 0.326 26 0.351 15 0.347 14 0.410 8 0.420 15 0.487 8 0.440 12 13
N13 0.342 32 0.403 6 0.349 19 0.328 22 0.363 26 0.383 27 0.418 29 0.390 27 21
N14 0.395 18 0.335 22 0.313 35 0.383 6 0.349 31 0.388 26 0.426 25 0.425 15 17
N15 0.344 30 0.299 35 0.380 9 0.331 20 0.341 36 0.361 38 0.394 37 0.337 40 32
N16 0.342 31 0.329 25 0.355 13 0.295 35 0.345 33 0.370 34 0.395 36 0.417 18 35
N17 0.333 36 0.322 29 0.316 32 0.315 27 0.357 30 0.363 37 0.365 39 0.361 36 39
N18 0.379 21 0.324 28 0.313 36 0.301 34 0.365 21 0.388 25 0.393 38 0.362 35 25
P1 0.365 25 0.292 37 0.320 31 0.375 8 0.446 6 0.366 35 0.464 17 0.460 6 36
P2 0.386 19 0.324 27 0.334 26 0.337 18 0.368 19 0.290 40 0.440 24 0.394 23 18
P3 0.446 5 0.416 4 0.385 6 0.376 7 0.402 9 0.376 28 0.353 40 0.364 34 12
P4 0.310 39 0.309 32 0.290 40 0.270 40 0.322 38 0.374 30 0.417 30 0.395 22 38
P5 0.418 8 0.349 13 0.347 20 0.362 9 0.466 4 0.557 1 0.459 18 0.495 2 16
P6 0.399 16 0.361 9 0.377 10 0.495 2 0.459 5 0.490 3 0.605 1 0.554 1 10
P7 0.407 11 0.301 33 0.304 38 0.293 36 0.398 11 0.449 7 0.535 3 0.433 13 31
P8 0.339 34 0.262 40 0.314 34 0.323 26 0.292 40 0.372 31 0.421 28 0.391 25 40
P9 0.351 28 0.348 14 0.385 7 0.325 25 0.395 12 0.428 13 0.500 6 0.486 3 24
P10 0.330 38 0.336 21 0.337 25 0.331 21 0.393 13 0.444 8 0.446 23 0.446 11 27
P11 0.476 3 0.439 2 0.358 12 0.393 5 0.475 3 0.505 2 0.532 4 0.460 7 2
P12 0.340 33 0.287 38 0.323 28 0.292 37 0.315 39 0.371 33 0.397 34 0.364 33 30
S1 0.443 6 0.352 12 0.339 23 0.343 16 0.383 15 0.426 14 0.502 5 0.476 5 6
S2 0.363 26 0.330 24 0.337 24 0.309 30 0.360 27 0.398 22 0.395 35 0.369 31 26
S3 0.251 40 0.300 34 0.311 37 0.311 29 0.372 18 0.432 11 0.471 13 0.407 20 33
S4 0.398 17 0.345 17 0.371 11 0.351 13 0.379 16 0.390 23 0.449 21 0.417 17 22
S5 0.404 12 0.354 10 0.354 14 0.304 33 0.359 28 0.375 29 0.449 20 0.354 38 15
S6 0.465 4 0.334 23 0.399 4 0.334 19 0.389 14 0.438 9 0.481 11 0.454 9 4
Source: Computed data
Indicates Top ranked 5 Banks Indicates Low ranked 5 Banks
Dr.A.R.Rihana Banu, Dr.G.Santhiyavalli, Int. J.Eco.Res, 2018, V9 i6, 71 – 92 ISSN:2229-6158
IJER – NOVEMBER - DEEMBER 2018 available online @ www.ijeronline.com
83

Table 3 shows the selection value and the rank obtained by banks through the Technique for the
Order of Preference by Similarity to Ideal Solution (TOPSIS) method for 16 years from 2000 to
2015 along with the mean rank. The top five ranked banks and the least five ranked banks have
been selected on the basis of the mean rank obtained by the banks during the study period.
Figure 13 shows the classification of top and low ranked banks by taking into
consideration the mean rank obtained by the banks.
Figure 2
Classification of Banks Using TOPSIS Analysis
The Scheduled Commercial Banks were classified as top and low ranked banks on the
basis ranks assigned to the banks using TOPSIS analysis. The banks identified under top ranked
banks in Figure 13, proved to be the best banks, by witnessing an increase in interest and non-
interest income and through the growth in deposits and advances. Further, the NPAs of the top
ranked banks are highly under control. The banks that are classified as the low ranked banks
experienced a decline in standalone profit year over year. The operating income of the banks
Top Ranked Banks
Citibank(F1)
South Indian Bank (P11)
Deutsche Bank (F2)
State Bank of Travancore (S6)
Bank of Baroda (N3)
Low Ranked Banks
Jammu and Kashmir Bank (P8)
United Bank of India (N17)
HDFC Bank (P4)
Standard Chartered Bank (F4)
Axis Bank (P1)
Dr.A.R.Rihana Banu, Dr.G.Santhiyavalli, Int. J.Eco.Res, 2018, V9 i6, 71 – 92 ISSN:2229-6158
IJER – NOVEMBER - DEEMBER 2018 available online @ www.ijeronline.com
84

turned down as their deposits and advances decreased and the adverse loan impairment trends
also continued to impact their performance. A few banks in the group reported high operating
expenses, and a slippage in credit – deposit ratio was also observed. The stressed assets of the
low ranked banks lead to pitiable earnings while a few banks suffered a net loss due to inefficient
management and liquidity capability.
The reliability of the banks discriminated as top and low ranked banks using the
technique for order of preference by similarity to ideal solution (TOPSIS) was tested using
Discriminant Function Analysis. Step-wise method was applied to identify the most
discriminating variables of the banks. Discrimination of the scheduled commercial banks on the
basis of the ranks using the technique for order of preference by similarity to ideal solution
(TOPSIS) is tested using the Discriminant function analysis.
Table 4
Discriminating Variables of the Top and Low Ranked Banks
Variables Entered Wilks' Lambda F df1 df2 Sig.
LM4 0.727 61.342 1 163.000 0.000
MA5 0.533 71.008 2 162.000 0.000
CA5 0.445 66.911 3 161.000 0.000
MA3 0.402 59.474 4 160.000 0.000
AQ4 0.367 54.866 5 159.000 0.000
AQ1 0.345 50.033 6 158.000 0.000
EE3 0.326 46.424 7 157.000 0.000
AQ2 0.311 43.254 8 156.000 0.000
LM5 0.292 41.746 9 155.000 0.000
Source: Computed data
Table 4 shows the most discriminating variables identified through stepwise discriminant
function analysis. The values of Wilks’ Lambda of the variables identified are less than one and
are found to be significant at 1% level of confidence showing that the group mean of the
variables is different. The discriminating variables identified are Liquid Assets to Demand
Deposits (LM4), Intermediation Cost to Total Assets (MA5), Investment in Government
Securities to Investment (CA5), Business per Employee (MA3), Priority Sector Advances to
Dr.A.R.Rihana Banu, Dr.G.Santhiyavalli, Int. J.Eco.Res, 2018, V9 i6, 71 – 92 ISSN:2229-6158
IJER – NOVEMBER - DEEMBER 2018 available online @ www.ijeronline.com
85

Advances (AQ4), Return on Investments (AQ1), Return on Equity (EE3), Return on Advances
(AQ2) and Liquid Assets to Total Deposits (LM5).
Table 5
Discriminant Function Coefficients of the Variables
Variables Entered Canonical Discriminant Function Coefficients
Unstandardized Standardized
LM4 0.027 1.502
MA5 1.534 1.173
MA3 0.016 0.876
AQ4 0.084 0.606
AQ1 0.095 0.448
EE3 0.054 0.385
CA5 0.020 0.301
AQ2 -0.265 -0.448
LM5 -0.023 -0.402
(Constant) -10.711
Source: Computed data
Table 5 illustrates the importance of each variable. High standardized discriminant
function coefficients mean that the groups differ a lot on that variable. The standardized
coefficient value registered by Liquid Assets to Demand Deposits(LM4) is 1.502 which is the
most discriminating variable amidst all the other variables followed by Intermediation Cost to
Total Assets (MA5) at 1.173, Investment in Government Securities to Investment (CA5) at
0.301, Business per Employee (MA3) at 0.876, Priority Sector Advances to Advances (AQ4) at
0.606, Return on Investments (AQ1) at 0.448, Return on Equity (EE3) at 0.385, Return on
Advances (AQ2) at -0.448 and Liquid Assets to Total Deposits (LM5) at -0.402.
The Unstandardized canonical discriminant coefficient is used to maximize the difference
in mean discriminant score between the top and low level banks. The equation for the
discriminant function is
Dr.A.R.Rihana Banu, Dr.G.Santhiyavalli, Int. J.Eco.Res, 2018, V9 i6, 71 – 92 ISSN:2229-6158
IJER – NOVEMBER - DEEMBER 2018 available online @ www.ijeronline.com
86
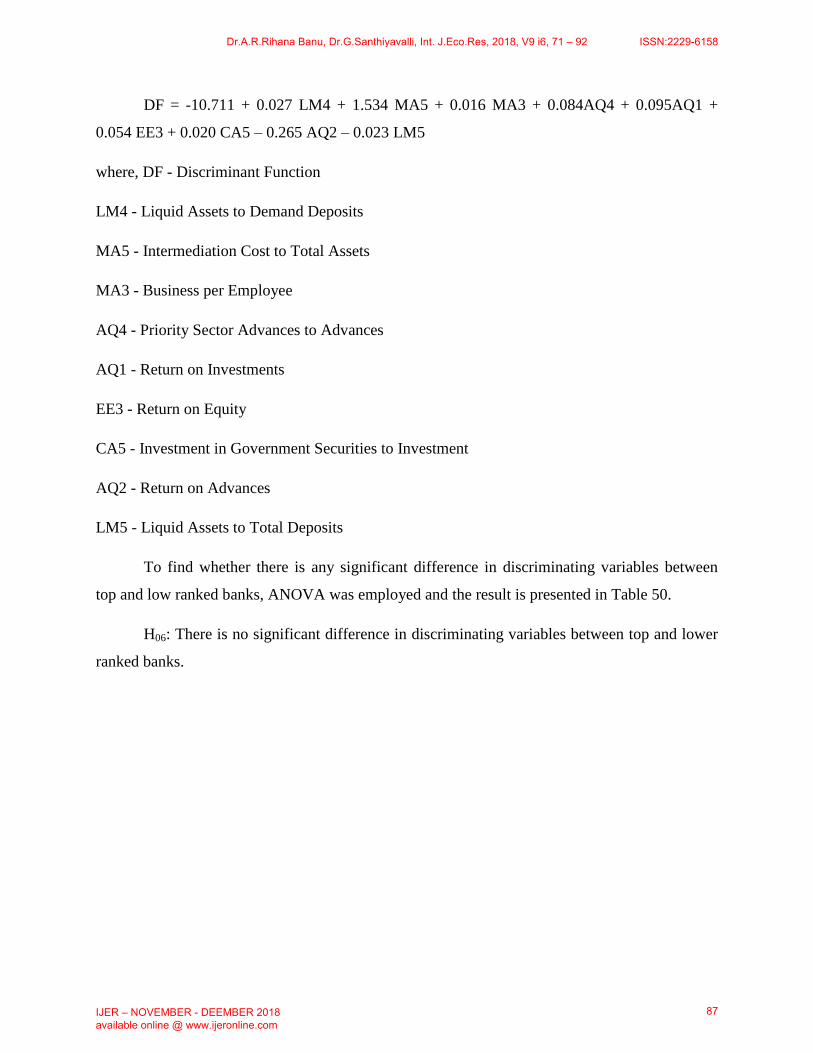
DF = -10.711 + 0.027 LM4 + 1.534 MA5 + 0.016 MA3 + 0.084AQ4 + 0.095AQ1 +
0.054 EE3 + 0.020 CA5 – 0.265 AQ2 – 0.023 LM5
where, DF - Discriminant Function
LM4 - Liquid Assets to Demand Deposits
MA5 - Intermediation Cost to Total Assets
MA3 - Business per Employee
AQ4 - Priority Sector Advances to Advances
AQ1 - Return on Investments
EE3 - Return on Equity
CA5 - Investment in Government Securities to Investment
AQ2 - Return on Advances
LM5 - Liquid Assets to Total Deposits
To find whether there is any significant difference in discriminating variables between
top and low ranked banks, ANOVA was employed and the result is presented in Table 50.
H06: There is no significant difference in discriminating variables between top and lower
ranked banks.
Dr.A.R.Rihana Banu, Dr.G.Santhiyavalli, Int. J.Eco.Res, 2018, V9 i6, 71 – 92 ISSN:2229-6158
IJER – NOVEMBER - DEEMBER 2018 available online @ www.ijeronline.com
87

Table 6
Analysis of Variance in Discriminating Variables
Variables F ‘p’ value Significance
CA5 49.406 0.000 Significant
AQ1 0.915 0.340 Insignificant
AQ2 1.865 0.174 Insignificant
AQ4 17.630 0.000 Significant
MA3 2.851 0.093 Insignificant
MA5 6.309 0.013 Significant
EE3 0.004 0.952 Insignificant
LM4 61.342 0.000 Significant
LM5 8.088 0.005 Significant
Source: Computed data
For determining whether there is any significant mean difference in discriminating
variables between top and low ranked banks, ANOVA test was applied and the results are
presented in Table 6. The test revealed that there is statistically significant difference in
Investments in government securities to investments (CA5), Priority sector advances to advances
(AQ4), Intermediation cost to total assets (MA5), Liquid assets to demand deposits (LM4) and
Liquid assets to total deposits (LM5) at 5% level of significance between the top and low ranked
banks while Return on investments (AQ1), Return on advances (AQ2), Business per employee
(MA3) and Return on equity (EE3) do not have significant difference in the mean value of the
variables .
Table 7
Classification Results of the Banks
Eigen value 2.424
Canonical Correlation 0.841
Wilks' Lambda 0.292
‘p’ value 0.000
Bank_Range Predicted Group Membership Total
top low
Original Count top 84 6 90
low 4 71 75
% top 93.3 6.7 100.0
low 5.3 94.7 100.0
93.9% of original grouped cases correctly classified.
Source: Computed data
Dr.A.R.Rihana Banu, Dr.G.Santhiyavalli, Int. J.Eco.Res, 2018, V9 i6, 71 – 92 ISSN:2229-6158
IJER – NOVEMBER - DEEMBER 2018 available online @ www.ijeronline.com
88

Table 7 establishes the power of banks discriminated. The high eigen value at 2.424 and
canonical correlation at 0.841 elucidate that the statistically significant predictors are good
explicators of differences between top and low ranked banks. The lower Wilks' Lambda at 0.292
signifies that the predictor variables have a discriminant power and found to be statistically
significant at 99 percent confidence level. Classification results of the banks shows that the
banks correctly classified at 93.90 percent. This proves that the result obtained from the TOPSIS
analysis is highly reliable in ranking the banks during the study period.
Conclusion
The performance of banks is measured through their sustainability, efficiency in
managing the funds and earning returns by proper application of the available resources. At the
same time, the banks must have adequate liquid assets to meet the requirements of their
customers and economy. Further, the disbursements made by the banks must be secured in order
to avoid adverse loan impairment. Thus, the strategies worked out by the banks must be able to
balance the risks in the business operations. The findings of the present study, using the multiple
criteria decision making approach, has considered the major components of financial
performance to comprehend the managerial ability of the banks and is identified that the banks
that effectively reduces their risks garners more profit and upholds consistency in their business.
Suggestions
The suggestions proposed on the basis of research findings to enhance the operational
efficiency of the low ranked banks are as follows:
Liquid assets to demand deposits ratio of the top ranked banks is exceptionally high in
contrast to the low ranked banks which insists that the low ranked banks must increase
their liquid assets to meet the obligations of its demand depositors,
The ratio of intermediation cost to total assets is comparatively low in the top ranked
banks while it is slightly high in low ranked banks. Hence, the low ranked banks are
suggested to have control on their operating expenses,
Dr.A.R.Rihana Banu, Dr.G.Santhiyavalli, Int. J.Eco.Res, 2018, V9 i6, 71 – 92 ISSN:2229-6158
IJER – NOVEMBER - DEEMBER 2018 available online @ www.ijeronline.com
89
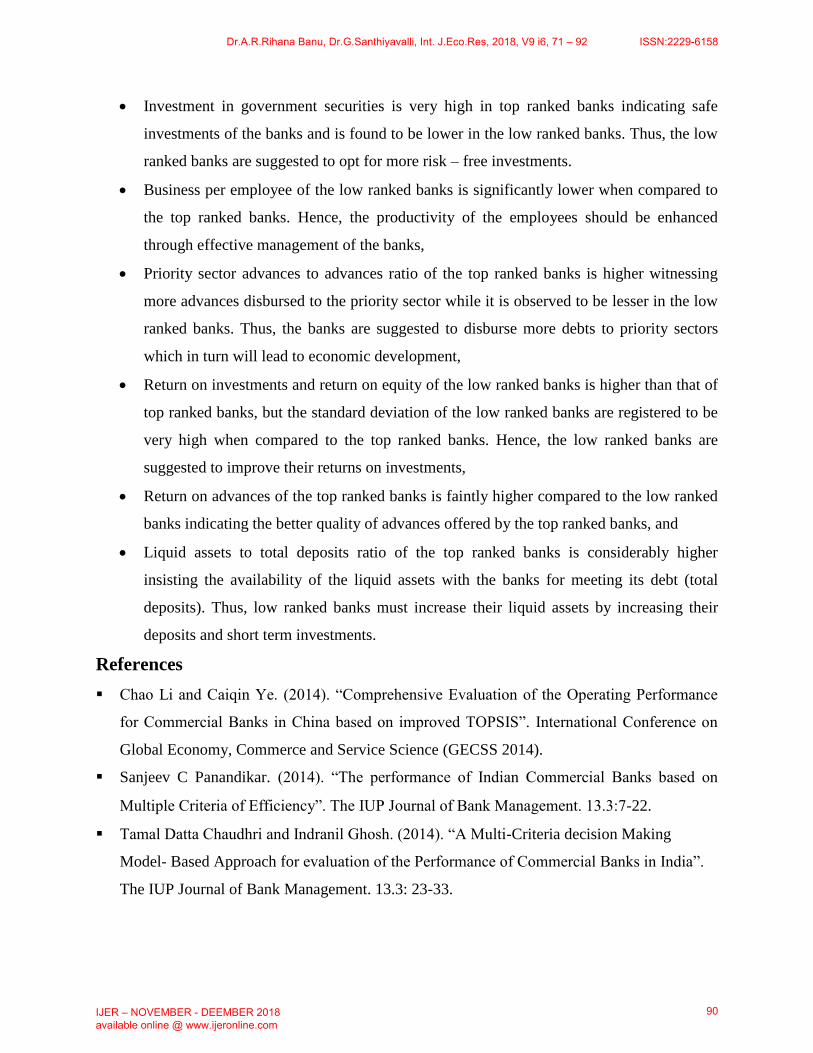
Investment in government securities is very high in top ranked banks indicating safe
investments of the banks and is found to be lower in the low ranked banks. Thus, the low
ranked banks are suggested to opt for more risk – free investments.
Business per employee of the low ranked banks is significantly lower when compared to
the top ranked banks. Hence, the productivity of the employees should be enhanced
through effective management of the banks,
Priority sector advances to advances ratio of the top ranked banks is higher witnessing
more advances disbursed to the priority sector while it is observed to be lesser in the low
ranked banks. Thus, the banks are suggested to disburse more debts to priority sectors
which in turn will lead to economic development,
Return on investments and return on equity of the low ranked banks is higher than that of
top ranked banks, but the standard deviation of the low ranked banks are registered to be
very high when compared to the top ranked banks. Hence, the low ranked banks are
suggested to improve their returns on investments,
Return on advances of the top ranked banks is faintly higher compared to the low ranked
banks indicating the better quality of advances offered by the top ranked banks, and
Liquid assets to total deposits ratio of the top ranked banks is considerably higher
insisting the availability of the liquid assets with the banks for meeting its debt (total
deposits). Thus, low ranked banks must increase their liquid assets by increasing their
deposits and short term investments.
References
Chao Li and Caiqin Ye. (2014). “Comprehensive Evaluation of the Operating Performance
for Commercial Banks in China based on improved TOPSIS”. International Conference on
Global Economy, Commerce and Service Science (GECSS 2014).
Sanjeev C Panandikar. (2014). “The performance of Indian Commercial Banks based on
Multiple Criteria of Efficiency”. The IUP Journal of Bank Management. 13.3:7-22.
Tamal Datta Chaudhri and Indranil Ghosh. (2014). “A Multi-Criteria decision Making
Model- Based Approach for evaluation of the Performance of Commercial Banks in India”.
The IUP Journal of Bank Management. 13.3: 23-33.
Dr.A.R.Rihana Banu, Dr.G.Santhiyavalli, Int. J.Eco.Res, 2018, V9 i6, 71 – 92 ISSN:2229-6158
IJER – NOVEMBER - DEEMBER 2018 available online @ www.ijeronline.com
90

Emrah Onder , Ali Hepsen. (2013). “Combining Time Series Analysis and Multi Criteria
Decision Making Techniques for Forecasting Financial Performance of Banks in Turkey”
International Conference on Applied Business and Economics (ICABE-13), New York,
United States of America.
Emrah Onder, Nihat Taş and Ali Hepsen et al .(2013). “Performance evaluation of Turkish
banks using Analytical Hierarchy Process and TOPSIS methods”. Journal of International
Scientific Publication: Economy & Business. 7.1:470-503.
Soner Akkoc and Kemal Vatansever. (2013). “Fuzzy Performance Evaluation with AHP and
Topsis Methods: Evidence from Turkish Banking Sector after the Global Financial Crisis”.
Eurasian Journal of Business and Economics. 6.11: 53-74.
Hsu-Shih Shiha, Huan-Jyh Shyurb and E. Stanley Leec. (2007). “An extension of TOPSIS
for group decision making”. Mathematical and Computer Modeling.45: 801–813.
www.moneycontrol.com
www.rbi.org.in
www.worldbank.org.in
www.investopedia.com
www.statisticssolutions.com
http://www.investopedia.com/ask/answers/052515/what-debt-equity-ratio-common-
bank.asp
http://www.jagranjosh.com/current-affairs/issues-and-challenges-facing-indian-
banking-sector-1456572882-1
http://myimsv2.imsindia.com
http://jugaadguru.net/in/banking-awareness/articles/Structure-of-Commercial-Banking/15.aspx
http://www.pwc.in/press-releases/india-third-largest-domestic-banking-sector-by-
2050.html
https://rbi.org.in/scripts/BS_SpeechesView.aspx?Id=955
https://www.sbi.co.in/portal/web/international/international
https://www.sbi.co.in/webfiles/includes_english/images/SBI_MERGER_LANDING_P
AGE.jpg
Dr.A.R.Rihana Banu, Dr.G.Santhiyavalli, Int. J.Eco.Res, 2018, V9 i6, 71 – 92 ISSN:2229-6158
IJER – NOVEMBER - DEEMBER 2018 available online @ www.ijeronline.com
91

https://www.icsi.edu/docs/webmodules/Publications/9.1%20Banking%20Law%20-
Professional.pdf
http://www.vitt.in/banks/foreign.html
http://www.bis.org/speeches/sp140226.htm
Dr.A.R.Rihana Banu, Dr.G.Santhiyavalli, Int. J.Eco.Res, 2018, V9 i6, 71 – 92 ISSN:2229-6158
IJER – NOVEMBER - DEEMBER 2018 available online @ www.ijeronline.com
92


![TOPSIS for Large Scale Vector Optimization Problems · Vector optimization problems 659 making problems with block angular structure. Also, they [4] extend the TOPSIS approach to](https://img.pdfslide.us/doc/110x75/5b5f12177f8b9a553d8dd6c4/topsis-for-large-scale-vector-optimization-problems-vector-optimization-problems.jpg)