Embed Size (px)
Citation preview
A Tool for Performance Evaluation of MPPT Algorithms forPhotovoltaic Systems
Soulatiantork, P., Cristaldi, L., Faifer, M., Laurano, C., Ottoboni, R., & Toscani, S. (2018). A Tool forPerformance Evaluation of MPPT Algorithms for Photovoltaic Systems. Measurement: Journal of theInternational Measurement Confederation, 128, 537-544. https://doi.org/10.1016/j.measurement.2018.07.005
Published in:Measurement: Journal of the International Measurement Confederation
Document Version:Peer reviewed version
Queen's University Belfast - Research Portal:Link to publication record in Queen's University Belfast Research Portal
Publisher rightsCopyright 2018 Elsevier. This manuscript is distributed under a Creative Commons Attribution-NonCommercial-NoDerivs License(https://creativecommons.org/licenses/by-nc-nd/4.0/), which permits distribution and reproduction for non-commercial purposes, provided theauthor and source are cited.
General rightsCopyright for the publications made accessible via the Queen's University Belfast Research Portal is retained by the author(s) and / or othercopyright owners and it is a condition of accessing these publications that users recognise and abide by the legal requirements associatedwith these rights.
Take down policyThe Research Portal is Queen's institutional repository that provides access to Queen's research output. Every effort has been made toensure that content in the Research Portal does not infringe any person's rights, or applicable UK laws. If you discover content in theResearch Portal that you believe breaches copyright or violates any law, please contact [email protected].
Download date:18. Feb. 2022
1
Abstract-- The use of photovoltaic (PV) systems as electrical power generator is increasing rapidly and this growth is expected to be
continuous. As well known in PV systems the tracking of the maximum power point (MPP) is fundamental. For this reason, many
testing systems and maximum power point tracking (MPPT) algorithms have been developed. Testing systems are used for the
development as well as for assessing the quality of PV products. The typical problem related to the evaluation of PV system
performances and MPPT algorithm comparison is the guarantee of the repeatability of the testing conditions (e.g. temperature and
radiation).
In this paper, a testing system for PV applications has been developed and characterized. Flexibility, ease of use, low cost,
capability to evaluate the characteristic curves of more than one PV panel simultaneously (same environmental conditions), the
capability of algorithms simulation, and capability of tracking MPP on the base of different MPPT algorithms are some of the main
characteristics. Experimental tests have been carried out to show the capability of the developed architecture. Different MPPT
algorithms have been compared in the same environmental conditions both in the steady and dynamic state.
Index Terms- Maximum power point trackers, Photovoltaic systems, Solar panels, PV testing systems.
I. INTRODUCTION
mong all renewable technologies, Photovoltaic (PV) energy is considered as the future of sustainable energy generation in
many countries. More efficient and saving PV components and devices have been introduced making this technology more
and more valuable. As well known the problem of finding and tracking the maximum power point (MPP) is vital for this kind of
system. To fulfil this task, many maximum power point tracking (MPPT) algorithms have been developed. The testing of the
devices and algorithms is a very important activity not only for PV system development but also for the quality verification of
the products on the market. The main issue for the experimental testing is the need of guarantee environmental condition
repeatability since, as well known, the PV cell performance strongly depends on solar radiation and temperature. The definition
of current-voltage (I–V) curves in different environmental conditions, completely characterize a solar cell, module or array.
Unfortunately, the knowledge of these curves is not sufficient to estimate the actual generated power of the panels in working
condition. In fact, as well known, the production also depends on the employed MPPT.
The typical experimental characterization is based on the use of artificial sun emulators that are extremely expensive and
suffer of issues related to dimension limits of the testable system [1]. In literature, different studies comparing MPPT algorithms
and PV modules have been developed [2]-[10]. However, just a few works compare different algorithms or different PV panels
at the same environmental conditions and are mainly based on simulations analysis without experimental evaluation [11] [12].
For this reason, a testing system for PV applications has been developed. The system has been designed according to the
following constraints: flexibility, ease of use, low cost, capability to evaluate the characteristic curves of more than one PV
panel simultaneously. Moreover, it is able to implement every desired algorithm, simply changing the tracking software.
The system is based on a board for control and measurement management, controllable from the Simulink environment by
MathWorks© and hosted on a PC. The system gives the capability to measure the characteristics curve of four different panels
in the same environmental condition, as well as the radiation and their temperature. Moreover, it is possible to simulate and
directly implement different MPPT algorithms so as to compare their performance in real-time. The computation capability of
the developed system allows the implementation of even complex MPPTs algorithms.
The paper is organized as follows. Section II the state of the art in PV testing systems is presented. Section III describes the
hardware platform used in this paper for the MPPT algorithms and PV panel comparison. The MPPT algorithms utilized in the
paper are presented in section IV. Section V is dedicated to the performance evaluation and comparison of employed MPPT
algorithms and finally, Section VI presents the main conclusions.
P. Soulatiantork, L. Cristaldi, M. Faifer, C. Laurano, R. Ottoboni, and S. Toscani are with the Dipartimento di Elettronica, Informazione e Bioingegneria,
Politecnico di Milano, 20133 Milan, Italy (e-mail: [email protected]; [email protected]; [email protected]; [email protected]; [email protected]; [email protected];).
A Tool for Performance Evaluation of MPPT
Algorithms for Photovoltaic Systems P. Soulatiantork, L. Cristaldi, M. Faifer, C. Laurano, R. Ottoboni, S. Toscani
A
2
II. PHOTOVOLTAIC TESTING SYSTEMS
In literature, different methods to measure PV modules can be found. Basically, the common method is based on a load
impedance that can change its value from zero to infinite, in order to trace the PV module characteristic curve from short-circuit
to open circuit state. Generally, variable resistors are the most widely used device to evaluate the I-V and P-V characteristic
curves. In [13] a system has been designed to determine the I-V characteristic curve of seven photovoltaic modules sequentially.
This system is composed of an array of resistors to act as a load for the PV module that can be connected to the panel through
dedicated switching. Different configurations allow the system to sweep the curve so as to evaluate short-circuit current (Isc) and
open circuit voltage (Voc). Although this might be a low-cost method for low power systems, resistors for high power
applications are hardly available and the system would not follow rapid change conditions due to its slow dynamics.
Another method is named the capacitive method, which is based on the use of a capacitor as a load. In [14] a capacitive load
method using insulated gate bipolar transistors (IGBTs) is designed. The system has the capability of measuring a short circuit
current up to 80 A and an open circuit voltage up to 800 V. As the capacitor start charging, its voltage increases from zero to
open-circuit voltage of the PV module. Therefore, by measuring the voltage and current during the transient, the photovoltaic
module can be characterized. The evaluation of I-V curves of PV modules must be both reliable and repetitive. Therefore, high-
quality capacitors with low equivalent series resistance (ESR) are needed. On the other hand, in this configuration, the system
dynamic is slowed down by the discharging time constant [14].
The electronic load method utilizes transistors as a load. By controlling the gate of power switches and by changing their
duty cycle from zero to one, the switch acts as a variable resistor; therefore, the I-V curve can be measured. In [15] a metal oxide
field effect transistor (MOSFET) has been used. In order to handle high power, different MOSFETs can be put in a parallel
configuration. Differently, in [16] the electronic load uses an analog converter (DAC) and a bipolar junction transistor (BJT) in
order to change the load conditions of the PV module. Unfortunately, with this configuration the switches must dissipate the
generated power. Therefore, this limits the applicability of this method to low power applications similarly to the variable
resistor method.
Other solutions are based on the employment of DC-DC converters. DC-DC converters have the property to emulate a
variable resistance by modifying their duty cycle thus allowing to obtain the I-V curve with a high dynamic and for different
power size. Furthermore, they can continuously operate around the maximum power point (MPP) of the PV modules under test,
following the reference signal provided by MPP algorithms. The issue of the use of DC-DC converters in this application is
given by the presence of current ripple due to the switching technique. Coupled inductors and interleaved DC-DC converters
allow to reduce it [17] [18]. Among the different DC–DC converter configurations, Buck-Boost topology is the one that allows
the whole sweep of the I-V curve [19].
For all these reasons, the experimental test setup has been based on a DC-DC converter and, in particular, a single ended
primary inductor converter (SEPIC) topology has been chosen since it allows a lower ripple in the current drown from the PV
module.
III. THE HARDWARE PLATFORM
The hardware platform has been designed for integrating real-time measurement and control for characterizing PV modules
and MPPT algorithms. The system is based on a dSPACE board and allows testing simultaneously up to four PV modules by
measuring currents, voltages, solar radiation and PV module temperatures. The dSPACE system provides the capability to
develop user-friendly control panels for online monitoring and supervision. The interface and programming have been
developed in Simulink/MATLAB environment with the SimPower/ MATLAB toolbox and dSPACE RTI1104 (Real-Time
Interface) block set libraries.
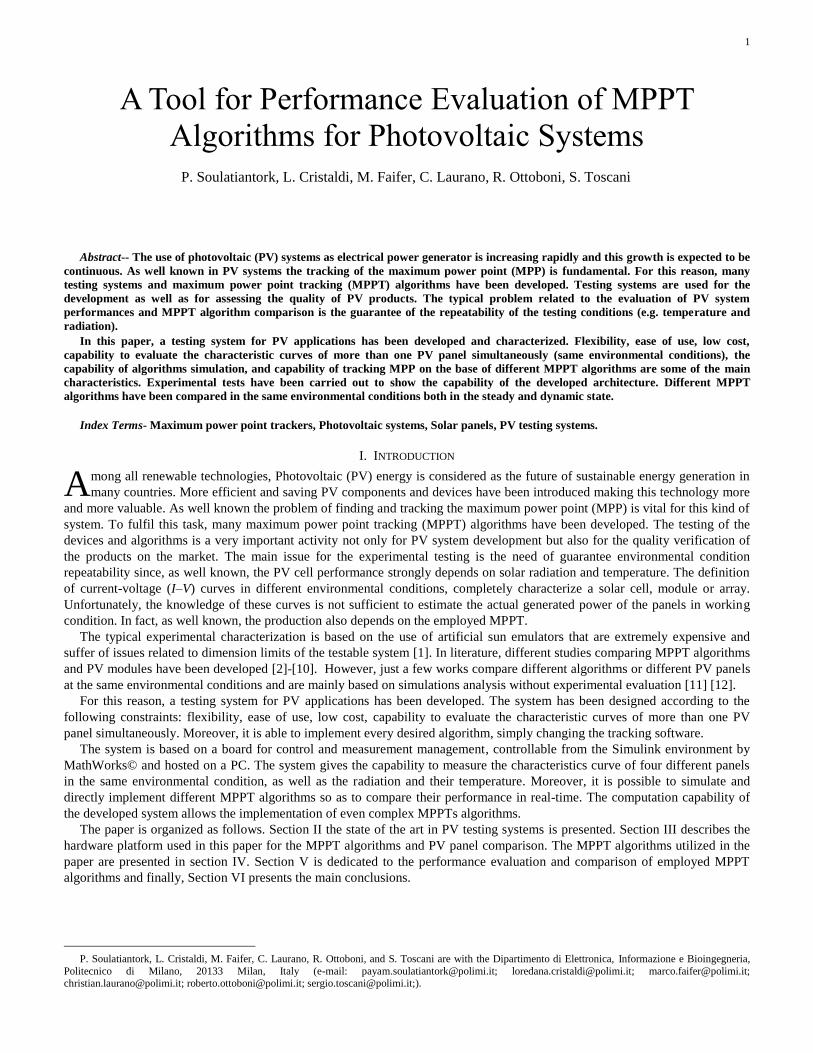
As shown in Fig. 1, voltage and current of each PV module are measured and sent to the control system, in which the
algorithms are embedded. Each module can be controlled independently by controlling the duty cycle of the related power
converter. The dSPACE RTI1104 data acquisition and control board has been used to acquire current and voltage measurements
and to generate the PWM signal to send to the SEPIC’s MOSFET gate. Module temperatures and solar radiation level are
acquired through temperature sensors (PT100, characterized by an accuracy of 0.3 °C in the range -50 to 150°C) fixed under the
PV module and a 2nd
class pyranometer. Measured data are sent through a sensor interface module (ADAM 4000 modules) to
dSPACE board. ADAM-4000 family is an intelligent interface for environmental sensors that allows interfacing sensors to PC
through RS-485 and RS-232 communication protocol [20]. The required algorithms have been implemented in the Simulink
environment and PI controllers have been used to control the power converters [21]-[22].
3
Fig. 1. Block diagram of the testing system for the PV modules.
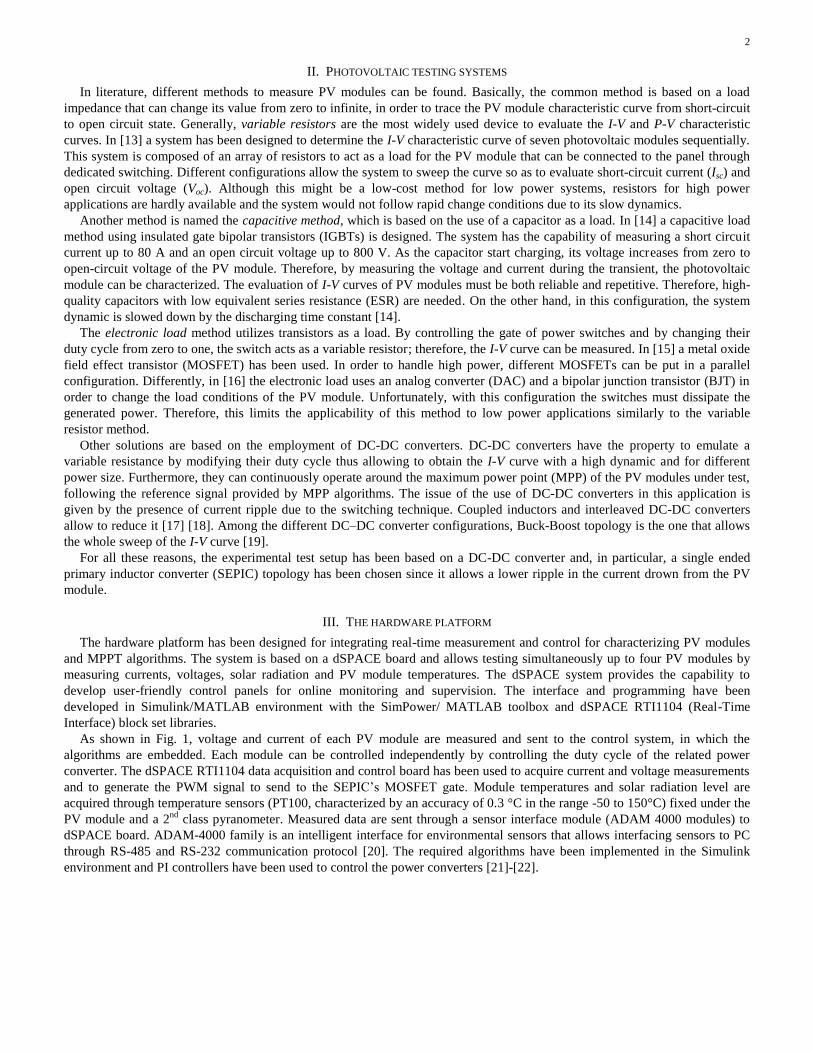
SEPIC converter allows setting the working point of the PV module (Fig. 2). The converters have been designed in order to
test PV modules featuring power up to Pmax = 200 W, voltage up to Vmax = 100 V and currents up to Imax = 6 A.
Fig. 2. SEPIC converter topology
Table I summarizes the electrical characteristics of the components employed in the power converters.
TABLE I . STANDARD COMPONENT ELECTRICAL CHARACTERISTICS
Components Characteristics Total
L1 230 µH, 5.5 A, 0.062 Ω 230 µH
L2 230 µH, 5.5 A, 0.062 Ω 230 µH
Cin 100 µF, 160 V 100 µF
C1 100 µF, 160 V 300 µF
C2 470 µF, 100 V 940 µF
D 200 V, 10 A, 1.1 V --
Mosfet 250 V, 94 A, 0.085 Ω --
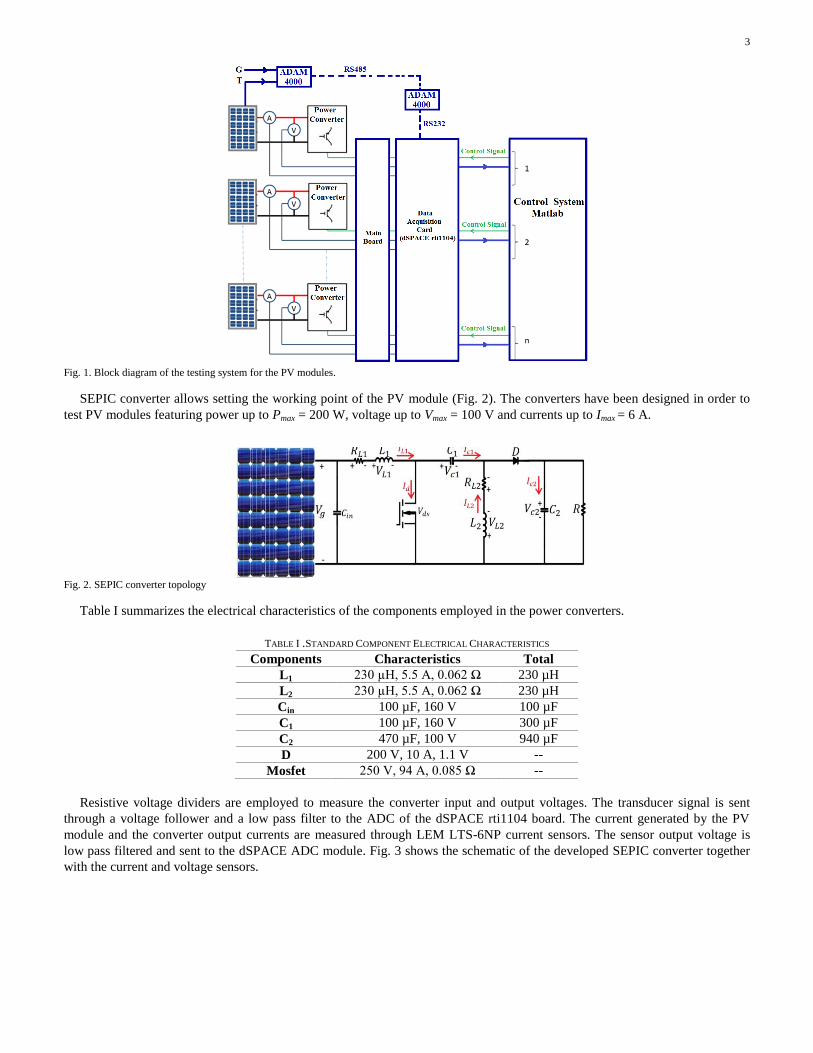
Resistive voltage dividers are employed to measure the converter input and output voltages. The transducer signal is sent
through a voltage follower and a low pass filter to the ADC of the dSPACE rti1104 board. The current generated by the PV
module and the converter output currents are measured through LEM LTS-6NP current sensors. The sensor output voltage is
low pass filtered and sent to the dSPACE ADC module. Fig. 3 shows the schematic of the developed SEPIC converter together
with the current and voltage sensors.
4
Fig. 3. Block diagram of the test setup: PV module, measurement devices and the SEPIC converter.
As shown in Fig. 3, two measurement sections have been implemented, respectively at the input and output of the power
converter thus allowing also to perform evaluation of the converter efficiency [23]-[24]. The power converter boards are then
hosted on the main board able to accommodate up to four SEPIC converters and providing the interface with the dSPACE
system (Fig. 4).
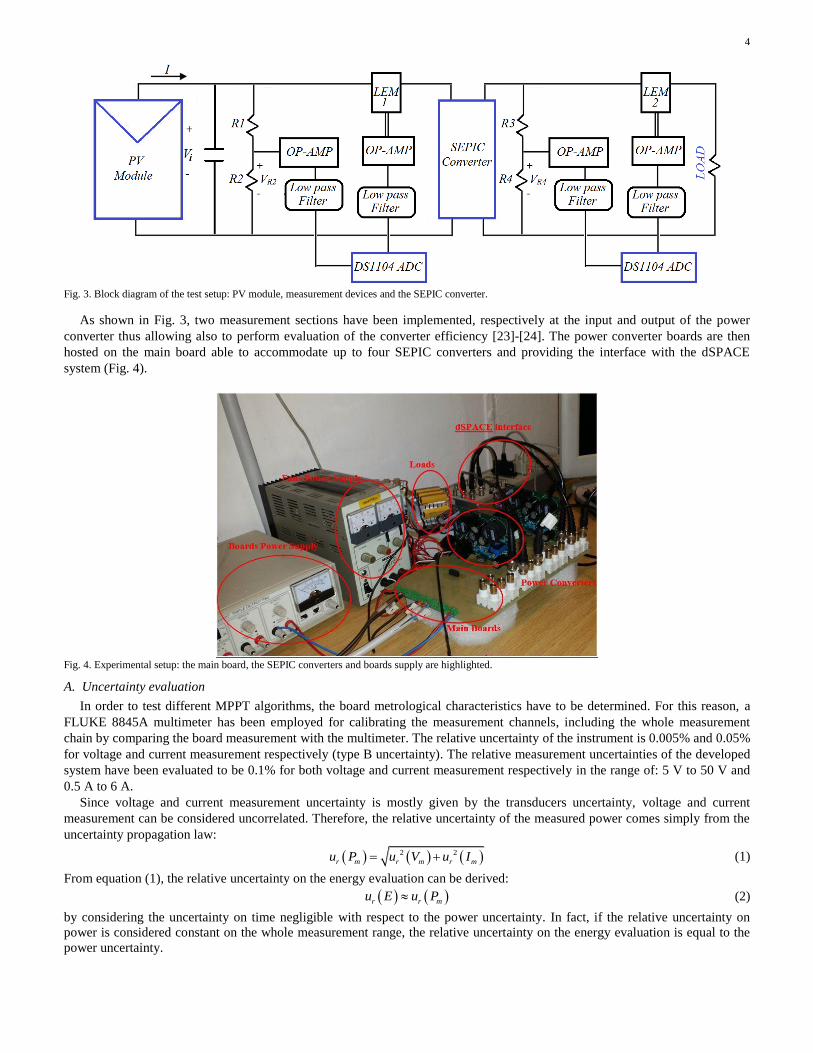
Fig. 4. Experimental setup: the main board, the SEPIC converters and boards supply are highlighted.
A. Uncertainty evaluation
In order to test different MPPT algorithms, the board metrological characteristics have to be determined. For this reason, a
FLUKE 8845A multimeter has been employed for calibrating the measurement channels, including the whole measurement
chain by comparing the board measurement with the multimeter. The relative uncertainty of the instrument is 0.005% and 0.05%
for voltage and current measurement respectively (type B uncertainty). The relative measurement uncertainties of the developed
system have been evaluated to be 0.1% for both voltage and current measurement respectively in the range of: 5 V to 50 V and
0.5 A to 6 A.
Since voltage and current measurement uncertainty is mostly given by the transducers uncertainty, voltage and current
measurement can be considered uncorrelated. Therefore, the relative uncertainty of the measured power comes simply from the
uncertainty propagation law:
2 2
r m r m r mu P u V u I (1)
From equation (1), the relative uncertainty on the energy evaluation can be derived:
r r mu E u P (2)
by considering the uncertainty on time negligible with respect to the power uncertainty. In fact, if the relative uncertainty on
power is considered constant on the whole measurement range, the relative uncertainty on the energy evaluation is equal to the
power uncertainty.
5
IV. MPPT ALGORITHMS
It is well known that the PV generated power strongly depends on the module temperature and solar radiation; hence, it
changes during the day. MPPT algorithms must provide a very accurate MPP reference to the converter in terms of voltage (Vmp)
or current (Imp) in order to maximize the produced energy. For this reason, the module voltage (or current) must be controlled
(usually through power converters) through algorithms that allow the module to work as close as possible to its maximum value.
In the scientific literature, different techniques have been developed; some of them are based on the knowledge of the shape of
the I-V characteristic (hill-climbing methods), others are based on the PV module model. The board is able to implement each
desired MPPT algorithm, modifying the control software; in particular, in this work two hill-climbing algorithms, the Perturb
and Observe (P&O) and Incremental Conductance (IC) methods have been taken into account together with a model-based
algorithm. In the following subsection, the three algorithms are presented.
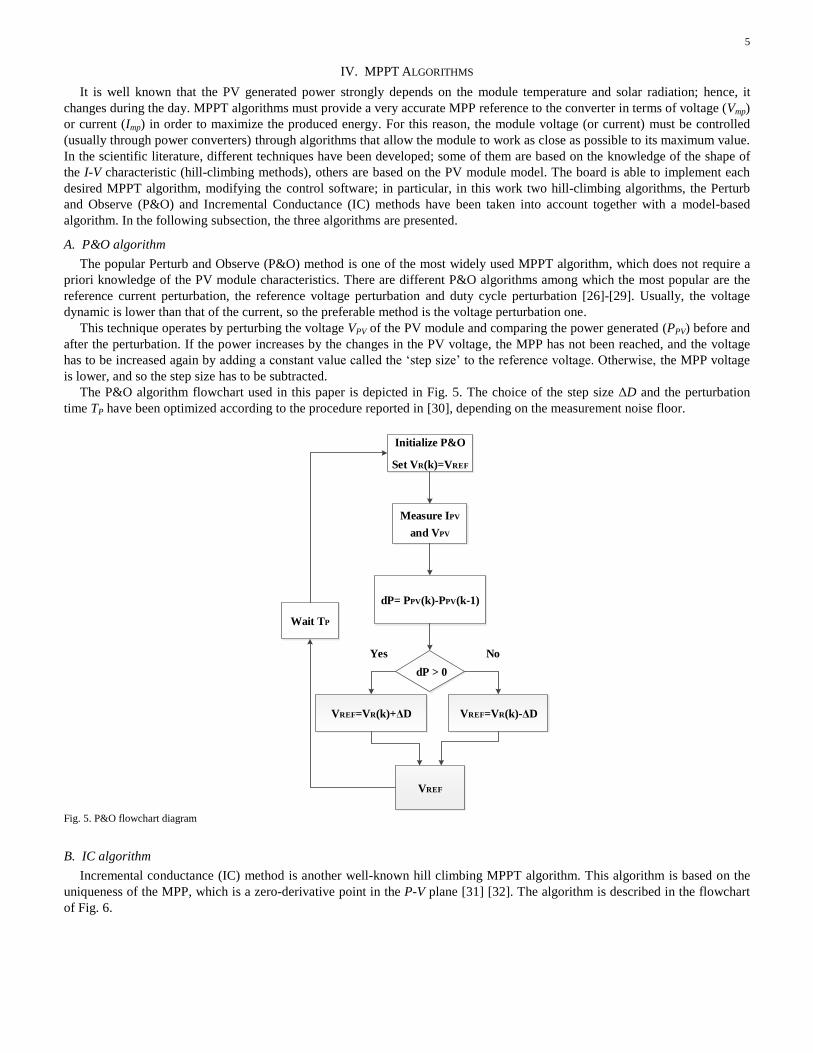
A. P&O algorithm
The popular Perturb and Observe (P&O) method is one of the most widely used MPPT algorithm, which does not require a
priori knowledge of the PV module characteristics. There are different P&O algorithms among which the most popular are the
reference current perturbation, the reference voltage perturbation and duty cycle perturbation [26]-[29]. Usually, the voltage
dynamic is lower than that of the current, so the preferable method is the voltage perturbation one.
This technique operates by perturbing the voltage VPV of the PV module and comparing the power generated (PPV) before and
after the perturbation. If the power increases by the changes in the PV voltage, the MPP has not been reached, and the voltage
has to be increased again by adding a constant value called the ‘step size’ to the reference voltage. Otherwise, the MPP voltage
is lower, and so the step size has to be subtracted.
The P&O algorithm flowchart used in this paper is depicted in Fig. 5. The choice of the step size ΔD and the perturbation
time TP have been optimized according to the procedure reported in [30], depending on the measurement noise floor.
Measure IPV
and VPV
dP > 0
Initialize P&O
Set VR(k)=VREF
dP= PPV(k)-PPV(k-1)
VREF=VR(k)-ΔD
VREF
VREF=VR(k)+ΔD
Wait TP
Yes No
Fig. 5. P&O flowchart diagram
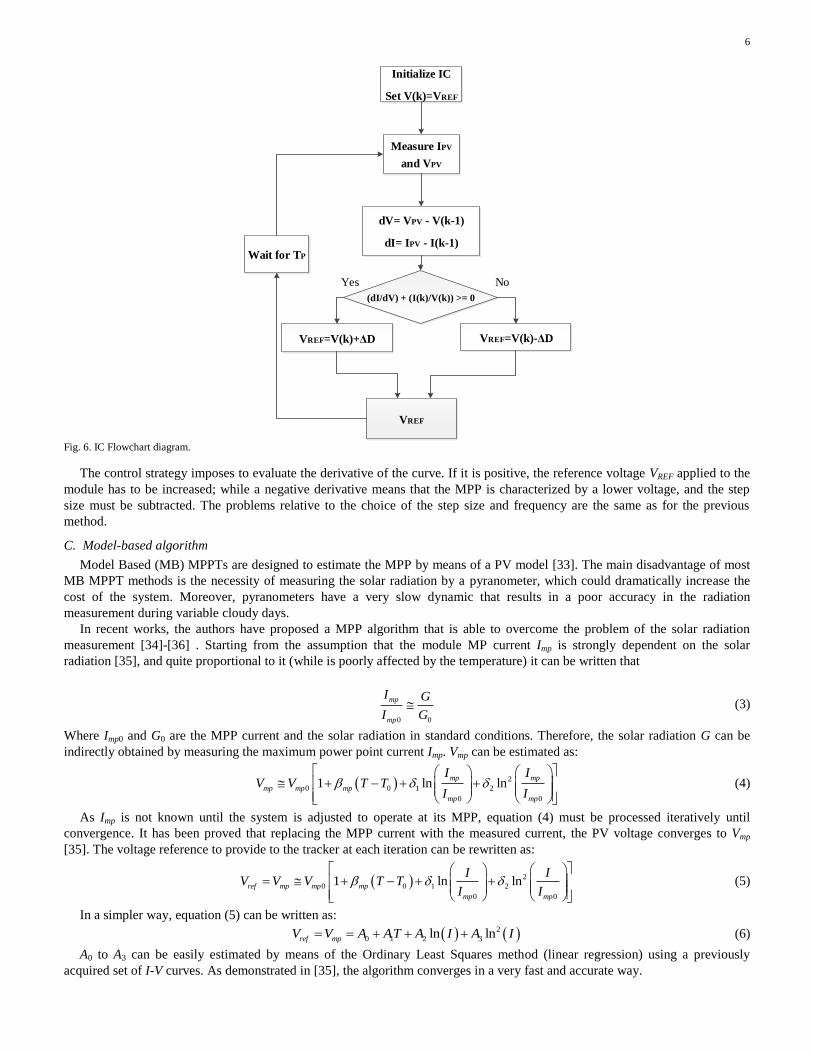
B. IC algorithm
Incremental conductance (IC) method is another well-known hill climbing MPPT algorithm. This algorithm is based on the
uniqueness of the MPP, which is a zero-derivative point in the P-V plane [31] [32]. The algorithm is described in the flowchart
of Fig. 6.
6
Measure IPV
and VPV
(dI/dV) + (I(k)/V(k)) >= 0
Initialize IC
Set V(k)=VREF
dV= VPV - V(k-1)
dI= IPV - I(k-1)
VREF=V(k)-ΔD
VREF
VREF=V(k)+ΔD
Wait for TP
Yes No
Fig. 6. IC Flowchart diagram.
The control strategy imposes to evaluate the derivative of the curve. If it is positive, the reference voltage VREF applied to the
module has to be increased; while a negative derivative means that the MPP is characterized by a lower voltage, and the step
size must be subtracted. The problems relative to the choice of the step size and frequency are the same as for the previous
method.
C. Model-based algorithm
Model Based (MB) MPPTs are designed to estimate the MPP by means of a PV model [33]. The main disadvantage of most
MB MPPT methods is the necessity of measuring the solar radiation by a pyranometer, which could dramatically increase the
cost of the system. Moreover, pyranometers have a very slow dynamic that results in a poor accuracy in the radiation
measurement during variable cloudy days.
In recent works, the authors have proposed a MPP algorithm that is able to overcome the problem of the solar radiation
measurement [34]-[36] . Starting from the assumption that the module MP current Imp is strongly dependent on the solar
radiation [35], and quite proportional to it (while is poorly affected by the temperature) it can be written that
0 0
mp
mp
I G
I G (3)
Where Imp0 and G0 are the MPP current and the solar radiation in standard conditions. Therefore, the solar radiation G can be
indirectly obtained by measuring the maximum power point current Imp. Vmp can be estimated as:
2
0 0 1 2
0 0
1 ln lnmp mp
mp mp mp
mp mp
I IV V T T
I I
(4)
As Imp is not known until the system is adjusted to operate at its MPP, equation (4) must be processed iteratively until
convergence. It has been proved that replacing the MPP current with the measured current, the PV voltage converges to Vmp
[35]. The voltage reference to provide to the tracker at each iteration can be rewritten as:
2
0 0 1 2
0 0
1 ln lnref mp mp mp
mp mp
I IV V V T T
I I
(5)
In a simpler way, equation (5) can be written as:
2
0 1 2 3ln lnref mpV V A AT A I A I (6)
A0 to A3 can be easily estimated by means of the Ordinary Least Squares method (linear regression) using a previously
acquired set of I-V curves. As demonstrated in [35], the algorithm converges in a very fast and accurate way.
7
V. PERFORMANCE EVALUATION AND COMPARISON OF MPPT ALGORITHMS
In this section, a comparison among the MPPTs described in the previous section is reported in order to show the system
capability in testing MPPT algorithms. In particular, the algorithms have been tested in both steady state and dynamic
conditions. Then, the comparison in terms of generated energy has been performed.
In this work, three PV modules have been considered: a 180W silicon monocrystalline module and two namely identical
80W polycrystalline solar modules (Table II).
TABLE II . PV MODULE PARAMETERS
80W 180W
PV Parameters Value Value
Voc 21.33 V 44.2 V
Isc 5.03 A 5.24 A
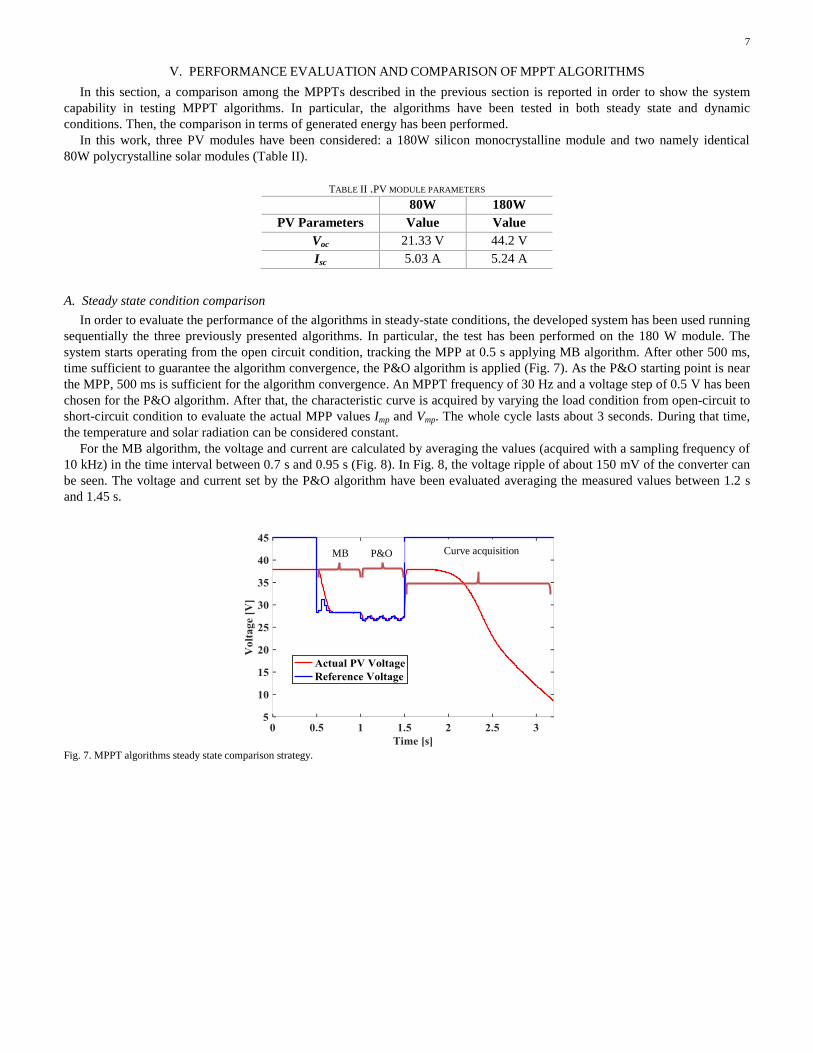
A. Steady state condition comparison
In order to evaluate the performance of the algorithms in steady-state conditions, the developed system has been used running
sequentially the three previously presented algorithms. In particular, the test has been performed on the 180 W module. The
system starts operating from the open circuit condition, tracking the MPP at 0.5 s applying MB algorithm. After other 500 ms,
time sufficient to guarantee the algorithm convergence, the P&O algorithm is applied (Fig. 7). As the P&O starting point is near
the MPP, 500 ms is sufficient for the algorithm convergence. An MPPT frequency of 30 Hz and a voltage step of 0.5 V has been
chosen for the P&O algorithm. After that, the characteristic curve is acquired by varying the load condition from open-circuit to
short-circuit condition to evaluate the actual MPP values Imp and Vmp. The whole cycle lasts about 3 seconds. During that time,
the temperature and solar radiation can be considered constant.
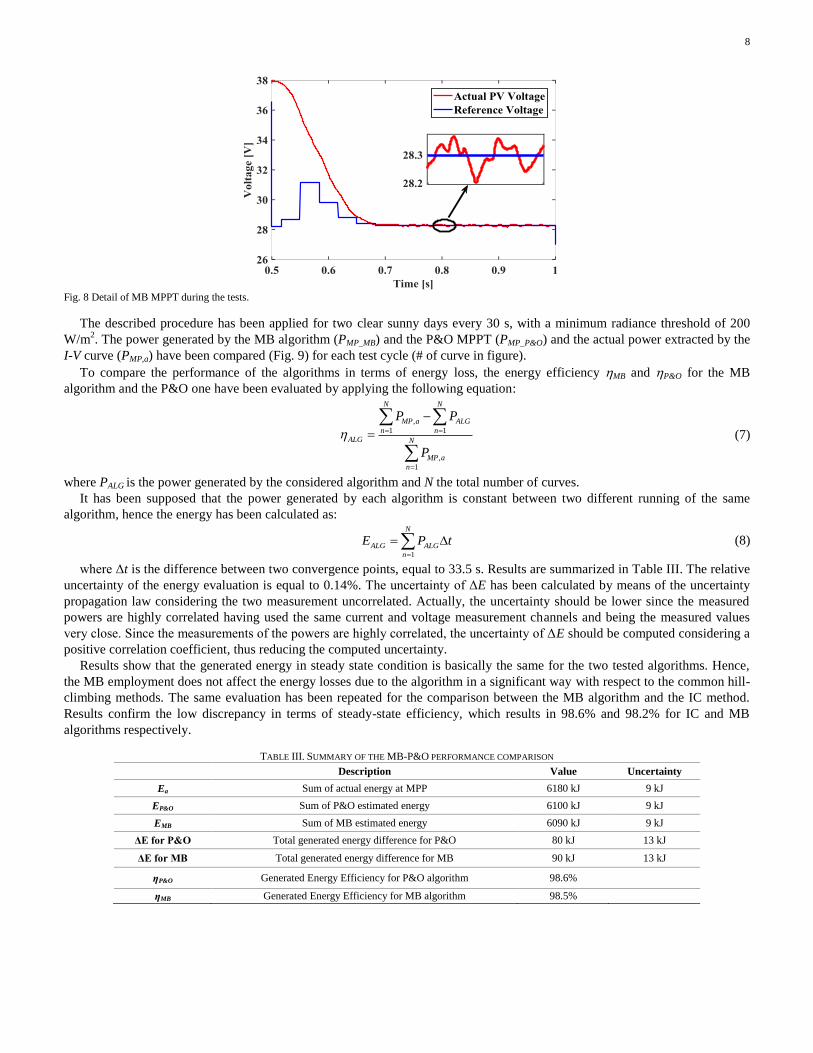
For the MB algorithm, the voltage and current are calculated by averaging the values (acquired with a sampling frequency of
10 kHz) in the time interval between 0.7 s and 0.95 s (Fig. 8). In Fig. 8, the voltage ripple of about 150 mV of the converter can
be seen. The voltage and current set by the P&O algorithm have been evaluated averaging the measured values between 1.2 s
and 1.45 s.
Fig. 7. MPPT algorithms steady state comparison strategy.
Curve acquisition
MB P&O
8
Fig. 8 Detail of MB MPPT during the tests.
The described procedure has been applied for two clear sunny days every 30 s, with a minimum radiance threshold of 200
W/m2. The power generated by the MB algorithm (PMP_MB) and the P&O MPPT (PMP_P&O) and the actual power extracted by the
I-V curve (PMP,a) have been compared (Fig. 9) for each test cycle (# of curve in figure).
To compare the performance of the algorithms in terms of energy loss, the energy efficiency MB and P&O for the MB
algorithm and the P&O one have been evaluated by applying the following equation:
,
1 1
,
1
N N
MP a ALG
n n
ALG N
MP a
n
P P
P
(7)
where PALG is the power generated by the considered algorithm and N the total number of curves.
It has been supposed that the power generated by each algorithm is constant between two different running of the same
algorithm, hence the energy has been calculated as:
1
N
ALG ALG
n
E P t
(8)
where Δt is the difference between two convergence points, equal to 33.5 s. Results are summarized in Table III. The relative
uncertainty of the energy evaluation is equal to 0.14%. The uncertainty of ΔE has been calculated by means of the uncertainty
propagation law considering the two measurement uncorrelated. Actually, the uncertainty should be lower since the measured
powers are highly correlated having used the same current and voltage measurement channels and being the measured values
very close. Since the measurements of the powers are highly correlated, the uncertainty of ΔE should be computed considering a
positive correlation coefficient, thus reducing the computed uncertainty.
Results show that the generated energy in steady state condition is basically the same for the two tested algorithms. Hence,
the MB employment does not affect the energy losses due to the algorithm in a significant way with respect to the common hill-
climbing methods. The same evaluation has been repeated for the comparison between the MB algorithm and the IC method.
Results confirm the low discrepancy in terms of steady-state efficiency, which results in 98.6% and 98.2% for IC and MB
algorithms respectively.
TABLE III. SUMMARY OF THE MB-P&O PERFORMANCE COMPARISON
Description Value Uncertainty
Ea Sum of actual energy at MPP 6180 kJ 9 kJ
EP&O Sum of P&O estimated energy 6100 kJ 9 kJ
EMB Sum of MB estimated energy 6090 kJ 9 kJ
ΔE for P&O Total generated energy difference for P&O 80 kJ 13 kJ
ΔE for MB Total generated energy difference for MB 90 kJ 13 kJ
ηP&O Generated Energy Efficiency for P&O algorithm 98.6%
ηMB Generated Energy Efficiency for MB algorithm 98.5%
9
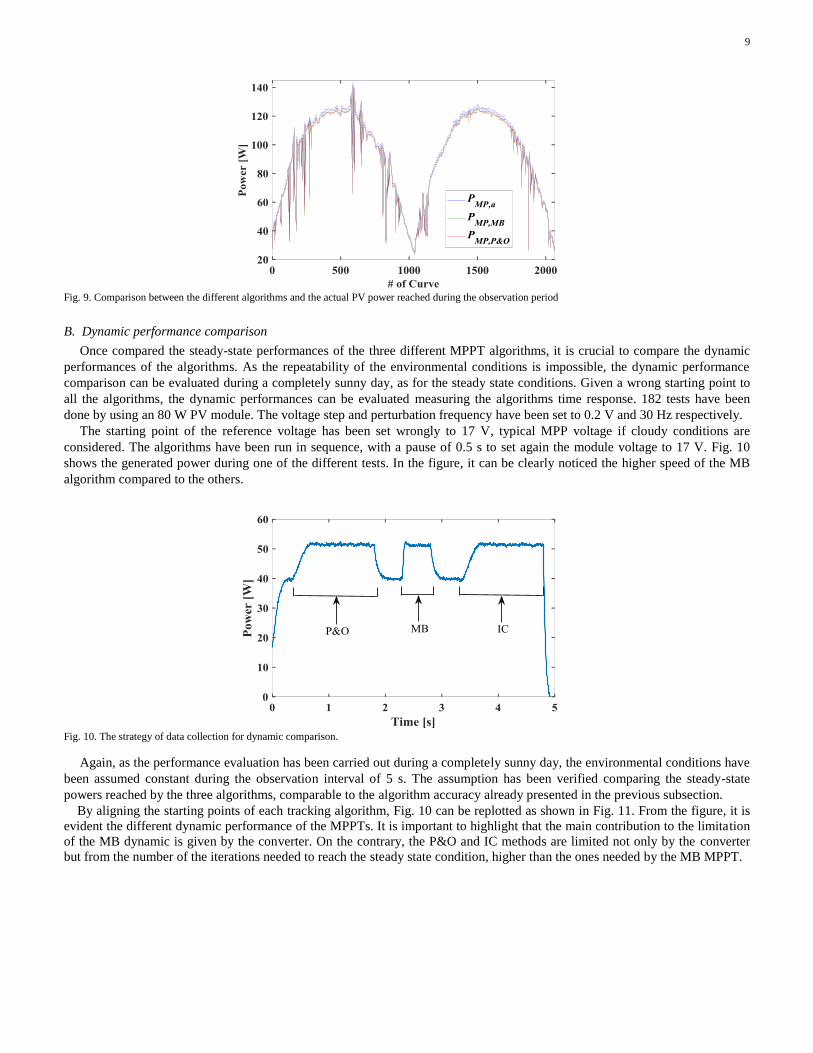
Fig. 9. Comparison between the different algorithms and the actual PV power reached during the observation period
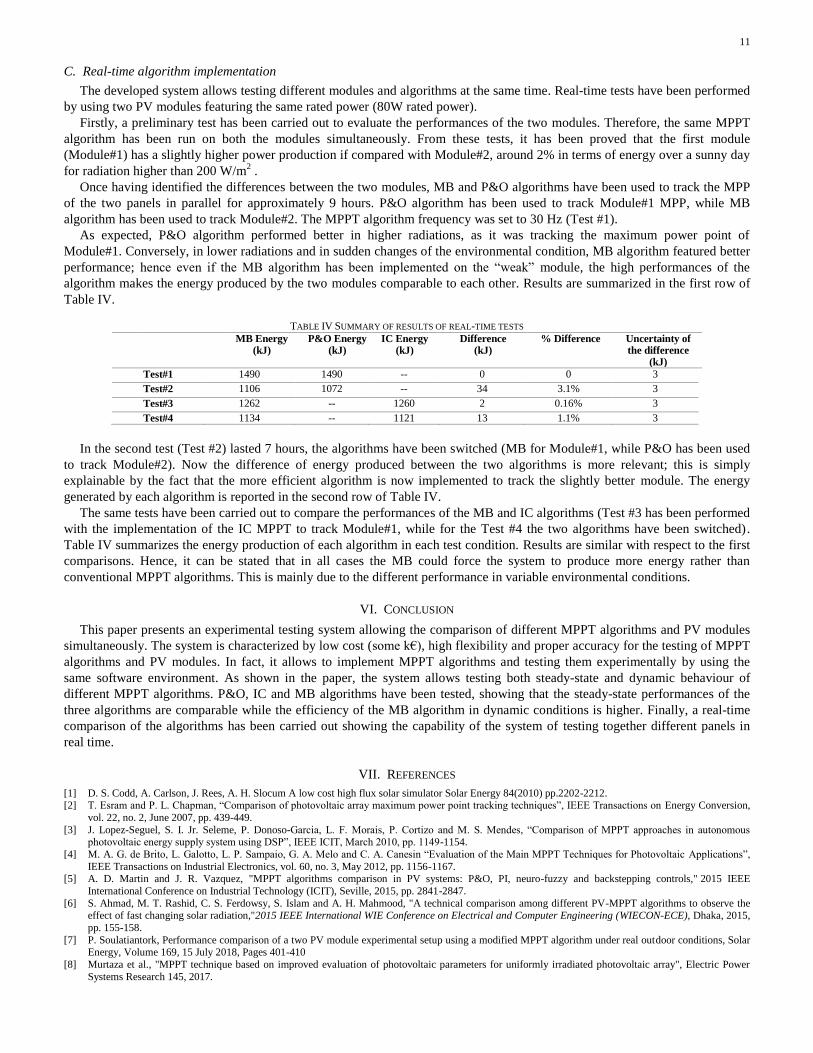
B. Dynamic performance comparison
Once compared the steady-state performances of the three different MPPT algorithms, it is crucial to compare the dynamic
performances of the algorithms. As the repeatability of the environmental conditions is impossible, the dynamic performance
comparison can be evaluated during a completely sunny day, as for the steady state conditions. Given a wrong starting point to
all the algorithms, the dynamic performances can be evaluated measuring the algorithms time response. 182 tests have been
done by using an 80 W PV module. The voltage step and perturbation frequency have been set to 0.2 V and 30 Hz respectively.
The starting point of the reference voltage has been set wrongly to 17 V, typical MPP voltage if cloudy conditions are
considered. The algorithms have been run in sequence, with a pause of 0.5 s to set again the module voltage to 17 V. Fig. 10
shows the generated power during one of the different tests. In the figure, it can be clearly noticed the higher speed of the MB
algorithm compared to the others.
Fig. 10. The strategy of data collection for dynamic comparison.
Again, as the performance evaluation has been carried out during a completely sunny day, the environmental conditions have
been assumed constant during the observation interval of 5 s. The assumption has been verified comparing the steady-state
powers reached by the three algorithms, comparable to the algorithm accuracy already presented in the previous subsection.
By aligning the starting points of each tracking algorithm, Fig. 10 can be replotted as shown in Fig. 11. From the figure, it is
evident the different dynamic performance of the MPPTs. It is important to highlight that the main contribution to the limitation
of the MB dynamic is given by the converter. On the contrary, the P&O and IC methods are limited not only by the converter
but from the number of the iterations needed to reach the steady state condition, higher than the ones needed by the MB MPPT.

10
Fig. 11. Dynamic difference between P&O and MB algorithm and losses.
In order to give quantitative data, the dynamic energy losses can be computed. Given the MB algorithm as reference, the
power difference between the MB algorithm and the hill-climbing algorithms over time have been computed as depicted in Fig.
11. In the figure, it can be distinguished the dynamic error and the steady state error. When the power difference is lower than
1W (the error reaches approximately to 2%), the system has been considered in steady state condition. Fig. 12 depicts the
computed energy difference for both algorithms, while Fig. 13 reports the evaluation of the differences of convergence time of
the two hill-climbing methods with respect to MB one.
Fig. 12. MB-P&O energy difference (Blue), MB-IC energy difference (Red)
Fig. 13. Difference of time to steady state convergence for P&O (Blue) and IC (Red) with respect to MB MPPT.
11
C. Real-time algorithm implementation
The developed system allows testing different modules and algorithms at the same time. Real-time tests have been performed
by using two PV modules featuring the same rated power (80W rated power).
Firstly, a preliminary test has been carried out to evaluate the performances of the two modules. Therefore, the same MPPT
algorithm has been run on both the modules simultaneously. From these tests, it has been proved that the first module
(Module#1) has a slightly higher power production if compared with Module#2, around 2% in terms of energy over a sunny day
for radiation higher than 200 W/m2 .
Once having identified the differences between the two modules, MB and P&O algorithms have been used to track the MPP
of the two panels in parallel for approximately 9 hours. P&O algorithm has been used to track Module#1 MPP, while MB
algorithm has been used to track Module#2. The MPPT algorithm frequency was set to 30 Hz (Test #1).
As expected, P&O algorithm performed better in higher radiations, as it was tracking the maximum power point of
Module#1. Conversely, in lower radiations and in sudden changes of the environmental condition, MB algorithm featured better
performance; hence even if the MB algorithm has been implemented on the “weak” module, the high performances of the
algorithm makes the energy produced by the two modules comparable to each other. Results are summarized in the first row of
Table IV.
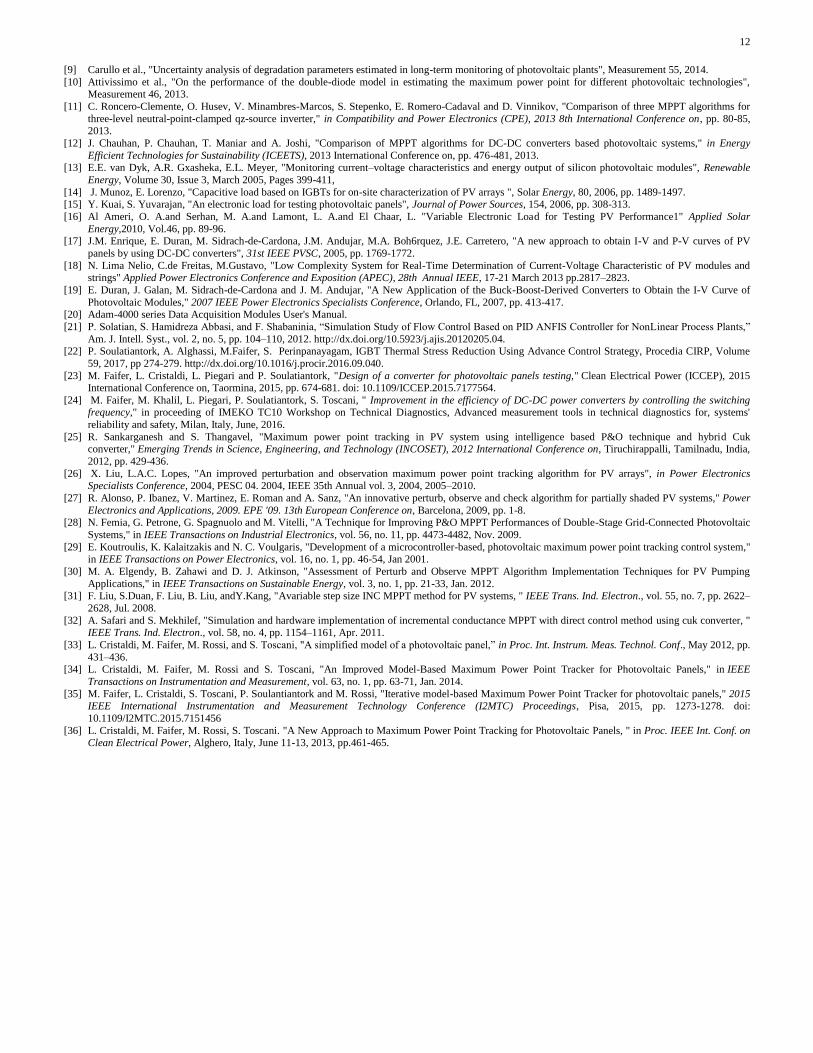
TABLE IV SUMMARY OF RESULTS OF REAL-TIME TESTS
MB Energy (kJ)
P&O Energy (kJ)
IC Energy (kJ)
Difference (kJ)
% Difference Uncertainty of the difference
(kJ)
Test#1 1490 1490 -- 0 0 3
Test#2 1106 1072 -- 34 3.1% 3
Test#3 1262 -- 1260 2 0.16% 3
Test#4 1134 -- 1121 13 1.1% 3
In the second test (Test #2) lasted 7 hours, the algorithms have been switched (MB for Module#1, while P&O has been used
to track Module#2). Now the difference of energy produced between the two algorithms is more relevant; this is simply
explainable by the fact that the more efficient algorithm is now implemented to track the slightly better module. The energy
generated by each algorithm is reported in the second row of Table IV.
The same tests have been carried out to compare the performances of the MB and IC algorithms (Test #3 has been performed
with the implementation of the IC MPPT to track Module#1, while for the Test #4 the two algorithms have been switched).
Table IV summarizes the energy production of each algorithm in each test condition. Results are similar with respect to the first
comparisons. Hence, it can be stated that in all cases the MB could force the system to produce more energy rather than
conventional MPPT algorithms. This is mainly due to the different performance in variable environmental conditions.
VI. CONCLUSION
This paper presents an experimental testing system allowing the comparison of different MPPT algorithms and PV modules
simultaneously. The system is characterized by low cost (some k€), high flexibility and proper accuracy for the testing of MPPT
algorithms and PV modules. In fact, it allows to implement MPPT algorithms and testing them experimentally by using the
same software environment. As shown in the paper, the system allows testing both steady-state and dynamic behaviour of
different MPPT algorithms. P&O, IC and MB algorithms have been tested, showing that the steady-state performances of the
three algorithms are comparable while the efficiency of the MB algorithm in dynamic conditions is higher. Finally, a real-time
comparison of the algorithms has been carried out showing the capability of the system of testing together different panels in
real time.
VII. REFERENCES
[1] D. S. Codd, A. Carlson, J. Rees, A. H. Slocum A low cost high flux solar simulator Solar Energy 84(2010) pp.2202-2212. [2] T. Esram and P. L. Chapman, “Comparison of photovoltaic array maximum power point tracking techniques”, IEEE Transactions on Energy Conversion,
vol. 22, no. 2, June 2007, pp. 439-449.
[3] J. Lopez-Seguel, S. I. Jr. Seleme, P. Donoso-Garcia, L. F. Morais, P. Cortizo and M. S. Mendes, “Comparison of MPPT approaches in autonomous photovoltaic energy supply system using DSP”, IEEE ICIT, March 2010, pp. 1149-1154.
[4] M. A. G. de Brito, L. Galotto, L. P. Sampaio, G. A. Melo and C. A. Canesin “Evaluation of the Main MPPT Techniques for Photovoltaic Applications”,
IEEE Transactions on Industrial Electronics, vol. 60, no. 3, May 2012, pp. 1156-1167. [5] A. D. Martin and J. R. Vazquez, "MPPT algorithms comparison in PV systems: P&O, PI, neuro-fuzzy and backstepping controls," 2015 IEEE
International Conference on Industrial Technology (ICIT), Seville, 2015, pp. 2841-2847.
[6] S. Ahmad, M. T. Rashid, C. S. Ferdowsy, S. Islam and A. H. Mahmood, "A technical comparison among different PV-MPPT algorithms to observe the
effect of fast changing solar radiation,"2015 IEEE International WIE Conference on Electrical and Computer Engineering (WIECON-ECE), Dhaka, 2015,
pp. 155-158.
[7] P. Soulatiantork, Performance comparison of a two PV module experimental setup using a modified MPPT algorithm under real outdoor conditions, Solar Energy, Volume 169, 15 July 2018, Pages 401-410
[8] Murtaza et al., "MPPT technique based on improved evaluation of photovoltaic parameters for uniformly irradiated photovoltaic array", Electric Power
Systems Research 145, 2017.
12
[9] Carullo et al., "Uncertainty analysis of degradation parameters estimated in long-term monitoring of photovoltaic plants", Measurement 55, 2014.
[10] Attivissimo et al., "On the performance of the double-diode model in estimating the maximum power point for different photovoltaic technologies",
Measurement 46, 2013.
[11] C. Roncero-Clemente, O. Husev, V. Minambres-Marcos, S. Stepenko, E. Romero-Cadaval and D. Vinnikov, "Comparison of three MPPT algorithms for
three-level neutral-point-clamped qz-source inverter," in Compatibility and Power Electronics (CPE), 2013 8th International Conference on, pp. 80-85, 2013.
[12] J. Chauhan, P. Chauhan, T. Maniar and A. Joshi, "Comparison of MPPT algorithms for DC-DC converters based photovoltaic systems," in Energy
Efficient Technologies for Sustainability (ICEETS), 2013 International Conference on, pp. 476-481, 2013. [13] E.E. van Dyk, A.R. Gxasheka, E.L. Meyer, "Monitoring current–voltage characteristics and energy output of silicon photovoltaic modules", Renewable
Energy, Volume 30, Issue 3, March 2005, Pages 399-411,
[14] J. Munoz, E. Lorenzo, "Capacitive load based on IGBTs for on-site characterization of PV arrays ", Solar Energy, 80, 2006, pp. 1489-1497. [15] Y. Kuai, S. Yuvarajan, "An electronic load for testing photovoltaic panels", Journal of Power Sources, 154, 2006, pp. 308-313.
[16] Al Ameri, O. A.and Serhan, M. A.and Lamont, L. A.and El Chaar, L. "Variable Electronic Load for Testing PV Performance1" Applied Solar
Energy,2010, Vol.46, pp. 89-96. [17] J.M. Enrique, E. Duran, M. Sidrach-de-Cardona, J.M. Andujar, M.A. Boh6rquez, J.E. Carretero, "A new approach to obtain I-V and P-V curves of PV
panels by using DC-DC converters", 31st IEEE PVSC, 2005, pp. 1769-1772.
[18] N. Lima Nelio, C.de Freitas, M.Gustavo, "Low Complexity System for Real-Time Determination of Current-Voltage Characteristic of PV modules and strings" Applied Power Electronics Conference and Exposition (APEC), 28th Annual IEEE, 17-21 March 2013 pp.2817–2823.
[19] E. Duran, J. Galan, M. Sidrach-de-Cardona and J. M. Andujar, "A New Application of the Buck-Boost-Derived Converters to Obtain the I-V Curve of
Photovoltaic Modules," 2007 IEEE Power Electronics Specialists Conference, Orlando, FL, 2007, pp. 413-417. [20] Adam-4000 series Data Acquisition Modules User's Manual.
[21] P. Solatian, S. Hamidreza Abbasi, and F. Shabaninia, “Simulation Study of Flow Control Based on PID ANFIS Controller for NonLinear Process Plants,”
Am. J. Intell. Syst., vol. 2, no. 5, pp. 104–110, 2012. http://dx.doi.org/10.5923/j.ajis.20120205.04. [22] P. Soulatiantork, A. Alghassi, M.Faifer, S. Perinpanayagam, IGBT Thermal Stress Reduction Using Advance Control Strategy, Procedia CIRP, Volume
59, 2017, pp 274-279. http://dx.doi.org/10.1016/j.procir.2016.09.040.
[23] M. Faifer, L. Cristaldi, L. Piegari and P. Soulatiantork, "Design of a converter for photovoltaic panels testing," Clean Electrical Power (ICCEP), 2015 International Conference on, Taormina, 2015, pp. 674-681. doi: 10.1109/ICCEP.2015.7177564.
[24] M. Faifer, M. Khalil, L. Piegari, P. Soulatiantork, S. Toscani, " Improvement in the efficiency of DC-DC power converters by controlling the switching frequency," in proceeding of IMEKO TC10 Workshop on Technical Diagnostics, Advanced measurement tools in technical diagnostics for, systems'
reliability and safety, Milan, Italy, June, 2016.
[25] R. Sankarganesh and S. Thangavel, "Maximum power point tracking in PV system using intelligence based P&O technique and hybrid Cuk converter," Emerging Trends in Science, Engineering, and Technology (INCOSET), 2012 International Conference on, Tiruchirappalli, Tamilnadu, India,
2012, pp. 429-436.
[26] X. Liu, L.A.C. Lopes, "An improved perturbation and observation maximum power point tracking algorithm for PV arrays", in Power Electronics Specialists Conference, 2004, PESC 04. 2004, IEEE 35th Annual vol. 3, 2004, 2005–2010.
[27] R. Alonso, P. Ibanez, V. Martinez, E. Roman and A. Sanz, "An innovative perturb, observe and check algorithm for partially shaded PV systems," Power
Electronics and Applications, 2009. EPE '09. 13th European Conference on, Barcelona, 2009, pp. 1-8. [28] N. Femia, G. Petrone, G. Spagnuolo and M. Vitelli, "A Technique for Improving P&O MPPT Performances of Double-Stage Grid-Connected Photovoltaic
Systems," in IEEE Transactions on Industrial Electronics, vol. 56, no. 11, pp. 4473-4482, Nov. 2009.
[29] E. Koutroulis, K. Kalaitzakis and N. C. Voulgaris, "Development of a microcontroller-based, photovoltaic maximum power point tracking control system," in IEEE Transactions on Power Electronics, vol. 16, no. 1, pp. 46-54, Jan 2001.
[30] M. A. Elgendy, B. Zahawi and D. J. Atkinson, "Assessment of Perturb and Observe MPPT Algorithm Implementation Techniques for PV Pumping
Applications," in IEEE Transactions on Sustainable Energy, vol. 3, no. 1, pp. 21-33, Jan. 2012. [31] F. Liu, S.Duan, F. Liu, B. Liu, andY.Kang, "Avariable step size INC MPPT method for PV systems, " IEEE Trans. Ind. Electron., vol. 55, no. 7, pp. 2622–
2628, Jul. 2008.
[32] A. Safari and S. Mekhilef, "Simulation and hardware implementation of incremental conductance MPPT with direct control method using cuk converter, " IEEE Trans. Ind. Electron., vol. 58, no. 4, pp. 1154–1161, Apr. 2011.
[33] L. Cristaldi, M. Faifer, M. Rossi, and S. Toscani, "A simplified model of a photovoltaic panel,” in Proc. Int. Instrum. Meas. Technol. Conf., May 2012, pp.
431–436. [34] L. Cristaldi, M. Faifer, M. Rossi and S. Toscani, "An Improved Model-Based Maximum Power Point Tracker for Photovoltaic Panels," in IEEE
Transactions on Instrumentation and Measurement, vol. 63, no. 1, pp. 63-71, Jan. 2014.
[35] M. Faifer, L. Cristaldi, S. Toscani, P. Soulantiantork and M. Rossi, "Iterative model-based Maximum Power Point Tracker for photovoltaic panels," 2015 IEEE International Instrumentation and Measurement Technology Conference (I2MTC) Proceedings, Pisa, 2015, pp. 1273-1278. doi:
10.1109/I2MTC.2015.7151456
[36] L. Cristaldi, M. Faifer, M. Rossi, S. Toscani. "A New Approach to Maximum Power Point Tracking for Photovoltaic Panels, " in Proc. IEEE Int. Conf. on Clean Electrical Power, Alghero, Italy, June 11-13, 2013, pp.461-465.