Embed Size (px)
Citation preview

A time to blossomA time to change
NATIONAL INVESTMENT (UNIT) TRUST
3 RD Q UART ER LY RE P O RT MA RC H 2 0 0 9
NIT - THE CATALYST OF CHANGE
IN VESTED WITH TRUSTINVESTED WITH TRUST

Our Mission
Our VisionBe recognized as the beacon of positivechange in the Capital Markets. Leadingby example, with an aim to provide then ec essary o ppo r tun ity to a ll th estakeholders and to contribute towardshealthy growth of the industry.
To serve the investors by providing bestpossible return on their investments andto invest in the Capital Markets in amanner, which could provide depth forthe investors and necessary capital to theindustry.

Contents• Corporate Information• Chairman’s Review• Financial Statements• Notes to the Financial Statements• Statement of Movement inPortfolio• Branches
020306111325

Corporate Information
Chairman & MDTariq Iqbal Khan
Head of Asset ManagementManzoor Ahmed
Chief Financial OfficerAamir Amin
Company SecretaryNeelofar Hameed
TrusteeNational Bank of Pakistan Limited
AuditorsM/s. Anjum Asim Shahid RahmanChar tered Accountants
Legal AdvisorM. Naeem SahgalWalker Martineau Saleem
Muhammad Masood KhanMuhammad Masood Khan & CoAdvocates & Legal Consultants
Registered OfficeNational Investment Trust LimitedNBP Building, 6th Floor,I.I. Chundrigar Road, Karachi.Tel : 111-NIT-NIT
(111-648-648)Fax : 021-2422719Email : [email protected] : www.nit.com.pk
Board of DirectorsMr. Tariq Iqbal KhanMr. S. Ali RazaMian Tajammal HussainMs. Rukhsana SaleemMr. Abdul Hamid AdamjeeMr. Jamal NasimMr. Aftab Ahmad KhanMr. Bahauddin KhanMs. Nazrat Bashir
Management CompanyNational Investment Trust Limited
Audit CommitteeMian Tajammal HussainMr. Jamal NasimMs. Nazrat Bashir
BankersNational Bank of Pakistan LtdMCB Bank LtdHabib Bank LtdStandard Char tered Bank (Pakistan) LtdHabib Metropolitan Bank LtdFaysal Bank LtdAskari Bank LtdSoneri Bank LtdUnited Bank LtdAllied Bank LtdThe Bank of PunjabMeezan Bank LtdBank Al Habib LtdBank Al Falah LtdNIB Bank LtdSaudi Pak Commercial Bank LtdRBS LtdArif Habib Bank Ltd
02 Corporate Infor mation National Investment (unit) Trust

03Chairman's ReviewNational Investment (unit) Trust
Dear Unit Holder s,
The springtime for Stock Market has begun and equities are now in a sustained ra lly. KSE 100 Index recovered 14.5% in quar ter ended March 31, 2009 wi th posi tive signsof fu ture recovery which is evident from current improved trading volumes.
The fi rst ha lf of cur rent financial year wi tnessed the most painfu l period for the stock market investors. Global financia l crisis along with imposition of price floor local ly resultedin massive fore ign sell ing. Despite th is, NIT remained adhered to i ts policy of not sel ling in the depressed mar ket. Instead, NIT has been generating activi ties in the marketwith the view to pick value stocks and at the same time to suppor t the market through i ts operations and launching of new funds NIT EMOF and NIT SEF.
Sales of un its aggregated Rs. 5,487 mi llion (incl. CIPs) during the period shows the h igh level o f confidence by the uni t-holders in this time of distress.
The net income of the Fund (excluding unreal ized gains / (loss) and impai rment loss) stood at Rs.1,399 mi llion against Rs.1,951 mi ll ion during the corres ponding periodlast year.
Future Prospects
Excessive in flationary pressure, h igher interest rates and bleak international macro economic outlook are difficult challenges facing the country. I see NIT continuing to play a dominatingrole in promoting a broad based par ticipation in the country’s equi ty markets. In this difficult time NIT is taking all the required measures to stabilize the market as we are one of thelargest stakeholders in the market. Based on the above, we remain cautious that significant progress is to be achieved by us to provide our investors a good return.
Launching of new Funds
It gives me pleasure in informing our un it-holders that NIT has also launched two new Funds.1. NIT – Equity Market Opportunity Fund (NIT-EMOF)2. NIT – State Enterprise Fund (NIT-SEF)
I assure our esteemed unit-holders that market stabilizing measures including the launching of above funds would bolster the Equity Markets and provide the sustainability to our existingFunds.
These two Funds have been launched in order to stabi lize the market on behest of all the stakeholders. The NIT-SEF on the assets side is composed of 8 public sector stocks in whichNBP, State Li fe Insurance Company, Employees Old Age Benefits Institution and a syndicate comprised of 8 scheduled banks has participated as Funds’ providers. Gover nmentguarantee is avai lable to these funds provider that in case of loss suffered, after a period of three years then such loss would be financed by the Government.
NIT-EMOF is a Fund which has been invested in 50 KSE stocks. NBP, State Life Insurance Company, Employees Old Age Benefi ts Insti tution & National Insurance Corporation are thepartic ipants of the fund.
Recognition of Impairment Loss on Available for Sale (AFS) Category through Profit & Loss Account
Securities and Exchange Commission of Pakistan (SECP) through noti fication vide SRO 150 (1) / 2009 dated February 13, 2009 allowing that the impai rment loss, if any, recognizedas on December 31, 2008 due to va luation of l isted equity investments he ld as ‘Available for Sale’ to quoted market prices may be shown under the equity. The amount taken to equityincluding any adjustment / effect for price movements shall be taken to Profi t and Loss Account on quarterly basis during the year ending December 31, 2009. The amount taken toequity at December 31, 2008 shall be treated as a charge to Profit and Loss Account for the purposes of distribution as dividend.
The impairment loss based on market values as at December 31, 2008 has been determined at Rs. 15,395 million. In December 31, 2008 period, we didn’t recognize the impairmentfor ‘Available for Sale’ equity securities through Profit and Loss account rather it was charged to Equity in terms of relaxation provided by above SRO.
Financial Performance
Chairman's Review
Net Income*Capital GainsDividend IncomeImpairment loss – AFSNet AssetsNAV (Rs. per Unit)
Earning Per Unit (Rs.)Without unrealized (diminution) /apprecia tion in the market va lueof investments classified as he ldfor tr ading & impai rment loss
With unr eal ized (d iminution) / appreciation in the market valueof investments classified as he ldfor tr ading & impai rment loss
Transactions in shares
Purchases SalesGross Sales of Uni ts (excl . CIP)
1,399 36
1,41015,395
25,252 25.58
1.42
(16.61)
1,542 41
3,473
1,951349
1,550-
57,270 63.62
2.17
2.99
6,5912,006
12,183
(28.29)% (89.68)% (9 .03)%100.00%(55.91)%(59.79)%
(34.56)%
(655.52)%
(76.60)%(97.96)%(71.49)%
Mar 09(Rs. Mil lion)
Mar 08(Rs. Mil lion) Change
* Inclusive of capi ta l ga ins and d ividend income but excluding unrealized gains / (loss)and impairment loss.

04 Chairman's Review National Investment (unit) Trust
Chairman's Review
Although above referred SRO allows to charge impairment loss through Profit and Loss Accounts on quarterly basis including any adjustment / effect for price movement, we considerit more prudent to charge the full impairment loss earmarked on the December 31, 2008 through Profit and Loss Account in terms of full compliance of IAS 39 which is a lways warrantedand desired.
Keeping in mind the daily pricing mechanism of units, we have recognized the above impairment loss of Rs. 15,395 million in cur rent quarter through Profit and Loss Account and removeit from equity in one go. It won’t impact the daily NAV. Rather, your portfolio would become easily tradeable in terms of realizing the capita l gains.
Separate set of Financial Statements for LOC Holders’ Fund and Non LOC Holders’ Fund:
Effective from April 01, 2007, NITL being the management company has been managing two separate Funds. Whilst un-bundl ing the Fund, i t has been ensured that quantita tive andqualitative equiva lence is maintained and that the rights and entitlements of all unit holders, in particular the small unit ho lders are not infringed upon.
Consequent upon the un-bundling to the Funds, two separate sets o f financial statements are being prepared and distributed to the unit holders of Non LOC Holders’ Fund and LOCHolders’ Fund separately.
Conclusion
I would like to thank our uni t holders for demonstrating their faith in us and the NIT employees for their hard work. I would also like to thank our Trustee - National Bank of Pakistan, theSecurities & Exchange Commission of Pakistan, State Bank of Pakistan and the Ministry of Finance for their continued cooperation and support.
I would also l ike to thank the fund providers for the two Funds, without which we couldn’t have seen the stability in the stock market.
Yours truly,
Tariq Iqbal KhanChair man & Managing DirectorDate: April 29, 2009

06 National Investment (unit) TrustCONDENSED STAT EMENT OF ASSETS AND LIABILITIES (UNAUDIT ED)
CONDENSED STATEMENT OF ASSETS AND LIABILITIES(UNAUDITED)AS AT MARCH 31, 2009
-
Note March 31, June 30,2009 2008
Unaudited Audited
Assets
Bank balancesReceivable from selling banksReceivable from National Investment Trust Limited
-Management CompanyInvestmentsLoans and receivablesOther receivables
427,925 3,473,18018,191
39,858 206,9753 27,060,689 45,870,924
395 35,872228,656 195,645
Total assets 27,757,523 49,800,787
Liabilities
Short-term financesPayable to selling banksPayable to National Investment Trust Limited -Management CompanyCreditors, accrued and other liabilitiesUnclaimed distribution
1,200,000 2,850,000- 1,979
1,020,013 1,144,99255,457 68,111
230,264 150,442Total liabilities 2,505,734 4,215,524
Contingencies and commitments 4
Net Assets 25,251,789 45,585,263
Unit holders' funds (as per statement attached) 25,251,789 45,585,263
Number of units in issue 5 987,331 861,992
Net asset value per unit 25.58 52.88
For National Investment Trust Limited(Management Company)
(Rupees in '00 0)
(No. of units '0 00)
(Rupees )
Managing DirectorSd/-
DirectorSd/-
DirectorSd/-
S.V.P. / Divisional HeadFor National Bank of Pakistan (Trustee)
Sd/-
The annexed s elected notes from 1 to 11 form an integr al part o f thes e condens ed in terim financia l s ta tem ents.

07National Investment (unit) Trust CONDENSED INCOME STATEMEN T (UNAUDITED)
CONDENSED INCOME STATEMENT(UNAUDITED)FOR THE NINE MONTHS ENDED MARCH 31, 2009
Managing DirectorSd/-
DirectorSd/-
DirectorSd/-
S.V.P. / Divisional HeadFor National Bank of Pakistan (Trustee)
Sd/-
For National Investment Trust Limited(Management Company)
Note
2009 2008
Income
Dividend incomeCapital ga insProfit on bank deposi ts
Income on iss ue and repurc hase of un its
Unreal ised appreciation / (d im inution) in the market v alue ofinvestments held for trad ing
Other incomeElement o f inc om e / (loss) and capital ga ins / (losses) includedin prices of un its so ld less thos e in un i ts repurc hased
Total income / ( loss)
Expenditure
Provis ion against receivablesProvis ion against TFCsIm pair ment loss on investm ents 6
Managem ent par ticipation feeSECP feeCustodian charges of Centr al Deposi tory CompanyFinancial c hargesOthers
Total operating expendituresNet income / (loss) for the period
1,409,77735,66854,551
2,36029,213
(2,399,538)
11,988
421,517
(434,465)
-48,349
15,395,187
217,86721,614
3,495263,37611,322
15,961,210(16,395,675)
1,549,783348,534316,381
7,275173,593
740,438
352
21,801
3,158,157
1,464--
390,02839,0034,772
23,8597,358
466,4842,691,673
Net income / (loss) per unit
Nine Months endedMarch 31,
(Rupees in '000)
The annexed s elec ted notes from 1 to 11 for m an in tegra l part of these condensed interim financia l sta tem ents.
Quarter ended
Without unreal ized appreciation / (d im inution) in the m ar ket va lue ofinvestments clas sified as held for tr ad ing & imapi rm ent los s
With unrealized appreciation / (d im inution) in the m ar ket va lue ofinvestments clas sified as held for tr ad ing & impai rment los s
M arc h 31,
Profit on inves tment in Ter m Finance
392,4067,5674,408
4677,709
633,063
11,853
420,506
1,477,978
-55,860
-
54,3485,300
86367,8964,396
188,6641,289,314
555,48481,82771,1621,726
28,065
378,574
2
51,230
1,168,070
1,464--
136,74613,6751,645
-1,097
154,6271,013,443
20082009
1.42
(16.61)
2.17
2.99

08 National Investment (unit) TrustCONDENSED INT ERIM DIST RIBUTION STATEMENT (UNAUDITED)
CONDENSED DISTRIBUTION STATEMENT(UNAUDITED)FOR THE NINE MONTHS ENDED MARCH 31, 2009
Managing DirectorSd/-
DirectorSd/-
DirectorSd/-
S.V.P. / Divisional HeadFor National Bank of Pakistan (Trustee)
Sd/-
For National Investment Trust Limited(Management Company)
Note
Undistributed income brought forward - as previously stated 14,502 ,770 22 ,071,729 22,3 95,523 20,393, 499
Effect of impairment loss / change in accounting policy 6 (15 ,395,187 ) - - 5,069, 977
Undistributed income brought forward - as restated (892,417 ) 22 ,071,729 22,3 95,523 25,463, 476
Net income / (loss) for the period 1,289 ,314 1 ,013,443 (16,395, 675) 2,691, 673
Final Dividend @ Rs. 6.50 per unit (2007: Rs. 6.20 per unit)paid during the period - - (5,602, 950) (5, 069,977)
Undistributed income carried forward 396 ,898 23 ,085,172 3 96,898 23,085, 172
The annexed selected notes from 1 to 11 form an integral part of these condensed interim financial statements.
2 009 2008 2009 2008
Nine Mon ths endedMarch 31,
Quarter endedMa rch 31,
(Rupees in '000)

09National Investment (unit) Trust CONDENSED STATEMENT OF MOVEMENT IN UNIT HOLDERS' FUND (UNAUDITED)
CONDENSED STATEMENT OF MOVEMENT IN UNITHOLDERS' FUND (UNAUDITED)FOR THE NINE MONTHS ENDED MARCH 31, 2009
Managing DirectorSd/-
DirectorSd/-
DirectorSd/-
S.V.P. / Divisional HeadFor Nat ional Bank of Pakistan (Trustee)
Sd/-
For National Investment Trust Limited(Management Company)
Note 2009 2008 2009 2008
21,588,609 52,460,475 45,585,263 45,880,145
6 (15,395,187) - - 5,069,977
6,193,422 52,460,475 45,585,263 50,950,122
1,051,219 3,105,264 3,472,372 12,183,011 (2008: 215.516 million units) - - - -
1,051,219 3,105,264 3,472,372 12,183,011
- - 2,014,671 1,835,394 (2008: 31.455 million units) - - - -
- - 2,014,671 1,835,394
(201,169) (1,159,424) (903,030) (9,467,058) (2008: 164.491 million units) - - - -
(201,169) (1,159,424) (903,030) (9,467,058)
850,051 1,945,840 4,584,013 4,551,347
(420,506) (51,230) (421,517) (21,801)
17,339,508 1,901,410 (2,497,345) 4,168,576
Net income / (loss) for the period 1,289,314 1,013,446 (16,395,675) 2,691,674
D ividend distr ibution to the unit holders - - (5,602,950) (5,069,977)
Unit holders' Fund at the end of the period 25,251,789 57,269,941 25,251,789 57,269,941
Nine Months ended
The annexed selected notes from 1 to 11 form an integral part of these condensed interim financial statements.
(Rupees in '000)
Quarter endedMarch 31,
Unit holders' Fund at the beginning of the period
Effect of impairment loss / change in accounting policy
Amount received on issue of 111.114 million units
Element of income / (losses) and capital gains / ( losses) inpr ices of units sold less those in units repurchased
Net unrealised appreciation / (diminution) during theperiod in market value of investments classified asavailable for sale
Units issued under Cumulative InvestmentPlan 47.342 million units
Amount paid on redemption of 28.861 million units
March 31,

10 National Investment (unit) TrustCONDENSED CASH FLOW STATEMENT (UNAUDITED)
CONDENSED CASH FLOW STATEMENT(UNAUDITED)FOR THE NINE MONTHS ENDED MARCH 31, 2009
Managing DirectorSd/-
DirectorSd/-
DirectorSd/-
S.V.P. / Divisional HeadFor National Bank of Pakistan (Trustee)
Sd/-
For Nat ional Investment Trust Limited(Management Company)
Nine M onths ende dMarch 31,
(Rupee s in '00 0)
Quarte r end edM arch 31,
CASH FLOWS FROM OPERATING ACTIVITIES
Gross income from operationsLess: Unrealised appreciation / (diminution) in the
market valu e of investments held for tradin gDivid end incomeInterest inco me
(I ncreas e) / decrea se in assetsInvestmentsLoan s a nd re ceivables
Other receivables
Creditors accru ed and other liabilitiesPayable to National Investment Trust LimitedCash g enerated / (used in) f rom o pera tion s
Divid end rece ivedInterest re ceivedMana gement particip atio n fee paidFinan cial charg es paidSECP fee paidOther ch arge s pa idUnclaimed distributionDistribution a mount pa id
CASH FLOWS FROM FINANCING ACTIVITIES
Net ca sh g enerated from / (used in) f ina ncing a ctivit ies
Cash a nd cash equivalents at end o f the period
200 9
1,470,46 7
633,06 3392,40 6(2,635)
447,63 3
(8 2,698)24,42 3
117-
389,47 5
(2 1,733)20,77 6
388,51 8
216,76 419,14 0
-(8 5,945)(4 5,585)
(5,260)(1 9,945)
-
467,68 7
423,12 7(1,07 5,000)
(65 1,873)(18 4,186)
612,111
427,92 5
2008
1,168 ,070
378 ,574555 ,484
72 ,888
161 ,124
423 ,259(1 ,304,13 8)
(66 )(204,56 2)(924,38 3)
(69,22 4)62 ,374
(931,23 3)
559 ,769111 ,002
--
(37,95 4)(4,20 6)
(32,66 4)-
(335,28 6)
1,653 ,605-
1,653 ,6051,318 ,319
2,921 ,822
4,240 ,141
2009
(434, 465)
(2,399, 538)1,4 09,777
56,911
4 98,385
(1,530, 183)35,477
(28, 337)-
(1,024, 658)
2,500(107, 259)
(1,129, 417)
1,3 41,06992,608
-(254, 560)
(45, 585)(14, 818)(19, 945)
(3,488, 511 )
(3,519, 160)
2,1 23,904(1,650, 000)
4 73,904(3,045, 255)
3,4 73,180
4 27,925
20 08
3,158,1 57
740,4 381,549,7 83
323,6 56
544,2 80
(1,2 56,047)622,1 45(27,252)
(2,501)(119,3 75)
1,5 55244,7 10126,8 90
1,265,8 03283,2 71
(5 23,379)(34,526)(37,954)(13,594)
-(3,1 58,079)
(2,0 91,568)
3,066,6 34(2,0 75,000)
991,6 34(1,0 99,934)
5,340,0 75
4,240,1 41
The anne xed se lected notes fro m 1 to 11 form an int egral part of th ese co ndensed inter im financia l statem ents.
Cash a nd cash equivalents at beginning o f the period
Net cas h gene ra ted / (used in) from operating activit ies
Net receipts made against repu rchase of u nitsFinan ce s (rep aid ) during the p eriod - net
Net increase / (decreased) in cash and cash equ ivalents
Receivable from Na tion al I nve stm ent Trust Limit ed
Increase / (decrease) in liabi lities
11
SELECTED NOTES TO THE CONDENSEDFINANCIAL STATEMENTSFOR THE NINE MONTHS ENDED MARCH 31, 2009
1. STATUS AND NATUREThe National Investment (Unit) Trust- NON LOC Holders' Fund (the Fund) was created as a result of scheme of un-bundling / splitting of National Investment (Unit) Trust [NI(U)T].The scheme was prepared in accordance with the sixth supplemental Trust Deed dated January 18, 2007 and signed by both the Management Company and Trustee on
July 10, 2008. Consequently, NI(U)T has been splitted into LOC and Non LOC Holders' Funds. Both these Funds for the purpose of Trust Deed would be considered as NI(U)T and terms of the Trust Deed would apply mutatis mutandis to these Funds till the time these separate funds have been reorganized and restructured as separate open
end mutual funds and management rights have been transferred pursuant to management right transfer agreement to be executed upon privatization / sale.
The Trust Deed was executed between National Investment Trust L imited (NITL) as Management Company and National Bank of Pakistan (NBP) as Trustee. The Trust Deed was executed on November 12, 1962, and was amended vide Supplementa l Trust Deed dated June 26, 1968, June 07, 1981, November 27,1998, November 12, 2002, December 31, 2003 and January 18, 2007. The functions of the Fund is governed by the Trust Deed and the National Investment (Unit) Trust Ordinance, 1965.
The Management Company of the Fund has been classified as a Non - Banking Finance Company (NBFC) under the NBFC Rules, 2003 and has obtained the requisite licensefrom the Securi ties and Exchange Commission of Pakistan (SECP) to undertake Asset Management Services. The Fund has been granted exemptions from application of
certain provisions of the NBFC Rules and Noti fied Entities Regulations till privatization.
Pakistan Credit Rating Agency Limi ted (PACRA) has assigned "3-star" rating (normal) based on the performance during FY08 and "4-star" long term rating based on the performance during FY06 to FY08 which signifies superior performance to the Fund. Whereas JCR-VIS has assigned "4-Star" as 2 Yrs ranking and "3-Star" as 1 Yr ranking
based on performance date which is June 30, 2008.
The Management Company is assigned management quality rating "AM2-" by PACRA which represent sound control system and "AM2" by JCR-VIS which represent high quality management.
1.1 Sale of rights to manage the Fund
The Privatization Commission, Government of Pakistan has invited expressions of interest for the sale of the rights to manage the Fund which exists so lely with the ManagementCompany, NITL. The Trustee, National Bank of Pakistan and the Management Company hold the rights and privileges of the Unit Holders to be paramount. Til l date, PrivatizationCommission is engaged in the process of privatization.
1.2 Allocation of assets and liabilities
As a part of the privatization process, assets and liabili ties of the Fund have been allocated in proportion to the number of units held by Letter of Comfort (LOC) holders and Non-LOC holders respectively as on March 31, 2007, ensuring that quantitative and qual itative equivalence is maintained.
To give effect to the segmentation of the Fund into two separate independent schemes from April 1, 2007 as mentioned above, a scheme of un-bundling has been signed by both the Management Company and Trustee on July 10, 2008.
2. STATEMENT OF COMPLIANCEThese financial sta tements have been prepared in accordance with approved accounting standards as applicable in Pakistan, the requi rements of the Trust Deed, the Non-Banking Finance Companies (Establishment and Regulations) Rules, 2003, (the NBFC Rules, 2003) and the Non-Banking Finance Companies and Notified Enti ties Regulations,2008 (the Regulations) and directives issued by the Securities and Exchange Commission of Pakistan (SECP). Approved accounting standards comprise such International
Financial Reporting Standards (IFRS) issued by the International Accounting Standards Board as are notified under the Companies Ordinance, 1984. Wherever, the requirementsof the Trust Deed, the NBFC Rules, 2003, the Regulations or directives issued by the SECP differ wi th the requi rements of these standards, the requirement of the Trust Deed,
the NBFC Rules, 2003, the Regulations or directives shall prevail. The disclosure made in these financial statements have, however, been limited based on the requirements of the In ternational Accounting Standards 34 "Interim Financial Repor ting".
These financia l statements have been prepared using the same accounting policies which were applied in the preparation of the annual financial statements of the Trust for the year ended June 30, 2008.
National Investment (unit) Trust SELECT ED NOTES TO T HE CONDENSED FINANCIAL STATEMENTS
3.1 The statement of investments specifying the movement in por tfolio holding since the end of the preceding accounting period and the value of each holding as a percentage of net asset value and a percentage of investee company's paid-up capital is annexed with these financial statements.
4. CONTINGENCIES AND COMMITMENTSThere has been no contingencies and commitments as at March 31, 2009.
M arch 31, 200 9 June 30, 2008
Unaudite d Audited
3,344,99 8 4,511,985
23,612,04 0 4 1,202,39926,957,03 8 4 5,714,384
26,66 1 26,6615,17 2 5,172
158,05 3 164,593189,88 6 196,426(86,235) (39,886)103,65 1 156,540
27,060,68 9 4 5,870,924
(Rup ees in '000)3. INVESTMENTS
Investments b y categ ory
At fai r v alue thro ugh income sta temen t-equity securit ies - held for t rading
Avai lable fo r sale investments-equity securit ies
Investments at fair valu e
Held to maturi ty investments
Other i nvestments -M orab aha arrangem ents -Partic ipat ion Term Cert ificates -Term Finance Certif icates
Less: Provis ion for impai rm ent loss

12 National Investment (unit) TrustSELECTED NOTES TO THE CONDENSED FINANCIAL STATEMENTS
Managing Di rectorSd/-
DirectorSd/-
DirectorSd/-
S.V.P. / Divisional HeadFor National Bank of Pakistan (Trustee)
Sd/-
For National Investment Trust L imited(Management Company)
June 30, 2 008
Reg istered Bearer TotalAudited
Total outstanding a t the be gin nin g of the ye ar 832,9 31,845 29,06 0,395 861,9 92,240 8 17,738 ,254
Add: Sales during the period 111,113,7 15 - 111,113, 715 2 81,466 ,247
Units issued under Cum ulative I nve stm ent Plan (CIP)during the pe riod 47,3 42,274 - 47,3 42,274 31,454 ,917
Less: Rep urchases during the p eriod 28,7 51,157 10 9,505 28,8 60,662 2 68,667 ,178
Bearer conversion 1 45,100 (145,1 00) - -
Less: Impact of sale & repurchase of M arch 31, 200 9 not ta kenin NAV of March 31, 2009Less: Sale of un its 4,8 32,197 - 4,8 32,197Add: Repurch ase of units 5 75,693 - 5 75,693
Total units in issue at th e end o f the pe riod 958,5 25,273 28,80 5,790 987,3 31,063 8 61,992 ,240
Unaudited
M arch 31, 2009
--
5. NUMBER OF UNITS IN ISSUE
6. IMPAIRMENT LOSS ON INVESTMENTSImpairment loss on 'Available for sale ' equi ty securities earmarked on December 31, 2008 is charged to n ine months Profit & Loss Account. Previously, it was charged to
Equity in pursuance wi th the re laxation granted by SECP vide SRO 150 (1) / 2009 dated February 13, 2009. After performing impairment testing, it was, however, thought to be more prudent to charge it to Profit & Loss Account in terms of full compliance of IAS 39. Loss shown due to regularity requirements does not in any way hamper the total return to the unit holders as NAV has al ready been adjusted after accounting for this loss.
7. TRANSACTIONS WITH RELATED / CONNECTED PARTIESThe significant transactions carried out by the Fund with related / connected par ties during the period are given below:
March 31,2009
(Rupees in '00 0)TransactionsSales lo ad and ch arge s 42 ,643 - - - 4 2,643 151,745Man agemen t participation fee 217 ,867 - - - 21 7,867 390,028Ba lanc esRe ceivable from National InvestmentTrust Limited 39 ,858 - - - 3 9,858 95,559Payable to National Investmen t Tru stLimited 1,020 ,013 - - - 1,02 0,013 794,675
(Rupees in '000)Un audited
ManagementCompany Trustee
Investee Cowith 20% or
more holding
Directors &key
managementpersonnel
Total Total
March 31,2008
8. KSE 100 INDEX 6,860 15,125
9. KSE ALL SHARES INDEX 4,932 10,750
10. DATE OF AUTHORIZATION FOR ISSUEThese financial statements were authorized for issue on April 29th, 2009 by the Board of Directors of the Management Company.
11. GENERAL Figures have been rounded off to the nearest thousand rupees, except otherwise sta ted.
March 31, 2009 March 31, 2008
SELECTED NOTES TO THE CONDENSEDFINANCIAL STATEMENTSFOR THE NINE MONTHS ENDED MARCH 31, 2009

13National Investment (unit) Trust
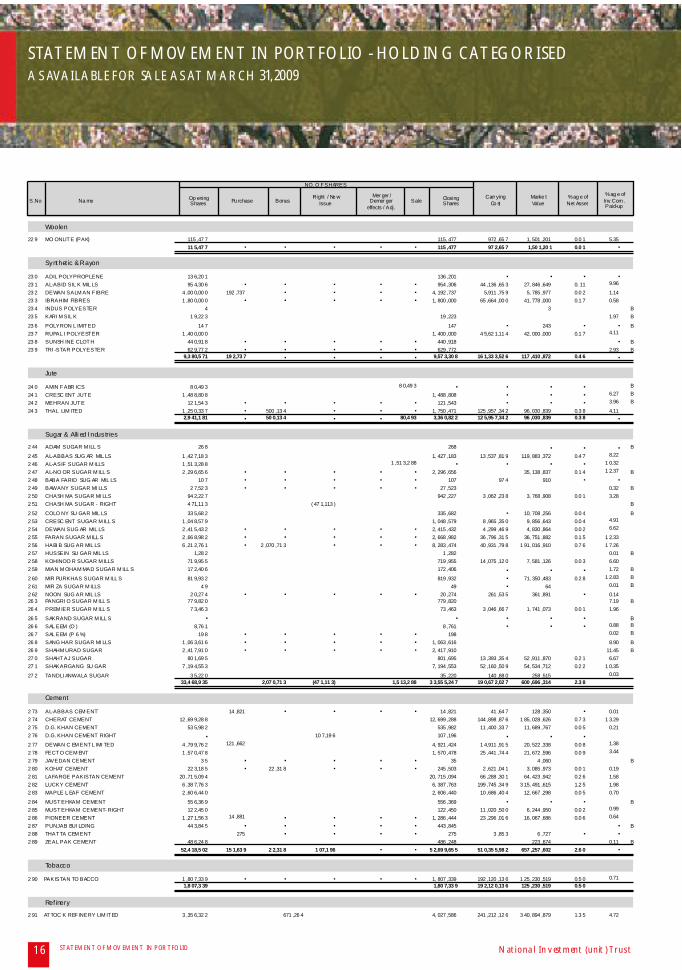
STATEMENT OF MOVEMENT IN PORTFOLIO - HOLDING CATEGORISEDAS AVAILABLE FOR SALE AS AT MARCH 31, 2009
S TATEMENT OF MOVEMENT IN PORTFOLIO
Comm erci al Banks
Investment Banks / Cos / Securi ties
NO. OF SHARES
Na me Sa le ClosingShar es
Carrying Cost S.No Pur ch ase Bo nus
% age ofInv. Com.Paid- up
M erge r /De merge r
effects / Ad j.
Right / NewIssue
Open in gSh ares
M arketValue
% age ofNet Asset
Open - End - Mutual Funds
1 AKD INCOM E FUND 10 8,69 1 1 08, 691 4,92 5,9 00 4,8 53,0 53 0.022 FAYSAL SAVING & G ROWTH FUND 5 0,62 4 50, 624 5,00 0,0 00 5,2 04,1 47 0.023 FI RST HABIB INCO ME FUND 12 4,99 4 1 24, 994 1 2,31 4,7 00 1 2,4 99,4 00 0.054 HBL INCO ME FUND 37 9,22 5 3 79, 225 3 6,9 44, 311 3 9,5 91,0 90 0.165 HBL M ULTI ASSET FUND 75 0,00 0 7 50, 000 7 5,00 0,0 00 7 5,0 00,0 00 0.306 HBL STO CK FUND 26 4,57 3 2 64, 573 2 6,45 7,3 00 2 6,4 57,3 00 0.107 IGI INCOM E FUND 12 7,43 0 1 27, 430 1 2,50 0,0 00 1 2,7 43,0 00 0.05
1,8 05,5 37 1 ,805 ,537 173, 142, 211 176 ,347 ,990 0.70
Cl osed - End - Mutual Funds
8 AL-M EEZAN M UTUAL FUND 2 ,86 6,38 5 2,8 66, 385 1 0,26 1,6 58 1 2,8 98,7 33 0.05 2 .089 ASI AN STOCKS FUND 34 4,81 3 3 44, 813 2,12 7,4 96 1, 117,1 94 0 .38
10 DOM INION STOCK FUND 15 7,62 9 1 57, 629 11 8,2 22 94,5 77 3 .1511 FI RST CAPITAL M UTUAL FUND 14 3,09 7 1 43, 097 78 7,0 37 2 48,9 89 0 .4812 GOL DEN ARRO W FUN D (Rs.5 ea ch) 3,86 4 483 4, 347 0 .0113 INVESTEC M UTUAL FUND 17 2,40 6 1 72, 406 8 7,9 27 51,7 22 1 .7214 JS VAL UE FUND L IMI TED 1 ,14 8,48 7 42 ,123 1,1 90, 610 5,34 5,8 39 5,7 74,4 59 0.02 1 .0015 PAKISTAN PREMI ER FUND 69 0,06 3 32 ,393 7 22, 456 1,45 9,3 61 3,2 36,6 03 0.01 0 .4316 PICIC G ROWTH FUND 6 ,41 5,34 2 14 ,016 6,4 29, 358 35, 940 ,111 5 6,6 42,6 44 0.22 2 .2717 PICICI I NVESTMENT FUND 10 ,10 8,12 8 10,1 08, 128 2 0,51 9,5 00 3 6,6 92,5 05 0.15 3 .5618 UTP G ROWH FUND 9 ,78 7,43 0 9,7 87, 430 2 9,16 6,5 41 3 2,9 83,6 39 0.13 3 .0819 UTP L ARGE CAPI TAL FUND 1 ,36 9,10 4 1,3 69, 104 3,14 8,9 39 3,8 47,1 82 0.02 0 .42
33,2 06,7 48 88 ,532 48 3 33 ,295 ,763 1 08,9 62,6 32 153 ,588 ,246 0.61
Modarabas
20 AL-ZAMIN LEASI NG M ODARABA 1 ,42 9,00 9 1,4 29, 009 8,28 8,2 52 4,3 01,3 17 0.02 5 .6121 BRR GUARDIAN M ODARABA 1 ,85 8,02 8 1,8 58, 028 5,85 2,7 88 5,2 02,4 78 0.02 2 .3822 PARAM OUNT MODARABA FIRST 3 8,32 2 38, 322 0 .6523 H.B.L. MO DARABA 5 ,03 5,75 6 5,0 35, 756 1 5,25 8,3 41 2 0,2 94,0 97 0.08 12 .6824 HABIB MODARABA (Rs. 5 ea ch) 1 ,58 4,07 0 1,5 84, 070 8,98 1,6 77 8,3 32,2 08 0.03 1 .57
25 L.T .V. M ODARABA (Rs. 5 ea ch) 32 1 32126 STANDARD CHARTERED M ODARABA 1 ,94 8,46 2 1,9 48, 462 1 3,26 9,0 26 1 5,0 42,1 27 0.06 4 .29
27 TAWAKKAL M ODARABA 47 4,03 2 4 74, 032 1 .83
12,3 68,0 00 12 ,368 ,000 51 ,650 ,084 53 ,172 ,227 0.21
28 ASKARI L EASING 1 ,05 0,00 7 157 ,501 1,2 07, 508 33, 056 ,610 1 9,3 20,1 28 0.08 2 .33
29 CRESCENT LEASING 1 ,89 8,38 8 1,8 98, 388 2, 923 ,518 3,8 34,7 44 0.02 3 .83
30 DADABHO Y LEASIN G 37 0,67 4 3 70, 674 4 .93
31 ORIX L EASING 2 ,52 4,85 3 378 ,727 2,9 03, 580 43, 989 ,237 2 1,4 86,4 92 0.09 3 .63
32 SAU DI PAK. L EASING 2 ,97 2,56 7 2,9 72, 567 8, 620 ,444 7,3 71,9 66 0.03 6 .5833 SEC URITY L EASING 44 7,02 6 4 47, 026 2, 724 ,027 1,3 18,7 27 0.01 1 .23
9,2 63,5 15 53 6,22 8 9 ,799 ,743 91 ,313 ,836 53 ,332 ,057 0.21
Leasing Compani es
34 ARIF HABIB I NVESTMENT MNGT LTD. 14 3,58 9 1 43, 589 10, 048 ,358 5,3 38,6 39 0.0235 ARIF HABIB L IMI TED 35 ,268 35, 268 2, 636 ,283 2,0 12,3 92 0.01 0 .12
36 ARIF HABIB SECURIT IES 1, 101 ,895 1,1 01, 895 46, 345 ,704 2 9,5 08,7 48 0.12 0 .29
37 BAN KERS EQUITY 3 ,40 8,09 1 3,4 08, 09138 DAWOOD CAPITAL MANAGEMENT 60 3,48 4 60 ,348 6 63, 832 2, 881 ,656 3,3 78,9 05 0.01 4 .4339 DAWOOD EQUI TIES 2 ,306 2, 306 20 ,685 9,2 47 0 .0140 EQUITY PARTI CIPATI ON 4,92 5 4, 92541 FI RST CAPITAL SECURIT IES CORPORATI ON 2 ,06 3,32 4 825 ,329 2,8 88, 653 7, 281 ,085 2 4,6 69,0 97 0.10 1 .27
42 FI RST DAWOOD INVESTMENT BANK 2 ,38 7,40 8 238 ,740 2,6 26, 148 18, 242 ,679 4 3,7 77,8 87 0.17 4 .19
43 FI RST NATIO NAL EQUIT IES 65 ,227 65, 227 3, 093 ,064 1,4 08,2 51 0.01 0.11
44 IGI INVESTM ENT BANK 7 ,68 2,57 9 7,6 82, 579 24, 200 ,124 2 4,3 53,7 75 0.10 3 .62
45 INDUSTRIAL DEVEL OPMENT BANK 1,97 0 1, 970 207 ,735 2 07,6 9746 INNOVAT IVE INVESTM ENT BANK LTD. 3 5,22 7 35, 227 3 52,2 7047 INVEST . & F INANCE SECURIT IES 695 695 2 ,426 4 ,51148 INVESTEC SECURIT IES 9 8,51 8 98, 518 63 ,052 115,2 66 0 .6049 ISLAMI C INVESTM ENT BANK 13 9,99 0 1 39, 990 9 72,9 31 0 .71
50 JAHANGIR SIDDI QUI & COM PANY 393 ,701 3 93, 701 20, 582 ,688 1 3,2 95,2 83 0.05 0 .05
51 JAVED O MER VOHRA & COM PANY 1 ,52 0,95 3 102 ,558 152 ,095 1,7 75, 606 10, 594 ,747 2 1,8 57,7 10 0.09 3 .49
52 JS INVESTM ENT 7 ,302 7, 302 291 ,496 1 42,9 00 0 .0153 PERVEZ AHM ED SECURITI ES 230 ,884 2 30, 884 833 ,491 9 67,4 04 0 .3054 PRUDENTIAL INVESTMENT BANK 32 6,29 2 3 26, 292 3 .2655 SEC URITY INVESTM ENT BANK 2 ,27 7,69 8 2,2 77, 698 7, 630 ,288 1 3,3 92,8 64 0.05 4 .43
20,5 50,4 59 1,93 9,836 1,27 6,51 2 14 3,58 9 23 ,910 ,396 154 ,955 ,561 185 ,765 ,776 0.74
56 ALLI ED BANK LI MITED 1 ,68 8,02 5 168 ,802 1,8 56, 827 52, 868 ,943 7 1,9 33,4 78 0.28 0 .26
57 ARIF HABIB BANK 40 0,00 0 397 ,569 44 ,440 8 42, 009 4, 735 ,691 4,4 28,9 67 0.02 0 .14
58 ASKARI BANK L IMITED 14 ,20 0,26 0 3, 550 ,444 1, 519 17,7 52, 223 2 06, 897 ,788 28 9,5 38,7 57 1.15 3 .50
59 ATLAS INVESTM ENT BANK 16 ,76 6,33 6 16,7 66, 336 55, 664 ,236 5 0,2 99,0 08 0.20 3 .3560 BAN K AL HABIB L IMITED 41 ,15 9,30 0 11, 318 ,84 8 148 52,4 78, 296 1,0 23, 631 ,791 1,41 0,6 16,5 96 5.59 8 .6061 BAN K I SL AMI PAKISTAN 599 ,368 5 99, 368 3, 583 ,003 3,5 54,2 52 0.01 0 .0662 FAYSAL BANK LI MITED 7 ,58 3,70 0 1, 137 ,555 8,7 21, 255 87, 288 ,387 12 6,7 19,8 35 0.50 1 .4363 HABIB BANK L IMITED 90 7,44 9 181 ,489 1,0 88, 938 67, 931 ,632 12 5,9 79,2 37 0.50 0 .12
64 HABIB METROPOLITAN BANK 40 ,12 1,21 9 10, 030 ,43 3 512 50,1 52, 164 1,0 56, 391 ,696 1,23 4,7 46,2 78 4.89 6 .66
65 INDUS BANK LIM ITED 14 7 14766 JS BANK LIM ITED 20 ,14 0,63 2 884 ,609 21,0 25, 241 1 00, 205 ,825 11 8,7 92,6 12 0.47 4 .0567 KASB BANK LIM ITED 45 7,77 6 1, 000 ,000 1,4 57, 776 13, 635 ,466 1 2,9 45,0 51 0.05 0.1168 MEHRAN BANK LIM ITED 73 8,59 0 7 38, 59069 MYBANK LIM ITED (Bolan Bank) 11 0 110 1 ,276 3 3070 NAT IONAL BANK O F PAKI STAN 3 ,49 3,09 8 3,4 93, 098 1 75, 772 ,691 30 7,7 41,9 34 1.22 0 .39
B
B
B
B
B
B
B
AB
B
B
B
B

Texti le Spinning
14 National Investment (unit) Trust
7 1 NIB BANK LI MIT ED 10, 258 ,990 3 50,0 00 10,6 08 ,990 49 ,853 ,07 3 58, 243 ,355 0.2 3 0.3 67 2 SAMBA BANK LIM ITED 10, 250 ,000 2 02,5 00 10,4 52 ,500 51 ,841 ,40 9 47, 454 ,350 0.1 9 1.1 7
7 3 SAUDI PAK COMM ERCIAL BANK 3, 047 ,384 3,0 47 ,384 15 ,267 ,39 4 12, 585 ,696 0.0 5 0.3 4
7 4 SONERI BANK L IMIT ED 46, 965 ,663 10,3 32, 446 57,2 98 ,109 5 16 ,622 ,29 3 7 44, 302 ,436 2.9 5 11.4 2
7 5 UNI TED BANK LIM IT ED 891 ,020 8 91 ,020 32 ,887 ,54 8 45, 736 ,057 0.1 8 0.0 9219 ,069 ,699 3, 434, 046 36 ,764 ,457 2 ,179 259 ,270 ,381 3,51 5,08 0,14 4 4 ,665 ,618 ,229 18.4 8
NO. OF SHARES
Nam e Sale ClosingSh ares
Carr ying Co st
S.No Pur ch ase Bo nus % a ge ofInv. Co m.Paid-up
Mer ger /Demer ger
effects / Adj.
Right / NewIssue
Open in gSh ares
Mar ke tValue
% ag e ofNet Asse t
STATEMENT OF MOVEMENT IN PORTFOLIO - HOLDING CATEGORISEDAS AVAILABLE FOR SALE AS AT MARCH 31, 2009
Insurance
7 6 UNI ON INSURANCE 306 306 7 ,941306 306 7 ,941
7 7 ACCOR D TEXTI LE MI LLS 458 ,109 4 58 ,109 4.9 37 8 ADIL TEXTI LE MI LLS 93 ,592 93 ,592 832 ,969 1.2 17 9 AF SAR T EXTIL E MIL LS 64 ,184 64 ,184
8 0 ALL AWASAYA TEXTI LE MI LLS 49 49 4 ,15 0 4 ,655 0.0 1
8 1 AL- QAIM TEXTI LE MI LLS 358 ,753 3 58 ,753 4.8 1
8 2 ASIM TEXTI LE MI LLS 1, 142 ,712 1,1 42 ,712 7.5 38 3 AWAN TEXT ILE M ILLS 213 ,390 2 13 ,390 2.4 68 4 AZ AM T EXT ILE M ILL S 620 ,655 6 20 ,655 4.6 88 5 BABRI COT TO N M ILLS 70 ,006 70 ,006 1 ,064 ,35 5 626 ,554 2.4 28 6 BAIG SPINNI NG M ILLS 51 ,106 51 ,106 35 ,26 3 51 ,106 0.5 6
8 7 BAWANY T EXT IL E MIL LS 84 ,233 84 ,2338 8 BROT HERS TEXT ILE M ILLS 617 ,961 6 17 ,961 6.3 1
8 9 CENT RAL COT TO N 34 ,948 34 ,9489 0 CHAKWAL SPINNING MIL LS 754 ,008 7 54 ,008 1.8 99 1 CRESCENT FIBRE ( BO ARD ) M ILLS 852 ,681 8 52 ,681 5, 960 ,240 0.0 2 6.8 79 2 CRESCENT SPINI NG M ILLS 727 ,080 7 27 ,080 4.8 09 3 D.M . T EXT IL E MIL LS 336 ,614 3 36 ,614 3 ,616 ,56 6 3, 382 ,971 0.0 1 11.0 3
9 4 D.S. INDUSTRI ES 44,7 80 44 ,780 581 ,69 2 850 ,820 0.0 7
9 5 DAR- ES- SAL AM T EXT ILE M ILL S 266 ,787 2 66 ,787 1 ,200 ,54 2 915 ,079 3.3 3
9 6 DATA TEXT ILE M ILLS 618 ,595 6 18 ,595 - 6.2 49 7 DEWAN KHALID T EXILE M ILLS 279 ,486 2 79 ,486 4 ,611 ,51 9 3, 493 ,575 0.0 1 4.9 29 8 DEWAN M USHT AQ TEXT ILE M ILL S 240 ,424 2 40 ,424 2 ,600 ,60 8 4, 774 ,821 0.0 2 7.0 09 9 DIN TEXILE M ILL S 281 ,239 2 81 ,239 3 ,846 ,98 3 4, 705 ,128 0.0 2 1.5 21 00 ELL COT SPI NNING M ILL S 706 ,880 7 06 ,880 7 ,508 ,94 2 7, 648 ,442 0.0 3 6.4 6
1 01 F AT IMA ENT ERPRI SES 628 ,671 6 28 ,671 5 ,467 ,88 5 9, 681 ,533 0.0 4 4.4 2
1 02 F AZ AL CL OTH MIL LS 1 ,105 ,611 1 ,105 ,611 13 ,414 ,71 5 34, 450 ,839 0.1 4 5.8 9
1 03 F AZ AL T EXT ILE M ILL S 67 ,755 67 ,755 1 ,231 ,47 7 28, 733 ,540 0. 11 1.1 01 04 G ADO ON T EXT ILE M ILL S 1, 335 ,356 1,3 35 ,356 62 ,628 ,19 6 25, 371 ,764 0.1 0 5.7 01 05 G HAF OO R TEXTI LE MI LLS 45 ,835 45 ,8351 06 G LOBE TEXT ILE M ILL S 65 ,972 65 ,972 346 ,35 3 610 ,241 0.4 01 07 G ULISTAN SPINNING MIL LS 241 ,393 24, 139 2 65 ,532 1 ,765 ,56 9 1, 136 ,477 1.9 9
1 08 G ULISTAN T EXT ILE M ILL S 621 ,241 46, 593 6 67 ,834 11 ,038 ,59 4 8, 681 ,842 0.0 3 3.8 7
1 09 G ULSHAN SPI NNING M ILL S 828 ,694 82, 869 911 ,563 11 ,299 ,61 8 7, 292 ,504 0.0 3 5.4 1
110 HAJI MOHAM MAD ISM AIL M ILLS 147 147 65111 HAJRA T EXT ILE M ILL S 518 ,063 5 18 ,063 3.7 7112 HARUM TEXT MI LLS ( NAYAB) 58 ,248 58 ,248 0.6 2113 IDEAL SPINNI NG M ILLS 658 ,396 6 58 ,396 1 ,975 ,18 8 1 ,119 ,273 6.6 4114 IND US DYEING 525 ,295 5 25 ,295 5 ,508 ,50 6 20, 397 ,205 0.0 8 2.9 1
115 J. A. TEXTI LE MI LLS 677 ,361 6 77 ,361 5.3 8
116 J. K. SPIN NING M ILL S 324 ,568 3 24 ,568 3 ,245 ,68 0 2, 271 ,976 0.0 1 4.6 4
117 JUNAID COT TON MIL LS 37 ,436 37 ,436 1.5 0
118 KARIM COT TON MIL LS 110 ,562 110 ,562 9.3 4119 KHALID SI RAJ TEXTI LE MI LLS 700 ,498 7 00 ,498 6.5 51 20 KOHAT TEXTIL E MIL LS 38 ,569 38 ,569 174 ,71 8 77 ,138 0.1 91 21 KOHI NOOR CO TT ON 62 ,553 62 ,553
1 22 KOHI NOOR SPINNING MI LLS 602 ,327 6 02 ,327 0.4 6
1 23 L AF AYET TE INDUST RIES 92 ,360 92 ,360 0.2 6
1 24 L AND MARK SPI NNING M ILL S 447 ,937 4 47 ,937 3.6 9
1 25 M AQBOOL TEXTIL E MIL LS 1, 420 ,216 1,4 20 ,216 14 ,849 ,02 1 18, 462 ,808 0.0 7 8.4 51 26 M EHAR DAST GIR TEXTIL E MIL LS 49 ,259 49 ,259 0.5 41 27 M OHIB T EXT ILE L IMI TED 159 ,813 1 59 ,8131 28 NAGI NA CO TT ON 2 ,546 2 ,546 0.0 1
1 29 NAVEED T EXTIL E MIL LS 70 ,637 70 ,6371 30 NO RRIE TEXT ILE M ILLS 136 ,496 1 36 ,496 2.8 1
1 31 NUSRAT T EXTIL E MIL LS 306 ,342 3 06 ,3421 32 O LYM PIA SPIN NING M ILL S 42 ,855 42 ,855 424 ,18 9 216 ,418 0.3 61 33 O LYM PIA TEXTI LE MI LLS 358 ,359 3 58 ,359 3.3 21 34 PREMI UM T EXT IL E MIL LS 807 ,307 8 07 ,307 8 ,803 ,40 1 23, 415 ,195 0.0 9 1 3.1 01 35 PUNJAB COT TO N 56 ,155 56 ,155
1 36 Q AYYUM SPINNIN G MI LLS 73 ,149 73 ,149 0.6 1
1 37 RAVI T EXT ILE M ILL S 346 ,636 3 46 ,636 1.3 9
1 38 RELI AN CE COTT ON M ILL S 382 ,250 83, 335 4 65 ,585 3 ,823 ,57 3 14, 898 ,720 0.0 6 4.5 2
1 39 RESHAM T EXTIL E MIL LS 212 ,405 2 12 ,405 0.8 71 40 RUBY T EXT ILE M ILL S 610 ,664 6 10 ,664 1.5 61 41 SAIF TEXT ILE M ILLS 1, 965 ,871 1,9 65 ,871 18 ,675 ,77 5 8, 060 ,071 0.0 3 7.4 41 42 SAIT EX SPINNIN G MI LLS 358 ,212 3 58 ,212 4.8 41 43 SAJJAD T EXT ILE M ILL S 316 ,932 3 16 ,932 1.4 9
1 44 SALF I T EXT ILE M ILL S 104 ,645 1 04 ,645 956 ,18 1 2, 537 ,641 0.0 1 3.1 3
1 45 SALLY T EXT ILE M ILL S 348 ,279 3 48 ,279 348 ,279 3.9 7
1 46 SALM AN NOM AN MIL LS 292 ,746 2 92 ,746 761 ,140 7.3 61 47 SANA INDUSTRI ES 270 ,721 2 70 ,721 3 ,925 ,45 5 3, 389 ,427 0.0 1 4.9 21 48 SARGOD HA SPINNING MI LLS 588 ,202 5 88 ,202 441 ,152 1.8 91 49 SARIT O T EXT ILE M ILL S 648 ,933 6 48 ,933 4.8 91 50 SERVICE TEXT ILE M ILLS 162 ,908 1 62 ,908 3.6 6
STATEMENT OF MOVEMENT IN PORTFOLIO
B
BBB
BBBB
BB
BBBB
B
B
BBB
B
B
BB
BBBB
BBB
BB
B
B
BBB
BB
BB
BBB

15National Investment (unit) Trust STATEMENT OF MOVEMENT IN PORTFOLIO
STATEMENT OF MOVEMENT IN PORTFOLIO - HOLDING CATEGORISEDAS AVAILABLE FOR SALE AS AT MARCH 31, 2009
1 51 SHADAB T EXTIL E MIL LS 9 4,20 7 9 4,2 07 3.1 4
1 52 SHAHEEN C OTT ON 21 7 2 17 65 11 53 SHAHPU R TEXTI LE 89 0,85 0 89 0,8 50 6.3 7
1 54 SHAHYAR ( O.E.) 7 8,46 9 7 8,4 691 55 SHAHYAR T EXT ILE M ILL S 22 2,10 9 22 2,1 091 56 SHAHZAD T EXT ILE 2,61 0 2,6 10 13 ,05 0 0.0 21 57 SIF TAQ INT ERNAT IONAL 10 8,22 2 10 8,2 22 3.5 91 58 SIND F INE TEXT ILE 7 8,0 11 78, 011 2.2 81 59 SUNRAYS T EXT ILE 27 1,56 5 27 1,5 65 2,74 1,1 45 7 ,060 ,69 0 0. 03 3.9 4
1 60 SUNSHINE COT TO N 42 6,52 1 42 6,5 21 5.4 3
1 61 TARIQ COT TON 4 3,10 1 4 3,1 01 6.1 6
1 62 TATA TEXT ILE 2 ,09 4,28 5 2,09 4,2 85 1 8,72 4,7 18 26 ,178 ,56 3 0. 10 1 2.0 9
1 63 Z AF FAR T EXT ILE 6 6,84 4 6 6,8 4433,13 7,88 9 44 ,780 153 ,601 83,3 35 33,4 19,6 05 216,0 90,5 76 27 8,85 4,56 0 1. 10
NO. OF SHARES
N am e Sa le ClosingShar es
Ca rrying Cost S.No Pur chase Bonus
% a ge ofInv. Co m.Paid-up
Merge r /De merge r
effects / Ad j.
Right / NewIssue
Op eningShares
Ma rketVa lu e
% a ge ofNet Asset
Textile Weaving
1 64 AMAZ AI TEXTI LE 2 0,29 9 2 0,2 99 0.4 8
1 65 APEX F ABRI CS 28 4,10 1 28 4,1 01 4.9 3
1 66 AYAZ TEXTIL E 21 0,18 8 21 0,1 88 2.4 6
1 67 CROWN T EXTIL E 31 7,64 7 31 7,6 471 68 HAKKI M T EXT ILE 25 7,36 8 25 7,3 68 4.7 71 69 I.C. C. TEXT ILE 16 4,87 0 16 4,8 70 24 7,3 05 171 ,46 5 1.6 51 70 IT TI TEXTIL E 16 3,15 1 16 3,1 51 2.4 61 71 KAYT EX M ILL S 16 2,16 0 16 2,1 60
1 72 KOHINO OR LO OMS 16 9,64 8 16 9,6 48 1.5 7
1 73 NAKSHBANDI I NDUSTRIES 11 5,40 7 11 5,4 07 86 3,2 44 796 ,30 8 0.1 5
1 74 NAKSHBANDI I NDUSTRIES - RIGHT 13 9,64 2 (1 39,6 42)
1 75 PEARL FABRICS 22 9,97 0 22 9,9 701 76 PROSPERITY WEAVING 1,08 3 1,0 83 8 ,66 4 0.0 11 77 SADOON T EXT IL E 98 5 9 85 0.0 31 78 SAMIN T EXTIL E 13 9,94 5 13 9,9 45 80 4,6 84 1 ,276 ,29 8 0. 01 1.0 51 79 SERVI CE FABRICS 1 ,34 9,18 0 1,34 9,1 80 8.5 61 80 SHAHTAJ T EXT LE 47 5,72 6 47 5,7 26 4,37 0,4 48 4 ,995 ,12 3 0. 02 4.9 2
1 81 SUNRISE TEXT ILE 1 5,02 4 1 5,0 241 82 YOUSUF WEAVING 1 ,18 8,62 1 1,18 8,6 21 1,24 8,0 52 3 ,684 ,72 5 0. 01 2.9 7
5,40 5,01 5 ( 139, 642) 5,2 65,3 73 7,5 33,7 34 1 0,93 2,58 4 0. 04
Textile Composite
1 83 ADAMJEE INDUST RIES 12 1 1 21
1 84 AHMED HASSAN TEXTI LE 91 3,00 9 91 3,0 09 1 0,96 5,8 45 30 ,129 ,29 7 0. 12 6.3 4
1 85 ALIF T EXT ILE 32 0,08 5 32 0,0 85 8.2 1
1 86 ARUJ GARM ENT 6 7,78 0 6 7,7 80 35 5,8 48 962 ,47 6 1.1 0
1 87 ASWAN T ENTAGE LI MIT ED 16 8,71 2 16 8,7 121 88 AZG ARD NINE LIM IT ED 74 0,57 2 74 0,5 72 1 2,05 6,5 12 22 ,831 ,83 5 0. 09 0.2 41 89 BHAWALPUR T EXTIL E 6 4,25 8 6 4,2 58 6.4 31 90 BLESSED T EXTIL E 2 3,15 2 2 3,1 52 64 9,6 88 949 ,23 2 0.3 61 91 COL ONY SARH AD 32 8,87 9 32 8,8 79 328 ,87 9 8.2 2
1 92 COL ONY TEXT ILE 1 ,52 1,59 9 1,52 1,5 99 2,73 6,2 33 15 ,033 ,39 8 0. 06 0.6 2
1 93 CRESCENT KNIT WEAR 8 1,27 7 8 1,2 771 94 CRESCENT T EXT ILE M ILL S 1 ,87 0,01 0 1,87 0,0 10 9 6,30 5,5 15 61 ,467 ,22 9 0. 24 3.8 0
1 95 DAWOOD L AWRENCEPUR 40 1,12 4 3, 338 20, 871 1 92 ,408 23 2,9 25 6,00 3,7 84 9 ,966 ,86 1 0. 04 0.4 51 96 FAISAL SPINNING 1,52 7 1,5 27 6 7,3 41 52 ,37 61 97 FATEH SPORT S 4 5,21 9 4 5,2 19 2.2 61 98 FATEH T EXTIL E 3 5,92 5 3 5,9 25 2 0,48 2,0 64 16 ,825 ,47 4 0. 07 2.8 71 99 GUL AHM ED TEXIT LE 45 8,85 3 45 8,8 53 1 7,90 3,4 35 15 ,188 ,03 4 0. 06 0.8 3
2 00 GUL AHM ED TEXIT LE - RIGHT 68 ,828 6 8,8 282 01 HAFI Z T EXT ILE 7,58 5 7,5 85 117 ,56 8 0.6 3
2 02 INT ERNAT IONAL KNIT WEAR 11 0,83 2 11 0,8 32 2 ,549 ,13 6 0. 012 03 ISHAQ T EXT ILE M ILL S 44 3,94 6 44 3,9 46 3,90 6,7 25 1 ,331 ,83 8 0. 01 4.6 02 04 JUBILEE SPINNING MIL LS 13 0 1 30 31 22 05 KAISER ART S & KRAF TS 3 6,94 4 3 6,9 44 0.4 32 06 KOHINO OR INDUST RIES LIM ITED 33 4,46 8 33 4,4 68 501 ,70 2 1.1 02 07 KOHINO OR M ILLS L IMI TED 2 ,85 9,83 0 2,85 9,8 30 4 0,75 2,5 78 22 ,306 ,67 4 0. 09 5.6 22 08 KOHINO OR T EXT ILE L IMIT ED 3 ,16 1,23 4 3,16 1,2 34 1 5,80 6,1 70 15 ,901 ,00 7 0. 06 2.1 7
2 09 M ARR FABRICS 11 8,22 1 11 8,2 212 10 M ASOO D TEXT ILE MI LLS 1 ,01 2,91 4 1,01 2,9 14 1 7,02 9,5 67 25 ,322 ,85 0 0. 10 3.3 8
2 11 M IAN TEXTI LE MIL LS 73 6,07 8 73 6,0 78 65 5,1 09 404 ,84 3 3.3 3
2 12 M OHAMM AD FAROOQ TEXTI LE 1 ,86 0,27 7 1,86 0,2 77 4,65 0,6 93 4 ,185 ,62 3 0. 02 9.8 52 13 NISHAT ( CHUNIAN) L IMI TED 2 ,20 0,00 0 58, 973 2 20, 000 2,47 8,9 73 2 3,97 1,6 69 23 ,029 ,65 9 0. 09 3.0 0
2 14 NISHAT CHUNI AN (PREFERENCE RIGHT ) 1, 239 ,621 1,23 9,6 212 15 NISHAT M ILL S LIM ITED 3 ,35 6,44 1 1, 678 ,221 5,03 4,6 62 1 17,8 11,0 67 152 ,650 ,95 2 0. 60 2.1 02 16 PARAM OUNT SPINNI NG 1 ,50 0,02 6 112, 501 1,61 2,5 27 1 7,09 2,7 86 12 ,900 ,21 6 0. 05 11.2 42 17 QUET TA TEXTI LE 1 9,00 5 1 9,0 05 29 0,1 31 1 ,924 ,63 6 0. 01 0.6 12 18 REDCO T EXT IL E 78 6,56 9 78 6,5 69 3.6 9
2 19 RELIANCE WEAVING 59 2,64 5 59 2,6 45 3,15 2,2 02 2 ,963 ,22 5 0. 01 1.9 2
2 20 SAPPHIRE F IBRE LIM IT ED 19 9,35 4 19 9,3 54 3 4,20 2,0 29 15 ,453 ,92 2 0. 06 1.1 4
2 21 SAPPHIRE T EXTIL E LIM ITED 35 2,97 6 35 2,9 76 3 6,90 3,9 58 23 ,296 ,41 6 0. 09 1.7 6
2 22 SCHON T EXT IL E 25 8,61 0 25 8,6 10 2.1 62 23 SHAMS T EXT ILE 1,21 1,99 8 1,2 11,9 98 2 6,33 6,7 17 12 ,725 ,97 9 0. 05 1 4.0 32 24 SURAJ COT TO N MIL LS 38 9,55 5 38 9,5 55 9,50 4,6 63 7 ,214 ,55 9 0. 03 2.1 62 25 TAJ T EXT IL E MIL LS LIM IT ED 1 ,40 9,94 7 1,40 9,9 47 422 ,98 4 4.2 22 26 TAWAKKAL G ARM ENTS 11 8,66 4 11 8,6 64 0.9 8
2 27 Z AHUR COT TON 48 5,69 4 48 5,6 94 4.9 3
2 28 Z AHUR TEXTIL E 41 2,14 7 41 2,1 47 0.5 5
31,01 8,19 2 6 2,311 353 ,372 2,98 6,67 0 192 ,408 34,2 28,1 37 519,5 92,3 26 49 8,93 9,19 1 1. 98
B
BB
BBBBB
BB
B
BBB
BB
BB
B
BBB
B
B
B
B
B
B
B
B
B
BB
B
BB
B
B
B
B
BBBB
Ref inery
Tobacco
Cement
Sugar & Alli ed Industries
Jute
Synthet ic & Rayon
NO. O F SHARES
Na me Sale ClosingShares
Carr ying Co st S.No Pu rchase Bonus
% ag e ofInv. Com .Paid-up
Mer ger /Demer ger
effects / Adj.
Right / Ne wIssue
Op eningShares
Marke tValue
% ag e ofNet Asset
Woolen
22 9 MO ONLIT E (PAK) 115 ,47 7 115, 477 0.0 111 5,47 7 115 ,477 1,50 1,20 1 0.0 1
16 STATEMENT OF MOVEMENT IN PORTFOLIO National Investment (unit) Trust
1, 501 ,201972 ,65 797 2,65 7
5.35
STATEMENT OF MOVEMENT IN PORTFOLIO - HOLDING CATEGORISEDAS AVAILABLE FOR SALE AS AT MARCH 31 , 2009
23 0 ADIL POLYPROPLENE 13 6,20 1 136 ,20123 1 AL-ABID SIL K MIL LS 95 4,30 6 954 ,306 44 ,136 ,65 3 27, 846 ,649 0. 11 9.96
23 2 DEWAN SALM AN F IBRE 4 ,00 0,00 0 192 ,737 4, 192 ,737 5,911 ,75 9 5, 785 ,977 0.0 2 1.1423 3 IBRAHIM FIBRES 1 ,80 0,00 0 1, 800 ,000 65 ,664 ,00 0 41, 778 ,000 0.1 7 0.5823 4 INDUS POLYESTER 4 323 5 KARI M SIL K 1 9,22 3 19 ,223 1.97
23 6 POLYRON L IMIT ED 14 7 147 24323 7 RUPAL I POLYEST ER 1 ,40 0,00 0 1, 400 ,000 4 5,62 1,11 4 42, 000 ,000 0.1 7 4.11
23 8 SUNSH INE CLOT H 44 0,91 8 440 ,91823 9 TRI -STAR POLYESTER 62 9,77 2 629 ,772 2.93
9,3 80,5 71 19 2,73 7 9,57 3,30 8 16 1,33 3,52 6 117 ,410 ,872 0.4 6
24 0 AMIN F ABR ICS 8 0,49 3 8 0,49 3
24 1 CRESC ENT JUT E 1 ,48 8,80 8 1, 488 ,808 6.27
24 2 MEHRAN JUT E 12 1,54 3 121 ,543 3.96
24 3 THAL LIM ITED 1 ,25 0,33 7 500 ,13 4 1, 750 ,471 125 ,957 ,34 2 96, 030 ,839 0.3 8 4.112,9 41,1 81 50 0,13 4 80,4 93 3,36 0,82 2 12 5,95 7,34 2 96 ,030 ,839 0.3 8
2 44 ADAM SUGAR M ILL S 26 8 268
2 45 AL-ABBAS SUG AR MIL LS 1 ,42 7,18 3 1, 427 ,183 13 ,537 ,81 9 119, 883 ,372 0.4 7 8.22
2 46 AL-ASIF SUGAR M ILLS 1 ,51 3,28 8 1 ,51 3,2 88 1 0.32
2 47 AL-NO OR SUGAR M ILL S 2 ,29 6,65 6 2, 296 ,656 35, 138 ,837 0.1 4 1 2.37
2 48 BABA FARID SUG AR MIL LS 10 7 107 97 4 9102 49 BAWANY SUGAR MI LLS 2 7,52 3 27 ,523 0.322 50 CHASH MA SUGAR MI LLS 94 2,22 7 942 ,227 3 ,062 ,23 8 3, 768 ,908 0.0 1 3.282 51 CHASH MA SUGAR - RIGHT 4 71,11 3 ( 47 1,113 )
2 52 COLO NY SU GAR MIL LS 33 5,68 2 335 ,682 10, 708 ,256 0.0 42 53 CRESC ENT SUGAR M ILL S 1 ,04 8,57 9 1, 048 ,579 8 ,965 ,35 0 9, 856 ,643 0.0 4 4.91
2 54 DEWAN SUG AR MIL LS 2 ,41 5,43 2 2, 415 ,432 4 ,299 ,46 9 4, 830 ,864 0.0 2 6.62
2 55 FARAN SUGAR M ILL S 2 ,66 8,98 2 2, 668 ,982 36 ,796 ,31 5 36, 751 ,882 0.1 5 1 2.332 56 HABI B SUG AR MIL LS 6 ,21 2,76 1 2 ,070 ,71 3 8, 283 ,474 40 ,931 ,79 8 1 91, 016 ,910 0.7 6 1 7.262 57 HUSSEIN SU GAR MIL LS 1,28 2 1 ,282 0.012 58 KOHINOO R SUGAR M ILLS 71 9,95 5 719 ,955 14 ,075 ,12 0 7, 581 ,126 0.0 3 6.602 59 MIAN M OHAM MAD SUGAR M ILL S 17 2,40 6 172 ,406 1.72
2 60 MIR PURKHAS SUGAR M ILL S 81 9,93 2 819 ,932 71, 350 ,483 0.2 8 1 2.83
2 61 MIR ZA SUGAR M ILLS 4 9 49 64 0.01
2 62 NOON SUG AR MIL LS 2 0,27 4 20 ,274 261 ,53 5 361 ,891 0.1426 3 PANGRI O SUGAR M ILL S 77 9,82 0 779 ,820 7.1926 4 PREM IER SUGAR M ILL S 7 3,46 3 73 ,463 3 ,046 ,66 7 1, 741 ,073 0.0 1 1.96
26 5 SAKRAND SUGAR M ILL S26 6 SAL EEM (O ) 8,76 1 8 ,761 0.88
26 7 SAL EEM (P 6 %) 19 8 198 0.02
26 8 SANG HAR SUGAR MI LLS 1 ,06 3,61 6 1, 063 ,616 8.9026 9 SHAHM URAD SUGAR 2 ,41 7,91 0 2, 417 ,910 11.4527 0 SHAHT AJ SUGAR 80 1,69 5 801 ,695 13 ,393 ,35 4 52 ,911 ,870 0.2 1 6.6727 1 SHAKARGANG SU GAR 7 ,19 4,55 3 7, 194 ,553 52 ,160 ,50 9 54, 534 ,712 0.2 2 1 0.35
27 2 TANDLI ANWALA SUGAR 3 5,22 0 35 ,220 140 ,88 0 258 ,515 0.0333,4 68,9 35 2,07 0,71 3 (47 1,11 3) 1,5 13,2 88 3 3,55 5,24 7 19 0,67 2,02 7 600 ,696 ,314 2.3 8
2 73 AL-ABBAS CEM ENT̀ 14 ,821 14 ,821 41 ,64 7 128 ,350 0.012 74 CHERAT CEMENT 12 ,69 9,28 8 12, 699 ,288 144 ,898 ,87 6 1 85, 028 ,626 0.7 3 1 3.292 75 D.G. KHAN CEMENT 53 5,98 2 535 ,982 11 ,400 ,33 7 11, 689 ,767 0.0 5 0.212 76 D.G. KHAN CEMENT RIGHT 10 7,19 6 107 ,196
2 77 DEWAN C EM ENT L IMI TED 4 ,79 9,76 2 121 ,662 4, 921 ,424 1 4,911 ,91 5 20, 522 ,338 0.0 8 1.38
2 78 FECT O CEM ENT 1 ,57 0,47 8 1, 570 ,478 25 ,441 ,74 4 21, 672 ,596 0.0 9 3.44
2 79 JAVEDAN CEMENT 3 5 35 4 ,0602 80 KOHAT CEMENT 22 3,18 5 22 ,31 8 245 ,503 2 ,621 ,04 1 3, 085 ,973 0.0 1 0.192 81 LAFARGE PAKISTAN CEMENT 20 ,71 5,09 4 20, 715 ,094 66 ,288 ,30 1 64, 423 ,942 0.2 6 1.582 82 LUCKY CEMENT 6 ,38 7,76 3 6, 387 ,763 199 ,745 ,34 9 3 15, 491 ,615 1.2 5 1.982 83 MAPLE L EAF CEMENT 2 ,60 6,44 0 2, 606 ,440 10 ,686 ,40 4 12, 667 ,298 0.0 5 0.70
2 84 MUST EHKAM CEMENT 55 6,36 9 556 ,3692 85 MUST EHKAM CEMENT- RIGHT 12 2,45 0 122 ,450 11 ,020 ,50 0 6, 244 ,950 0.0 2 0.99
2 86 PIONEER CEMENT 1 ,27 1,56 3 14 ,881 1, 286 ,444 23 ,296 ,01 6 16, 067 ,686 0.0 6 0.64
2 87 PUNJAB BUI LDING 44 3,84 5 443 ,8452 88 THAT TA CEM ENT 275 275 3 ,85 3 6 ,7272 89 ZEAL PAK CEMENT 48 6,24 8 486 ,248 223 ,674 0.11
52,4 18,5 02 15 1,63 9 2 2,31 8 1 07,1 96 5 2,69 9,65 5 51 0,35 5,98 2 657 ,257 ,602 2.6 0
2 90 PAKISTAN TO BACCO 1 ,80 7,33 9 1, 807 ,339 192 ,120 ,13 6 1 25, 230 ,519 0.5 0 0.711,8 07,3 39 1,80 7,33 9 19 2,12 0,13 6 125 ,230 ,519 0.5 0
2 91 AT TOC K REF INERY LIM IT ED 3 ,35 6,32 2 671 ,26 4 4, 027 ,586 241 ,212 ,12 6 3 40, 894 ,879 1.3 5 4.72
BB
B
BB
BBB
B
B
B
B
B
B
BBB
B
BBB
B
B
B
B
B
B

Oil & Gas Market ing Companies
Power Generation & Dist ribution
17National Investment (unit) Trust STATEMENT OF MOVEMENT IN PORTFOLIO
STATEMENT OF MOVEMENT IN PORTFOLIO - HOLDING CATEGORISEDAS AVAILABLE FOR SALE AS AT MARCH 31, 2009
2 92 PAKISTAN REF INERY LIM ITED 1 ,57 5,00 0 1,57 5,0 00 15 4,9 80,0 00 107 ,77 7,25 0 0. 43 4.5 02 93 NAT ION AL REF INERY LIM IT ED 4 ,27 4,52 8 4,27 4,5 28 40 6,7 64,0 84 690 ,16 5,29 1 2. 73 5.3 5
9,2 05,8 50 67 1,26 4 9 ,877 ,114 802, 956, 210 1,1 38,8 37,42 0 4 .51
NO. OF SHARES
N am e Sa le ClosingShar es
Ca rrying Cost S.No Pur chase Bonus
% a ge ofInv. Co m.Paid-up
Merge r /De merge r
effects / Ad j.
Right / NewIssue
Op eningShares
Ma rketVa lu e
% a ge ofNet Asset
2 94 HUB POWER COM PANY 16 ,98 7,10 5 1 6,98 7,1 05 23 9,3 48,3 09 350 ,27 4,10 5 1. 39 1.4 72 95 KARACHI ELECTRIC CORPORATIO N 5 ,66 7,61 4 5,66 7,6 14 11,7 31,9 61 14 ,16 9,03 5 0. 06 0.0 42 96 KOHINOO R ENERGY 41 0,39 0 41 0,3 90 7,9 00,0 08 10 ,46 4,94 5 0. 04 0.2 42 97 KOHINOO R POWER 27 6,34 3 13 ,81 7 29 0,1 60 3,2 09,0 35 2 ,55 3,40 8 0. 01 2.3 02 98 KOT ADDU PO WER COMPANY 1 ,23 1,50 3 1,23 1,5 03 3 8,8 66,2 35 44 ,69 1,24 4 0. 18 0.1 4
2 99 S.G. POWER 32 3,37 6 32 3,3 76 2 32,8 31 37 1,88 2 1.8 1
3 00 SITARA ENERG Y 2 56,11 7 2 56, 117 5,2 40,1 54 5 ,38 8,70 2 0. 02 1.3 425,1 52,4 48 1 3,81 7 25,1 66,2 65 306, 528, 532 4 27,9 13,32 1 1 .69
3 01 PAKISTAN STATE O IL 1 3,11 4,13 7 13,11 4,1 37 1,13 1,7 51,5 73 2 ,569 ,58 4,00 4 10. 18 7.6 53 02 SHELL G AS L PG 1 ,53 4,03 3 1,53 4,0 33 3 3,7 79,3 14 100 ,01 8,95 2 0. 40 6.7 83 03 SUI SOUT HERN GAS COM PANY 10 ,06 9,82 2 1 0,06 9,8 22 10 5,8 33,8 29 132 ,92 1,65 0 0. 53 1.5 03 04 SUI NORT HERN GAS PIPELINE 16 ,89 4,30 3 1 6,89 4,3 03 10 9,2 82,0 45 510 ,54 5,83 7 2. 02 3.0 8
41,6 12,2 95 41,6 12,2 95 1, 380, 646, 762 3,3 13,0 70,44 2 13 .12
Oil & Gas Explorat ion Compani es
3 05 MARI GAS COMPANY 1 ,56 4,57 1 2 ,136 1,56 6,7 07 15 5,0 25,6 58 2 11,70 9,11 7 0. 84 4.2 63 06 OIL & GAS DEVELO PMENT CO. 4 ,77 8,47 2 100 ,000 4,87 8,4 72 24 3,8 74,8 15 351 ,59 1,47 7 1. 39 0. 113 07 PAK OI LF IEL DS LIM IT ED 3 ,29 3,21 3 100 ,000 678 ,64 2 4,07 1,8 55 41 7,3 24,4 19 696 ,53 1,51 6 2. 76 1.7 23 08 PAKISTAN PETRO LEUM LIM ITED 2 ,60 7,38 1 100 ,000 270 ,73 8 2,9 78, 119 29 9,6 58,3 34 516 ,01 8,67 9 2. 04 0.3 6
12,2 43,6 37 302 ,136 94 9,38 0 13,4 95,1 53 1 ,115, 883, 226 1,7 75,8 50,78 9 7 .03
Engineering
3 09 BALOCHISTAN T OWER 74,11 4 74, 1143 10 BOLAN CAST ING 25 9,53 5 25 ,95 3 51 ,90 7 33 7,3 95 4,8 49,6 12 8 ,49 2,23 2 0. 03 4.2 7
3 11 CRESCENT STEEL & ALL IED 3 ,51 6,24 0 23 ,381 351 ,62 4 3,89 1,2 45 6 6,2 67,9 02 57 ,16 2,38 9 0. 23 6.8 9
3 12 DADEX ET ERNET 5,83 2 5,8 32 1 51,3 89 51 3,21 6 0.0 53 13 DOST ST EEL MI LLS 29 ,656 2 9,6 56 2 41,4 00 18 5,35 0 0.0 43 14 HUF FAZ SEAML ESS PIPE 64 4,92 2 193 ,47 6 83 8,3 98 6,7 57,7 85 24 ,95 0,72 4 0. 10 2.4 63 15 INT ER NAT IONAL INDU ST RIES LTD. 8 ,72 0,23 3 1 ,744 ,04 6 1 0,46 4,2 79 48 1,0 42,9 06 459 ,59 1,13 4 1. 82 1 0.4 73 16 INT ER NAT IONAL INDU ST RIES-RIG HT 2 ,180 ,05 8 2,18 0,0 58
3 17 K.S.B. PUMPS 1 ,36 5,14 5 1,36 5,1 45 3 1,7 41,7 84 155 ,12 1,42 6 0. 61 11.3 8
3 18 KARACHI PIPE 15 6,10 2 15 6,1 023 19 MET ROPOLI TAN STEEL 9 8,51 8 9 8,5 18 2 ,50 3,34 2 0. 01 0.6 0
3 20 NOWSHERA ENG G 2 6,05 7 2 6,0 573 21 QUALI TY STEEL 3,42 2 3,4 22 0.1 93 22 RCD BALL 1 9,71 6 1 9,7 163 23 TAXILA ENGINEERING 20 6,88 8 20 6,8 88 4.8 7
15,0 96,7 24 53 ,037 2,31 5,09 9 2,23 1,96 5 19,6 96,8 25 591, 052, 779 7 08,5 19,81 4 2 .81
Automobile Assembler
3 24 AT LAS HONDA 12 6,96 1 12 6,9 61 6 44,6 47 11 ,27 4,13 7 0. 04 0.2 7
3 25 GHANDARA NISAN LIM ITED 2,6 88,7 11 2,6 88, 711 3 2,9 93,8 85 15 ,80 9,62 1 0. 06 5.9 73 26 GHANDHARA INDUSTRI ES LT D. 25 8,57 7 25 8,5 77 1,9 42,8 42 2 ,36 3,39 4 0. 01 1.2 13 27 GHANI AUT OMO BIL E 14 7 1 47 1,18 03 28 HINOPAK MOT ORS 50 0,00 0 50 0,0 00 17 0,0 34,0 00 141 ,32 5,00 0 0. 56 4.0 33 29 HONDA AT LAS CARS 3 ,60 0,00 0 19 ,831 3,61 9,8 31 4 1,7 00,4 53 44 ,70 4,91 3 0. 18 2.5 3
3 30 INDUS M OTO RS LIM ITED 87 3,60 8 87 3,6 08 10 7,3 48,9 51 64 ,51 5,95 1 0. 26 1. 11
3 31 MI LLAT T RACTO RS 25 0,00 0 62 ,50 0 31 2,5 00 4 1,8 46,8 75 56 ,06 8,75 0 0. 22 1.3 3
3 32 PAK SUZ UKI MO TOR C OMPANY 2 ,08 4,41 5 2,08 4,4 15 16 5,9 40,2 78 113 ,66 3,15 0 0. 45 2.5 3
3 33 S.N. KAWASAKI 4,48 2 4,4 82 5,60 3 0.1 710,3 86,9 01 19 ,831 6 2,50 0 10,4 69,2 32 562, 451, 931 4 49,7 31,69 8 1 .78
Automobile Parts & Accessories
3 34 AGRIAUT O INDUST RIES 1 ,08 7,21 7 217 ,44 3 1,30 4,6 60 9,7 53,7 67 36 ,47 8,29 4 0. 14 4.5 3
3 35 AT LAS ENGINEERING 2 5,16 4 2 5,1 64 26 3,97 0 0.2 0
3 36 AT LAS ENGINEERING RIGHT 25 ,16 4 2 5,1 64 1 4,34 33 37 AUTO MOT IVE BAT TERY 29 5,55 4 29 5,5 54 5.6 13 38 BALOCHISTAN WHEELS 1 ,59 2,16 0 1,59 2,1 60 4 8,8 72,4 28 42 ,98 8,32 0 0. 17 11.9 43 39 BELA ENG INEER ING 26 6,14 5 26 6,1 45 7.8 33 40 EXIDE (PAK) 35 6,15 3 35 6,1 53 1 5,4 28,8 03 39 ,27 2,99 1 0. 16 6.5 9
3 41 GENERAL T YRE & RUBBER CO. 3 ,76 5,97 6 3,76 5,9 76 6 2,5 15,2 02 32 ,53 8,03 3 0. 13 6.3 0
3 42 REX BAREN BATT ERY 5 6,15 5 5 6,1 553 43 TAGA PAKISTAN 9 6,05 5 9 6,0 55 3.6 9
7,5 40,5 79 21 7,44 3 2 5,16 4 7,7 83,1 86 136, 570, 199 1 51,5 55,95 1 0 .60
Cable & Electrical Goods
3 44 ASLO ELECT RONICS 3 9,40 7 3 9,4 073 45 CASSPAK INDUSTRIES 5 4,18 4 5 4,1 84
3 46 GREAVES AIRCONDIT ION 59,11 0 59, 1103 47 HYDERABAD ELECT RONIC 9 8,51 8 9 8,5 183 48 JOHNSON & PHI LIPS 57 4,32 4 57 4,3 24 16 ,32 8,03 1 0. 06 1 0.5 4
3 49 PAK ELEKTR ON 6 ,23 5,94 0 286 ,104 6,52 2,0 44 14 8,1 79,7 85 131 ,48 4,40 7 0. 52 6.8 33 50 PAK T EL EPHO NE CABL E 9 1,42 4 9 1,4 24 2 98,0 42 44 7,97 8 0.4 43 51 PAKISTAN CABLES 1 ,59 8,93 4 159 ,89 3 1,75 8,8 27 11,8 72,1 68 67 ,66 2,07 5 0. 27 8.1 93 52 PUNJAB LAMP 10 8,46 8 10 8,4 68
B
B
B
B
BBB
B
B
B
B
B
BB
BB
BBB
B

18 STATEMENT OF MOVEMENT IN PORTFOLIO National Investment (unit) Trust
3 53 REFR'S M ANAG.CO .PK 26 263 54 SIEMENS PAKISTAN L IMIT ED 98 3,6 58 983 ,658 1 ,112, 025 ,36 9 7 37,7 43, 500 2.9 2 11 .933 55 SINGER PAKISTAN 6 2 8 261
9,8 43,9 99 28 6,10 4 159 ,893 2 10 ,289 ,998 1,27 2,37 5,36 4 953 ,666 ,252 3.7 8
NO . OF SHARES
Nam e Sale Closin gShare s
Car rying Cost S.No Purchase Bonu s
% a ge ofInv. Co m.Paid-up
Me rger /Deme rger
eff ects / Adj.
Rig ht / NewIssue
OpeningShar es
Mar ketValue
% a ge ofNet Asse t
Transport
3 56 P.N. S.C . 43 6,5 64 436 ,564 4, 482 ,92 1 17 ,811 ,811 0.0 7 0 .33
3 57 PAN.I SL AM IC ST EAM SHIP 1,1 36 1 ,1364 37,7 00 437 ,700 4,48 2,92 1 1 7,81 1,811 0.0 7
Technology & Com munication
3 58 EYE T ELEVISION NET WORK LT D. 9 ,15 9 9 ,159 258 ,37 5 3 50, 973 0 .023 59 NETSOL TECHNOL OGY 442 ,87 7 442 ,877 11, 191 ,50 2 7,4 97, 908 0.0 3 0 .623 60 P.T. C.L. "A" 6 ,09 9,3 84 6, 099 ,384 1 03, 018 ,59 6 1 01,7 37, 725 0.4 0 0 .163 61 PAK DATACOM LIM IT ED 1 43,1 19 143 ,119 2, 537 ,59 9 7,6 03, 912 0.0 3 1 .83
3 62 TRG PAKISTAN LT D 49 2,5 90 586 ,15 1 1, 078 ,741 1, 920 ,15 9 1,4 45, 513 0.0 1 0 .296,7 35,0 93 1,03 8,18 7 7 ,773 ,280 11 8,92 6,23 1 118 ,636 ,031 0.4 7
Fert ilizer
3 63 DAWO OD HERCUL ES L IMIT ED 19 4,8 22 19,4 82 214 ,304 47 ,211 ,17 1 30,0 79, 709 0.1 2 0 .203 64 ENGRO CHEM ICAL 1 ,42 0,3 12 1, 420 ,312 1 37, 003 ,29 6 2 05,4 48, 131 0.8 1 0 .673 65 ENGRO CHEM ICAL - RIGHT - 56 8,12 5 568 ,125 53,7 73, 031 0.2 1 0 .673 66 FAUJI F ERTI LIZ ER BI N QASIM 65 0,0 00 650 ,000 8, 385 ,00 0 11,1 28, 000 0.0 4 0 .07
3 67 FAUJI F ERTI LIZ ER COMPANY LIM ITED 21 ,43 8,7 74 100 ,00 0 5,3 84,6 93 26, 923 ,467 1,2 65, 268 ,63 9 2,3 40,1 87, 752 9.2 7 4 .3623,7 03,9 08 10 0,00 0 5 ,404 ,175 5 68,1 25 29 ,776 ,208 1,45 7,86 8,10 5 2 ,640 ,616 ,623 10.4 6
Pharmaceut icals
3 68 ABBOT T LABORATORIES 2 ,59 3,0 29 2, 593 ,029 2 32, 361 ,32 9 1 91,7 80, 425 0.7 6 2 .653 69 FERO ZSONS LABORATO RIES 82 3,7 62 1 64,7 52 988 ,514 1, 876 ,56 4 1 43,9 96, 834 0.5 7 5 .693 70 GLAXOSM ITHKL INE PAKISTAN 6 ,33 5,7 30 6, 335 ,730 4 81, 135 ,33 6 5 74,2 70, 567 2.2 7 3 .713 71 HIGHNO ON LABORATO RIES 32 0,6 24 1 320 ,625 3, 639 ,34 0 10,9 81, 406 0.0 4 1 .94
3 72 OT SU KA PAKISTAN 10 5,2 17 105 ,217 1, 616 ,59 0 6,1 01, 534 0.0 2 1 .05
3 73 SANO FI- AVENT IS PHARM A 22 9,4 61 229 ,461 21, 056 ,38 7 23,2 30, 632 0.0 9 2 .38
3 74 SEARL E PAKISTAN 78 6,2 07 50 1 5 786 ,713 21, 203 ,95 1 35,4 02, 085 0.1 4 2 .95
3 75 WYET H PAK L TD 111,5 74 111 ,574 43, 913 ,23 5 1 54,8 64, 712 0.6 1 7 .8511,3 05,6 04 50 1 164 ,752 5 1 11 ,470 ,863 80 6,80 2,73 3 1 ,140 ,628 ,195 4.5 2
Chemical s
3 76 BAWANY AI R PRODUCT S 7 4,3 14 74 ,314 247 ,98 4 2 77, 934 1 .09
3 77 BERG ER PAINT S 27 8,3 78 278 ,378 6, 359 ,61 2 12,5 74, 334 0.0 5 3 .40
3 78 BOC PAKISTAN 90 0,0 00 68 1 900 ,681 1 01, 614 ,83 0 1 24,0 77, 815 0.4 9 3 .60
3 79 BUXL Y PAINT S 17 5,2 18 175 ,218 2, 525 ,22 6 7,0 08, 720 0.0 3 12 .17
3 80 CLARIANT PAKISTAN 1 ,55 2,2 91 86 1, 552 ,377 18, 442 ,78 4 1 61,7 88, 731 0.6 4 5 .693 81 DAT A AGRO 9 8,5 18 98 ,518 0 .603 82 DYNEA PAKI ST AN 1 ,78 7,6 10 1, 787 ,610 17, 621 ,72 1 16,5 35, 393 0.0 7 9 .473 83 I.C.I . PAKISTAN 27 8,3 51 278 ,351 19, 125 ,49 7 26,7 71, 799 0.1 1 0 .203 84 LEINER PAK. GELATINE 2 7,2 77 27 ,277 353 ,65 4 1,5 82, 066 0.0 1 0 .36
3 85 NIM IR RESINS LIM ITED 51 3,3 95 513 ,395 1 ,755 ,811 0.0 1 1 .63
3 86 PAKISTAN GU MS & CHEMI CAL S 9 7,0 57 97 ,057 1, 449 ,04 1 4,5 74, 296 0.0 2 2 .28
3 87 PAKISTAN PTA LI MIT ED 5 ,04 9,2 59 5, 049 ,259 8, 028 ,32 2 14,2 38, 910 0.0 6 0 .333 88 SARD AR CHEM ICAL 14 7,7 77 147 ,777 2 95, 554 2 .463 89 SIND ALKALIS 70 4,7 45 704 ,745 9 .423 90 SITARA CHEMICAL 66 2,4 95 662 ,495 91, 908 ,37 8 1 13,2 20, 396 0.4 5 3 .253 91 SITARA PERO XI DE 104 ,32 2 104 ,322 1, 677 ,75 0 2 ,114, 607 0.0 1 0 .19
3 92 WAH- NOBLE CHEM ICAL LT D. 63 6,6 24 636 ,624 10, 157 ,02 2 35 ,116, 180 0.1 4 7 .0712,9 83,3 09 10 5,00 3 86 13 ,088 ,398 2 79,5 11,82 2 521 ,932 ,546 2.0 7
Paper & Board
3 93 ADAM JEE PAPER 26 9,8 06 269 ,8063 94 B.P. BO ARD 78 1,1 30 781 ,130 13 .023 95 CENTRAL F OREST 14 7,7 77 147 ,777 2 .46
3 96 CENTURY PAPER & BO ARD MIL LS 5 ,50 0,0 15 5, 500 ,015 1 58, 675 ,43 3 86,1 85, 235 0.3 4 7 .78
3 97 CHERAT PAPERSAC K LIM ITED 1 93 48 241 2 ,88 5 6, 7343 98 CHILYA C. BOARD 4 3,2 00 43 ,2003 99 DADABHO Y SACK 4 9,2 59 49 ,259 0 .544 00 MERIT PACKAGING 59 4,9 09 89,2 36 684 ,145 3, 168 ,53 6 19,2 31, 316 0.0 8 14 .424 01 PACKAGES LIM IT ED 4 ,56 9,3 83 4, 569 ,383 3 70, 988 ,20 6 7 90,9 14, 503 3.1 3 5 .424 02 PAK PAPER CO RPO RAT ION 10 3,8 48 103 ,8484 03 PAKISTAN PAPER PRODU CTS 19 3,0 01 96,5 00 289 ,501 567 ,57 0 11,1 02, 363 0.0 4 7 .72
4 04 PREM IER BOARD 2 9,9 98 29 ,9984 05 SECU RITY PAPERS LI MIT ED 1 ,50 0,0 00 3 00,0 00 1, 800 ,000 1 02, 456 ,00 0 73,8 00, 000 0.2 9 0 .58
13,7 82,5 19 485 ,784 14 ,268 ,303 63 5,85 8,62 9 981 ,240 ,151 3.8 9
Vanaspati & A llied Industries
4 06 AL-HUSSAIN INDU ST RIES 6 1,5 73 61 ,573
4 07 FAZ AL VEG ET ABL E GHEE 4 2,0 05 42 ,005 2 .10
4 08 KAKAKHEL PAKISTAN L IMI TED 4 57 45 7
4 09 MO RAF CO I NDUSTRIES 5 7,4 09 57 ,409 10 .10
4 10 PAKISTAN GH EE 5 8,6 18 58 ,618 2 .664 11 PUNJAB OIL 19 5,3 33 97,6 67 293 ,000 3, 221 ,72 0 14,3 54, 070 0.0 6 9 .574 12 SURAG GHEE 5 4,3 24 54 ,324 5 .67
4 69,7 19 97 ,667 4 57 566 ,929 3,22 1,72 0 14 ,354 ,070 0.0 6
STATEMENT OF MOVEMENT IN PORTFOLIO - HOLDING CATEGORISEDAS AVAILABLE FOR SALE AS AT MARCH 31 , 2009
B
B
B
B
B
B
BB
B
BB
BB
B
B
BBBB
B
B

19National Investment (unit) Trust STATEMENT OF MOVEMENT IN PORTFOLIO
NO. OF SHARES
N am e Sale ClosingSha res
Carr yin g Cost S.No Purcha se Bon us
% ag e ofI nv. Com .Paid-up
Merge r /De merge r
effects / Ad j.
Right / NewIssue
OpeningShar es
MarketValue
% age ofNet Asset
Leather & Tanneries
41 3 BATA (PAK) LI MIT ED 1 ,09 0,2 34 1 ,09 0,2 34 5 8,3 46,6 99 71 2,79 4,9 89 2 .82 14 .42
41 4 FAT EH INDUST RIES 2 3,0 62 2 3,0 62 1 .1541 5 H-SHAIKH MUHAM MAD HUSSAIN 11 3,0 22 11 3,0 22
1,2 26,3 18 1,2 26,3 18 58, 346, 699 7 12,7 94,9 89 2.82
Food & Personal Care-P roducts
STATEMENT OF MOVEMENT IN PORTFOLIO - HOLDING CATEGORISEDAS AVAILABLE FOR SALE AS AT MARCH 31 , 2009
41 6 IBL HEALTHCARE LI MIT ED 295 ,40 1 29 5,4 01 6,56 0,8 56 0 .03 0 .83
41 7 MIT CHELLS F RUIT FARM S 56 2,2 03 56 2,2 03 3 1,3 71,5 64 3 0,44 3,2 92 0 .12 11 .1541 8 MUBARIK DAIRIES 5 5,4 16 5 5,4 16 1 .9841 9 NEST LE PAKISTAN 9 8,0 00 9 8,0 00 13 0,6 83,0 00 11 5,23 8,2 00 0 .46 0 .22
BB
B
B
42 0 SHEZ AN INT ERNAT IONAL 1 ,14 1,1 77 1 ,14 1,1 77 7 0,5 18,6 37 17 0,02 3,9 61 0 .67 19 .02
42 1 TREET CO RPORAT ION 35 5,0 64 35 5,0 64 8,2 80,2 32 4 9,65 2,1 50 0 .20 8 .49
42 2 UNILEVER PAKISTAN 111,0 00 111,0 00 20 0,6 55,8 10 21 0,90 0,0 00 0 .84 0 .83
42 3 UQAB BREDI NG 13 9,7 48 13 9,7 48 5 .2742 4 ZULF EQAR INDUST RIES 28 1,7 02 28, 170 30 9,8 72 4,8 65,3 54 2 2,62 0,6 56 0 .09 6 .40
2,7 44,3 10 28 ,170 29 5,40 1 3,0 67,8 81 446, 374, 598 605 ,439 ,116 2.40
Glass & Ceramics
42 5 BALU CHISTAN GL ASS 59 1,5 34 59 1,5 34 1,6 26,7 19 1,7 39, 110 0 .01 0 .69
42 6 GHULAM MUHAM MAD DADABHOY 4 9,2 59 4 9,2 59 0 .54
42 7 EM CO L IMI TED 33 0,7 31 42 4,1 98 75 4,9 29 4, 152 ,110 4,74 0,9 54 0 .02 2 .1642 8 EM CO ( N.L.) RIG HT 42 4,1 98 ( 424 ,19 8)42 9 GHANI GL ASS 62 3,0 52 31, 152 65 4,2 04 3 2,7 55,9 94 4 1,24 7,5 62 0 .16 0 .7443 0 KARAM CERAM ICS 35 8,2 32 35 8,2 32 3,5 82,3 22 6,23 3,2 37 0 .02 2 .4643 1 MEDI GL ASS 29 5,5 54 29 5,5 54 5 .61
43 2 REG AL CERAMICS 8 9,9 47 8 9,9 47 1 .23
43 3 SHABBIR T ILES 1 ,60 7,2 45 3 21, 449 1,6 07,2 45 3 ,53 5,9 39 3 1,8 41,3 85 5 1,44 7,9 12 0 .20 4 .90
43 4 SHABBIR T ILES-RIG HT 1 ,60 7,2 45 (1 ,607 ,24 5)5,9 76,9 97 352 ,601 6,3 29,5 98 73, 958, 530 1 05,4 08,7 76 0.42
Miscellaneous
43 5 ADAM JEE FL OORING S 59,1 10 59,1 1043 6 ARAG INDUSTRI ES LT D 18 9,2 20 18 9,2 20
43 7 GRAYS OF CAM BRI DGE 7 0,2 02 7 0,2 02 9,2 48,1 00 7,79 2,4 22 0 .0343 8 GYPSUM CORPORAT ION 16 5,0 17 16 5,0 1743 9 HASHIM I CAN 16 0,9 86 16 0,9 8644 0 NAT IONAL M AT CH INDU ST RIES 2 6,4 52 2 6,4 5244 1 NAT IONAL O VER 2 4,6 29 2 4,6 2944 2 PACE PAKISTAN - 525 ,71 6 52 5,7 16 4,5 42,1 91 3,89 0,2 98 0 .0244 3 PAK. GERM AN 6 9,0 85 6 9,0 85
44 4 PAKISTAN SERVI CES L IMI TED 89 3,7 95 89 3,7 95 36 0,4 27,0 10 10 9,57 9,2 67 0 .4344 5 SYED M AT CH 1 4,7 77 1 4,7 77 1 47,7 77 29 5,5 4044 6 TAWAKKAL LIM IT ED 11 3,2 64 11 3,2 6444 7 TRI- PACK F ILM S LIM ITED 37 5,6 25 2 ,46 6 37 8,0 91 4 7,1 25,2 68 3 7,22 2,9 59 0 .1544 8 TURBO T EC 17 0,8 79 17 0,8 7944 9 UNITED BRANDS LI MIT ED 8,0 16 8,0 16 56 5,1 2845 0 UNITED DI ST RIBUT ORS LIM IT ED 35 7,5 91 53, 638 4 11,2 29
2,6 98,6 48 52 8,18 2 53 ,638 3,2 80,4 68 421, 490, 346 1 59,3 45,6 14 0.63
6 79,1 03,9 23 8,34 6,86 2 52 ,654 ,001 5, 451, 959 38 1,00 4 1 ,786 ,646 7 44,1 51,1 03 16, 495, 040, 109 23,6 12,0 39,7 59 10 4.74Total por tfolio cate gor isedas av ailab le for sa le
B
B
BB
B
BB
BBBB
B
B
BBB
B

20 STATEMENT OF MOVEMENT IN PORTFOLIO National Investment (unit) Trust
STATEMENT OF MOVEMENT IN PORTFOLIO - HOLDING CATEGORISEDAS HELD FOR TRADING AS AT MARCH 31, 2009
Textile Spinning
Commercial Banks
NO. OF SHARES
Nam e Sale ClosingSha res
Carrying Cost S.No Purch ase Bon us
% age ofInv. Com .Pa id -up
Merge r /De merge r
effects / Ad j.
Right / NewIssue
Open in gSha res
M arketValue
% age o fNe t Asset
Modarabas
Cl osed - End - Mutual Funds
1 PAKISTAN ST RAT EGIC ALLO CAT ION FUND 1, 238 ,865 1,2 38, 865 11,40 9,9 47 3,5 92,7 09 0.0 1 0. 412 PICIC ENERGY F UND 1, 477 ,772 1,4 77, 772 11,06 8,5 12 5,1 86,9 80 0.0 1 1. 483 PICIC GRO WTH FUND 37 ,442 37, 442 8 89, 996 3 29,8 64 0. 01
2,75 4,07 9 2 ,754 ,079 23 ,368 ,455 9, 109, 552 0.0 3
4 AL-NO OR M ODARABA 1, 034 ,440 1,0 34, 440 4,0 34, 316 4,11 7,07 1 0.0 2 4. 93
5 AL-Z AMIN LEASI NG M ODARABA 2, 312 ,127 2,3 12, 127 18,7 05, 107 6,9 59,5 02 0.0 5 9. 08
6 B.F. M ODARABA 387 ,617 29 ,071 4 16, 688 1,3 56, 660 1,0 41,7 20 0.0 1 6. 10
7 BRR GUARDIAN M ODARABA 3, 006 ,274 3,0 06, 274 21,4 34, 734 8,4 17,5 67 0.0 4 3. 85
8 CRESC ENT STANDARD M ODARABA 185 ,214 1 85, 214 4 42, 661 79,6 42 0. 93
9 ELIT E CAPIT AL MO DARABA 925 ,620 9 25, 620 3,6 37, 687 2,0 82,6 45 0.0 1 8. 16
1 0 EQUIT Y MODARABA 1, 780 ,110 1,7 80, 110 5,2 51, 325 1,5 66,4 97 0.0 1 3. 39
11 FI RST F IDELIT Y LEASI NG 1, 028 ,078 1,0 28, 078 5,1 30, 109 3,5 98,2 73 0.0 1 3. 89
1 2 FI RST PRUDENTI AL MO DARABA 341 ,251 3 41, 251 1,4 50, 317 3 07,1 26 0. 39
1 3 I.B.L. MO DARABA 1, 426 ,774 1,4 26, 774 14,6 95, 772 7,1 33,8 70 0.0 6 7. 07
1 4 KASB M ODARABA 687 ,745 6 87, 745 5,6 05, 122 3,8 51,3 72 0.0 3 2. 43
1 5 KASB M ODARABA- RIGHT 1, 650 ,588 (1 ,65 0,58 8) - - -
1 6 MO DARABA AL -M AL I 144 ,310 1 44, 310 7 08, 562 1 91,9 32 0. 78
1 7 PUNJAB MODARABA 1, 168 ,034 1,1 68, 034 8,5 26, 648 2,4 29,5 11 0.0 1 3. 43
1 8 STANDARD CHARTERED M ODARABA 3, 152 ,598 3,1 52, 598 37,8 31, 176 2 4,3 38,0 57 0.0 9 6. 95
1 9 TRI -STAR M ODARABA IST 297 ,278 2 97, 278 1,7 95, 559 8 59,1 33 1. 40
2 0 U.D.L . MO DARABA 1, 714 ,625 1,7 14, 625 8,1 78, 761 6,8 58,5 00 0.0 3 6. 50
2 1 UNICAP MO DARABA 349 ,197 3 49, 197 1 95, 550 52,3 80 2. 56
2 1,59 1,88 0 29 ,071 ( 1,6 50,5 88) 19 ,970 ,363 138 ,980 ,066 73, 884, 798 0.3 5
Leasing Compani es
2 2 AL-Z AMIN LEASIN G CORPORAT ION 129 ,420 1 29, 420 4 78, 854 2 61,4 28 0. 26
2 3 ASKARI L EASING 114,7 09 17 ,206 1 31, 915 3,4 08, 004 2,11 0,64 0 0.0 2 0. 25
2 4 CAPI TAL ASSET S 36 36 198 63
2 5 ENGLISH L EASING 707 ,261 7 07, 261 7,5 67, 693 1,4 00,3 77 0.0 1 8. 84
2 6 NAT IONAL ASSETS 265 ,013 2 65, 013 1 64, 308 26,5 01 2. 78
2 7 NAT OVER LEASE & REF . 729 ,349 7 29, 349 5,1 05, 443 5,1 05,4 43 0.0 2 8. 31
2 8 NETWORK L EASING 246 ,295 (2 46, 295 )
2 9 SAUDI PAK. L EASING 133 ,185 1 33, 185 9 18, 977 3 30,2 99 0. 29
3 0 STANDARD CHARTERED LEASING 773 ,924 7 73, 924 8,5 13, 164 1,3 93,0 63 0.0 1 0. 79
3,09 9,19 2 17 ,206 ( 246 ,295 ) 2 ,870 ,103 26 ,156 ,641 10, 627, 814 0.0 5
Investment Banks / Cos / Securi ties
3 1 FI RST DAWOOD I NVEST MENT BANK 99 ,469 9 ,947 1 09, 416 6, 957 ,857 1,8 23,9 65 0.0 2 0. 17
3 2 JS INVEST M ENT 34 ,480 34, 480 3, 278 ,014 6 74,7 74 0.0 1
3 3 TRUST INVESTM ENT BANK 55 55 1 ,675 7 39
13 4,00 4 9 ,947 143 ,951 10 ,237 ,545 2, 499, 477 0.0 2
3 4 ALLIED BANK LI MIT ED 19 ,613 7 5,00 0 9 ,461 1 04, 074 5, 362 ,243 4,0 31,8 27 0.0 1 0. 01
3 5 ASKARI BANK L IMIT ED 556 ,290 139 ,072 6 95, 362 22, 357 ,295 11 ,34 1,35 4 0.0 3 0. 14
3 6 BANK ALF ALAH LIM IT ED 578 ,326 45 2,80 0 515 ,563 1,5 46, 689 46, 276 ,145 2 1,6 69,11 3 0.0 7 0. 13
3 7 BANK AL- HABI B LIM ITED 2, 354 ,362 647 ,449 3,0 01, 811 99, 401 ,164 8 0,6 88,6 80 0.2 3 0. 49
3 8 BANK O F PUNJAB 221 ,430 2 21, 430 6, 893 ,116 2,4 55,6 59 0.0 1 0. 04
3 9 SAM BA BANK LI MIT ED 1, 777 ,740 1,7 77, 740 18, 755 ,157 8,0 70,9 40 0.0 3 0. 20
4 0 FAYSAL BANK LI MIT ED 1, 517 ,503 4 3,50 0 234 ,150 1,7 95, 153 54, 373 ,905 2 6,0 83,5 73 0.0 7 0. 29
4 1 HABI B BANK L IMIT ED 7 9,90 0 15 ,980 95, 880 13, 953 ,563 11 ,09 2,35 7 0.0 2 0. 01
4 2 HABI B METR OPOLIT AN BANK 355 ,671 88 ,917 4 44, 588 14, 642 ,975 1 0,9 45,7 57 0.0 4 0. 06
4 3 JS BAN K L IM ITED 7 2,00 0 72, 000 810 ,720 4 06,8 00 0. 01
4 4 KASB BANK LIM IT ED 49 2 492 701 ,941 4,3 69
4 5 MCB BANK LIM IT ED 6 0,20 0 6 ,020 66, 220 16, 608 ,479 9,3 50,2 64 0.0 3 0. 01
4 6 MEEZAN BANK LI MIT ED 112 9 121 3 ,415 1,6 34
4 7 MEEZAN BANK LI MIT ED - R IGHT 42 42
4 8 NAT IONAL BANK OF PAKI ST AN 1, 095 ,530 1 ,16 8,60 0 2,2 64, 130 2 97, 210 ,759 19 9,4 69,8 53 0.4 5 0. 25
4 9 NIB BANK LIM IT ED 18, 892 ,042 20 0,00 0 1 9,0 92, 042 2 16, 598 ,518 10 4,8 15,3 11 0.3 5 0. 67
5 0 SAUDI PAK COM M BANK 2, 698 ,371 2,6 98, 371 40, 880 ,321 11 ,14 4,27 2 0.0 5 0. 30
5 1 SONERI BANK LIM ITED 2, 342 ,566 515 ,364 2,8 57, 930 58, 189 ,339 3 7,1 24,5 11 0.1 0 0. 57
5 2 UNIT ED BANK L IMIT ED 32 1,10 0 3 21, 100 24, 465 ,322 1 6,4 82,0 63 0.0 5 0. 03
3 2,40 9,55 6 2,4 73,1 00 2 ,171 ,985 42 49 2 37 ,055 ,175 937 ,484 ,375 555, 178, 335 1.5 6
5 3 D.S. INDUST RIES 883 ,102 8 83, 102 44, 782 ,102 2,4 10,8 68 0.0 5 1. 475 4 DIN T EXIL E 18 ,943 18, 943 450 ,843 3 16,9 16 0. 105 5 GADOON TEXTI LE 513 ,399 5 13, 399 29, 058 ,383 9,7 54,5 81 0.1 0 2. 195 6 MAQBOO L T EXT ILE 245 ,873 2 45, 873 3, 933 ,968 3,1 96,3 49 0.0 1 1. 465 7 PREM IUM TEXT ILE 2 ,216 2, 216 67 ,145 66,4 80 0. 045 8 SAI F T EXT IL E 46 ,244 46, 244 461 ,978 1 89,6 00 0. 18
1,70 9,77 7 1 ,709 ,777 78 ,754 ,420 15, 934, 795 0.1 7

21National Investment (unit) Trust STATEMENT OF MOVEMENT IN PORTFOLIO
STATEMENT OF MOVEMENT IN PORTFOLIO - HOLDING CATEGORISEDAS HELD FOR TRADING AS AT MARCH 31 , 2009
Synthetic & Rayons
Textile Composite
5 9 AZG AR D NINE LI MIT ED 4 34 1 00 ,000 1 00, 434 4 ,282 ,71 7 3, 096 ,380 0 .01 0.0 3
6 0 BLESSED TEXTIL E 3 2,0 18 32, 018 2 ,241 ,26 0 1, 312 ,738 0 .01 0.5 0
6 1 CRESCENT T EXT IL E 19 0,0 58 1 90, 058 11,1 22, 194 6, 247 ,206 0 .04 0.3 9
6 2 FATEH T EXTIL E 5 8,1 25 58, 125 31 ,968 ,75 0 27, 222 ,844 0 .14 4.6 5
6 3 GUL AHM ED TEXT ILE 74 2,4 21 7 42, 421 29 ,696 ,84 0 24, 574 ,135 0 .14 1.3 4
6 4 GUL AHM ED TEXT ILE - RIGHT 111 ,363 1 11,36 3
6 5 KOHINO OR M ILL S 1,66 2,2 29 1,6 62, 229 36 ,203 ,34 8 12, 965 ,386 0 .09 3.2 6
6 6 KOHINO OR T EXT ILE 7 1,5 77 71, 577 992 ,77 3 360 ,032 0.0 5
6 7 MEHM OOD TEXTI LE 7 5,1 28 75, 128 9 ,691 ,51 2 7, 708 ,133 0 .05 0.7 5
6 8 NISHAT ( CHUNNIAN) MIL LS 43 2,0 33 43,2 03 4 75, 236 10 ,373 ,112 4, 414 ,942 0 .02 0.5 7
6 9 NISHAT ( CHUNNIAN) PREF -RI GHT 23 7,6 18 2 37, 618
7 0 NISHAT M ILL S 60 0,6 65 6 20 ,000 61 0,3 32 1,8 30, 997 1 04 ,891 ,55 8 55, 515 ,829 0 .11 0.7 6
7 1 SAPPHIRE F IBRE M ILLS 32 2,5 52 3 22, 552 83 ,847 ,39 2 25, 004 ,231 0 .26 1.8 4
7 2 SAPPHIRE T EXTIL E MIL LS 57 1,11 2 5 71, 112 77 ,385 ,67 6 37, 693 ,392 0 .30 2.8 4
4,7 58,3 52 720 ,000 43 ,203 9 59,3 13 6 ,480 ,868 40 2,69 7,13 3 206 ,115 ,249 1 .17
Woolen
7 3 BANNU WOOL LEN 37 4,4 90 3 74, 490 19 ,278 ,74 5 9, 017 ,719 0 .08 4.9 23 74,4 90 374 ,490 1 9,27 8,74 5 9 ,017 ,719 0 .08
7 4 DEWAN SAL MAN F IBRE 1,76 6,9 86 1,7 66, 986 8 ,746 ,58 1 2, 438 ,441 0 .01 0.4 8
7 5 GATRO N INDUST RIES 7 38 738 60 ,64 1 51 ,402
7 6 IBRAHIM FIBRES 1 8,5 30 18, 530 972 ,82 5 430 ,081 0.0 1
7 7 PAKISTAN SYNT HETIC 2,65 6,2 83 2,6 56, 283 18 ,328 ,35 3 16, 973 ,648 0 .03 4.7 4
7 8 RUPAL I POLYESTER 20 2,2 23 2 02, 223 8 ,493 ,36 6 6, 066 ,690 0 .03 0.5 94,6 44,7 60 4 ,644 ,760 3 6,60 1,76 6 25 ,960 ,262
Jute
7 9 T HAL LIM IT ED 4,9 01 1,9 61 6, 862 960 ,69 4 376 ,449 0.0 2
4,9 01 1, 961 6 ,862 96 0,69 4 376 ,449
Sugar & Al lied Industries
8 0 HABIB ADM 11 9,01 7 1 19,0 17 1 ,366 ,31 5 1, 695 ,992 0.3 0
1 19,0 17 119, 017 1,36 6,31 5 1 ,695 ,992
Cem ent
8 1 AL- ABBAS CEMENT 78 8,1 48 7 88, 148 9 ,032 ,17 6 6, 825 ,362 0 .01 0.4 3
8 2 ATT OCK CEMENT 2 6,8 38 26, 838 2 ,070 ,01 5 1, 810 ,491 0.0 4
8 3 CHERAT CEM ENT 5 6,4 88 56, 488 1 ,530 ,26 0 823 ,030 0.0 6
8 4 D.G. KHAN CEM EN T 20 2,4 93 1,9 50 ,000 2,1 52, 493 1 15,0 77, 480 46, 945 ,872 0 .18 0.8 5
8 5 D.G. KHAN CEM EN T - RIGHT 43 0,4 99 4 30, 499
8 6 LUCKY CEM ENT 26 4,6 26 9 37 ,600 1,2 02, 226 97 ,438 ,63 6 59, 377 ,942 0 .15 0.3 7
8 7 MAPLE L EAF CEM ENT FACT ORY 92 2,8 06 9 22, 806 10 ,067 ,81 3 4, 484 ,837 0 .01 0.2 5
2,2 61,3 99 2 ,887 ,600 4 30,4 99 5 ,579 ,498 23 5,21 6,38 1 120 ,267 ,535 0 .36
Tobacco
8 8 PAKISTAN T OBACCO 2 9,7 14 29, 714 3 ,476 ,53 8 2, 058 ,883 0 .01 0.0 129,7 14 29 ,714 3,47 6,53 8 2 ,058 ,883 0 .01
Ref inery
8 9 ATT OCK REFI NERY L IMI TED 38 5,9 45 1,0 00 ,000 2 77,1 89 1,6 63, 134 2 85 ,489 ,93 7 1 40, 767 ,662 0 .39 1.9 5
9 0 NATIO NAL REFINERY L IMIT ED 20 4,8 64 2 01 ,000 4 05, 864 1 08 ,376 ,89 4 65, 530 ,801 0 .15 0.5 1
9 1 PAKISTAN REF INERY LIM IT ED 2 1,6 16 21, 616 3 ,272 ,23 0 1, 479 ,183 0 .01 0.0 6
6 12,4 25 1 ,201 ,000 277, 189 2 ,090 ,614 39 7,13 9,06 1 207 ,777 ,646 0 .56
Power Generat ion & Distribut ion
9 2 HUB POWER COM PANY 1,26 1,0 59 42 ,000 1,3 03, 059 37 ,103 ,68 7 26, 869 ,077 0 .07 0.11
9 3 K.E.S.C. 9,17 0,1 61 9,1 70, 161 50 ,160 ,78 1 22, 925 ,403 0 .08 0.0 7
9 4 KOHINO OR ENERGY 66 0,8 67 6 60, 867 17 ,942 ,53 9 16, 852 ,109 0 .05 0.3 9
9 5 KOT ADDU PO WER COM PANY 90 8,3 29 9 08, 329 42 ,691 ,46 3 32, 963 ,259 0 .11 0.1 0
12,0 00,4 16 42 ,000 12 ,042 ,416 14 7,89 8,47 0 99 ,609 ,847 0 .31
Oil & Gas Marketing Com panies
9 6 PAKISTAN ST AT E OIL 62 3,6 74 1 05 ,000 7 28, 674 2 97 ,998 ,59 1 1 42, 776 ,384 0 .42 0.4 2
9 7 SHELL PAKISTAN 1,8 35 4 58 2, 293 765 ,19 5 558 ,506 0.0 0
9 8 SUI SOUT HERN GAS COM PANY LT D. 5,54 6,9 67 5,5 46, 967 1 55 ,647 ,89 4 73, 219 ,964 0 .23 0.8 3
9 9 SUI NO RT HERN GAS PIPELINE 1 1,86 7 29 ,200 41, 067 1 ,666 ,64 9 1, 241 ,045 0.0 16,1 84,3 43 134 ,200 458 6 ,319 ,001 45 6,07 8,32 9 217 ,795 ,899 0 .65
NO. OF SHARES
Na me Sale ClosingSh ares
Carr yin g Co st
S.No Purchase Bonu s % age ofInv. Com.Paid-u p
M erge r /De merge r
effects / Ad j.
Right / NewIssue
OpeningShare s
Mar ketValue
% a ge ofNet Asset
0 .07

22 STATEMENT OF MOVEMENT IN PORTFOLIO National Investment (unit) Trust
STATEMENT OF MOVEMENT IN PORTFOLIO - HOLDING CATEGORISEDAS HELD FOR TRADING AS AT MARCH 31, 2009
Oil & Gas Exploration Com panies
100 M ARI GAS 8 4,29 9 84 ,299 22 ,721 ,10 9 11,39 1,3 24 0. 03 0 .23
101 OIL & GAS DEVEL OPMENT COM PANY 1 ,96 7,63 1 2,33 4,2 00 4, 301 ,831 5 30 ,689 ,82 3 3 10,0 32, 960 0. 85 0 .10
102 PAK O ILF IELDS LI MIT ED 23 1,42 6 30 5,4 00 107 ,36 5 644 ,191 1 73 ,055 ,17 2 11 0,19 5,3 12 0. 26 0 .27
103 PAKISTAN PET ROLEUM LIM IT ED 2 ,46 8,06 2 7 8,2 00 254 ,62 6 2, 800 ,888 6 23 ,700 ,32 4 4 85,3 09, 864 1. 12 0 .34
4,75 1,41 8 2,7 17,8 00 36 1,99 1 7 ,831 ,209 1,35 0,16 6,42 9 916 ,929 ,460 2 .26
Engineering
104 CRESCENT ST EEL & AL LIED 1 5,08 8 1 ,50 8 16 ,596 931 ,38 2 2 43, 795 0 .03
105 INT ERNAT IONAL I NDUSTRIES 4 2,36 0 8 ,47 2 50 ,832 5 ,314 ,48 6 2,2 32, 541 0. 01 0 .05
106 INT ERNAT IONAL I NDUSTRIES-RI GHT 10 ,590 10 ,5905 7,44 8 9,98 0 10 ,590 78 ,018 6,24 5,86 8 2 ,476 ,337 0 .01
Automobile Assemblers
107 AL- GHAZI TRACT ORS 49 6 496 135 ,08 6 76, 037
108 DEWAN FAROOQ MO TOR S 5 ,41 8 5 ,418 37 ,43 8 10, 023 0 .01
109 HINO PAK MO TORS L IMI TED 9 ,15 2 9 ,152 5 ,125 ,12 0 2,5 86, 813 0. 02 0 .07
110 HONDA ATLAS CARS 38 9,15 8 389 ,158 14 ,644 ,01 6 4,8 06, 101 0. 02 0 .27
111 M ILLAT TRACT ORS 9 ,84 5 2 ,46 1 12 ,306 2 ,618 ,77 0 2,2 07, 943 0. 01 0 .05
112 PAK SUZ UKI MO TOR COM PANY 1 ,09 0 1 ,090 130 ,57 1 59, 438
41 5,15 9 2,46 1 417 ,620 2 2,69 1,00 1 9 ,746 ,354 0 .05
Cable & El ectrical Goods
113 PAK ELEKT RON 67 3,69 8 673 ,698 37 ,727 ,08 8 13,5 81, 752 0. 06 0 .71
114 PAK ELEKT RON-PREF -CONVERT IBLE 30 7,86 9 307 ,869 3 ,078 ,69 0 3,0 78, 690 0. 01
115 PAK ELEKT RON-PREF -NON- CONVERTIBL E 92 3,60 7 923 ,607 9 ,236 ,06 0 9,2 36, 070 0. 04
116 SIEMENS ENGINEERING 3 4,71 3 34 ,713 48 ,799 ,53 5 26,0 34, 750 0. 16 0 .42
1,93 9,88 7 1 ,939 ,887 9 8,84 1,37 3 51 ,931 ,262 0 .26
117 PAK.I NT.AIRLINES(A) 2 ,38 1,03 8 2 9,11 2 2, 410 ,150 11,9 05, 190 10,8 45, 675 0. 03 0 .12
2,38 1,03 8 29,11 2 2 ,410 ,150 11 ,905 ,190 10 ,845 ,675 0 .03
Transport
Technology & Communication
118 P. T.C.L. "A" 1 ,25 3,18 4 1 8,0 00 1, 271 ,184 49 ,051 ,23 0 21,2 03, 349 0. 09 0 .03
119 T EL ECARD LIM ITED 44 9,73 5 449 ,735 2 ,860 ,31 5 8 76, 983 0 .15
120 WORL D CALL T ELECOM LT D 31 0,59 1 310 ,591 4 ,509 ,78 1 8 72, 761 36 .09
121 SOUT HERN NETWOR K 30 1,26 0 301 ,260 1 ,765 ,38 4 4 03, 688 0 .60
122 CALL MATE T EL IPS 8 3 83 32 7 1582,31 4,85 3 18,0 00 2 ,332 ,853 5 8,18 7,03 6 23 ,356 ,939 0 .09
Fertilizer
123 DAWOOD H ERCUL ES 24 3,38 0 24 ,33 8 267 ,718 94 ,796 ,51 0 37,5 76, 898 0. 23 0 .24
124 ENGRO CHEMICAL 22 5,16 3 19 4,5 00 419 ,663 1 03 ,968 ,49 3 60,7 04, 253 0. 16 0 .20
125 ENGRO CHEMICAL- RIGHT 16 7,86 5 167 ,865 15,8 88, 422
126 FAUJI FERT. BIN QASIM 54 2,59 0 88 0,5 00 1, 423 ,090 42 ,269 ,08 2 24,3 63, 301 0. 07 0 .15
127 FAUJI FERT ILIZ ER COM PANY LT D 2 ,25 7,18 8 37 2,7 00 657 ,47 2 3, 287 ,360 3 45 ,141 ,96 4 2 85,7 37, 331 0. 61 0 .533,26 8,32 1 1,4 47,7 00 68 1,81 0 5 ,565 ,696 58 6,17 6,04 9 424 ,270 ,206 1 .08
Pharmaceuticals
128 ABBO TT LABORATO RIES 7 7,50 9 77 ,509 13 ,750 ,09 7 5,7 32, 566 0. 03 0 .08
129 GL AXO SM IT HKL INE PAKISTAN 8 4,25 3 84 ,253 14 ,323 ,01 0 7,6 36, 692 0. 03 0 .05
130 HIG HNOON L ABO RAT ORIES 9 8,71 7 98 ,717 5 ,571 ,58 7 3,3 81, 057 0. 01 0 .60
26 0,47 9 260 ,479 3 3,64 4,69 4 16 ,750 ,315 0 .06
Chemicals
131 BOC PAKI ST AN 6 6,66 0 66 ,660 14 ,569 ,87 6 9,1 83, 082 0. 03 0 .27
132 I.C. I. PAKISTAN 31 9,68 1 8,5 00 328 ,181 52 ,814 ,32 3 31,5 64, 449 0. 09 0 .24
133 PAKISTAN PT A L IMIT ED 3 ,51 5,47 1 3, 515 ,471 14 ,870 ,44 2 9,9 13, 628 0. 02 0 .23
134 SITARA CHEMIC AL S 1 9,58 5 19 ,585 4 ,944 ,23 3 3,3 47, 077 0. 02 0 .103,92 1,39 7 8,5 00 3 ,929 ,897 8 7,19 8,87 5 54 ,008 ,235 0 .16
Paper & Board
135 CENTU RY PAPER & BO ARD 5 2,51 8 52 ,518 2 ,625 ,90 0 8 22, 957 0. 01 0 .07
136 PACKAGES LI MIT ED 4 ,54 5 4,6 00 9 ,145 2 ,036 ,41 2 1,5 82, 908 0 .01
137 SECURIT Y PAPER LIM ITED 2 9,01 0 5 ,80 2 34 ,812 2 ,223 ,90 7 1,4 27, 292 0. 01 0 .08
8 6,07 3 4,6 00 5,80 2 96 ,475 6,88 6,21 9 3 ,833 ,157 0 .02
138 WAZI R AL I INDUST RIES 10 2 10 2 2 ,20 2 1 ,378
1 02 10 2 2,20 2 1 ,378
Vanaspat i & Allied Indust ri es
NO. OF SHARES
Nam e Sa le ClosingShar es
Carrying Cost
S.No Purcha se Bon us % age o fInv. Com.Pa id -up
M erge r /Dem erge reffects / Ad j.
Right / NewIssue
Open in gSha res
M arketValue
% age o fNe t Asset

23National Investment (unit) Trust STATEMENT OF MOVEMENT IN PORTFOLIO
STATEMENT OF MOVEMENT IN PORTFOLIO - HOLDING CATEGORISEDAS HELD FOR TRADING AS AT MARCH 31, 2009
Leather & Tanneri es
139 SERVI CE INDUSTRIES 1 ,68 1,97 5 1 ,681 ,97 5 2 49 ,773 ,28 8 1 28,0 31, 937 0. 40 13 .981,68 1,97 5 1,68 1,97 5 24 9,77 3,28 8 128 ,031 ,937 0 .40
Food & Personal Care-P roducts
140 NESTL E PAKSITAN 2,79 6 2 ,796 4 ,585 ,44 0 3,2 87, 816 0. 01 0 .01
141 UNIL EVER PAKI ST AN 58 9 589 1 ,384 ,15 0 1,11 9,1 00
142 UNIL EVER PAKI ST AN -PREFERENCE 12 3 123 289 ,05 0 2 33, 700
3,50 8 3,50 8 6,25 8,64 0 4 ,640 ,616 0 .02
Glass & Ceramics
143 GHANI GLASS LIM ITED 1 ,00 8,09 4 50 ,40 5 1, 058 ,499 1 13,7 73, 489 66,7 38, 362 0. 21 1 .201,00 8,09 4 5 0,40 5 1,05 8,49 9 113 ,773 ,489 66 ,738 ,362 0 .21
Mi scell aneous
144 PAKISTAN SERVICES LTD 21 0,75 6 210 ,756 1 13,8 08, 240 25,8 38, 686 0. 36 0 .65
145 T RI-PACK FIL MS 47 7,75 8 6,6 00 484 ,358 83 ,282 ,61 7 47,6 85, 045 0. 24 1 .61
68 8,51 4 6,6 00 69 5,114 19 7,09 0,85 7 73 ,523 ,731 0 .60
11 5,46 6,57 1 11,6 61,1 00 3,66 3,46 9 (2 50,1 44) (21 6,69 1) 13 0,49 2,17 0 5,74 4,53 6,14 3 3 ,344 ,997 ,773 10 .59To tal p ort folio cate go risedas he ld fo r tr ad ing
NOTES TO ABOVE INVESTMENT
a) Shares in unquoted companies marked as "A" have been valued at cost.b) Shares in companies which stand delisted or trading in whose shares are suspended, or are o therwise provided for. These companies are marked as "B".c) Unless otherwise stated a ll shares are fu lly paid ordinar y shares of Rs.10 each.
NO. OF SHARES
Nam e Sa le ClosingSha res
Carrying Cost S.No Purcha se Bon us
% age o fInv. Com.Pa id -up
M erge r /De merge reffects / Ad j.
Right / NewIssue
Open in gSha res
M arketValue
% age o fNe t Asset

A time to investAt NIT, with a min imum investment of Rs. 5000 you canbenefit through diversified por tfolio, cash dividends andtax advantages.

Branches
GUJRANWALAG.T.Road42 A/B, Trust Plaza,Ground FloorTel: 055-9200220Fax: 9200421UAN: 111-648-648
Gulshan-e-IqbalCivic Centre,KDA BuildingTel: 021-5448973, 021-9230524Fax: 9230139
CliftonYousuf Grand SquareShop# 6Near Three Swords,Block 8Tel: 021-5867962Fax: 5375096
Tariq Road158-M PMC Building1st Floor,Opp. Shalimar CentreTel: 021-4540165Fax: 4549236
HYDERABADThandi SarakHDA, Civic CentreTel: 022-2728899Fax: 2728734UAN: 111-648-648
SUKKURQueens RoadC 431/1A/1/2/1/3Queens Paradise BldgTel: 071-9310486Fax: 9310487UAN: 111-648-648
PUNJABLAHOREAlfalah BuildingRoom No. 211-21215-Sharah-e-Quaid-e-AzamTel: 042-6285210-11Fax: 6285212UAN: 111-648-648
GulbergRaja Centre, 1st Floor, 1A,Main Boulevard,Gulberg IITel: 042-5754440, 042-5875379Fax: 5710973
MULTANAzmat Wasti Road3- Gold Crest Plaza,Chowk Dera AddaTel: 061-4542914Fax: 4784043UAN: 111-648-648
SIALKOTKutchery Road9- Kashmir CentreTel: 052-9250480Fax: 9250479UAN: 111-648-648
SARGODHAFatima Jinnah Road1st Floor, 16-A,Trust PlazaTel: 048-9230100Fax: 9230101UAN: 111-648-648
RAWALPINDIThe Mall 13/4,Al-Amin PlazaOpp. CantonmentBoard BldgTel: 051-5701277Fax: 9270962
FEDERAL CAPITALISLAMABADBlue AreaGround Floor, Kashmir PlazaJinnah AvenueTel: 051-2828711Fax: 2825181UAN: 111-648-648
NWFPPESHAWARSoneri Masjid RoadFC Trust Building,Ground FloorTel: 091-5274848Fax: 5286987UAN: 111-648-648
ABBOTTABADMansehra Road301, Supply Bazar Adj.UBL BuildingTel: 0992-9310162Fax: 9310163UAN: 111-648-648
SINDH
KARACHISaddar270 Nacon HouseDin MuhammadWafai RoadTel: 021-9202789Fax: 9202784
FAISALABADAllama Iqbal RoadPlatinum Centre, 2nd FloorTel: 041-9201245Fax: 9201246UAN: 111-648-648
BALUCHISTANQUETTA2-13/7, M.A.Jinnah RoadTel: 081-9201743Fax: 9201723UAN: 111-648-648
AZAD KASHMIRMIRPURAllama Iqbal RoadBank SquareTel: 058610-42237 Fax: 45237

INVESTED WITH TRU ST
BLOSSOM BY BLOSSOMTHE CHANGE BEGINS
NATIONAL INVESTMENT (UNIT) TRUSTNational Bank Building, 6th Floor
I.I. Chundrigar Road, (P.O. Box 5671), Karachi111 NIT NIT (111-648-648)
www.nit.com.pk