Embed Size (px)
Citation preview

A time of revolution?British local government finance in the 2010s
Neil Amin Smith, David Phil-lips, Polly SimpsonInstitute for Fiscal Studies
David EiserFraser of Allander Institute
Living Standards, Poverty and Inequality in the UK: 2016
Neil Amin Smith, David Phillips, Polly SimpsonInstitute for Fiscal Studies
David EiserFraser of Allander Institute
Michael TrickeyWales Public Services 2025
Funded by the Local Government Finance and Devolution Consortium. A full list of funders can be found inside.

A Time of Revolution?
British Local Government Finance in the 2010s*
Neil Amin Smith, David Phillips and Polly Simpson
Institute for Fiscal Studies
David Eiser
Fraser of Allander Institute
Michael Trickey
Wales Public Services 2025
Copy-edited by Judith Payne
Institute for Fiscal Studies
7 Ridgmount Street
London WC1E 7AE
* The authors would like to thank Paul Johnson at the IFS, Caroline White at CIPFA, Niamh Sands
at PwC, and Mark Barnett, Catherine Brand and Jonathan Dallaston at DCLG for helpful advice and
comments on earlier drafts, and members of the IFS Local Government Finance and Devolution
Consortium for financial support. Any remaining errors or omissions are the responsibility of the
authors. Corresponding author: David Phillips ([email protected]).
Published by
The Institute for Fiscal Studies
7 Ridgmount Street
London WC1E 7AE
Tel: +44 (0) 20-7291 4800
Fax: +44 (0) 20-7323 4780
Email: [email protected]
Website: http://www.ifs.org.uk
© The Institute for Fiscal Studies, October 2016
ISBN 978-1-911102-24-3

Preface
The Institute for Fiscal Studies is launching a new programme of research on
local government finance and devolution, supported by a consortium of private
and public sector partners.
The main consortium supporters are:
the Economic and Social Research Council (ESRC);
PwC;
Capita; and
the Chartered Institute of Public Finance and Accountancy (CIPFA).
Additional supporters include:
the Municipal Journal;
the Society of County Treasurers; and
a range of councils from across England.
The programme will consider the impacts of recent changes to local government
funding and finance systems, provide in-depth analysis of the main issues related
to upcoming reforms, and consider the opportunities (and challenges) that would
be entailed with even greater fiscal devolution. The focus of the analysis will be
on changes to the funding system as opposed to changes in local governance and
organisational arrangements – although there are interesting issues on the
intersection of these areas that we hope to examine.
This report is the first produced as part of the programme; it summarises recent
changes to local government finance and highlights a number of key policy issues
for ongoing reforms.
Contents
Executive Summary 1
1. Introduction 5
2. Recent Changes to Local Government Finance in Great Britain 9
2.1 Local government spending and revenues 9
2.2 System reforms in England 16
2.3 System reforms in Scotland and Wales 27
3. Key Issues for the Coming Years 30
3.1 ‘100% business rates retention’ and associated issues in England 30
3.2 Different directions in Scotland and Wales? 44
4. Conclusions and Next Steps 47
Appendix A 50
References 51

1
© Institute for Fiscal Studies
Executive Summary
The local government finance system in England is undergoing genuinely
revolutionary change. A highly-centralised system of funding, with central
government grants allocated on the basis of councils’ relative spending need, is
set to be replaced by a system where councils as a group are self-funding and
individual councils bear far more spending and revenue risk. The aim of all this is
to give councils stronger financial incentives to grow local economies and
address underlying spending demand pressures. Accompanying this change will
be simplified powers for councils to cut business rates. Decentralisation will be
incomplete though – central government plans to keep a tight rein on councils’
ability to increase council tax and business rates bills. In Scotland and Wales,
little has changed so far, but the next few years could see significant reforms to
local tax bases.
This is the first report in a new multi-year IFS research programme examining
these major changes to local government finance. The programme will consider
the impacts of changes so far, provide in-depth analysis of the main issues related
to upcoming reforms, and consider the opportunities (and challenges) that would
arise from greater fiscal devolution. This report provides an initial look at the
changes in councils’ spending, funding and funding systems since 2010, and
highlights some of the key issues for the planned shift to 100% retention of
business rates revenues by councils in England.
Council revenue and spending cuts
Measured on a consistent basis, and excluding grants specifically for
education, councils in England have seen an average real-terms cut of almost
26% to their funding since 2009–10. Revenue from grants and redistributed
business rates has fallen by 38%, while revenue from council tax has fallen by
8%. Falls in council tax revenues reflect both the council tax freeze, and the
abolition of council tax benefit and transfer of responsibility for providing
support to low-income families’ council tax bills to councils’ own budgets.
After substantial net payments into reserves in recent years, on average,
councils plan on drawing down reserves in 2016–17. This means the cut to
service spending is forecast to be just over 22% over the same period. This
compares with cuts of around 15% in Scotland and 11.5% in Wales over the
same period for a similar set of responsibilities.
Councils have not cut the budgets for all services equally. For instance,
spending on planning and development, housing, and culture and related
services has been cut by more than 40%, on average, while spending on social
services has been cut by around 10%, on average, in England. Although the
scale of overall cuts differs in Scotland and Wales, the pattern of cuts across
services is similar.

A time of revolution? British local government finance in the 2010s
2
Cuts vary substantially for different councils. In England, there is a clear link
between the size of cuts and the extent to which councils rely on central
government grants for their overall funding. Those councils that are among
the tenth of councils that are most grant-reliant have had to cut their
spending on services by 33% on average, while those among the tenth that
are least grant-reliant have made cuts of 9%, on average. Councils that are
more grant-reliant tend to be in inner London and in poorer (often urban)
areas, so by and large inner London boroughs and councils serving poorer
communities have experienced the biggest cuts.
Reforms to England’s local government finance system
This pattern arose directly from the grant allocation approach used by the
Department for Communities and Local Government (DCLG). For most of the
period, the approach used did not fully account for the fact that a given cut in
grants leads to a bigger cut in overall spending power for councils that are
more reliant on grants (typically because they have relatively high spending
needs or small council tax bases). Some effort was made between 2011–12
and 2013–14 to provide some protection for such councils, but the tweaks
that were introduced were not very effective in achieving that. Indeed, they
actually increased the cuts for some grant-reliant councils. Moreover, they
left the fundamental issue – that more-grant-dependent councils were losing
a bigger proportion of their spending power – unaddressed. Overall, this was
a period during which there was a lack of clarity and consistency in the
process by which grants were allocated, and during which outcomes were
somewhat at odds with stated intentions in policy documents.
From 2016–17, the formula has changed such that cuts in grants from that
year onwards will result in much more equal cuts in overall spending power
across councils. However, other reforms over the last few years – including
the ending of the annual updating of needs assessments – have represented a
move away from needs and revenue equalisation and towards the provision
of fiscal incentives for economic or housing development.
The New Homes Bonus, for instance, provides councils with the equivalent of
an extra six years of council tax revenue for each new home built in their
area, with the aim of encouraging planning approval for housing. The way it is
designed provides councils in areas where more new properties fall into
higher council tax bands stronger fiscal incentives for homebuilding than
councils in other areas. Such areas are likely to have high prices and high
demand for homes – although with council tax bands now 25 years out of
date (being based on 1991 values), this relationship will be far from perfect.
In addition, since it is funded by top-slicing general grant funding, the policy
also transfers money from (generally poorer) grant-dependent authorities to
areas where large numbers of houses might have been built in any case.

Executive summary
3
The Business Rates Retention Scheme
Perhaps the most significant move towards providing a ‘fiscal incentive’ for
local economic development was the introduction of the Business Rates
Retention Scheme (BRRS) in 2013–14. This allows local areas to keep up to
50% of the growth in business rates revenues as a result of new
developments or refurbishments in their area. Existing ‘stocks’ of business
rates revenues are redistributed around the country using ‘tariffs’ (on areas
with high revenues) and ‘top-ups’ (to areas with low revenues). Councils can
also lose if their revenues fall, although a ‘safety net’ system prevents councils
losing very large amounts.
Our calculations suggest that, over the last four years, compared with a
scenario where councils shared in the average growth in business rates
revenues across the country, 52 councils have gained the equivalent of 5% or
more of their overall budgets from local retention of business rates; these are
mostly district councils. On the other hand, 119 councils have seen less
funding as a result, including most county councils, although no council has
lost the equivalent of more than 2% of their budget, and most much less.
Under the scheme, councils have had to hold back substantial amounts of
business rates revenues from their budgets to cover potential losses arising
from successful appeals. In setting up the scheme, DCLG assumed £1.8 billion
of such provisions would have to be made, but councils actually put aside
£3.2 billion in the first two years of the scheme. Of course, appeals would still
have impacted revenues in the absence of the BRRS, but the risk would have
been pooled nationally, whereas under the scheme 50% of the risk is borne
locally. Indeed, there are large differences in the amounts different councils
have put aside for appeals, driving a significant part of overall relative
gains/losses from the scheme. Difficulties in forecasting appeals risk and the
potential for the current system to be gamed by ‘over-provisions’ (to accrue
‘safety net’ payments) have led both local and central government to examine
ways to take appeals out of the BRRS.
The government has announced that local areas will keep 100% of the
growth in their business rates revenues by April 2020 at the latest, with a
number of pilot areas starting in April 2017. This will provide a stronger
fiscal incentive for growth but also mean larger potential revenue losses and
more scope for funding divergence between areas. A recent (closed) DCLG
consultation highlighted several important issues to be addressed.
One key choice is over the extent to which divergences in effective spending
power1 should be allowed to open up. DCLG suggests the system could be
reset – i.e. funding redistributed on the basis of need – either partially or
fully, either frequently (e.g. every five years) or infrequently (e.g. every
1 By ‘effective spending power’, we mean spending power adjusted for needs.

A time of revolution? British local government finance in the 2010s
4
twenty years). Which option to choose should be informed by: an analysis of
how quickly effective spending power might diverge; evidence on the extent
to which divergence is the result of differences in councils’ performance as
opposed to ‘chance’; and a judgement on how much divergence is politically
(or morally) acceptable.
Our analysis suggests that if the workings of the 100% scheme were based on
the current 50% scheme, there could be significant winners and losers within
10 years, even if business rates revenues grew at the same percentage rate
across the country. Who these would be would depend on whether revenue
increases were above or below inflation. There are a number of more or less
radical changes that could ‘correct’ this seemingly perverse feature of the
current system without blunting the financial incentives for growth it is
meant to provide, including changing the way the ‘tariffs’ and ‘top-ups’ are
indexed over time.
In addition to devolving business rates revenues, the government will also
devolve additional spending responsibilities to councils. Candidates for
devolution will have to be assessed against a range of criteria, including the
likely correlation of spending pressures with existing spending pressures and
with likely revenue streams – both at a national and individual council level.
Responsibilities where needs are likely to grow particularly strongly when
needs for existing services are also growing strongly, and in circumstances
when revenue growth is weak, would pose a particular budgetary risk to
councils. In particular, they may require more frequent (or fuller) resets of
the funding system, or even the re-introduction of targeted grant funding.
Decisions also need to be taken on the split of business rates revenues in
areas with two-tier local government. And more generally, arrangements for
business rates in areas with multiple (and overlapping) governance
structures need to be properly thought out.
Wider British policy context
Fewer ‘systemic’ changes have been introduced in Scotland and Wales so far.
However, potentially major reforms to local tax bases and structures are
being actively debated in these nations; and in Scotland, the idea of assigning
a proportion of the newly-devolved income tax to councils has been mooted.
This is a reminder of the broad range of possible reforms to local government
finance systems. Our programme will go beyond considering immediate
policy proposals to consider the rationale and potential effects of broader tax
and spending devolution.

5
© Institute for Fiscal Studies
1. Introduction
The broad policy context
Local government is a key part of the British state. Councils provide a range of public
services, including waste collection and disposal, libraries and leisure centres, housing,
maintenance of local roads and support for local buses, and – most significantly – social
services and large areas of education.2 They also administer billions of pounds of housing
benefits on behalf of central government. All-in-all, the Office for Budget Responsibility
(OBR) estimates that local government spending – including these benefits – will amount
to £150 billion in 2016–17, around 20% of all public spending in Great Britain (excluding
housing benefit, the total is around £125 billion).3
To fund these wide-ranging responsibilities, councils have traditionally relied upon a mix
of government grants and their own tax revenues, albeit to different extents over time and
across the country. However, for most of the second half of the 20th century and the first
decade of the 21st, the British system of local government finance was unusually
centralised. Grants from central government to local government were allocated so as to
compensate for the differential tax bases of different areas from 1948 onwards, and to
compensate for differential spending needs from 1958 onwards.4 Dependence on central
grants was further increased and local fiscal discretion reduced in 1990, when a system of
locally-varying and locally-retained non-domestic property taxes (‘business rates’) was
replaced by a national system, the revenues of which were, in effect, allocated to local
authorities according to spending need.5 Councils retained nominal control over the
headline rate of domestic property taxes – since 1993, the council tax – giving some scope
to spend more or less than the implicit centrally-determined levels, but even these powers
were subject to ‘caps’ to prevent ‘excessive’ increases in taxes.
The benefit of such a system is the equalisation and insurance it offers to councils’ funding:
top-ups to grants offset much of the budgetary impact of increases in spending need or
reductions in the size of the local tax base. This should allow, at least in principle, a
common level of services to be provided across councils, for a given level of council tax,
even if needs and tax bases vary significantly. But the flip side is that councils have few
direct financial incentives to grow their tax bases or contain their spending needs:
reductions in grants offset such efforts. Reliance on central funding might also introduce
risks of its own: a major part of councils’ funding is under central government’s direct
2 In Scotland and Wales, councils are responsible for funding nearly all state schools. In England, the
academies and free schools programmes mean a growing number of schools (and associated funding) have been moving out of councils’ control.
3 Authors’ calculations using supplementary tables 2.17, 2.29 and 2.30 in Office for Budget Responsibility
(2016), and Department for Work and Pensions (DWP) medium-term benefit expenditure forecasts.
4 Hendry, 1998.
5 Formally, revenues were allocated on a per-capita basis. However, the allocation of other centrally-provided
grant funding was adjusted so that the sum of redistributed business rates revenues and general grant funding compensated councils for differences in their needs and their own revenue resource base from council tax.

A time of revolution? British local government finance in the 2010s
6
control. There may also be drawbacks in terms of accountability and efficiency: some
international evidence suggests grant funding is less effectively spent than locally-raised
revenues.6
Perhaps reflecting such concerns, since around 2010, the trend towards centralisation has
reversed in England. In particular, there has been a significant move away from resource
and needs equalisation towards providing financial incentives via the funding system.
Examples include the localisation of council tax benefit, the New Homes Bonus (where
councils receive part of their funding based on their approval for new housing), the
Business Rates Retention Scheme (where councils keep up to 50% of the business rates
raised from new developments),7 and the ending of the annual updating of needs and
resource equalisation.
Councils also gained more powers to cut business rates (through offering ‘reliefs’) under
the 2011 Localism Act, although in some respects they have seen their powers over
council tax increasingly constrained, with the introduction of council tax referendums and
the tying of an element of grant funding to delivering freezes in council tax.
Overall, though, these changes mean councils now have greater financial incentives to help
increase local tax bases and reduce local spending needs, but also bear additional revenue
and spending risk, with the concomitant potential for divergence in spending power and
service quality. Combined with significant cuts to grants from central government as part
of its ongoing efforts to cut its budget deficit, these changes have also led to a significant
shift in the balance of funding from central grants back towards local taxes.
Major reforms are set to continue with plans for local areas to keep 100% of the business
rates raised from new developments by 2020. This move, which will be accompanied by
the abolition of the general grant funding, and the devolution of additional spending
responsibilities to councils, will move the system even further away from the needs
equalisation paradigm that was previously central to England’s system of local
government funding.
Running parallel to these funding system changes will be continuing reforms to local
systems of governance. So-called City Deals and the growing role of Local Enterprise
Partnerships are leading to a more bespoke (or ad-hoc) approach to determining the
balance of competencies between local and central government in different parts of the
country, and an increased emphasis on cross-council working. A new drive towards
elected mayors and combined authorities may mean fundamental changes in the
organisation of local government in some parts of England.
6 For recent empirical evidence, see Boetti, Piacenza and Turati (2012).
7 The local government sector as a whole keeps 50% of business rates revenues, but a redistributory system
of ‘tariffs’ and ‘top-ups’ redistributes the stock of business rates revenues from areas with high revenues / low spending needs to areas with low revenues / high spending needs. As a result, individual councils retain up to 50% of the growth in revenues due to new developments, not 50% of all the revenues raised in their areas. A similar set-up will exist under the 100% retention scheme. Further information is available in Sections 2.2 and 3.1 of this report.

Introduction
7
Such radical changes to funding and governance are not currently being implemented in
Scotland or Wales. But reforms to council tax and business rates, and the devolution of
additional tax powers and revenues to councils, are being discussed in both nations. And
experience has suggested that policy changes in one area of the UK, if seen as ‘successful’,
can quickly spread to other parts of the country (for instance, the UK government quickly
followed Scotland’s lead in reforming the structure of stamp duty land tax).
Taken together, this long list of reforms means that the system of local government
finance in Great Britain will look very different in 2020 from what it did in 2010. Indeed,
they are arguably the biggest set of changes since the immediate post-Second-World-War
years when the system of resource and needs equalisation was set up.
A new IFS programme of research
This report is the first in a series of papers and analyses that will be published as part of a
major new research programme at the Institute for Fiscal Studies (IFS) on this changing
system of local government finance. The programme is being supported by a range of
stakeholders in the sector, and will consider the impacts of changes so far, provide in-
depth analysis of the main issues related to upcoming reforms, and consider the
opportunities (and challenges) that would be entailed with even greater devolution. The
focus of the analysis will be on changes to the funding system as opposed to changes in
local governance and organisational arrangements – although there are interesting issues
on the intersection of these areas that we hope to examine. These include how tax powers
may be allocated to different tiers of local government in areas with multiple tiers of
governance, and how revenue and spending risks may correlate across neighbouring
councils which may wish to collaborate more or even merge to pool risks. The reforms
also potentially offer an opportunity to answer questions of interest to policymakers and
academics the world over: to what extent do changes in financial incentives affect the
decisions of local government, and to what extent do changes in local tax and spending
systems affect wider social and economic outcomes?
The report is designed to provide an initial examination of some of the key changes that
have happened already and some of the issues for the years ahead. The research
programme will build on this over the next couple of years, with an aim of feeding into the
policymaking process at both a central and local government level.
The rest of the report proceeds as follows. In Chapter 2, we look at how councils’ revenue
and spending have changed in England, Scotland and Wales, with a focus on how different
services and different parts of these countries have fared. We then look at some of the
changes to the system of local government finance in each of these countries, including
changes to the way grants are allocated, and policies such as the New Homes Bonus and
the Business Rates Retention Scheme. The picture that emerges from this is of much
greater change in England than in the rest of Great Britain.
In Chapter 3, we discuss the key reforms planned or being discussed for the next few
years. Again, plans are more radical (and more concrete) in England. We focus on issues
related to plans to move towards 100% business rates retention, including the extent to
which equalisation and insurance should play a role, the operation of the scheme in areas

A time of revolution? British local government finance in the 2010s
8
with multi-tier local government, and the devolution of additional responsibilities
(required because the business rates revenues to be devolved are larger than the general
grant funding they will replace).
Finally, in Chapter 4, we set out what seem to be the key issues that need further analysis.
These are among the issues that IFS’s new programme of research will seek to examine.
9
© Institute for Fiscal Studies
2. Recent Changes to Local Government
Finance in Great Britain
For most of the last 26 years, councils in Great Britain received their funding from three
main sources, albeit in varying proportions over space and time: domestic property tax
revenues (since 1993, in the form of council tax); general grants from central government
(including redistributed business rates revenues); and specific and ring-fenced grants.
Notionally, at least, general grant funding was traditionally allocated in such a way as to
compensate for differences in councils’ property tax bases and differences in their
spending needs. Specific and ring-fenced grants, on the other hand, were (and remain)
targeted on the basis of particular central government objectives. Though the system of
grant allocation differs across the different nations, these broad principles were common
to England, Scotland and Wales.8
In this chapter, we first discuss (in Section 2.1) changes to the scale of these different
revenue streams – and the amounts spent on the various services these revenues fund – in
England, Scotland and Wales since 2009–10, the year in which local government spending
peaked. We then examine (in Section 2.2) the major reforms to the local government
finance system that have taken place in England, including changes to the way grants are
allocated and the introduction of the Business Rates Retention Scheme (BRRS) and the
New Homes Bonus (NHB). We look at the effects of such policies across councils and
discuss the rationale for the particular design of the measures. The chapter ends with a
discussion (in Section 2.3) of the more modest changes that have taken effect in Scotland
and Wales.
2.1 Local government spending and revenues
England
Councils’ budgets peaked in 2009–10, the last year before the current ‘fiscal tightening’
began. In that year, councils in England collectively had funding for revenue expenditure
(excluding ring-fenced grants for education9) of £59 billion in today’s prices (revenue
expenditure includes spending on the day-to-day management and operation of services
and debt servicing costs, but excludes investment expenditure).10 Figure 2.1 shows the
8 The system of local government in Northern Ireland is very different from that in Great Britain. Major
services that have traditionally been the purview of councils in Great Britain, such as education, libraries and social care, are instead handled by regional or national bodies in Northern Ireland. A much greater share of councils’ funding in Northern Ireland is raised from locally-retained domestic and business rates than in Great Britain. As has traditionally been the case in Great Britain, though, general grants in Northern Ireland are allocated in such a way as to compensate for differences in tax bases and spending needs. See https://www.communities-ni.gov.uk/articles/funding.
9 We exclude grants for education and spending on education in this analysis because, since 2009–10, there
have been major shifts in funding for schools out of councils’ budgets as part of the academies and free schools programmes.
10 This figure and subsequent analysis exclude revenues for police, fire and national park authorities (and
grants for these purposes accruing to other authorities such as counties). They also exclude interest and
A time of revolution? British local government finance in the 2010s
10
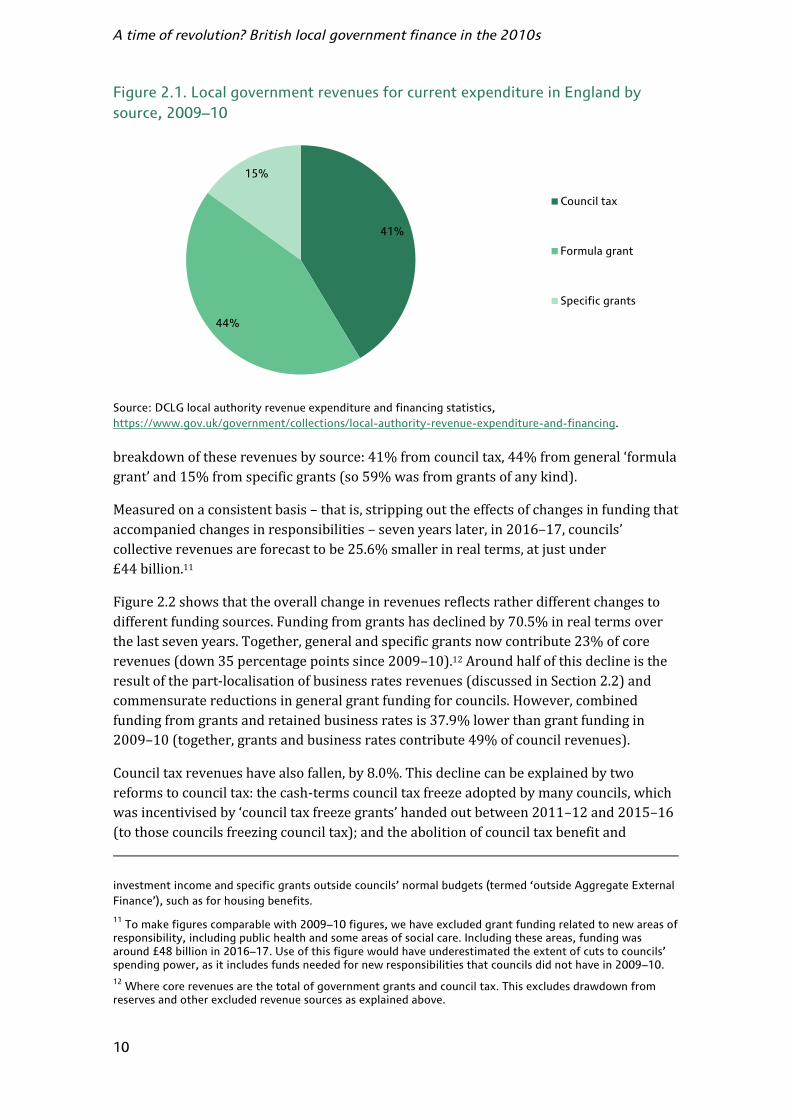
Figure 2.1. Local government revenues for current expenditure in England by
source, 2009–10
Source: DCLG local authority revenue expenditure and financing statistics,
https://www.gov.uk/government/collections/local-authority-revenue-expenditure-and-financing.
breakdown of these revenues by source: 41% from council tax, 44% from general ‘formula
grant’ and 15% from specific grants (so 59% was from grants of any kind).
Measured on a consistent basis – that is, stripping out the effects of changes in funding that
accompanied changes in responsibilities – seven years later, in 2016–17, councils’
collective revenues are forecast to be 25.6% smaller in real terms, at just under
£44 billion.11
Figure 2.2 shows that the overall change in revenues reflects rather different changes to
different funding sources. Funding from grants has declined by 70.5% in real terms over
the last seven years. Together, general and specific grants now contribute 23% of core
revenues (down 35 percentage points since 2009–10).12 Around half of this decline is the
result of the part-localisation of business rates revenues (discussed in Section 2.2) and
commensurate reductions in general grant funding for councils. However, combined
funding from grants and retained business rates is 37.9% lower than grant funding in
2009–10 (together, grants and business rates contribute 49% of council revenues).
Council tax revenues have also fallen, by 8.0%. This decline can be explained by two
reforms to council tax: the cash-terms council tax freeze adopted by many councils, which
was incentivised by ‘council tax freeze grants’ handed out between 2011–12 and 2015–16
(to those councils freezing council tax); and the abolition of council tax benefit and
investment income and specific grants outside councils’ normal budgets (termed ‘outside Aggregate External
Finance’), such as for housing benefits.
11 To make figures comparable with 2009–10 figures, we have excluded grant funding related to new areas of
responsibility, including public health and some areas of social care. Including these areas, funding was around £48 billion in 2016–17. Use of this figure would have underestimated the extent of cuts to councils’ spending power, as it includes funds needed for new responsibilities that councils did not have in 2009–10.
12 Where core revenues are the total of government grants and council tax. This excludes drawdown from
reserves and other excluded revenue sources as explained above.
41%
44%
15%
Council tax
Formula grant
Specific grants

Recent changes to local government finance in Great Britain
11
Figure 2.2. Councils’ core revenues (excluding education grants) and use of
reserves in England, 2009–10 and 2016–17 (£ million, 2016–17 prices)
Note: Figures exclude funding for police, fire and national park authorities and grants for these purposes
accruing to councils. Also, for 2016–17, figures exclude grants for public health and some areas of social
services transferred from the Department of Health during this period.
Source: Authors’ calculations using DCLG local authority revenue expenditure and financing statistics,
https://www.gov.uk/government/collections/local-authority-revenue-expenditure-and-financing.
transfer of responsibility for managing and funding support for low-income families’
council tax bills to councils’ own budgets. The latter reform is not just an accounting
adjustment. Whereas previously if councils raised council tax rates, the council tax benefit
paid to councils on behalf of recipients of the benefit would automatically rise (so that, in
effect, council tax benefit was just like council tax from the perspective of the council), the
money councils get to provide their own support schemes is fixed (and falling as part of
cuts to general grants).13
In addition to revenue from grants and council tax, councils can also draw down or pay
into their reserves. Councils in England forecast drawing down £1.7 billion from their
reserves in 2016–17, compared with only £360 million in 2009–10. Taking drawdowns of
reserves into account, councils’ spending power is forecast to have declined by 23.1% over
the last seven years. Drawing down reserves cannot be a sustainable source of revenues in
the long term. But it is worth noting that planned drawdowns in 2016–17 follow large
payments into reserves between 2010–11 and 2014–15.
Cuts to service spending
Councils provide a wide range of local services including highways and transport, social
services, housing services and waste collection. Total service spending by councils in
13 However, it is worth noting that if the £3.4 billion of council tax support provided by councils in 2016–17
were classified as extra ‘council tax’, council tax revenues would have increased 5.9% since 2009–10. This is because of growth in the council tax base, the fact that from 2013–14 onwards growing numbers of councils did not freeze rates, and the ending of the freeze more generally in 2016–17. However, counting support for council tax in this way, rather than as grant funding, would mean grants revenue would have been estimated to have declined by even more than estimated here.
0
10,000
20,000
30,000
40,000
50,000
60,000
70,000
2009–10 2016–17
Drawdown of reserves Council tax Retained business rates Grants
A time of revolution? British local government finance in the 2010s
12
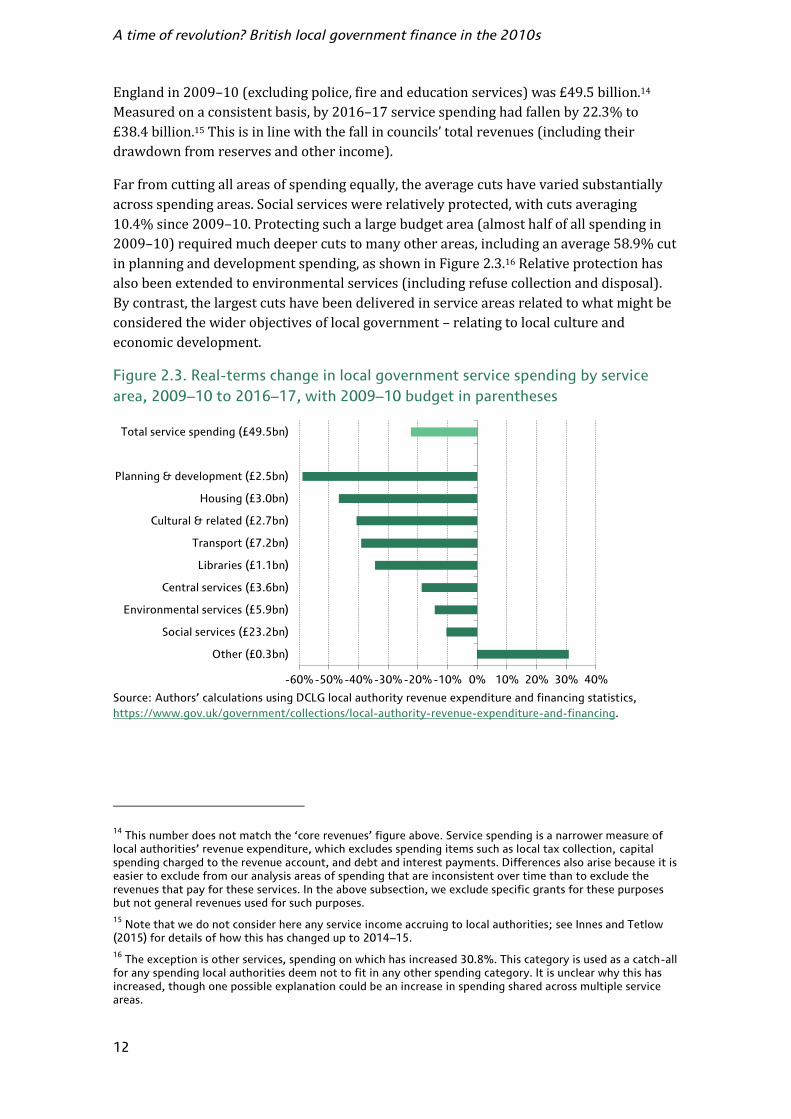
England in 2009–10 (excluding police, fire and education services) was £49.5 billion.14
Measured on a consistent basis, by 2016–17 service spending had fallen by 22.3% to
£38.4 billion.15 This is in line with the fall in councils’ total revenues (including their
drawdown from reserves and other income).
Far from cutting all areas of spending equally, the average cuts have varied substantially
across spending areas. Social services were relatively protected, with cuts averaging
10.4% since 2009–10. Protecting such a large budget area (almost half of all spending in
2009–10) required much deeper cuts to many other areas, including an average 58.9% cut
in planning and development spending, as shown in Figure 2.3.16 Relative protection has
also been extended to environmental services (including refuse collection and disposal).
By contrast, the largest cuts have been delivered in service areas related to what might be
considered the wider objectives of local government – relating to local culture and
economic development.
Figure 2.3. Real-terms change in local government service spending by service
area, 2009–10 to 2016–17, with 2009–10 budget in parentheses
Source: Authors’ calculations using DCLG local authority revenue expenditure and financing statistics,
https://www.gov.uk/government/collections/local-authority-revenue-expenditure-and-financing.
14 This number does not match the ‘core revenues’ figure above. Service spending is a narrower measure of
local authorities’ revenue expenditure, which excludes spending items such as local tax collection, capital spending charged to the revenue account, and debt and interest payments. Differences also arise because it is easier to exclude from our analysis areas of spending that are inconsistent over time than to exclude the revenues that pay for these services. In the above subsection, we exclude specific grants for these purposes but not general revenues used for such purposes.
15 Note that we do not consider here any service income accruing to local authorities; see Innes and Tetlow
(2015) for details of how this has changed up to 2014–15.
16 The exception is other services, spending on which has increased 30.8%. This category is used as a catch-all
for any spending local authorities deem not to fit in any other spending category. It is unclear why this has increased, though one possible explanation could be an increase in spending shared across multiple service areas.
-60% -50% -40% -30% -20% -10% 0% 10% 20% 30% 40%
Other (£0.3bn)
Social services (£23.2bn)
Environmental services (£5.9bn)
Central services (£3.6bn)
Libraries (£1.1bn)
Transport (£7.2bn)
Cultural & related (£2.7bn)
Housing (£3.0bn)
Planning & development (£2.5bn)
Total service spending (£49.5bn)

Recent changes to local government finance in Great Britain
13
Variation by council
The share of council revenues coming from government grants in 2009–10 varied
substantially across the country, from less than one-third in wealthy areas of the South
East such as Wokingham, Windsor & Maidenhead and Surrey, to over 70% in many urban
areas of the North and Midlands and in most London boroughs (with the highest levels –
approximately 85% – in Tower Hamlets, Wandsworth and Westminster).
As a result of the process by which government grants were cut (see Section 2.2), councils
in England experienced very different reductions in their overall spending power, and cuts
to service spending vary widely. For a given percentage cut to grants, the cut to an area’s
spending power will vary with the proportion of revenues coming from grants. The more
dependent an area is on grants, the larger proportional cut to their overall spending power
from a (say) 10% reduction in their grant. A uniform percentage cut to grants across all
areas is not exactly what has happened since 2009–10. However, Figure 2.4 shows that
local authorities that received the largest share of their funding from government grants in
2009–10 did experience the largest cuts to their service spending by 2016–17.
Figure 2.4. Real-terms change in local government service spending by decile of
grant dependence, 2009–10 to 2016–17
Note: Grant dependence decile groups are derived by dividing all local authorities into 10 equal-sized groups
according to the proportion of their core revenues (grants plus council tax) derived from government grants
in 2009–10. Decile group 1 contains the most grant-dependent tenth of local authorities, decile group 2 the
second-most grant-dependent, and so on up to decile group 10, which contains the tenth of authorities least
dependent on government grants in 2009–10.
Source: Authors’ calculations using DCLG local authority revenue expenditure and financing statistics,
https://www.gov.uk/government/collections/local-authority-revenue-expenditure-and-financing.
Summary
The picture that therefore emerges in England is of large cuts to grants, resulting in a
significant (over 25%, on average) reduction in overall council funding, and a shift back
towards locally-raised revenues (via council tax and the newly locally-retained proportion
of business rates). The way grants have been cut (discussed in Section 2.2) also means
reductions in spending power have been far from evenly distributed across the country.
Councils’ decisions of which service areas to prioritise also mean cuts have been much
greater for some service areas than for others.
-35%
-30%
-25%
-20%
-15%
-10%
-5%
0%
Most 2 3 4 5 6 7 8 9 Least
Pe
rce
nta
ge
ch
an
ge
in
se
rvic
e s
pe
nd
ing
Grant dependence decile group

A time of revolution? British local government finance in the 2010s
14
Scotland and Wales
Making comparisons between councils’ funding and spending in the different nations of
the UK is an inexact science because of differences in funding systems and data. However,
a series of adjustments can be made to make the figures broadly comparable,17 and the
picture that emerges in Scotland and Wales is similar in some ways to that in England but
different in others.
First, councils in Scotland and Wales have traditionally been more dependent on grants for
funding than their English counterparts: on a broadly comparable basis, the share coming
from grants in 2009–10 was 68% in Scotland and 81% in Wales (compared with 59% in
England).18 This reflects higher levels of spending per person, lower council tax bases and
lower council tax bills (shown in Table 2.1).
Unlike in England, education is funded by councils’ general revenues rather than specific
grants. Between 2009–10 and 2016–17, the overall cut to councils’ revenues (including
funding for education) in Scotland was 8.5%.19 Grants declined by 6.0%, whilst council tax
revenues fell by 18.5% in real terms (as a result of the cash-terms freeze in bills in place
since 2008–09 and the abolition of council tax benefit).20 Unlike in England, Scottish local
authorities made far greater use of their reserves in 2009–10 than in 2016–17, so,
including these, their spending power fell by 12.0%.21
In Wales, the cut to overall revenues was 9.6% (8.2% when utilisation of reserves is taken
into account). Grants have fallen by 10.7% and council tax revenues have fallen by 3.1%.
This fall in council tax revenues is in spite of substantial year-on-year real-terms increases
in council tax bills and reflects the abolition of council tax benefit and shifting of
responsibility for funding support for low-income council tax payers to councils’ own
budgets (council tax revenues from families paying their own bills have actually increased
22.5% in real terms in Wales over the last seven years).
Table 2.1. Average band D council tax rate, by year and nation (£)
England Scotland Wales
2009–10 1,414 1,149 1,086
2016–17 1,530 1,149 1,374
Source: English, Welsh and Scottish council tax statistics.
17 For instance, to compare revenue sources, we strip out all education spending in Scotland and Wales and
treat it as directly funded by a ring-fenced grant (similar to the Dedicated Schools Grant in England).
18 The unadjusted ‘raw’ grant reliance figures were 84% for Scotland and 88% for Wales.
19 If one strips out funding used to provide education services – akin to our stripping-out of grants specifically
for education in England – Scottish councils’ revenues have fallen by 10.3% since 2009–10.
20 In Scottish local government revenue statistics, the equivalent of the English council tax benefit has always
been listed as part of the grants received by councils, rather than their council tax, which in part explains the large difference between changes in English and Scottish council tax revenues.
21 If one also strips out funding used to provide education services in Scotland, the reduction in spending
power accounting for use of reserves is 15.8%.

Recent changes to local government finance in Great Britain
15
Table 2.2. Real-terms change in local government service spending by service area
in Scotland and Wales, 2009–10 to 2016–17
Service area Scotland Wales
Education –5.8% –5.6%
Cultural and related services –23.5% –36.5%
Social services –1.2% –1.0%
Transport –22.0% –21.2%
Environmental services –8.1% –19.4%
Planning and development –31.6% –52.0%
Housing –35.5% –26.2%
Central services –46.3% +9.5%
Total service spending –10.9% –8.8%
Total excluding education –14.9% –11.5%
Source: Authors’ calculations using Scottish and Welsh local government financial statistics.
What about the spending side of the budget? Councils in Scotland and Wales deliver a
similar range of services to that delivered by local government in England, including
education, social services, libraries and cultural services, housing, and planning and
economic development. As with comparisons over time in England, comparisons between
countries require education spending to be excluded. Doing this, Table 2.2 shows that
Scottish councils have made smaller but still substantial cuts to service spending since
2009–10: 14.9%, compared with 22.3% in England. In Wales, cuts to service spending
have averaged ‘only’ 11.5%, around half that in England.
Although cuts are smaller than in England, Table 2.2 shows that their allocation across
service areas has been broadly similar, with social services in particular being relatively
protected and areas such as culture, housing, and planning and development being cut
more heavily.
As in England, the changes to service spending faced by residents of different councils in
Scotland have varied significantly, from a cut of 29.0% in Glasgow City to a small real-
terms increase of 1.6% in East Renfrewshire. In Wales, the cuts range from 2.9% in
Pembrokeshire to 15.6% in Blaenau Gwent.22 However, compared with England, the link
between grant dependence and the size of cuts to overall spending faced is relatively weak
in Scotland and virtually non-existent in Wales.
Summary
An analysis of councils’ revenue and spending figures in Scotland and Wales, and
comparisons with England, lead to three main conclusions:
Cuts have been smaller on average in Scotland and, particularly, in Wales, than in
England. This reflects smaller cuts to grants and, in Wales’s case, significantly larger
increases in council tax bills.
22 Full figures are available from the authors on request.

A time of revolution? British local government finance in the 2010s
16
Cuts vary significantly across councils in Scotland and Wales, but this variation is less
strongly linked to councils’ reliance on grant funding than is the case in England.
The pattern of cuts across services is similar in Scotland and Wales to that in England,
with social services in particular being protected and areas such as culture, transport,
housing, and planning and development facing large cuts.
Much of the difference in the scale of cuts faced by councils reflects decisions taken by the
Scottish and Welsh governments in the early 2010s to offer health budgets less protection
from cuts than in England, in order to avoid making such steep cuts to other budgets
(including grants to councils).23 Over the next few years, though, the Scottish and Welsh
governments have prioritised health budgets more, making larger cuts to other areas
including local government.
On the other hand, in England, cuts to councils’ overall budgets will be slower over the
next few years than in the last seven, partly as a result of the end of the council tax freeze
and partly because previous cuts to grants mean grants now provide a much smaller share
of councils’ overall budgets, meaning further cuts to them have less impact.24
These trends mean that, in the coming years, the scale of cuts to councils is unlikely to
differ so much across Great Britain as it did over the last seven years.
2.2 System reforms in England
In addition to large cuts in revenues and spending, the period since 2010 has seen major
changes to the system of local government finance in England. In this section, we discuss
these changes. We assess their rationale and, for one key change, we examine the impact
across councils. We find that while changes to the grant allocation mechanism in 2016–17
correct earlier problems which meant it ‘penalised’ councils that are highly dependent on
grants, in other ways the reforms represent a move away from needs and resource
equalisation towards providing financial incentives for housing and economic
development via the funding system. But in addition to changing financial incentives at the
margin, policies such as the Business Rates Retention Scheme and especially the New
Homes Bonus have also redistributed significant amounts of existing funding between
councils. Alternative (albeit more complex) versions of the schemes would have been able
to generate the same financial incentives, at least in principle, without the same
redistribution of spending power across councils.
General grant funding
The Four Block Model
As already discussed, for decades central government general grant funding for councils
was notionally allocated on the basis of some assessment of relative need and the size of
23 See Deaner and Phillips (2013).
24 See Innes and Phillips (2015).

Recent changes to local government finance in Great Britain
17
the local tax base. (On top of this general formula grant, some grants for specific spending
areas or policy objectives have also been provided to councils.)
However, the system for allocating the general formula grants to councils had been
reformed multiple times since the approach was first adopted in the 1950s. The most
recent incarnation was the so-called ‘Four Block Model’, introduced in 2006–07 and in
operation until 2014–15.25
Unlike earlier grant allocation models which were set up to, in principle, fully equalise
with respect to estimated spending needs and councils’ ability to raise revenues from their
own tax bases,26 the Four Block Model gave Ministers the option to explicitly (though not
very transparently) choose how equalising the system should be. Under this model, part of
available funding was allocated according to relative need as in previous systems (block 1,
or the ‘relative needs block’). The remainder was allocated at a flat rate per capita (block 2,
or the ‘central allocation block’). Next, some funding was ‘clawed back’ to reflect relative
ability to raise tax revenues locally, based on the relative size of the local council tax base
(block 3, or the ‘relative resources block’). Finally, there was the option of setting a
minimum guaranteed ‘floor’ to grant increases (or, when grants are being cut, a maximum
‘cap’ on the size of cuts), paid for by scaling back grant increases to councils above the
floor (or, when grants are being cut, scaling up the cuts to those councils below the cap).
This was block 4, or the ‘damping block’. It was by changing the weights given to the first
and third blocks, and changing the amount of ‘damping’ under the fourth block, that the
degree of equalisation could be changed.
It would be intuitive to expect that once the weights had been set to deliver the desired
degree of equalisation, they could be held fixed. However, this is not the case. If the
weights given to the first and third blocks are not updated to take account of the changing
fraction of budgets that comes from grants and councils’ own tax revenues, the model no
longer delivers the degree of equalisation it was initially set up to deliver. In particular, it
no longer takes appropriate account of councils’ differential ability to raise their own
revenues from council tax.
Cutting grants using the Four Block Model: 2010–11 to 2012–13
Under the coalition government, the grants allocated by the Department for Communities
and Local Government (DCLG) to councils began to be cut in real terms in the context of
wider cuts to public spending. As this happened, the proportion of funding that councils
obtained from their own council tax began increasing. In order to continue equalising
appropriately according to relative needs and resources, DCLG would have had to increase
the weight on the ‘relative resources block’ (block 3); but it did not do this. As a result, the
model progressively took less account of the ability of councils to raise revenues
25 For a thorough description and critique of the Four Block Model, see Gibson and Asthana (2011). In
particular, these authors describe in detail the complex way in which equalisation breaks down when the
proportion of budgets funded by grants and council tax changes, and the weights to the ‘relative need’ and
‘relative resources’ blocks are not updated. The explanation set out below is a simplified version.
26 The phrase ‘in principle’ is important because, since 2002–03, damping arrangements involved floors and
caps on individual councils’ gains and losses from updates to needs and tax base assessments. These damping mechanisms meant that, in practice, changes to grants may no longer fully reflect assessed changes in needs and tax bases.

A time of revolution? British local government finance in the 2010s
18
themselves. This is one of the factors that led to the much larger cuts to spending power
(and service spending) for more grant-dependent councils, outlined in Section 2.1.
Another contributing factor was the use of the ‘damping block’. In 2010–11, councils were
guaranteed a minimum cash-terms increase in grant funding of 0.5% if they were a district
council or 1.5% otherwise (which implied maximum real-terms cuts of 1.3% and 0.3%,
respectively). No account was taken of the grant dependence of a council though, meaning
that two councils getting these minimum increases in grants could face quite different
changes in their overall spending power. Moreover, without application of the ‘damping
block’, many of the more affluent councils that were not that reliant on grant-funding
(including areas such as Surrey, Wokingham, and Windsor and Maidenhead) would have
seen substantial cuts in their grants. Satisfying their minimum cash-terms increases
required substantial sums of money, found by scaling back the grants to other councils,
including many councils that were grant-reliant.27
The issues became more important from 2011–12, when much larger real-terms cuts to
grants began. From that year onwards, ‘banded caps’ to the cuts in grants were used,
whereby the maximum cut to a council’s grant varied with its level of grant dependence
(councils were grouped into one of four ‘bands’). For example, in 2011–12, the maximum
cut to the grant to unitary authorities, metropolitan districts, London boroughs and shire
counties ranged from 11.3% for the most grant-dependent councils to 14.3% for the least.
At the time, the government suggested that these banded caps meant that it was providing
particularly grant-dependent councils with relative protection from grant cuts.28 However,
this was not the case.
Grant dependence varies much more across councils than the factor of 1.26 by which
the banded floors varied in that year. Thus the cash-terms cuts to grants – and to
overall spending power – could still be much greater for more grant-reliant councils
than for less grant-reliant councils.
The impact of the caps was to transfer as much additional funding to the quarter of
councils that were least dependent on grants as was transferred to the quarter that
were most dependent on grants.29 This is because, despite the failure of the rest of the
Four Block Model to properly equalise, the ‘pre-damped’ cuts to the least grant-reliant
councils were often substantially above the 14.3% cap, and substantial sums were
required to bring them down to the cap. Indeed, many of the most grant-dependent
councils ended up contributing to the cost of these caps (as their grants were being cut
by less than their cap).
Use of banded caps left unaffected the underlying cause of the larger cuts to councils
more reliant on grant – use of outdated weights in the Four Block Model that meant
27 Gibson and Asthana, 2011.
28 The then Under Secretary of State, Bob Neill, said: ‘The Coalition Government has taken unprecedented
steps to protect councils most reliant on central government funding’. See http://webarchive.nationalarchives.gov.uk/20120919132719/http://www.local.communities.gov.uk/finance/1112/setwms.pdf.
29 See CIPFA (2014).

Recent changes to local government finance in Great Britain
19
that it did a progressively poorer job of equalising with respect to differences in local
council tax bases.
The end of the Four Block Model: 2013–14 to 2016–17
2013–14 saw the introduction of the new Business Rates Retention Scheme – discussed in
more detail below – which removed almost £11 billion of funding from the system of
general grant funding. 2014–15 saw the ending of the annual updating of needs and
resources indicators to ensure that, in addition to incentives to grow their business rates
bases, councils had incentives to grow council tax bases, and constrain spending needs,
without offsetting adjustment to their grants.
There have also been a number of other major changes to how grants are allocated over
the last three years:
2013–14 was the final year the Four Block Model was used to allocate grant funding. In
that year, DCLG finally updated the weight applied to the ‘relative resources’ block, and
a further adjustment was made in an attempt to ‘correct’ for the earlier larger cuts in
spending power in more grant-dependent areas.30 However, the ‘damping’ of the large
cuts to grants in the least grant-dependent areas that this would have entailed (paid
for by bigger cuts in other areas) undid much of that effort.31
In 2014–15 and 2015–16, no effort was made to account for differences in councils’
relative needs and tax bases. Instead, all councils of a given type (for instance, a district
or a county) faced the same percentage cut in grant. This implied much larger
reductions in overall spending power for councils highly reliant on grants than for
those that relied more on their own council tax revenues.
These problems were finally addressed in the Local Government Finance Settlement
for 2016–17 (which set out figures out to 2019–20).32 This allocated grant funding in
such a way as to ensure councils of the same type see the same percentage change in
their ‘core spending power’ (consisting of council tax income, retained business rates
income, and revenue support grant) as each other.
Summary
While there has been a general move away from needs and resource equalisation by the
ending of annual updating of relative needs assessments and the introduction of business
rates retention, changes to how grants are allocated in 2016–17 mean cuts are now being
allocated in a way that better reflects existing levels of needs and own resources (although
the previous unequal distribution of cuts is not being undone).33
30 See DCLG (2013).
31 See CIPFA (2014).
32 See DCLG (2015a).
33 Innes and Phillips (2015) show how this change means there is much less of a link between grant
dependence and cuts in spending power between 2015–16 and 2019–20 than in the period between 2009–10 and 2015–16.

A time of revolution? British local government finance in the 2010s
20
However, the journey to this point has been a long and winding one. The Four Block Model
itself was always complex and somewhat incoherent, but failure to update key elements of
it meant it was increasingly less able to equalise the funding available to different councils.
Tweaks were made, including ‘banded caps’ to cuts, but these left the underlying issues
unaddressed. Indeed, capping of grant cuts saw as much money flow to the least grant-
dependent quarter of councils as to the most grant-dependent quarter.
Policy has also been unstable: 2013–14 saw efforts to restore the degree of equalisation,
although much of this was undone by capping of cuts; the following two years (2014–15
and 2015–16) saw no attempt at equalising cuts in spending power at all; while, finally, a
simple and transparent approach to equalising cuts to spending power was introduced in
2016–17.
The overall impression is of rather confused, inconsistent and opaque policymaking. The
outcomes (larger cuts in spending power for more grant-dependent councils) contrasted
with the rhetoric (of protecting poorer, grant-dependent councils). And different parts of
the system worked against each other (such as the re-prioritisation of equalisation and the
caps to cuts in 2013–14).
Specific grants
In addition to their general formula grant, councils also receive substantial sums in a range
of specific, and sometimes ring-fenced, grants. In recent years, new grants have been
introduced to reflect the devolution of responsibilities to councils and changing central
government policy priorities, while many specific grants have been ‘rolled into’ the
general formula grant (reducing their number greatly).
Two major new specific grants have been introduced in recent years. First, the Education
Services Grant was split out from the general formula grant in 2013–14 (it was worth
£1.0 billion in that year and £0.5 billion in 2016–17). This grant is to provide funding to
councils for the support services they deliver to schools in their area, although it is not
ring-fenced for such purposes. The Public Health Grant was also created in 2013–14 as a
result of the transfer of public health responsibilities from the Department of Health (this
grant was worth £3.4 billion in 2016–17). This funding is ring-fenced.
On the other hand, a swathe of specific grants have been rolled into the general formula
grant in recent years, including council tax support grants, council tax freeze grants, and
the Learning Disability and Health Reform Grant (itself only created in 2011–12 when
responsibilities in this area were transferred over from the Department of Health).
One consequence of rolling these specific grants into the general formula grant is that their
allocations will no longer be reassessed each year on the basis of the specific needs
measures formerly used; instead, they will simply rise or fall in line with each council’s
overall funding, regardless of changes in need. One area that future research could
examine is the extent to which the labelling of ‘specific grants’ matters for the funds
councils allocate to the relevant service areas.

Recent changes to local government finance in Great Britain
21
Partial retention of business rates
In an effort to create a ‘fiscal incentive’ for councils to promote business development, the
Local Government Finance Act (2012) set up a system whereby, since 2013–14, local areas
are able to retain between a quarter and a half of growth in the business rates revenue
that result from new developments or refurbishments.34 The precise technical details of
this Business Rates Retention Scheme (BRRS) are complex but worth delving into.
Councils do not keep half (or even a quarter) of all business rates raised in their areas.
Instead, a system of tariffs and top-ups redistributes the existing stock of business rates
revenues from areas with (at the time the scheme was introduced) relatively high business
rates incomes compared with their spending needs, to areas with relatively low business
rates incomes compared with their spending needs. These tariffs and top-ups were set at
the start of the scheme to ensure that no council would gain or lose from the BRRS in its
first year of operation, 2013–14, except to the extent that their business rates growth was
faster or slower than the forecast national average growth rate.35 (The amount of business
rates income, after accounting for tariffs and top-ups, that councils were deemed to need
to ensure they did not gain or lose was termed their ‘baseline funding level’.) Since then,
the tariffs and top-ups have been increased in line with the business rates multiplier each
year. They will be partially reset in 2017 to ‘strip out’ the effects of the business rates
revaluation on the revenues retained by councils, and the plan was for a full reset
accounting for changes in local spending needs and local tax bases in 2020 and then every
decade thereafter. These full resets were to prevent divergences in funding as a result of
differences in business rates growth (and differences in changes in spending need) from
growing indefinitely.
The exact percentage of growth retained by each council depends on two factors:
1. What type of council it is. Metropolitan and unitary authorities retain up to 49% of the
growth (with 1% being retained by the fire authorities covering their areas). In areas
with two-tier local government, districts retain up to 40% of the growth, and counties
up to 10% (although some counties retain up to 9% if there are separate fire
authorities). And in London, boroughs retain up to 30% and the Greater London
Authority (GLA) up to 20%. These allocations to different types of councils are meant
to reflect the degree of influence they have over local economic development (which is
largely, but not exclusively, a responsibility of lower-tier councils).
2. The ratio of a council’s ‘business rates baseline’ and its baseline funding level.36 If its
business rates baseline was below its baseline funding level, then it keeps the share
34 DCLG, 2012a.
35 More precisely, the tariffs and top-ups were set so that in 2013–14, after accounting for them, if each
council’s business rates revenues grew in line with the national average rate of growth, each council would receive the same share of the overall national amount of locally-retained business rates as they had received of the 2012–13 general formula grant that retained rates income was replacing.
36 The business rates baseline is a notional measure of a council’s business rates revenues in year one of the
scheme (2013–14) given its share of business rates (e.g. 40% for a district, 9% or 10% for a county, etc.) and before tariffs and top-ups are taken into account. It was calculated based on forecasts for business rates revenues for England as a whole in 2013–14 and a council’s historical average share of business rates revenues.

A time of revolution? British local government finance in the 2010s
22
Figure 2.5. Share of revenue from new developments retained locally
Source: Adam and Miller, 2014.
reported in (1) above. If the business rates baseline was above the baseline funding
level, then the council is subject to a ‘levy’ on growth, and the percentage retained is
gradually reduced, down to half the level reported in (1). The impact of these ‘levies’
on the percentage of business rates growth retained is illustrated in Figure 2.5.37
The levies were put in place to fund ‘safety net payments’. These are set such that if a local
authority’s income under the scheme falls below 92.5% of its baseline funding level
(uprated by RPI), central government will make a payment to bring its income up to that
92.5% level. The expressed aim of this feature is to ‘protect those authorities which faced
significant shocks in rates income’, i.e. ‘limiting risk’.38
The scheme has now been in operation for four years. Differences in business rates
revenue growth in different parts of the country and the technical features of the BRRS
have led to some areas seeing their relative funding levels increase and others seeing them
decrease.39 Figure 2.6 shows an estimate of the size of the ‘gains’ and ‘losses’ from the
scheme, relative to the case where the business rates revenues booked by councils were
pooled nationally and redistributed in proportion to councils’ baseline funding levels.40 It
37 DCLG, 2012b.
38 DCLG, 2012c.
39 Section 3.1 discusses how the current set-up of the scheme contributes to funding divergence even if
business rates grow at the same rate across the country.
40 In particular, we compare the income councils receive under the BRRS with what they would have received
if each council received an amount equal to its baseline funding level increased by the percentage change in national business rates revenues (after accounting for appeals provisions and other deductions). Note also that councils are able to form business rates pools with other councils and to be assessed for levy and safety net payments on the basis of total pool income. Figures on actual retained income at the level of the individual council for those in pools are not available from business rates statistics. We have used a stylised scheme to account for the intra-pool allocation based on the features of schemes commonly used (and set out in the ‘Pooling Agreements’ of the different pools). First, all councils in the pool receive what they would have received from the BRRS if outside the pool. Second, if there is a surplus, 50% of this is shared proportionate to each authority’s baseline funding level and 50% is shared proportionate to each authority’s contribution to overall business rates growth for that year. If there is a deficit, the burden of this is shared in entirety in proportion to baseline funding level.
0%
10%
20%
30%
40%
50%
60%
0.0 0.5 1.0 1.5 2.0 2.5
Ratio of local authority business rates baseline to baseline funding level

Recent changes to local government finance in Great Britain
23
Figure 2.6. Relative gains and losses as a result of the BRRS (2013–14 to 2016–
17), expressed as a percentage of councils’ overall funding
Source: Authors’ calculations using NNDR3 and NNDR1 figures for 2013–14 to 2016–17 and information on
other funding (grants and council tax) from revenue expenditure out-turns and estimates for the same years.
is important to note that figures are based on revenue out-turns for 2013–14 and 2014–15
only: figures for 2015–16 and 2016–17 are based on councils’ best estimates as of 30
January 2016, and are therefore subject to (potentially significant) revision. Given this
caveat, published figures suggest 264 councils have received higher total income than they
would have if revenues were pooled and redistributed, and 119 local authorities have
received lower income.41
On average, gains balance losses. However, the councils gaining tend to be district councils
with smaller overall budgets and, as a result, 52 councils have seen their overall income
increase by 5% or more as a result of the scheme. Losers, on the other hand, tend to be
larger councils with larger budgets – including many metropolitan boroughs, London
boroughs and counties: none has lost the equivalent of more than 2% of its overall budget.
Table 2.3 provides further detail on how gains and losses vary by council type and region
of England.
If the system had existed but without the levies on growth and the safety net payments,
there would instead have been 141 authorities that received a lower income than they
otherwise would have from the scheme. In particular, eight authorities would have lost the
equivalent of more than 5% of their income, and four more than 10% of their income. On
41 Appendix A shows two alternative estimates of relative gains/losses. Figure A.1 shows relative gains/losses
for the years 2013–14 and 2014–15 only. These estimates are based on out-turn figures for revenues only (whereas the full four-year estimates are based on forecast revenues for 2015–16 and 2016–17). Figure A.2 shows gains/losses for the full four-year period relative to an alternative counterfactual where the amount a council would have received is equal to its baseline funding level uprated by the increase in the business rates multiplier each year (rather than uprated in line with national business rates revenue growth).
-5%
0%
5%
10%
15%
20%
25%
30%
Shire Districts London Boroughs Metropolitan Boroughs
Unitary Authorities Fire Authorities County Councils

A time of revolution? British local government finance in the 2010s
24
the other hand, 91 authorities would have gained by more than 5% of their total income
under such a scheme. The system of safety nets has therefore protected councils from
Table 2.3. Relative gains and losses as a result of the BRRS (2013–14 to 2016–17),
expressed as a percentage of councils’ overall funding, by council type and region
Mean 10th percentile
Median 90th percentile
Council type
Shire Districts 3.5% 0.5% 3.2% 6.7%
County Councils –0.2% –0.3% –0.2% 0.0%
Metropolitan Boroughs –0.2% –0.9% 0.0% 0.7%
Unitary Authorities 0.2% –0.7% 0.2% 1.0%
Fire Authorities –0.3% –0.6% –0.3% 0.1%
London Boroughs (incl. GLA) –0.3% –0.6% 0.8% 5.4%
Region
East of England 0.4% N/A N/A N/A
East Midlands 0.7% N/A N/A N/A
London –0.3% N/A N/A N/A
North East –0.4% N/A N/A N/A
North West –0.1% N/A N/A N/A
South East 0.4% N/A N/A N/A
South West 0.1% N/A N/A N/A
West Midlands 0.0% N/A N/A N/A
Yorkshire & the Humber 0.4% N/A N/A N/A
Note: Distributions of gains/losses by region are not reported as they are strongly affected by the number of
different types of councils (e.g. Unitary Authorities versus Shire Districts), making comparisons across
regions potentially misleading.
Source: As for Figure 2.6.
particularly large falls in their rates income, while the levies have reduced gains for those
seeing their business rates income rise.
Other significant changes
Recent years have also seen a number of other changes to the local government funding
system, and to councils’ spending responsibilities, that affect the fiscal incentives and risks
they face. Here we discuss two of the key changes – which may be examined in greater
detail later in our research programme.
The New Homes Bonus
The New Homes Bonus was introduced in 2011 as an incentive payment to encourage
local councils to grant planning permission for new residential property. The scheme was
introduced in response to estimates that housing supply was failing to meet demand,42
with the government also arguing that the scheme would ‘redress the imbalance in the
42 Wilson, Murphy and Barton, 2016.

Recent changes to local government finance in Great Britain
25
local government finance system, whereby resources for growing areas [do] not keep pace
with growth’.43
The core of the policy is that government matches council tax revenues on new residential
property for a period of six years from construction:44 specifically, by payment of grants to
local authorities based on increases in the number dwellings recorded on council tax
valuation lists (excluding homes recorded as empty).45
Because payments are linked to council tax revenues, a new house in a higher council tax
band earns the local authority a higher payment from government.46 Councils cannot,
however, increase their payments by increasing their council tax rate, as payments are
based on the average council tax rate for that band nationwide. Flat-rate bonus payments
of £350 per year are also available for each new affordable home built.
The programme has grown from the initial £1 billion put aside to be spent over the 2011–
15 spending review period to over £4.8 billion in grants being handed out over the six
years of the scheme (2011–12 to 2016–17).47 The current financial year (2016–17) is set
to be the peak year of the programme, with an estimated £1.46 billion of grants to be
handed out. Part of the costs during the first four years of the scheme (£196 million in
2011–12 and £250 million each year from 2012–13 to 2014–15) was found by abolition of
the Housing and Planning Delivery Grants the previous government had been using to
incentivise housing development.48 The rest has been ‘top-sliced’ from the general formula
grant to councils.
These features have led to concerns about the redistributive impact of the policy: different
councils have very different proportions of new-build houses in different council tax
bands, so see very different cash payments per house built; and, as discussed above, some
councils rely much more on the ‘top-sliced’ general grants than others for their overall
spending power.49
To some extent, these features were a conscious choice when the NHB was designed. Its
aim is to encourage the approval of new housing developments, especially in the areas
where there is greatest demand for housing. House prices might be a proxy for demand,
and council tax bands are a proxy for house prices – albeit an increasingly poor one given
the failure to update council tax bands for the last 25 years. And allusions to ‘redress[ing]
the imbalance’ in funding for councils suggest it was explicitly designed to redistribute
from councils seeing relatively low rates of new home construction to those seeing high
rates, even if those differences in home construction rates had nothing to do with
43 DCLG, 2011.
44 A useful overview of the policy can be found in Wilson, Murphy and Barton (2016). For further detail on
the specifics of the policy, see the final scheme design: DCLG (2011).
45 But including previously empty homes brought back into use.
46 In two-tier areas, 80% of the payment accrues to the district council and 20% to the county council. In
London, the full payment accrues to boroughs, not the GLA.
47 DCLG, 2016a.
48 See discussion in Wilson, Murphy and Barton (2016).
49 Lyons Housing Review, 2014.

A time of revolution? British local government finance in the 2010s
26
responses to the NHB (they might be due to housing developer interest in the area, for
instance, or availability of suitable sites for building on). However, the transfer of spending
power to councils that, even in the absence of the scheme, would have seen much higher
rates of homebuilding might actually weaken the scheme’s incentive effects. Significant
sums of extra money for ‘doing nothing’ might mean such councils feel less need to
increase the supply of housing beyond what it otherwise would have been (and may even
cut back on approvals for housing).50
In December 2015, following an announcement in the Autumn Statement, the government
launched a consultation on the future of the NHB, which ran until March 2016.51 The
consultation raised the possibility of reducing the number of years for which council tax
revenues are matched for a new home from six to four, reducing payments if planning
permission for a home is granted on appeal, paying no grants to areas without a ‘local
plan’, and developing a proxy for expected housing growth in a local area in order to
reduce payments for housing that would have been built otherwise. The last change in
particular could, if properly implemented, improve the targeting of the bonus, albeit at the
cost of additional complexity.
The localisation of council tax benefit
Another reform that has changed the financial incentives and risks facing councils is the
localisation of council tax benefit. Prior to 2013–14, the UK government paid all or part of
the council tax of many poorer people via council tax benefit. Increases (or decreases) in
the amount of council tax benefit being claimed – whether because more people were
claiming or because claimants were claiming for higher council tax bills – were borne by
central government rather than councils.
In 2013–14, the coalition government abolished council tax benefit and instead provided
councils with additional grant funding to design and provide their own schemes to help
low-income households with their council tax bills. Each council received 90% of the
amount that was forecast to be spent on council tax benefit in that area in that year, had
the benefit not been abolished. However, in subsequent years, council tax support grant
has been rolled into general grant funding, and councils’ allocations do not change in
response to changes in the amount of support being claimed.
When consulting on the policy, the government listed several benefits of devolution of the
scheme to councils, including: giving local authorities influence over how the 10%
reduction in council tax support was achieved;52 reinforcing the local stake in council tax;
50 This effect is an example of what economists call an ‘income effect’. Perhaps the most well-known income
effect in economics is that which occurs when wages increase: as well as providing an incentive for additional work due to the extra earnings one would receive from an increase in working hours (the substitution effect), workers may also respond by cutting back their hours and using the higher hourly wage to fund additional leisure time (the income effect).
51 DCLG, 2015b.
52 Flexibility was, in practice, limited by a central government requirement that pensioners’ entitlement be at
least as generous as under the former council tax benefit scheme. This would mean larger than 10% cuts to non-pensioners’ entitlements if councils wanted to fund the scheme with 10% less funding overall. It also meant councils with relatively more pensioners needed to make relatively larger cuts to non-pensioners’ entitlements to generate the overall 10% savings (or make up the difference using more of their own revenues).
Recent changes to local government finance in Great Britain
27
and encouraging local authorities to tackle worklessness and improve local socio-
economic conditions.
Because councils now fund support for low-income council tax payers from their own
budgets, there are stronger incentives to reduce the ‘need’ for support. Whereas
previously any increases in the proportion of council tax being paid by households
themselves would have been offset by a one-for-one decline in council tax benefit
payments, under the new system councils get to keep the savings in council tax support
themselves. Councils may respond to these incentives with greater efforts to reduce
worklessness and improve local economies. However, as discussed in previous work by
IFS researchers,53 responses to these incentives could also be less desirable (such as
reductions in approval for social housing, or reductions in service provision for poorer
residents to reduce the attractiveness of the area to them). The policy also exposes
councils to additional spending risks associated with changes in the cost of providing such
support when local socio-economic conditions change (perhaps for reasons outside a
council’s control). The authors of the earlier research conclude that ‘the advantages of
localisation seem to be strongly outweighed by the disadvantages, particularly in the
context of the welcome introduction of Universal Credit’ (which rationalised a number of
other existing benefits into one national scheme).
2.3 System reforms in Scotland and Wales
There has been much less change to the structure of local government finance in Scotland
and Wales over the last few years than in England. Scotland saw the introduction of its
own business rates incentivisation scheme, which provides some financial incentives for
business rates growth. It has also moved towards attaching more ‘strings’ to the grants
provided to councils. In Wales, discussion focused on reducing the number of councils, but
this has eventually come to nothing. And overall, the system of resource and needs
equalisation that all parts of Great Britain started the 2010s with – and that England has
subsequently began moving away from – remains in place in Wales and Scotland: for now.
Scotland
Scotland’s system of local government finance has long differed from England’s in a
number of small but specific ways. These differences have become more fundamental in
recent years as England has moved away from a system of resource and needs
equalisation that Scotland has, by and large, kept in place so far. Indeed, while there have
been several changes to the way grants are allocated in England over the last 10 years (in
2006–07, 2013–14 and 2016–17), there have been no substantial changes to the
underlying system in Scotland since the early 2000s.
Perhaps the biggest change to grant allocation has been making a component of general
grants conditional upon satisfying particular Scottish Government policy priorities. This
began in 2008–09 with the provision of additional grant to those councils that froze
council tax bills (which could be described as a reduction in grants to those councils not
53 Adam and Browne, 2012.

A time of revolution? British local government finance in the 2010s
28
freezing tax). This policy has been continued each year since (and, unlike in England, every
council has frozen council tax each year) and has been extended to a wider range of policy
priorities. In 2016–17, for instance, to receive their full grant allocation, councils had to
agree to freeze council tax for the ninth successive year, maintain the school pupil/teacher
ratio at the same level as in 2015–16, and pay the living wage to social care workers.
Failure to deliver on any of these elements would result in a financial penalty.
The other area where there have been some changes is business rates.54 As in England,
despite the centralisation of business rates in 1990, Scotland’s councils were notionally
part-funded by business rates revenues during the 1990s and 2000s. However, in practice,
the level of funding for councils at both the national (Scottish) and individual council level
did not depend on the amount of business rates raised: changes in the general grant would
fully offset reductions or increases in business rates revenues.
The introduction of the Business Rates Incentivisation Scheme (BRIS) in April 2012
changed that. The initial BRIS allowed local authorities to retain 50% of business rates
revenue growth over and above individually set targets.
A revised scheme was introduced in 2014–15, focused on growth in the tax base (rather
than revenue per se). For the upcoming year, the Scottish Government estimates buoyancy
in the non-domestic rates tax base nationally. Individual local authorities are then
effectively allocated shares of this national buoyancy, based on historical average growth
figures at an individual local authority level. For 2016–17, for example, buoyancy targets
range from 0.7% (Dumfries & Galloway) to 1.5% (Aberdeenshire).55 Each local authority
that exceeds its individual local buoyancy target retains a 50% share of the additional
rates income generated by the above-target growth in its business rates base.
However, the system is not symmetric. If a council fails to reach its target, the Scottish
Government compensates it up to the level of the target through increased grant funding.
This clearly provides insurance to councils (both individually and collectively) against the
risk of underperformance of business rates revenues. But it does so by removing the
incentive to increase revenues marginally for those below target (because any such
increase would be offset by reductions in ‘compensation’).
Compensation for losses and the use of council-specific growth targets mean that the
impact of the system on councils’ funding has been modest to date. For instance, in 2014–
15, the latest year for which out-turn figures are available, BRIS led to seven councils
sharing an additional £2.5 million of business rates income (out of a total of £2.5 billion of
business rates revenues).56
54 Scotland’s system of business rates largely but not exactly follows England’s. Differences include an
alternative system of relief for businesses occupying small properties, the treatment of empty properties, and the Public Health Supplement, which applies to retailers with a rateable value over £300,000 who sell both alcohol and tobacco.
55 See Local Government Finance Circular 3/2016: http://www.gov.scot/Topics/Government/local-
government/17999/11203/busratesincenscheme1417.
56 See Local Government Finance Circular 3/2016: http://www.gov.scot/Topics/Government/local-
government/17999/11203/busratesincenscheme1417.

Recent changes to local government finance in Great Britain
29
Wales
Wales has seen probably the smallest changes to its system of local government finance in
recent years. Unlike in Scotland and England, there have been no moves to use grant
funding to incentivise council tax freezes (indeed, as highlighted in Section 2.1, bills have
increased year-on-year, and the average band D rate is now well above that in Scotland
but still below that in England). There have also been no moves towards the partial
localisation of business rates revenues, although a number of reports have suggested it.57
Perhaps the biggest change mooted during the last few years was plans for a reduction in
the number of councils in Wales from 22 to eight or nine. While not a change to the system
of financing local government, this was seen very much in the context of better meeting
funding challenges, by encouraging greater efficiency, especially in back-office functions.
However, these plans were never popular with councils nor opposition parties in the
Assembly, and following Labour’s loss of a majority in the 2016 Assembly elections, the
plans were cancelled. As we discuss in Section 3.2, plans in this area are now scaled back,
focusing on greater collaboration between existing councils. But in other senses, Welsh
local government may see more reforms in the coming five to ten years than it has over
the last five.
57 See Business Rates Panel (2015) and Independent Commission on Local Government Finance Wales (2016).
The former suggested an approach of ‘regionalisation’ to broader regions if there were concerns that localisation may lead to too much risk and divergence in funding at a council level.

30
© Institute for Fiscal Studies
3. Key Issues for the Coming Years
Over the next few years, councils across Great Britain are likely to face further cuts to their
spending power as part of continuing efforts to reduce the government’s budget deficit.
Given the demand pressures in areas such as social services, and the large cuts already
made to other service areas such as planning and economic development, making these
cuts will likely be a significant challenge and may require significant changes to the way
councils manage their budgets and services.
In this chapter, though, we focus on the further changes to the structure of the local
government finance system that are planned or being discussed in Great Britain. As was
the case over the last five years, the most significant confirmed changes are set to occur in
England, with the 100% BRRS leading to a further big move away from equalisation and
insurance and towards incentives (and risk) in the funding system. Such radical changes
are not yet confirmed for Scotland and Wales – but there are ongoing discussions that
could lead to significant changes in local taxation and local funding systems. What is more
certain is that by 2020, the local government funding systems of Scotland, Wales and
England will differ more from each other than they do now and particularly than they did
in 2010.
3.1 ‘100% business rates retention’ and associated issues
in England
Little more than two years after the 50% BRRS was implemented, plans to move to 100%
retention of growth at the local level by 2020 were announced at the 2015 Conservative
Party conference.58 The aim of this change is to strengthen the ‘fiscal incentive’ for
economic development inherent in the initial 50% scheme and to reduce the reliance of
the local government sector as a whole on central government for funding. Indeed, the
business rates revenues to be transferred to the local government sector are set to be
substantially larger than the general grant councils are set to be in receipt of in 2019–20.
As a result, general grant funding is to be abolished and additional spending
responsibilities transferred to councils to ‘soak up’ this additional spending power.
Assessing the rationale for 100% retention
Before considering the ‘technical details’ of business rates devolution, it is worth
considering the main rationale for the policy in the first place: that the stronger financial
incentive for local revenue growth provided will lead to a more development-friendly
policy environment and faster economic growth. Evidence on this proposition is actually
very limited. In a UK context, the most cited evidence comes from two papers that attempt
to estimate the effect of the centralisation of business rates in 1990 on the growth in non-
domestic floor space and on non-domestic property rent levels.
58 See https://www.gov.uk/government/news/chancellor-unveils-devolution-revolution. Plans had already
been announced before this for pilots of 100% retention in Cambridgeshire, Cheshire East and Greater Manchester.

Key issues for the coming years
31
Cheshire and Hilber (2008) note that the City of London was still able to set and retain a
business rates supplement after centralisation of the scheme. They then undertake a
difference-in-difference style analysis of centralisation, comparing the change in property
occupation costs (mostly made up of rent) in the City of London with that in the rest of the
country, interpreting the relative change in costs in the rest of the country as the impact of
business rates centralisation. They find a positive and significant impact on occupancy
costs and argue that this suggests that centralisation of business rates increased planning
restrictiveness. Larkin, Wilcox and Gailey (2011) compare growth rates in non-factory
floor space between 1977 and 1985 (before nationalisation) and between 2000 and 2008
(after nationalisation) and attribute the entire difference in growth rates to business rates
centralisation. Doing this yields an estimate of a 1 percentage point decline in the rate of
growth in non-factory floor space for England and Wales as a whole (and 0.6 percentage
points for the North and 1.4 percentage points for the South).
While both studies are interesting, the ways they attempt to identify the impact of
centralisation are not necessarily that robust: other factors may drive changes in the
growth in floor space over time or differences in the relative cost of space in the City of
London versus the rest of the country. Identifying the impact of a reform implemented in
(nearly) all the country at the same time is inherently difficult though. As part of our work
programme, we will therefore thoroughly review the international literature on local
public finance to see what can be learned from other countries. We will also examine
whether the recent part-localisation, which applies in England but not in Wales, can be
used in an updated difference-in-difference analysis and, if so, undertake such an analysis.
And we will re-examine the 1990 centralisation of the scheme, focusing on how the large
changes in business rates bills in different parts of the country that accompanied these
changes may have affected local rents and economic conditions.59
Insurance and equalisation in a system with full rates retention
Turning to the technical details of the scheme, the consultation published in July 2016
gives some indication as to what the key features of the new scheme may be.60 There will
continue to be some redistribution between councils, similar to the current system of
tariffs and top-ups, although the exact mechanics of how this will be done remain
undecided. There will also continue to be protection for councils against sharp reductions
in their income, such as is currently provided by the safety net payments made in the 50%
scheme, although if the threshold for this were maintained at 92.5% of authorities’
baseline funding level it would leave authorities vulnerable to significantly greater falls in
their total income than under the 50% scheme (as the new ‘baseline funding levels’ for
business rates will make up a much larger share of their overall funding).
Unlike under the 50% scheme though, it is proposed that there will be no system of ‘levies’
to pay for the safety nets. Indeed, the abolition of the ‘levies’ is required to ensure that the
system genuinely delivers 100% rates retention: the existing levies system means that in
59 This work will update an analysis of how differential changes in business rates in the period 1974–81
affected local rents and employment (Crawford, Fothergill and Monk, 1984).
60 DCLG, 2016b.

A time of revolution? British local government finance in the 2010s
32
those areas where the highest rates of levy are in place, only 25% as opposed to 50% of
the growth in rates income is retained locally (see Section 2.2). Such a system of 100%
retention will, of course, provide stronger financial incentives for business rates revenue
growth, and relatedly expose councils to additional financial risk, than the existing 50%
retention scheme.
One manifestation of this risk would be greater year-to-year volatility in revenues.
Another could be greater divergence in revenues over time. To see this, we can consider
what would have happened under a hypothetical 100% rates retention system (with
doubled business rates baselines, doubled baseline funding levels, safety nets set at 92.5%
of (doubled) baseline funding levels, and no levies) between 2013–14 and 2016–17.61 We
estimate that such a system would have led to 16 (mostly district) councils seeing their
funding increase by 20% or more (relative to a system of national pooling and sharing).
Only one council is estimated to have gained that much under the 50% retention scheme.
The larger gains reflect both the increase in the percentage retained locally to 100% and
the ending of the levies system. On the other hand, 122 councils would have seen their
funding fall (relative to a system of national pooling and sharing) and 12 authorities would
have lost more than 2% of their funding (with the largest losses equating to around 3.5%
of a council’s funding). No councils are estimated to have lost that much under the 50%
retention scheme. The larger losses reflect both the increase in the percentage of revenues
(and percentage of revenue losses) retained locally and the fact that a given safety net (e.g.
92.5% of baseline funding) provides relatively less protection to overall budgets when
business rates provide a larger share of overall budgets (as will be the case with 100%
retention).
Of course, the greater the degree of divergence in business rates growth, the greater the
degree of divergence in funding is likely to be under 100% retention. However, even if
business rates revenues grew at the same percentage rate across the country, some
councils would be relative ‘winners’ from a system of 100% retention along the lines
proposed and others would be relative ‘losers’. Some councils would also be exposed to
stronger financial incentives and greater financial risk than others. This is because of a
combination of two factors:
The business rates base is unequally distributed across the country, with 1% growth in
the base generating the equivalent of an extra £63.50 per person in Westminster but
just £2.60 in Wolverhampton, for instance.
The system of redistributive tariffs and top-ups is indexed each year in line with the
change in the business rates multiplier.62 Given that over time there tends to be
growth in the business rates tax base (due to increases in the amount of non-domestic
property in the country), business rates revenues will likely increase at a faster rate
than the multiplier and, hence, the tariffs and top-ups. The amount of redistribution
61 This is a stylised example of a 100% rates retention scheme to demonstrate the potential for greater
divergence under such a system. If a 100% scheme had actually been implemented, the choice of baseline funding levels, business rates baselines and safety net thresholds may have differed.
62 Currently, the multiplier increases in line with RPI inflation by default, but this is switching to CPI deflation
from April 2020.

Key issues for the coming years
33
being undertaken by the tariffs and top-ups will therefore fall relative to overall
business rates revenues.
Figures 3.1–3.3 show that the degree of divergence that could open up if revenues grew at
the same rate across all councils would depend on how high that growth rate was: a 0.1%
real-terms increase (Figure 3.1) would lead to substantially smaller relative gains and
losses than a 0.5% real-terms increase (Figure 3.2) or a 1.0% real-terms increase (Figure
3.3). (As with our discussion of how a 100% BRRS could have impacted between 2013–14
and 2016–17, these figures are based on a hypothetical 100% scheme where the
parameters of the 50% scheme have simply been scaled up.63 When the 100% BRRS is
actually implemented, reforms mean it is unlikely to be implemented in exactly the same
way.)
In each case, though, the councils winning are those councils with high levels and shares of
business rates revenues that pay tariffs: their tariffs would increase less quickly than their
revenues, meaning that they keep a growing share of their business rates and they
therefore gain. This group includes most district councils. On the other hand, the losers are
those councils with low business rates revenues that rely on top-ups, which see a relative
decrease in value. This group includes all county councils.
Figure 3.1. Gains and losses as a result of a hypothetical system of 100%
retention when business rates revenues grow 0.1% in real terms in all council
areas in England (expressed as a percentage of councils’ overall funding)
Source: As for Figure 2.6.
63 In particular, the scheme we model doubles the share of business rates revenue growth being retained by
each local authority (so, for instance, districts retain 80% as opposed to 40% presently and counties retain 18% or 20% as opposed to 9% or 10%), doubles each council’s baseline funding, retains a safety net at 92.5% of baseline funding, but does not have levies. This is a stylised example of a 100% retention scheme designed to illustrate the types of issues that could arise. In reality, shares provided to different tiers of local government may change; baseline funding levels are unlikely to double in all areas; and safety net thresholds could be set differently. Each of these would change the size and distribution of gains and losses across councils under a scenario with an equal rate of revenue growth across councils, but would not remove this feature completely.
-1.0%
0.0%
1.0%
2.0%
3.0%
4.0%
Shire District London Borough Metropolitan borough
Unitary Authority Fire authority County Council

A time of revolution? British local government finance in the 2010s
34
Figure 3.2. As Figure 3.1 but with 0.5% real-terms growth in all councils
Source: As for Figure 2.6.
Figure 3.3. As Figure 3.1 but with 1.0% real-terms growth in all councils
Source: As for Figure 2.6.
Figure 3.4. Gains and losses as a result of a hypothetical system of 100%
retention when business rates revenues fall by 0.1% in real terms in all council
areas in England (expressed as a percentage of councils’ overall funding)
Source: As for Figure 2.6.
-5%
0%
5%
10%
15%
20%
Shire District London Borough Metropolitan borough
Unitary Authority Fire authority County Council
-10%
0%
10%
20%
30%
40%
Shire District London Borough Metropolitan borough
Unitary Authority Fire authority County Council
-4%
-3%
-2%
-1%
0%
1%
Shire District London Borough Metropolitan borough
Unitary Authority Fire authority County Council

Key issues for the coming years
35
If real-terms business rates revenues were to fall, these patterns would be reversed
(Figure 3.4). In that case, the councils losing would be those with high levels and shares of
business rates revenues that pay tariffs: their tariffs would increase more quickly than
their revenues, meaning that they would keep a shrinking share of their business rates. On
the other hand, those councils with low business rates revenues that rely on top-ups
would be relative winners as their top-ups would increase in relative value.
One solution to this issue would be to increase the tariffs and top-ups in line with national
growth in business rates revenues.64 The amount of redistribution being undertaken by
the tariffs and top-ups would therefore keep pace with the overall growth in business
rates revenues. Individual councils would gain or lose funding depending on whether their
business rates revenues grew at a faster or slower rate than the national average.
However, the size of gains or losses from relatively faster or slower growth in business
rates revenue would still vary substantially: an additional 1% on top of the national
average growth rate would be worth much more in cash terms in some areas than in
others (for instance, see the examples of Westminster and Wolverhampton above). In a
recent study, the Institute for Public Policy Research (IPPR) suggests this is a flaw of the
current BRRS and advocates major changes to the calculation of the revenues to be
retained by individual councils.65 Rather than retaining the actual growth in business rates
revenues plus or minus any top-up or tariff, councils would retain an amount equal to: (1
plus the percentage growth in business rates revenues) multiplied by their baseline
funding needs. Implicitly, this means that each council’s tariff or top-up would be
increasing in line with its own business rates revenue growth each year.
IPPR argues that this would provide a more equal incentive to grow business rates
revenues across the country. For instance, 2% real-terms growth in local business rates
revenue would translate into 2% extra funding from the scheme in all councils. In contrast,
under the sort of scheme proposed by DCLG, 2% real-terms growth in local business
revenues would translate into less than 2% extra funding in areas reliant on large top-ups
for most of their income from the BRRS, and much more than 2% extra funding in areas
subject to large tariffs.66
Whether such a radical change to the BRRS should be seen as a good idea depends on what
incentives one wants the scheme to create. IPPR’s proposed scheme would provide
stronger incentives to grow the business rates tax base in areas with small tax bases, and
weaker incentives to grow the business rates tax base in areas with large tax bases,
relative to the type of scheme proposed by DCLG. It might therefore be better targeted at
encouraging poorer areas with smaller tax bases to ‘catch up’ with richer areas. On the
other hand, it would be less well targeted at encouraging areas with bigger tax bases to
64 There would be a choice of whether to index in line with actual growth in business rates revenues or with
an estimate of the growth of business rates revenues if all councils set their multiplier at the implicit national multiplier (councils will have the power to reduce their multiplier below this level).
65 Stirling and Thompson, 2016.
66 For example, if half of a council’s income from the BRRS is its own revenues and half is ‘top-up’ funding,
2% growth in its own revenues translates into 1% growth in overall income from the BRRS. On the other hand, if half of a council’s own revenues are taken from it as a ‘tariff’, 2% growth in its revenues translates into 4% growth in the retained portion of revenues.

A time of revolution? British local government finance in the 2010s
36
grow them further. To the extent that such areas generate a large proportion of national
business rates revenues, it may therefore be less well targeted at generating growth in
overall revenues nationwide. Such a scheme would also, in areas with two-tier local
government, reduce the strength of incentives for revenue growth faced by district
councils (which currently have large tariffs) and increase the strength of incentives faced
by county councils (which currently rely on large top-ups). This shift of incentives may be
seen as undesirable if it is felt districts have more of the levers for affecting local property
development and business growth (we discuss the issue of business rates in areas with
two-tier local government in further detail below).
Resetting the system
With or without such changes to the proposals, there is also the more general question
about the extent to which differences in tax base growth (both in terms of business rates
and in terms of council tax) and changes in spending needs across councils should, at some
stage, be taken account of by resetting the redistributive tariffs and top-ups.
The recent BRRS consultation suggests three options:67
a) a full reset of the system, including all achieved business rates growth, on a ‘frequent’
basis (e.g. every five years);
b) a full reset of the system, including all achieved business rates growth, on an
‘infrequent’ basis (e.g. every twenty years) or even never;
c) a partial reset of the system that equalised some but not all of the change in needs and
business rates income, on a ‘frequent’ basis (e.g. every five years).
Clear trade-offs are involved. The longer the duration between resets, the longer councils
would retain the benefits, on average, of growth in their tax bases and reductions in their
spending need. This would provide stronger fiscal incentives. The flip side of this is the
potential for large disparities in funding and potentially service provision across councils
(or, perhaps, in local tax rates, if councils attempt to compensate for changes in tax bases
and needs by increasing or decreasing tax rates).
How policymakers should trade off these pros and cons of longer durations should depend
on at least three factors:
an understanding of how quickly effective spending power68 might diverge across
councils under 100% retention, and how this may affect service provision/quality or
tax rates;
a judgement on the degree of divergence in effective spending power and service
provision (or tax rates) across councils that is acceptable – which may require
evidence of the impact of such differences on local people and businesses;
67 Paragraph 4.11 of DCLG (2016b).
68 By ‘effective spending power’, we mean spending power adjusted for needs.

Key issues for the coming years
37
the extent to which divergence in tax base growth and spending need is a result of
differences in councils’ performance rather than factors outside their control. If, for
instance, differential tax base growth is due largely to broad economic trends that
councils can do little to affect, the stronger fiscal incentive provided by less frequent
resets may lack ‘power’: councils could do little to affect their tax base growth, even if
they wanted to. And if divergences in tax base growth and spending need are largely
outside councils’ control, it may be seen as less ‘fair’ for such divergences to impact
upon their effective spending power.
These factors combine both empirical questions (how much divergence is likely, what
drives it, what its impacts might be) and value judgements (how much divergence is
acceptable in different circumstances). The former can, in principle, be addressed by
research and analysis – which IFS’s new programme hopes to contribute to. The latter
requires public debate and discussion – which the programme hopes to facilitate.
DCLG’s option (c) suggests a (frequent) partial reset as an alternative to an (infrequent)
full reset. A key consideration for this decision is the extent to which councils respond
more or less to fiscal incentives that remain partly in place indefinitely (as under a partial
reset) versus incentives that are retained in full for longer but are then fully equalised
away (as under a less frequent full reset). It will be difficult to ascertain this empirically,
but one factor that may affect the ‘effective’ strength of such incentives is the simplicity
with which they can be explained.
One particular type of partial reset would be to reset frequently (perhaps even annually)
on the spending needs side, but to reset on the tax base side only infrequently. Provided
that changes in spending needs are not strongly negatively correlated with changes in
local revenues, such an approach would provide incentives to grow local tax bases, while
protecting councils from spending risk (however, it would weaken councils’ incentives to
take action to reduce spending needs).
There is one final point worth making in regards to resets. As discussed in Section 2.2,
under the current 50% BRRS, a full reset was planned in 2020 and every ten years
thereafter. The problem with such an approach is that councils have a relatively strong
incentive to encourage development at the start of a cycle but much weaker incentives as
the reset point approaches. Indeed, by 2019 (and 2029, 2039, etc.), councils would have a
clear incentive to delay new property developments for a year, so that they get to keep the
resulting revenues for ten years rather than just one.
Rather than a fixed reset for all revenues every five years, say, a rolling reset where
changes in revenues in year T are reset in, for example, year T+5 may be better. So, for
instance, revenue growth in 2019 could be kept until 2024, while revenue growth in 2020
could be kept until 2025. This would remove the distortionary ‘cliff edge’ effects inherent
in a system with fixed resets for all revenues. The removal of the ‘cliff edge’ at the time of
fixed resets would also lessen the need for complex ‘damping’ mechanisms to prevent
major changes to councils’ budgets at the time of resets .

A time of revolution? British local government finance in the 2010s
38
Business rates appeals
As well as gaining or losing revenues as a result of physical changes to properties – i.e. new
construction, renovations or demolitions – that affect the business rates tax base, under
the current 50% rates retention scheme councils also bear half of the revenue risk
associated with occupiers’ appeals against the valuation of their property. In according
with proper accounting practice, each council is required to set aside part of each year’s
collectible business rates as a ‘provision’ for the losses in revenues that it expects such
appeals to generate.
In setting up the 50% scheme, an estimate of the provisions that councils would have to
make was made. Across England, this amounted to £1.8 billion, with £0.9 billion to be
borne by local areas and £0.9 billion by central government. The local portion of the
estimated appeals provision was subtracted from the local share of forecast business rates
revenues in 2013–14 (£11.8 billion across England), to arrive at the business rates
baseline and baseline funding levels (which both sum to £10.9 billion across England) for
that year and the associated tariffs, top-ups, safety net thresholds and levy rates.
In fact, rather than £1.8 billion of provisions in total, councils made £1.7 billion of
provisions in 2013–14 and £1.5 billion of provisions in 2014–15,69 of which around
£0.7 billion was actually ‘used’ to settle appeals by March 2015 (meaning £2.5 billion
remains set aside in provisions). Across England, provisions for appeal in 2013–14 and
2014–15 amount to 7.1% of business rates revenues in those years, with huge variation
across councils (Hillingdon has put aside 0.3%, compared with 39% in Copeland). The
degree of risk associated with appeals – largely outside councils’ control – is therefore
substantial and varies significantly across councils.
The move to 100% retention could see councils bear 100% (rather than 50%) of the
revenue risk associated with appeals. If this is the case, when setting up the scheme, and at
each revaluation, an estimate of the likely appeals and provisions would have to be made,
both in aggregate and for individual councils. Experience shows that it is unlikely that such
estimates will be very accurate, meaning councils could end up bearing substantial
associated revenue risk if this approach is adopted.
Furthermore, the system of safety nets that operates now – and is likely to continue in
some form – can provide an incentive for councils to ‘over-provision’ in order to reduce
their business rates revenue sufficiently to claim safety net payments. They can then make
use of any ‘over-provisions’ at a later date. In other words, the system can be gamed. Such
incentives would likely increase under 100% retention.
Given these issues, DCLG is examining how councils could be insulated from revenue risk
associated with appeals, which would negate the need for provisions against such losses.70
69 Figures from NNDR3 reports for 2013–14 and 2014–15. According to estimates published by the LGA–
DCLG business rates retention Steering Group, a further £0.5 billion of provisions is likely to have been made in 2015–16 (http://www.local.gov.uk/documents/10180/7783321/Item+2+%28c%29%20%20Annex+A+-+Handling+Appeal+Risk.pdf/0d5fb6a7-880c-47ea-bfb4-4ecdeec36dfa).
70 See, for example, items on Appeal Risk in the 14 October meeting of the LGA–DCLG business rates
retention Systems Design Working Group, available at http://www.local.gov.uk/business-rates.

Key issues for the coming years
39
The issues involved are complex but, given the risk and perverse incentives posed by the
current system of ‘provisions’, worth exploring; we will examine appeals in more detail in
our research programme.
Revaluation of business property
It is also worth considering how the treatment of business rates revaluation may affect
incentives and risks.
Under the current 50% BRRS and DCLG’s plans for the 100% retention scheme, tariffs and
top-ups will be adjusted to strip out the (overnight) effects of the periodic revaluations of
property on councils’ retained revenues: a council where property values have increased
relative to the national average will see an increase in its tariff (or a reduction in its top-
up) to exactly offset the increase in business rates revenues that results from this, and vice
versa.
Is this a sensible idea? On the one hand, it may be seen as skewing incentives for councils
so that they promote local growth through activities that require expansions in floor
space, as opposed to activities that make more intensive and higher-value use of existing
floor space. On the other hand, ‘stripping out’ the effect of revaluation protects councils
from large and potentially rapid changes in their business rates revenue as a result of
changes in local property values that they may have even less direct control over than
local property floor space. Alternatively, it may also reduce the likelihood of particular
undesirable behavioural responses by councils – attempting to limit the supply of new
floor space in an effort to increase the value of existing floor space.
As part of our work programme, we will consider how much difference to councils’
revenues, risks and fiscal incentives may be made by different treatments of business rates
revaluation under the BRRS. We will also consider the impact of devolving alternative tax
bases (which perhaps may correlate better with wider economic development).
Multi-tier local government
An additional issue that will need to be decided is how to split business rates revenues
between counties and districts in two-tier areas.71 At present, under the partial retention
scheme, districts retain up to 40% of the growth in rates and counties up to 10% (or 9%
where there is a separate fire authority – which retains 1% of the growth).
This greater share for districts reflects the fact that the most direct powers in relation to
economic development – including planning control – sit with district authorities.
However, this division of revenues, when combined with the much higher spending needs
of counties (which fund big areas of spending such as social care), means that all districts
are subject to tariffs on their business rates revenues, while all counties depend on top-
ups to their business rates revenues. As shown in Figures 3.1–3.3 above, this means that if
there is real-terms growth in the business rates tax base over time, counties are likely to
lose, on average, and districts gain (as the relative amount of redistribution done by the
71 A similar issue arises in London in relation to the boroughs and the GLA.
A time of revolution? British local government finance in the 2010s
40
tariffs and top-ups falls). This may be problematic, especially given that county councils
are responsible for areas such as social services that are likely to face particular increases
in spending needs in the coming years.
If DCLG were to increase the share of business rates retained by counties (above the one-
fifth of the local share they currently retain), they would not be so reliant on top-ups (and
may even become subject to tariffs). This would allow counties to benefit more from
growth in the business rates tax base. However, they would also be exposed to more risk
and would be more affected by potential falls in business rates income. The lower share
retained by districts under such a system would also weaken the growth incentive for the
authorities whose areas of responsibility are most directly linked to growth. If this were
seen as undesirable, an alternative would be to index the tariffs and top-ups to national
business rates revenue growth, as discussed above (the more radical change suggested by
IPPR would also address the issue of counties potentially falling behind in terms of
funding, but would also shift growth incentives from districts to counties).
Powers to reduce the multiplier
It is also worth considering how the new powers to reduce the business rates multiplier
will work in areas where there is more than one tier of local government sharing business
rates revenues. Which tiers should have the power to reduce the multiplier? How should
the financial costs (and potential benefits) of reducing the multiplier be shared between
different tiers?
It would seem only fair for the authority that enacted the cut to bear the cost of the cut.
This would mean compensating the other tier for the reduction in revenues from its share
of business rates. Estimating the compensation required could be tricky. In principle, one
would want to account not only for the direct mechanical reduction in revenues from a
lower multiplier, but also for any offsetting effects from increases in the business rates tax
base (due to induced increases in non-domestic floor space). Estimating induced
behavioural responses to tax changes is always difficult though, and estimates are usually
subject to wide margins of error. On the other hand, not accounting for these effects would
somewhat skew the incentives faced by an authority when mulling a cut in the multiplier:
it would bear the full ‘mechanical’ cost of the cut but would not capture the full gains from
any induced behavioural response.
If it were decided that all tiers should have the power to reduce the multiplier, one option
would be to split the multiplier into separate multipliers for each tier, with the relative
size of the multipliers reflecting the chosen split for business rates revenue growth. For
instance, if districts were to have 80% and counties 20%, multipliers for these tiers could
initially be set at four-fifths and one-fifth of the national multiplier, respectively.
Abolition of grant funding and devolution of extra responsibilities
One important feature of the 100% BRRS is that the business rates revenues that will be
newly devolved to councils will significantly exceed the general grant funding councils will
be receiving. In order to make the scheme revenue-neutral at a national level in the first
year of the scheme, general grant funding will be abolished and additional spending
responsibilities will be devolved to councils. In particular, based on forecast business rates

Key issues for the coming years
41
revenues and the planned level of general grant funding in 2019–20, councils’ revenues
would increase by around £10 billion as a result of the 100% BRRS.72 Making the scheme
revenue neutral in that year would therefore require finding £10 billion of additional
responsibilities for councils’ general funding – from that point on made up of council tax
and business rates revenues – to provide for. In the 2015 Spending Review, it was
announced that the £1 billion GLA Transport Grant would be devolved and be funded out
of business rates, bringing this total down to about £9 billion.
In its consultation on 100% rates retention, DCLG lists a range of different options for
devolution,73 including:
responsibility for funding services that are currently funded or part-funded by
separate grants, such as the Public Health Grant (currently around £3.4 billion), the
new Improved Better Care Fund (£1.5 billion in 2019–20) and areas of early years
provision (currently funded using part of the Dedicated Schools Grant);
attendance allowance, a benefit paid to people aged over 65 who are physically or
mentally disabled and need help with personal care (forecast to be around £5 billion in
2019–20).74
It also suggests a number of criteria against which the different options for devolution will
be judged:75
their fit with councils’ existing responsibilities and expertise;
their links to local economic development and economic growth;
the potential for tailored policies based on local characteristics or preferences;
the likely path of spending need for that responsibility relative to councils’ revenues,
and the uncertainty and risk around the expected path of spending need.
Each of these criteria seems sensible. The last is particularly important in terms of the
fiscal risks that councils will be facing under the 100% BRRS. For instance, even if one is
able to match the additional spending responsibilities to the additional revenues in the
first year of the scheme, there is no guarantee that they will continue to align in
subsequent years. And even if revenues are likely to be sufficient at a national level, they
may not be sufficient at the local level given the potential for changes in revenues and
changes in spending need to differ significantly across councils.
72 Authors’ estimate, based on OBR March 2016 forecasts for retained business rates income, March 2016
Budget costings of recent business rates policy changes, and planned general grants set out in DCLG’s Local Government Finance Settlement for the period 2016–17 to 2019–20.
73 Paragraphs 3.11–3.13 of DCLG (2016b).
74 Forecast for 2019–20 is based on England’s reported share of spending on attendance allowance in Great
Britain in 2015–16 remaining the same in that year. Data available at https://www.gov.uk/government/collections/benefit-expenditure-tables.
75 Paragraph 3.7 of DCLG (2016b).

A time of revolution? British local government finance in the 2010s
42
Figure 3.5. Changes in spending on attendance allowance and in business rates
revenues by council area, 2005–06 to 2010–11
Source: DWP statistics on benefit expenditure by local authority and DCLG statistics on business rates
revenues by local authority (NNDR3).
Figure 3.5 shows that for attendance allowance – one of the candidates for devolution –
changes in spending have historically varied significantly across councils. In particular,
between 2005–06 and 2010–11, spending on this benefit grew by little more than 10% in
a number of council areas, but by over 50% in ten others (most council areas saw
spending on attendance allowance increase by 20–40% during this period). It is also
worth noting that attendance allowance expenditure is far from evenly distributed across
the country: it is, of course, lower in areas with relatively young populations (such as large
parts of London) and higher in areas with older and sicker populations (such as rural
areas or former industrial areas).76 The same percentage change in spending would be
bigger in cash terms in areas with high levels of attendance allowance spending.
Differences in the scale of attendance allowance spending and the potential differences in
spending trends – based on past experience and on forecasts for rather different
demographic trends in different parts of the country77 – mean that if it were devolved,
different councils could see very different spending pressures arising.
In addition to showing changes in attendance allowance spending, Figure 3.5 shows
changes in business rates revenues by council area for the same period. This likewise
shows significant differences across areas, with falls in revenue for two councils and
increases of 40% or more for five councils. However, the trend line on the figure shows
that, perhaps surprisingly, there was little correlation between the change in attendance
allowance spending and the change in business rates revenues at a local level.
The likely correlation between changes in spending need for newly-devolved
responsibilities, spending need for existing responsibilities, and local council tax and
business rates revenues should be a key consideration when deciding what to devolve. A
strong negative correlation between changes in spending need and revenues would be
problematic: at the same time spending needs were rising, revenues would be falling.
76 Measured as a fraction of existing budgets, attendance allowance varies from 0.7% in the City of London
to 16.6% in Staffordshire (with an average of 10.5% across England). Source: authors’ calculations using DWP benefit statistics and local government revenue expenditure and financing out-turns.
77 Population projections available at
https://www.ons.gov.uk/peoplepopulationandcommunity/populationandmigration/populationprojections.
0%
10%
20%
30%
40%
50%
60%
70%
80%
90%
-20% 0% 20% 40% 60% 80%
Ch
an
ge
in
sp
en
din
g o
n
att
en
dan
ce a
llo
wan
ce
Change in business rates revenues

Key issues for the coming years
43
Similarly, a strong positive correlation between changes in spending need for new
responsibilities and changes in spending need for existing services would also be
problematic: spending needs would be rising across the board. Given that services that fit
well with existing responsibilities and expertise may be expected to have spending risks
that are positively correlated with those existing responsibilities, there could therefore be
trade-offs between the different criteria.
The fact that Figure 3.5 shows little correlation between changes in spending on
attendance allowance and changes in business rates revenues would seem to be ‘good
news’ with respect to the potential for devolving attendance allowance (of course, a
positive correlation would be even better). However, before concluding that attendance
allowance is a good candidate for devolution on this criterion, it is worth bearing in mind
at least four further points.
First are the very different changes in spending in different council areas already
discussed. Even if these changes are not correlated with revenues, they would still see
councils facing quite different budgetary pressures.
Second is that the observable correlation in such analyses may be driven in part or in full
by other factors, rather than by any ‘causal’ relationship between the spending or revenue
changes in question. To the extent that these other factors may be temporary or may vary
in importance over time, the relationship between attendance allowance spending and
business rates revenue may change over time. This makes empirically assessing the likely
degree of revenue and spending risk correlation from only an examination of their past
correlation unwise.
Third is that estimates of the degree of correlation may be particularly sensitive to
outliers. For instance, Figure 3.6 shows the same variables for the later period between
2010–11 and 2014–15. This shows little correlation for councils with up to about 20%
growth in their business rates revenues, but a positive correlation for those with growth in
business rates revenue above this level, driven by a small number of councils. It is unclear
whether this represents a real relationship or is simply the result of chance.
Figure 3.6. Changes in spending on attendance allowance and in business rates
revenues by council area, 2010–11 to 2014–15
Source: As Figure 3.5.
-15%
-10%
-5%
0%
5%
10%
15%
20%
25%
30%
-20% 0% 20% 40% 60% 80% 100%
Ch
an
ge
in
sp
en
din
g o
n
att
en
dan
ce a
llo
wan
ce
Change in business rates revenues

A time of revolution? British local government finance in the 2010s
44
Fourth are the other criteria against which DCLG says it will assess candidates for
devolution. Attendance allowance clearly has strong links to existing areas of social
services provision, and there is the possibility of redesigning the support provided by this
benefit and integrating it more fully into wider social care systems. On the other hand, the
link between attendance allowance and local economic growth seems fairly tenuous. And,
despite the enthusiasm for devolution more generally, there is limited appetite among
councils for the devolution of this area of responsibility, in part due to fear over future
spending pressures.78
The decision of which responsibilities to devolve to councils is clearly a big one that needs
to be got right: a bad decision would increase the likelihood of some councils having
revenues that are unable to fund their relative spending needs. We will analyse the
rationale and potential effects on spending need and budgetary risk of devolving
attendance allowance and other responsibilities in more detail in future analysis.
3.2 Different directions in Scotland and Wales?
In Section 2.3, we saw how, over the last five years, reforms to local government finance
have been far less radical in Scotland and Wales than in England. What about the next five
years?
Scotland
The next few years may see a number of reforms to local government finance in Scotland.
A review of business rates is under way, for instance. However, the immediate focus of
reform is likely to be in other areas.
Council tax is one area where we know certain things will change. First, in 2017–18, the
council tax freeze will end. Instead, councils will be allowed to increase council tax rates
by up to a maximum of 3% a year. However, as is the case with the recent relaxation of
constraints on council tax in England, this is unlikely to fully alleviate wider funding
constraints in a context of cuts to central government grants. Council tax revenues account
for only 16% of councils’ income on average (so a 3% increase results in a less than ½%
increase in a council’s overall budget). Second, in an attempt to make council tax ‘fairer’,
the multipliers for band E, F, G and H properties will be increased in 2017–18. Specifically,
this will result in average increases in annual council tax bills of £105, £207, £335 and
£517 across each of these four bands respectively.79 Low-income households living in
higher-banded properties will be exempted from the increases, and there will also be
some additional support for low-income households with children, regardless of council
tax band.
This re-banding proposal effectively represents the Scottish Government’s response to the
Commission on Local Tax Reform (2015), which argued that the council tax was unfair and
78 For instance, see the Local Government Association response to DCLG’s consultation on business rates
retention: http://www.local.gov.uk/web/guest/media-releases/-/journal_content/56/10180/7885378/NEWS.
79 See http://news.scotland.gov.uk/News/Council-tax-reform-2347.aspx.
Key issues for the coming years
45
should be replaced. The Commission stopped short of saying precisely what the council
tax should be replaced with, but instead laid out a number of options. These included a
reformed, proportionate council tax with tax liability based on up-to-date property values,
an alternative property tax with each household paying a percentage of the value of its
home in tax, and a local income tax.
Critics argue that the Scottish Government’s response to the Commission’s report is
inadequate, particularly in that there are no plans for property revaluation (the last
revaluation in Scotland took place in 1991, and the Commission’s report suggested that
over half of properties in Scotland may now be in the wrong band). In this context, re-
banding in itself may be less effective at addressing the fairness issue.
The Scottish Government has also announced that local authorities will be formally
consulted on proposals to assign a proportion of income tax revenue growth to local
authorities. (This will be possible following the devolution of income tax to the Scottish
parliament in 2017–18.) The proposal to assign a proportion of income tax revenues to
local government reflects the SNP’s historical interest in establishing a local income tax (a
policy the SNP proposed in its 2009 Manifesto but which was defeated in parliament). The
latest proposal has yet to be set out in detail, but would likely involve the revenue grant to
Scottish local government being linked in some way to the growth in income tax revenues
raised in Scotland, not locally. The Scottish Government argues that this policy will ‘allow
local government to benefit directly from economic growth and incentivise councils to
contribute to this growth’. Additionally, the Scottish Government has announced a
consultation on enabling councils to levy a tax on vacant and derelict land.80
Alongside the debate around local tax reform, there has simultaneously been debate
around how the proceeds of reform should be used. The Scottish Government has
indicated that the expected additional net revenue of £100 million from the council tax re-
banding policy will be allocated direct to schools as part of the Attainment Scotland
Fund.81 Given that council tax is collected and retained by councils themselves, it is not
clear how this proposal will be implemented. There is some concern that the Scottish
Government may offset councils’ increased council tax revenues by reducing the General
Revenue Grant. If this were to happen, it would likely be seen as undermining councils’
accountability and autonomy.
The allocation of monies direct to schools is part of wider education reforms which may
affect the influence of local government in education. The Scottish Government has
launched a consultation on governance arrangements for schools,82 with the objective to
devolve greater power to headteachers, alongside the creation of regional education
boards to encourage collaboration across local authority areas. Whilst the Scottish
Government has said that local authorities will remain democratically accountable for
schools, there will be a presumption to devolve as much power to individual schools as
possible. There is therefore a question of whether recently-announced changes prefigure a
80 See http://news.scotland.gov.uk/News/Council-tax-reform-2347.aspx.
81 http://www.educationscotland.gov.uk/inclusionandequalities/sac/fund/index.asp.
82 Scottish Government, 2016.

A time of revolution? British local government finance in the 2010s
46
move towards reductions in the role of councils in the funding and organisation of
education, as has been seen in England (with academies and free schools).
Wales
The next five to ten years could also see more changes to the Welsh local government
finance system than we have recently seen. But as in Scotland, the reforms being discussed
are somewhat different from those planned in England. In particular, there is little sense of
a move away from resource and needs equalisation – although there is an interest in
assessing how these are estimated.
There seem to be two areas of focus. First are moves towards a more systematic adoption
of joint working on the delivery of key services on a cross-service and regional basis, for
which further details are expected to be set out in early 2017.83 The Welsh Government
will take account of regional models such as the new Cardiff Capital and Swansea Bay City
Regions and the push to integrate health and social care through partnerships between
local authorities and NHS health boards. Possible candidates for regional delivery include
transport, land-use planning, economic development, schools improvement and social
services. Such an approach to local government reform is broadly consistent with the long-
standing emphasis on collaboration rather than competition, but questions are likely to
include how to ensure transparency of accountability for regional services and avoid the
complexity that has been associated with the current patchwork of collaborative
arrangements (there are no plans for ‘regional’ mayors as in England).
The other major area where reform could be on the cards is the structure (and potentially
tax base) for local taxes. In the short term, this includes examining the banding structure
for council tax, with an eye to making it more progressive. In the longer term, it could
include more fundamental reforms to council tax, or business rates, and even considering
whether local income tax would be an option for Wales. With this in mind, a new
independent advisory group is being set up by the Welsh Government. The focus of its
work will be on practical implications of different reforms to local taxes, including the
technical and administrative issues involved and the impacts on households, businesses
and different councils (including the impact on the scale of resource equalisation that may
be required). Outside of government, there is also a debate about new taxes – for example,
work by the Bevan Foundation (2016) on the potential for new taxes, ranging from a
tourism levy to a land value tax – some of which at least could be devolved to councils.
The Welsh Government is currently also considering a proposal to grant local authorities a
general power of competence, potentially including wider powers to charge for services
and to trade. Greater flexibility in this area was something recommended by the
Independent Commission on Local Government Finance Wales (2016). Whether its other
recommendations – which include incorporating specific grants into general grant
funding, a move to multi-year funding, and powers to vary and retain business rates – will
be taken up by the Welsh Government is less clear.
83 See, for instance, http://gov.wales/newsroom/localgovernment/2016/reform-local-government/?lang=en.
47
© Institute for Fiscal Studies
4. Conclusions and Next Steps
Councils have seen significant change to the levels of funding they receive, and – at least in
England – to the finance system in which they operate, over the last five years. The next
five years will see perhaps even greater change, with the 100% Business Rates Retention
Scheme and associated changes to grants and spending responsibilities in England,
potential reform of the council tax and business rates bases in Wales, and the possibility of
the assignment of a proportion of income tax revenues to councils in Scotland.
Change of this scale really does represent a ‘revolution’ and needs to be subject to public
scrutiny and rigorous independent analysis. The effects of various policy options on the
budgets and budgetary risks of different councils and the system as a whole, and on the
incentives and opportunities for beneficial policy change, must be examined. The policy
variation generated may also offer an opportunity for researchers to estimate how local
finance and governance arrangements affect a range of policy and socio-economic
outcomes of more general interest to policymakers and academics internationally, where
similar issues are being grappled with.
With a focus on quantitative fiscal and economic modelling, a careful consideration of the
trade-offs between policy objectives, and dissemination of findings to public, stakeholder
and academic audiences, IFS’s new programme will ensure appropriate critique of policy
options and proposals – and the stated rationales for them.84 It will also examine how
councils (and local economies) have responded to past changes to the local government
finance system, and see what lessons can be learned about the possible impacts of further
changes.
This report is the first stage of this programme of work.
It has shown how, in England, cuts to funding have been much more substantial in councils
more reliant on central government grants for their overall spending power – which, in
contrast to what has sometimes been said, is not an inevitable result of variance in grant
reliance. Indeed, reforms to the way grants are allocated from 2016–17 onwards mean
that, going forwards, cuts in spending power will be more evenly distributed across the
country. This change followed years of rather less coherent and transparent policymaking
on grant funding.
This report has also shown how some councils have done rather better out of the BRRS
than other councils, and highlighted that the New Homes Bonus has led to gains and losses
too. To some extent, this is the essence of these policies – councils must be able to win or
lose financially in order to have the direct financial incentives to support economic and
housing development. However, the extent to which economic and population trends
84 IFS is not the only organisation analysing these sorts of issues. This report has highlighted work by the
IPPR, CIPFA and, of course, DCLG in relation to the BRRS. Other work is being undertaken by the Centre for Cities, the New Local Government Network (NLGN), the Local Government Information Unit (LGIU) and the Local Government Association (LGA). IFS researchers aim to engage with these organisations during the course of our programme to ensure, where possible, our programme complements and builds on existing analysis.

A time of revolution? British local government finance in the 2010s
48
mean some councils may be expected to gain and others lose from factors outside their
control may mean a large component of the overall effect may just represent transfers
from areas with poor growth prospects to those with good growth prospects. Alternative
scheme designs – especially in the case of the NHB – could have maintained, and even
strengthened, incentives for development, while at the same time involved less
redistribution of spending power across the country.
In a series of reports and analyses, our programme will look at the issues outlined in this
report in more detail. The data sets and models built to examine local government revenue
and the BRRS will be extended to allow a fuller quantitative analysis of the effects of
existing policies to date and the potential effects of the various options for the future.
We will consider a range of live policy issues related to the shift to 100% business rates
retention in England. In particular:
We will examine the potential divergence in funding that could open up between
councils under various options for 100% retention, given the precise workings of the
different schemes and potential differences in business rates revenue growth in
different parts of the country.
Related to this, we will consider the extent to which tariffs and top-ups should be
adjusted or reset to limit funding divergence and offer some protection against
changes in relative need, and the best way to make these adjustments.
We will look in more detail at the pros and cons of devolving particular additional
spending responsibilities as part of the moves to 100% retention. This includes further
work on how spending pressures in particular services may evolve in the years ahead,
and how these pressures may correlate with existing spending responsibilities and
councils’ revenues (business rates and council tax), building on the initial examination
of attendance allowance in this work.
We will explore the role central government may play in future, including potential
responses to the situation where funding obtained from council tax and business rates
is insufficient to meet (growing) spending needs, such as the re-introduction of grants,
or extra flexibility for councils to increase these taxes.
Partnerships with researchers in Scotland and Wales will focus on examining the issues
related to the potential reforms in these nations also discussed in this report. Policy
discussions in Scotland and Wales will also feed into our analysis in England. More
generally, we will look beyond immediate policy plans and consider the rationale and
potential effects of alternative or broader changes, addressing issues such as:
What might the impact of assigning or localising a proportion of income tax to councils
(or groupings of councils such as City Regions) be?
More broadly, is there a case for reforming existing ‘local’ property taxes or devolving
additional taxes or policies related to economic development?
In addition to considering the impact of planned and potential reforms on councils’
budgets, incentives and risks, we will also consider impacts on businesses and households:
Conclusions and next steps
49
How might reforms to council tax affect households in different parts of the country
and living in houses with different values?
To what extent might proposed and possible devolution and reforms to local taxes
affect the complexity of tax compliance for businesses?
Our work programme also includes analysis of the behavioural and economic effects of
past changes to local government finance systems and the potential effects of planned and
possible reforms in the future. Topics we plan to investigate include:
Have those areas with the biggest financial rewards to approving new homes under
the NHB seen larger increases in homebuilding than elsewhere?
Have councils with the strongest incentives to grow local business rates incomes
changed their spending decisions? Have they paid more into reserves as a result of the
increased financial risk that accompanies increased financial incentives?
What was the impact of the centralisation of business rates, and associated large
changes in business rates multipliers, in different parts of the country, in 1990?
Given evidence from other countries, how much tax competition between areas might
be expected?
Identifying the effects of reforms on behaviour and on local economies will not be
straightforward, although the fact that many of the more recent reforms in England were
not implemented in Wales or Scotland may make Welsh and Scottish councils a possible
‘control’ group in such analysis. We will also look at the experience of other countries,
where systems of local government finance are often very different, but where reforms
may have also led to significant changes in incentives and risks. In particular, we will
undertake a review of the evidence on the links between fiscal devolution, resource and
needs equalisation, and local and national economic performance.
As with all IFS research, rigour, impartiality and objectivity will be watchwords: the
programme will not simply be another ‘cheerleader’ for devolution and localisation. While
it is true that Great Britain has traditionally had a more centralised system of local
government finance than most countries, that in itself is not an argument for change. And
while decentralisation can provide additional policy levers and financial incentives, the
trade-off is greater financial risk and potentially greater funding divergence. Whether
those risks are worth taking on depends on just how powerful the policy levers and
incentives are – and that is an issue that is recognised as being one where evidence is
relatively limited and inconclusive. If possible, we will try to fill in these knowledge gaps. If
not, we will point them out so that policymakers and the public are aware of what is
unknown as well as known about the likely effects of the ongoing revolution to local
governance and local government finance.

50
© Institute for Fiscal Studies
Appendix A
Figure A.1 shows relative gains/losses from the BRRS between 2013–14 and 2014–15,
based on revenue out-turns only. It shows relatively smaller gains/losses than estimated
for 2013–14 to 2016–17 (which is based on forecast revenues for the last two years).
Figure A.1. Relative gains and losses as a result of the BRRS (2013–14 to 2014–
15), expressed as a percentage of councils’ overall funding
Source: Authors’ calculations using NNDR3 and NNDR1 figures.
Figure A.2 shows estimated relative gains/losses from the BRRS between 2013–14 and
2016–17 if the counterfactual is baseline funding uprated in line with the business rates
multiplier (rather than in line with national average growth in retained business rates
revenue). This counterfactual shows relatively more gainers than losers because reported
revenues and revenue estimates in NNDR3 and NNDR1 returns imply growth in business
rates revenues (including Section 31 grants) above that generated by increases in the
business rates multiplier.
Figure A.2. Relative gains and losses as a result of the BRRS (2013–14 to 2016–
17), expressed as a percentage of councils’ overall funding, under an alternative
counterfactual level of funding
Source: Authors’ calculations using NNDR3 and NNDR1 figures for 2013–14 to 2016–17 and information on
other funding (grants and council tax) from revenue expenditure out-turns and estimates for the same years.
-5%
0%
5%
10%
15%
20%
25%
30%
Shire District London Borough Metropolitan Borough
Unitary Authority Fire Authority County Council
-5%
0%
5%
10%
15%
20%
25%
30%
Shire District London Borough Metropolitan Borough
Unitary Authority Fire Authority County Council

51
© Institute for Fiscal Studies
References
Adam, S. and Browne, J. (2012), Reforming Council Tax Benefit, IFS Report C123
(https://www.ifs.org.uk/publications/6183).
Adam, S. and Miller, H. (2014), ‘Business rates’, in C. Emmerson, P. Johnson and H. Miller,
The IFS Green Budget: February 2014, IFS Report R91
(https://www.ifs.org.uk/publications/7072).
Bevan Foundation (2016), ‘Tax for Good: new taxes for a better Wales’
(https://www.bevanfoundation.org/publications/tax-good-new-taxes-better-wales/).
Boetti, L., Piacenza, M. and Turati, G. (2012), ‘Decentralization and local governments’
performance: how does fiscal autonomy affect spending efficiency?’, FinanzArchiv: Public
Finance Analysis, 68, 269–302 (https://doi.org/10.1628/001522112X653840).
Business Rates Panel (2015), The Devolution of Business Rates to Wales, Report to the
Minister for Economy, Science and Transport
(http://gov.wales/docs/det/publications/150202-devolution-of-business-rates-en.pdf).
Cheshire, P. and Hilber, C. (2008), ‘Office space supply restrictions in Britain: the political
economy of market revenge’, Economic Journal, 118, F185–221
(http://onlinelibrary.wiley.com/doi/10.1111/j.1468-0297.2008.02149.x/abstract).
CIPFA (2014), ‘Supplementary written evidence from the Chartered Institute of Public
Finance and Accountancy’, submission to House of Commons Public Accounts Committee
Inquiry on the Financial Sustainability of Local Authorities
(http://data.parliament.uk/WrittenEvidence/CommitteeEvidence.svc/EvidenceDocument
/Public%20Accounts/Financial%20sustainability%20of%20local%20authorities/written
/16308.html).
Commission on Local Tax Reform (2015), Just Change: A New Approach to Local Taxation
(http://localtaxcommission.scot/download-our-final-report/).
Crawford, P., Fothergill, S. and Monk, S. (1984), ‘The effect of rates on the location of
employment’, report by the Industrial Location Research Group, Department for Land
Economy, Cambridge University.
DCLG (2011), New Homes Bonus: Final Scheme Design
(https://www.gov.uk/government/uploads/system/uploads/attachment_data/file/6004
/1846530.pdf).
DCLG (2012a), Business Rates Retention Scheme: The Economic Benefits of Local Business
Rates Retention
(https://www.gov.uk/government/uploads/system/uploads/attachment_data/file/1147
2/2146726.pdf).

A time of revolution? British local government finance in the 2010s
52
DCLG (2012b), Business Rates Retention: A Step-by-Step Guide
(https://www.gov.uk/government/uploads/system/uploads/attachment_data/file/5947
/2182691.pdf).
DCLG (2012c), Business Rates Retention: Policy Statement
(https://www.gov.uk/government/uploads/system/uploads/attachment_data/file/1493
9/Business_rates_retention_policy_statement.pdf).
DCLG (2013), Business Rates Retention and the Local Government Finance Settlement: A
Practitioner’s Guide (Version 3)
(http://webarchive.nationalarchives.gov.uk/20140505104649/http://www.local.commu
nities.gov.uk/finance/1314/practitionersguides.pdf).
DCLG (2015a), Provisional Local Government Finance Settlement 2016 to 2017 and an Offer
to Councils for Future Years: Consultation
(https://www.gov.uk/government/uploads/system/uploads/attachment_data/file/4943
85/Provisional_settlement_consultation_document.pdf).
DCLG (2015b), ‘New Homes Bonus: sharpening the incentive: technical consultation’
(https://www.gov.uk/government/consultations/new-homes-bonus-sharpening-the-
incentive-technical-consultation).
DCLG (2016a), ‘New Homes Bonus: final allocations for 2016 to 2017 and consultation on
reforming the Bonus’ (https://www.gov.uk/government/collections/new-homes-bonus-
final-allocations-for-2016-to-2017-and-consultation-on-reforming-the-bonus).
DCLG (2016b), Self-Sufficient Local Government: 100% Business Rates Retention –
Consultation Document
(https://www.gov.uk/government/uploads/system/uploads/attachment_data/file/5350
22/Business_Rates_Retention_Consultation_5_July_2016.pdf).
Deaner, B. and Phillips, D. (2013), ‘Government spending on public services in Scotland:
current patterns and future issues’, IFS Briefing Note BN140
(https://www.ifs.org.uk/publications/6858).
Gibson, A. and Asthana, S. (2011), ‘Resource allocation for English local government: a
critique of the four-block model’, Journal of the Royal Statistical Society, Series A, 174, 529–
46 (https://www.jstor.org/stable/23013509).
Hendry, R. (1998), ‘Fair shares for all? The development of needs based funding in
education, health and housing’, Centre for Analysis of Social Exclusion, CASE/18
(http://eprints.lse.ac.uk/6504/).
Independent Commission on Local Government Finance Wales (2016), Ambition for
Change: Aiming Higher (http://www.cipfa.org/~/media/files/partners/wiclgf/160324-
ambition-for-change---aiming-higher.pdf).
Innes, D. and Phillips, D. (2015), ‘Council tax rises to ease the pace of cuts to local
government budgets’, IFS Observation (https://www.ifs.org.uk/publications/8095).

References
53
Innes, D. and Tetlow, G. (2015), ‘Central cuts, local decision-making: changes in local
government spending and revenues in England, 2009–10 to 2014–15, IFS Briefing Note
BN166 (https://www.ifs.org.uk/publications/7617).
Larkin, K., Wilcox, Z. and Gailey, C. (2011), Room for Improvement: Creating the Financial
Incentives Needed for Economic Growth, Centre for Cities
(http://www.centreforcities.org/publication/room-for-improvement-creating-the-
financial-incentives-needed-for-economic-growth/).
Lyons Housing Review (2014), Mobilising across the Nation to Build the Homes Our
Children Need
(http://www.yourbritain.org.uk/uploads/editor/files/The_Lyons_Housing_Review_2.pdf).
Office for Budget Responsibility (2016), Economic and Fiscal Outlook: March 2016
(http://budgetresponsibility.org.uk/efo/economic-fiscal-outlook-march-2016/).
Scottish Government (2016), Empowering Teachers, Parents and Communities to Achieve
Excellence and Equity in Education: A Governance Review
(http://www.gov.scot/Publications/2016/09/1251).
Stirling, A. and Thompson, S. (2016), Better Rates: How to Ensure the New Business Rates
Regime Promotes Growth Everywhere, Institute for Public Policy Research
(http://www.ippr.org/files/publications/pdf/better-rates_June2016.pdf).
Wilson, W., Murphy, C. and Barton, C. (2016), ‘The New Homes Bonus (England)’, House of
Commons Library, Briefing Paper 05724
(http://researchbriefings.parliament.uk/ResearchBriefing/Summary/SN05724).

Neil Amin Smith, David Phil-lips, Polly SimpsonInstitute for Fiscal Studies
David EiserFraser of Allander Institute
The Local Government and Finance and Devolution Consortium is generously supported by the following organisations:
• Capita
• CIPFA
• ESRC
• PwC
The Consortium is also supported by the Municipal Journal, the Society of Country Treasurers and a range of councils from across England.
Living Standards, Poverty and Inequality in the UK: 2016
Institute for Fiscal Studies
Tel: +44 (0) 7291 4800 Fax: +44 (0) 7323 4780
[email protected] www.ifs.org.uk
7 Ridgmount Street London WC1E 7AE
IFS Report R121ISBN: 978-1-911102-24-3