Embed Size (px)
Citation preview

lable at ScienceDirect
Estuarine, Coastal and Shelf Science 93 (2011) 438e448
Contents lists avai
Estuarine, Coastal and Shelf Science
journal homepage: www.elsevier .com/locate/ecss
A tidal creek water budget: Estimation of groundwater discharge and overlandflow using hydrologic modeling in the Southern Everglades
Béatrice Michot a,*, Ehab A. Meselhe a, Victor H. Rivera-Monroy b, Carlos Coronado-Molina c,Robert R. Twilley b
aDepartment of Civil Engineering, University of Louisiana at Lafayette, 131 Rex Street, Lafayette, LA 70503, USAbDepartment of Oceanography and Coastal Sciences, School of the Coast and the Environment, Louisiana State University, Baton Rouge, LA 70803, USAcWetland Watershed Sciences Division, South Florida Water Management District, West Palm Beach, FL 33406, USA
a r t i c l e i n f o
Article history:Received 22 December 2010Accepted 19 May 2011Available online 27 May 2011
Keywords:hydrologymodelingwater budgetbrackish water environmentgroundwater upwellingtidal mixing zoneMIKE FLOOD
Regional index terms:South FloridaEvergladesTaylor Slough
* Corresponding author.E-mail address: [email protected] (B. Michot
0272-7714/$ e see front matter Published by Elseviedoi:10.1016/j.ecss.2011.05.018
a b s t r a c t
Taylor Slough is one of the natural freshwater contributors to Florida Bay through a network of microtidalcreeks crossing the Everglades Mangrove Ecotone Region (EMER). The EMER ecological function is criticalsince it mediates freshwater and nutrient inputs and controls the water quality in Eastern Florida Bay.Furthermore, this region is vulnerable to changing hydrodynamics and nutrient loadings as a result ofupstream freshwater management practices proposed by the Comprehensive Everglades RestorationProgram (CERP), currently the largest wetland restoration project in the USA. Despite the hydrologicalimportance of Taylor Slough in the water budget of Florida Bay, there are no fine scale (w1 km2)hydrodynamic models of this system that can be utilized as a tool to evaluate potential changes in waterflow, salinity, and water quality. Taylor River is one of the major creeks draining Taylor Slough freshwaterinto Florida Bay. We performed a water budget analysis for the Taylor River area, based on long-termhydrologic data (1999e2007) and supplemented by hydrodynamic modeling using a MIKE FLOOD(DHI, http://dhigroup.com/) model to evaluate groundwater and overland water discharges. The seasonalhydrologic characteristics are very distinctive (average Taylor River wet vs. dry season outflow was 6 to 1during 1999e2006) with a pronounced interannual variability of flow. The water budget shows a netdominance of through flow in the tidal mixing zone, while local precipitation and evapotranspirationplay only a secondary role, at least in the wet season. During the dry season, the tidal flood reaches theupstream boundary of the study area during approximately 80 days per year on average. The ground-water field measurements indicate a mostly upwards-oriented leakage, which possibly equals theevapotranspiration term. The model results suggest a high importance of groundwater contribution tothe water salinity in the EMER. The model performance is satisfactory during the dry season wheresurface flow in the area is confined to the Taylor River channel. The model also provided guidance on theimportance of capturing the overland flow component, which enters the area as sheet flow during therainy season. Overall, the modeling approach is suitable to reach better understanding of the waterbudget in the mangrove region. However, more detailed field data is needed to ascertain modelpredictions by further calibrating overland flow parameters.
Published by Elsevier Ltd.
1. Introduction
1.1. Background
Florida Bay is a critical region of an estuarine continuum thatspans from freshwater and mangrove wetlands in the upperestuary to coral reef ecosystems along the outer edge of the FloridaKeys (Fourqurean and Robblee, 1999; Rudnick et al., 1999). As
).
r Ltd.
a result of its position along this continuum water managementpractices, including changes in the timing, duration and magnitudeof freshwater flow at the head of the estuary (northern Everglades)have affected salinity patterns and nutrient loading in Florida Bay.Due to the oligotrophic nature of Florida Bay, an increase in nutrientloadings could have a detrimental effect on the productivity of theregion (Boyer et al., 2009; Briceno and Boyer, 2010). Thus, one of themajor priorities in the Comprehensive Everglades RestorationProgram (CERP), currently the largest wetland restoration project inthe USA (Sklar et al., 2005), is to determine how changes in waternet flux will be influenced by management decisions.

B. Michot et al. / Estuarine, Coastal and Shelf Science 93 (2011) 438e448 439
Taylor Slough is one of the largest natural freshwaterdeliveries toFlorida Bay through a network of microtidal creeks crossing theEvergladesMangrove Ecotone Region (EMER) (Rivera-Monroy et al.,in press). The vegetation in this zone is dominated by scrubmangroves, which encompass more than 6000 ha between thefreshwater marshes and Florida and Biscayne Bay (Simard et al.,2006). The EMER has a critical ecological role since it mediatesfreshwater and nutrient inputs and controls the water quality ofFlorida Bay (Sutula et al., 2001; Sutula et al., 2003; Childers et al.,2005). Furthermore, the EMER is not only vulnerable to changinghydrodynamics and nutrient loadings as a result of upstreamfreshwatermanagementpractices but also to sea level rise, as duringthe dry season its hydrology is dominated by tidal flow (Davis et al.,2005).
Despite the hydrological importance of Taylor Slough in thewater budget of Eastern Florida Bay, there are nofine scale (w1 km2)hydrodynamicmodels of this system that can be utilized as a tool toevaluate potential changes in water flow, salinity, and nutrientsalong the network of creeks. Thus hydrodynamicmodels are neededto help determining the potential impact of increasing freshwaterdischarge on the salt budget and nutrient cycling in Florida Bay,particularly in delivery points where high freshwater discharge hasbeen identified in the last 10 years (Hittle et al., 2001; Sutula et al.,2003). There have been a number of large-scale (>10 km2) hydro-logical studies in Taylor Slough. For example, Swain et al. (2004)developed the Southern Inland and Coastal Systems (SICS) hydro-dynamic and transportmodel (cell size305m) toevaluate impactsofanthropogenic hydrologic modifications to Taylor Slough and theEMER, especiallywith regard towater salinity values. Langevin et al.(2004) coupled a two-dimensional surface water flow model(SWIFT2D)with a 3-D-groundwater simulation code (SEAWAT) (cellsize 305 m) to represent hydrologic processes, concluding that thisapproach was well suited to predict effects of changes in thehydrologic behavior of the Taylor Slough wetlands as a result ofEverglades restoration efforts. This model was further developedinto the FTLOADDS code (Flow and Transport in a Linked Overland/Aquifer Density Dependent System) by Wang et al. (2007) andapplied to the Tides and Inflows in theMangroves of the Everglades(TIME) domain (cell size 500m). Similarly Sutula et al. (2001), usinga boxmodel approach, proposed a hydrological budget for the entireTaylor Slough and used it to develop nitrogen and phosphorusbudgets for the period 1996e1997.
Taylor River is one of five creeks discharging from Taylor Sloughinto Eastern Florida Bay (Hittle et al., 2001; Sutula et al., 2003; Daviset al., 2004). These creeks cut through an approximately 30 cm highridge following the coastline of Florida Bay, called the ButtonwoodEmbankment . This ridge is overtopped only by Florida Bay surgesduring major tropical storm events occurring with a multiannualreturn period. Under normal conditions it restricts overland flow ofwater, making the creeks point sources of freshwater input toFlorida Bay. Taylor River is currently the most intensively studiedcreek (i.e., hydrology, biogeochemical process, primary andsecondary productivity) in the region during the last 15 years (e.g.,Sutula et al., 2001). As result of long-term monitoring programs(e.g., U.S. Geological Survey (USGS), Florida Coastal Everglades-Long Term Ecological Research (FCE-LTER)) there are extensivehydrological (e. g., water stage, water flow) and water quality (e.g.,salinity, nitrogen, phosphorus) data bases allowing the develop-ment and calibration of small scale hydrodynamic and ecologicalmodels to be used asmanagement decision toolswithin the contextof CERP. The objectives of our study were:
(1) to evaluate the spatial (upstream vs. downstream) andtemporal (seasonal, annual) variation in hydrology alongTaylor River during the period 1999e2007;
(2) to develop a hydrodynamic model for this creek using theMIKE FLOOD platform (DHI, 2008):
(3) to identify the relative magnitude of groundwater exchangein the total water budget of Taylor River.
1.2. Study area
Taylor River is an approximately 4 km long small channel(10e20 m wide; 1e2 m deep) connecting a number of small,shallow ponds, which act as storage points for both nutrients andwater. The hydrology in Taylor Slough is dominated by the cyclicflooding during the neotropical wet season from June to November,during which 80% of the annual precipitation occurs (Childers et al.,2005). With the progression of the dry season, the flow concen-trates in the channel system, and parts of the Slough dry out. Thetidal mixing zone is at this time influenced by tidal flow fromFlorida Bay. During the months of March through June, the flowdirection in Taylor River changes with the tide, conveying saline Baywater into the EMER. The wind also influences the flow direction inthe channel. The karstic geology fosters groundwater leakage in thearea, driven by the prevailing hydraulic head of the infiltratingwater. According to Langevin et al. (2005), as well as documentedby the groundwater observation time series in Taylor RiverUpstream (U.S. Geological Survey, 1996e2008b), the groundwaterleakage in our study area is mostly upward (negative infiltration).The groundwater salinity is high (e.g., Fitterman and Deszcz-Pan,1999), as confirmed by the data recorded at the abovementionedstation. Surface water salinity (0e50) and groundwater salinity(12e40) along Taylor River change seasonally (U.S. GeologicalSurvey, 1996e2008a,b). Pore water salinity ranges from 1 to 46(Poret et al., 2007).
The study area encompasses a mangrove area of approximately2.5 km2 crossed by the Taylor River channel extent located betweenthe upstream (3.2 km) Taylor River gage and the Taylor River atmouth gage (hence referred to as upstream and mouth stations,installed and maintained by the USGS). Unrecorded overland flowoccurs during the rainy season across the northern, western andeastern boundaries when the water level rises above the banks ofTaylor River (e.g., Langevin et al., 2004).
2. Methods
2.1. Water budget analysis
2.1.1. Long-term water budgetWater stage, discharge and salinity recorded at the USGS
upstreamanddownstreamTaylorRiver stations fromAugust 1999 toSeptember2006were used to estimate thewater budgetof the studyarea, The equation used to calculate the general water budget is:
Qin � Qout þ P� ET� DSþ e ¼ 0 (1)
where Qin is the net channel inflow as recorded at the UpstreamTaylor River gage site (Tup), Qout is the net outflow measured atTaylor River mouth (Tm), P is the precipitation, ET the actualevapotranspiration, DS is the increase in storage volume in thestudy area, and e is the budget closure term. This term includesmeasurement and extrapolation errors as well as an estimate of theunrecorded overland sheet flowacross the flooded area boundaries,and the groundwater exchange component. To facilitate compar-ison among water budget components (e.g., precipitation, evapo-ration), river discharge units (Q, m3 s�1) were converted tomillimeters taking into account the total surface (2517 km2) of themodel area (i.e., 1 m3 s�1/2,517,000 m2 ¼ 3.973 � 10�7 m s�1 depthon the area).

Fig. 1. Study site location and Taylor River modeling area boundaries (based on DOQQ by FDEP/BSM 2004).
B. Michot et al. / Estuarine, Coastal and Shelf Science 93 (2011) 438e448440
Previous water budget studies in this region generally identifiedlow and high water flows in the dry and rainy seasons, respectively(e.g., Sutula et al., 2001). Thus, to delimit the temporal extent of theseasons, we calculated a long-term average of available water leveland precipitation data measured at the upstream Taylor Riverstation (stage regime) over the period August 1999eSeptember2007 (Fig. 2). This stage regime shows that the long-term averagewater surface elevation at Taylor upstream falls below �0.10 mbetween December and June. This elevation also constitutes theaverage water level for the period during which the tidal flow fromFlorida Bay regularly reaches beyond the Taylor upstream station,indicating low freshwater discharge. (For the period of 1999e2007,the tidal flood reached the upstream boundary of our study area
-0.3
-0.2
-0.1
0
0.1
0.2
0.3
0
50
100
150
200
250
300
Jan
Feb
Mar Ap
r
May Jun
Jul
Aug
Sept
Oct
Nov
Dec
Stag
e [m
NAV
D88
]
Prec
ipita
tion
[mm
] Data: USGS, ENP
Precipitation, gage/NEXRAD
Water Level Taylor Upstream
Water Level Taylor Mouth
Fig. 2. Taylor River stage and precipitation regime, August 1999eSeptember 2007(USGS, 1996e2008a,b; U.S. Geological Survey, 2008a,b).
during about 80 days per year on average.) We assumed that anelevation of �0.10 m can be used as the approximate water levelbelow which the surface water movement can be neglected. Theassumption about minimum water movement is supported by thebank elevation (�0.20 m) recorded during the topographic surveyconducted in November 2007. For water surface elevationsbetween�0.10 m and�0.20 m, we recognize that vegetation cover,accumulated detritus, and other microtopographic resistancefactors prevent noticeable flow. Therefore, although water levels atthe beginning and end of the rainy season are subject to a largenatural variability, for practical reasons we defined the wet periodfor this study from June 1 to November 30, and the dry season fromDecember 1 to May 31; the latter period corresponds to the long-term average phase without significant overland flow. To confirmthis seasonal partition, we evaluated the accumulated volume ofoutflowmeasured at Taylor mouth for the thus defined dry and wetseasons from December 1998 to May 2007 (Table 1). These valuesrepresent a net outflow since the inflow from Florida Bay isconsidered as negative outflow. Particularly during the dry season,water flow entering through Taylor River mouth could prevail asobserved in 2001 (negative flow balance during the dry season).Indeed, water flow is very distinct between seasons with anaverage wet vs. dry season flow ratio of 6.5:1. However, it showsa significant interannual variability (wet season outflow maximum50.8 � 106 m3 vs. minimum 19.0 � 106 m3, ratio 2.7).
Precipitation (P) was estimated using gage adjusted NEXRADradar data published by the USGS’ Everglades Depth EstimationNetwork (EDEN) (U.S. Geological Survey, 2008b). Because noprecipitation data was available for the period 1999e2001 on theUSGS Eden website, we used a spatially averaged precipitationrecorded in monitoring sites near Taylor River. These stations wereTaylor River (TR) and Little Madeira (LM), which are part of theEverglades National Park (ENP) monitoring network (South FloridaNatural Resources Center 2008). Evaporation (ET) estimates werealso retrieved from the USGS EDEN databank (U.S. Geological
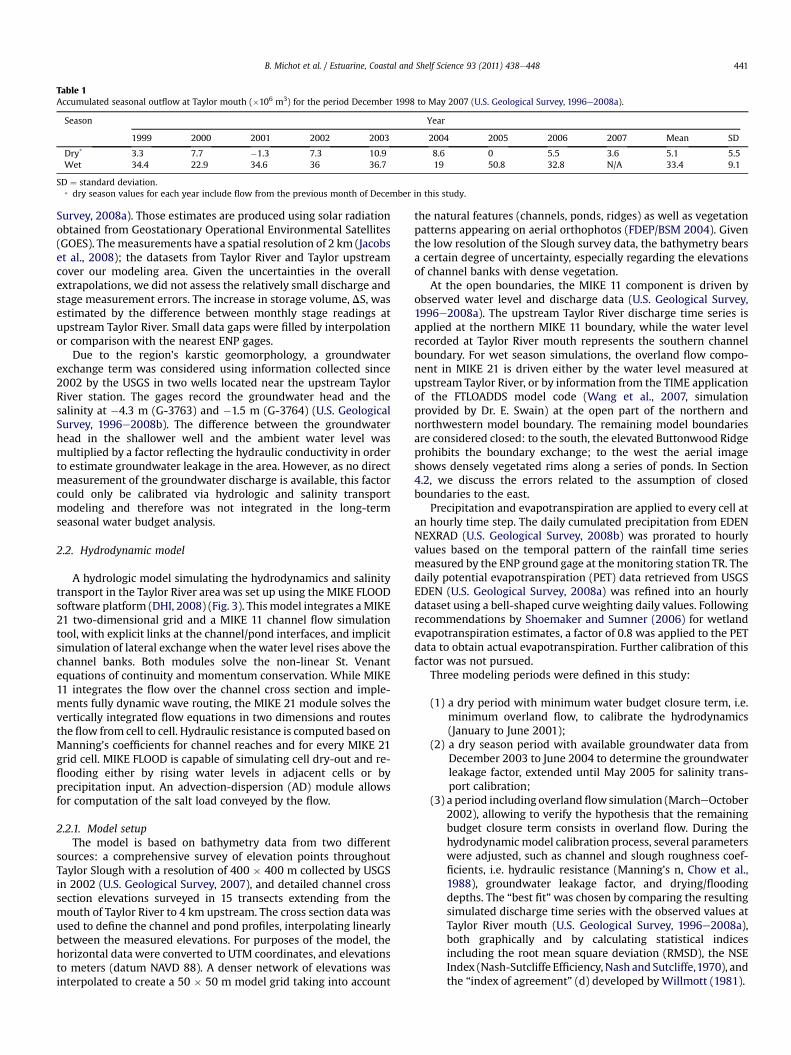
Table 1Accumulated seasonal outflow at Taylor mouth (�106 m3) for the period December 1998 to May 2007 (U.S. Geological Survey, 1996e2008a).
Season Year
1999 2000 2001 2002 2003 2004 2005 2006 2007 Mean SD
Dry* 3.3 7.7 �1.3 7.3 10.9 8.6 0 5.5 3.6 5.1 5.5Wet 34.4 22.9 34.6 36 36.7 19 50.8 32.8 N/A 33.4 9.1
SD ¼ standard deviation.* dry season values for each year include flow from the previous month of December in this study.
B. Michot et al. / Estuarine, Coastal and Shelf Science 93 (2011) 438e448 441
Survey, 2008a). Those estimates are produced using solar radiationobtained from Geostationary Operational Environmental Satellites(GOES). Themeasurements have a spatial resolution of 2 km (Jacobset al., 2008); the datasets from Taylor River and Taylor upstreamcover our modeling area. Given the uncertainties in the overallextrapolations, we did not assess the relatively small discharge andstage measurement errors. The increase in storage volume, DS, wasestimated by the difference between monthly stage readings atupstream Taylor River. Small data gaps were filled by interpolationor comparison with the nearest ENP gages.
Due to the region’s karstic geomorphology, a groundwaterexchange term was considered using information collected since2002 by the USGS in two wells located near the upstream TaylorRiver station. The gages record the groundwater head and thesalinity at �4.3 m (G-3763) and �1.5 m (G-3764) (U.S. GeologicalSurvey, 1996e2008b). The difference between the groundwaterhead in the shallower well and the ambient water level wasmultiplied by a factor reflecting the hydraulic conductivity in orderto estimate groundwater leakage in the area. However, as no directmeasurement of the groundwater discharge is available, this factorcould only be calibrated via hydrologic and salinity transportmodeling and therefore was not integrated in the long-termseasonal water budget analysis.
2.2. Hydrodynamic model
A hydrologic model simulating the hydrodynamics and salinitytransport in the Taylor River area was set up using the MIKE FLOODsoftware platform (DHI, 2008) (Fig. 3). This model integrates aMIKE21 two-dimensional grid and a MIKE 11 channel flow simulationtool, with explicit links at the channel/pond interfaces, and implicitsimulation of lateral exchange when the water level rises above thechannel banks. Both modules solve the non-linear St. Venantequations of continuity and momentum conservation. While MIKE11 integrates the flow over the channel cross section and imple-ments fully dynamic wave routing, the MIKE 21 module solves thevertically integrated flow equations in two dimensions and routesthe flow from cell to cell. Hydraulic resistance is computed based onManning’s coefficients for channel reaches and for every MIKE 21grid cell. MIKE FLOOD is capable of simulating cell dry-out and re-flooding either by rising water levels in adjacent cells or byprecipitation input. An advection-dispersion (AD) module allowsfor computation of the salt load conveyed by the flow.
2.2.1. Model setupThe model is based on bathymetry data from two different
sources: a comprehensive survey of elevation points throughoutTaylor Slough with a resolution of 400 � 400 m collected by USGSin 2002 (U.S. Geological Survey, 2007), and detailed channel crosssection elevations surveyed in 15 transects extending from themouth of Taylor River to 4 km upstream. The cross section data wasused to define the channel and pond profiles, interpolating linearlybetween the measured elevations. For purposes of the model, thehorizontal data were converted to UTM coordinates, and elevationsto meters (datum NAVD 88). A denser network of elevations wasinterpolated to create a 50 � 50 m model grid taking into account
the natural features (channels, ponds, ridges) as well as vegetationpatterns appearing on aerial orthophotos (FDEP/BSM 2004). Giventhe low resolution of the Slough survey data, the bathymetry bearsa certain degree of uncertainty, especially regarding the elevationsof channel banks with dense vegetation.
At the open boundaries, the MIKE 11 component is driven byobserved water level and discharge data (U.S. Geological Survey,1996e2008a). The upstream Taylor River discharge time series isapplied at the northern MIKE 11 boundary, while the water levelrecorded at Taylor River mouth represents the southern channelboundary. For wet season simulations, the overland flow compo-nent in MIKE 21 is driven either by the water level measured atupstream Taylor River, or by information from the TIME applicationof the FTLOADDS model code (Wang et al., 2007, simulationprovided by Dr. E. Swain) at the open part of the northern andnorthwestern model boundary. The remaining model boundariesare considered closed: to the south, the elevated Buttonwood Ridgeprohibits the boundary exchange; to the west the aerial imageshows densely vegetated rims along a series of ponds. In Section4.2, we discuss the errors related to the assumption of closedboundaries to the east.
Precipitation and evapotranspiration are applied to every cell atan hourly time step. The daily cumulated precipitation from EDENNEXRAD (U.S. Geological Survey, 2008b) was prorated to hourlyvalues based on the temporal pattern of the rainfall time seriesmeasured by the ENP ground gage at themonitoring station TR. Thedaily potential evapotranspiration (PET) data retrieved from USGSEDEN (U.S. Geological Survey, 2008a) was refined into an hourlydataset using a bell-shaped curveweighting daily values. Followingrecommendations by Shoemaker and Sumner (2006) for wetlandevapotranspiration estimates, a factor of 0.8 was applied to the PETdata to obtain actual evapotranspiration. Further calibration of thisfactor was not pursued.
Three modeling periods were defined in this study:
(1) a dry period with minimum water budget closure term, i.e.minimum overland flow, to calibrate the hydrodynamics(January to June 2001);
(2) a dry season period with available groundwater data fromDecember 2003 to June 2004 to determine the groundwaterleakage factor, extended until May 2005 for salinity trans-port calibration;
(3) a period including overland flowsimulation (MarcheOctober2002), allowing to verify the hypothesis that the remainingbudget closure term consists in overland flow. During thehydrodynamic model calibration process, several parameterswere adjusted, such as channel and slough roughness coef-ficients, i.e. hydraulic resistance (Manning’s n, Chow et al.,1988), groundwater leakage factor, and drying/floodingdepths. The “best fit”was chosen by comparing the resultingsimulated discharge time series with the observed values atTaylor River mouth (U.S. Geological Survey, 1996e2008a),both graphically and by calculating statistical indicesincluding the root mean square deviation (RMSD), the NSEIndex (Nash-Sutcliffe Efficiency, Nash and Sutcliffe,1970), andthe “index of agreement” (d) developed by Willmott (1981).
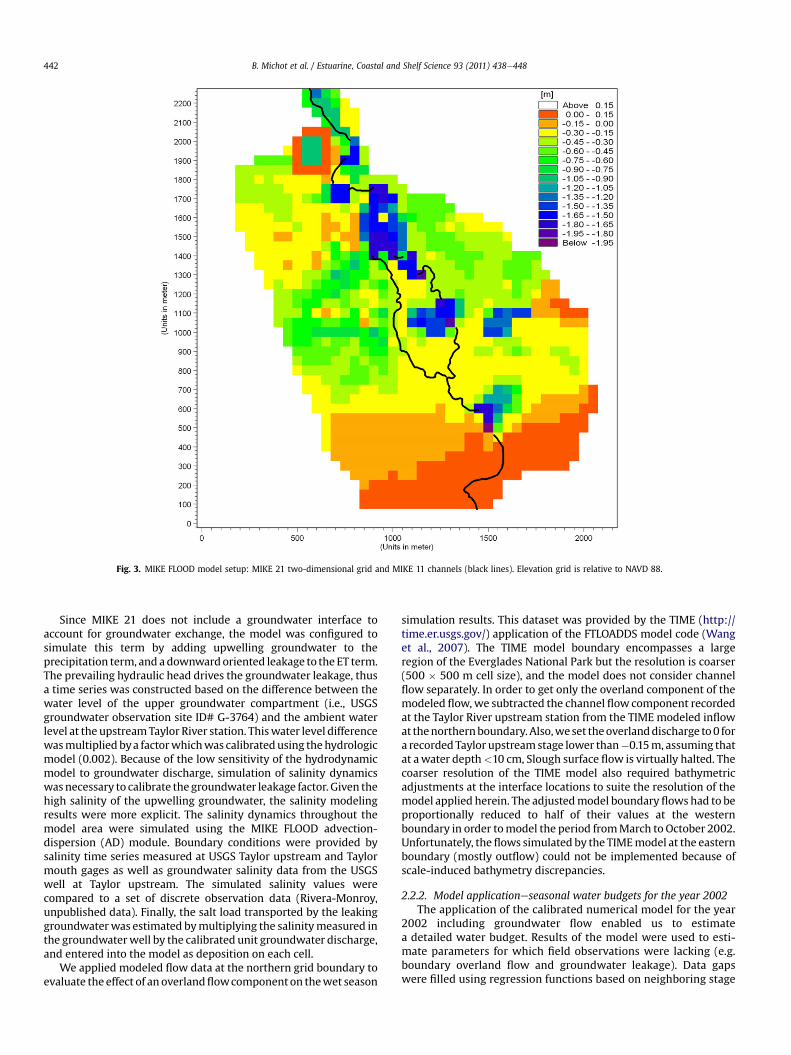
Fig. 3. MIKE FLOOD model setup: MIKE 21 two-dimensional grid and MIKE 11 channels (black lines). Elevation grid is relative to NAVD 88.
B. Michot et al. / Estuarine, Coastal and Shelf Science 93 (2011) 438e448442
Since MIKE 21 does not include a groundwater interface toaccount for groundwater exchange, the model was configured tosimulate this term by adding upwelling groundwater to theprecipitation term, and adownwardoriented leakage to the ET term.The prevailing hydraulic head drives the groundwater leakage, thusa time series was constructed based on the difference between thewater level of the upper groundwater compartment (i.e., USGSgroundwater observation site ID# G-3764) and the ambient waterlevel at the upstreamTaylor River station. Thiswater level differencewasmultiplied bya factorwhichwas calibratedusing thehydrologicmodel (0.002). Because of the low sensitivity of the hydrodynamicmodel to groundwater discharge, simulation of salinity dynamicswasnecessary to calibrate the groundwater leakage factor. Given thehigh salinity of the upwelling groundwater, the salinity modelingresults were more explicit. The salinity dynamics throughout themodel area were simulated using the MIKE FLOOD advection-dispersion (AD) module. Boundary conditions were provided bysalinity time series measured at USGS Taylor upstream and Taylormouth gages as well as groundwater salinity data from the USGSwell at Taylor upstream. The simulated salinity values werecompared to a set of discrete observation data (Rivera-Monroy,unpublished data). Finally, the salt load transported by the leakinggroundwaterwas estimated bymultiplying the salinitymeasured inthe groundwaterwell by the calibrated unit groundwater discharge,and entered into the model as deposition on each cell.
We applied modeled flow data at the northern grid boundary toevaluate the effect of an overlandflowcomponenton thewet season
simulation results. This dataset was provided by the TIME (http://time.er.usgs.gov/) application of the FTLOADDS model code (Wanget al., 2007). The TIME model boundary encompasses a largeregion of the Everglades National Park but the resolution is coarser(500 � 500 m cell size), and the model does not consider channelflow separately. In order to get only the overland component of themodeled flow,we subtracted the channel flow component recordedat the Taylor River upstream station from the TIME modeled inflowat thenorthernboundary. Also,weset theoverlanddischarge to0 fora recorded Taylor upstreamstage lower than�0.15m, assuming thatat awater depth<10 cm, Slough surface flow is virtually halted. Thecoarser resolution of the TIME model also required bathymetricadjustments at the interface locations to suite the resolution of themodel applied herein. The adjustedmodel boundaryflows had to beproportionally reduced to half of their values at the westernboundary in order tomodel the period fromMarch toOctober 2002.Unfortunately, theflows simulated by the TIMEmodel at the easternboundary (mostly outflow) could not be implemented because ofscale-induced bathymetry discrepancies.
2.2.2. Model applicationeseasonal water budgets for the year 2002The application of the calibrated numerical model for the year
2002 including groundwater flow enabled us to estimatea detailed water budget. Results of the model were used to esti-mate parameters for which field observations were lacking (e.g.boundary overland flow and groundwater leakage). Data gapswere filled using regression functions based on neighboring stage
-20,000
-15,000
-10,000
-5,000
0
5,000
10,000
15,000
20,000
25,000
Aug-
Nov
199
9
Dec
99
-May
00
Jun-
Nov
200
0
Dec
00
-May
01
Jun-
Nov
200
1
Dec
01
-May
02
Jun-
Nov
200
2
Dec
02
-May
03
Jun-
Nov
200
3
Dec
03
-May
04
Jun-
Nov
200
4
Dec
04
-May
05
Jun-
Nov
200
5
Dec
06
-May
06
Jun-
Sep
2006
[mm] Q in - Q out (data USGS)P-ETP (data ENP, USGS)budget closure term -(Qin+P-ET-Qout-ΔS)
Fig. 4. Taylor River seasonal water budget; dry season is from December to May and wet season from JuneeNovember (USGS, 1996e2008a,b; U.S. Geological Survey, 2008a,b).
B. Michot et al. / Estuarine, Coastal and Shelf Science 93 (2011) 438e448 443
datasets. For comparison purposes, the flow terms were convertedto areal depths (mm, see Section 2.1.1). We subdivided the annualdata into two periods: January through mid-June 2002, andmid-June to the end of December 2002 to properly render dry andwet conditions.
3. Results
3.1. Long-term water budget
The comparison of precipitation and stage regimes (Fig. 2)reveals a shift between rainfall and runoff characteristics. Althoughthe rainy season ends in OctobereNovember, the EMER in theTaylor Slough region does not dry out significantly until January. Incontrast, at the beginning of the rainy season, the peat layer in theSlough first absorbs the rainwater, before excess water accumulatesto flow down to Florida Bay.
The water budget estimated for the period 1999e2006 indicatesa strong seasonality of the budget closure term e, as well as for the
-4
-3
-2
-1
0
1
2
Jan-
2001
Feb-
2001
Mar
-200
1
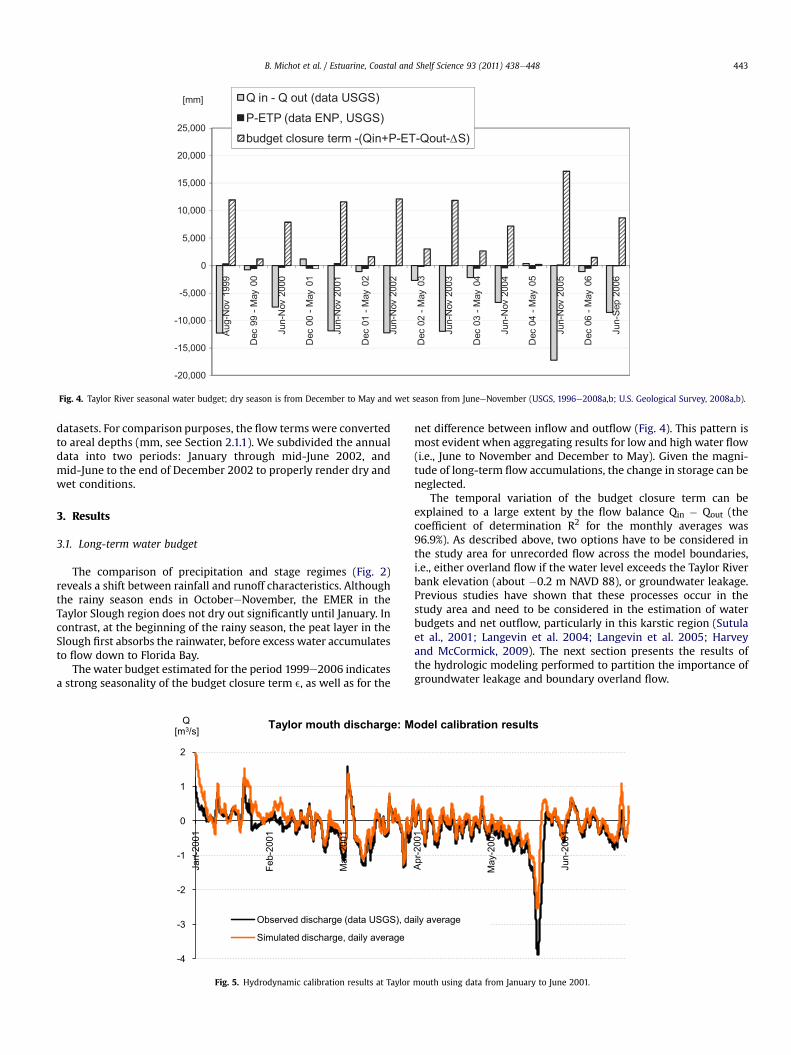
Q[m3/s] Taylor mouth discharge: M
Observed discharge (data USGS), da
Simulated discharge, daily average
Fig. 5. Hydrodynamic calibration results at Taylor
net difference between inflow and outflow (Fig. 4). This pattern ismost evident when aggregating results for low and high water flow(i.e., June to November and December to May). Given the magni-tude of long-term flow accumulations, the change in storage can beneglected.
The temporal variation of the budget closure term can beexplained to a large extent by the flow balance Qin � Qout (thecoefficient of determination R2 for the monthly averages was96.9%). As described above, two options have to be considered inthe study area for unrecorded flow across the model boundaries,i.e., either overland flow if the water level exceeds the Taylor Riverbank elevation (about �0.2 m NAVD 88), or groundwater leakage.Previous studies have shown that these processes occur in thestudy area and need to be considered in the estimation of waterbudgets and net outflow, particularly in this karstic region (Sutulaet al., 2001; Langevin et al. 2004; Langevin et al. 2005; Harveyand McCormick, 2009). The next section presents the results ofthe hydrologic modeling performed to partition the importance ofgroundwater leakage and boundary overland flow.
Apr-2
001
May
-200
1
Jun-
2001
odel calibration results
ily average
mouth using data from January to June 2001.
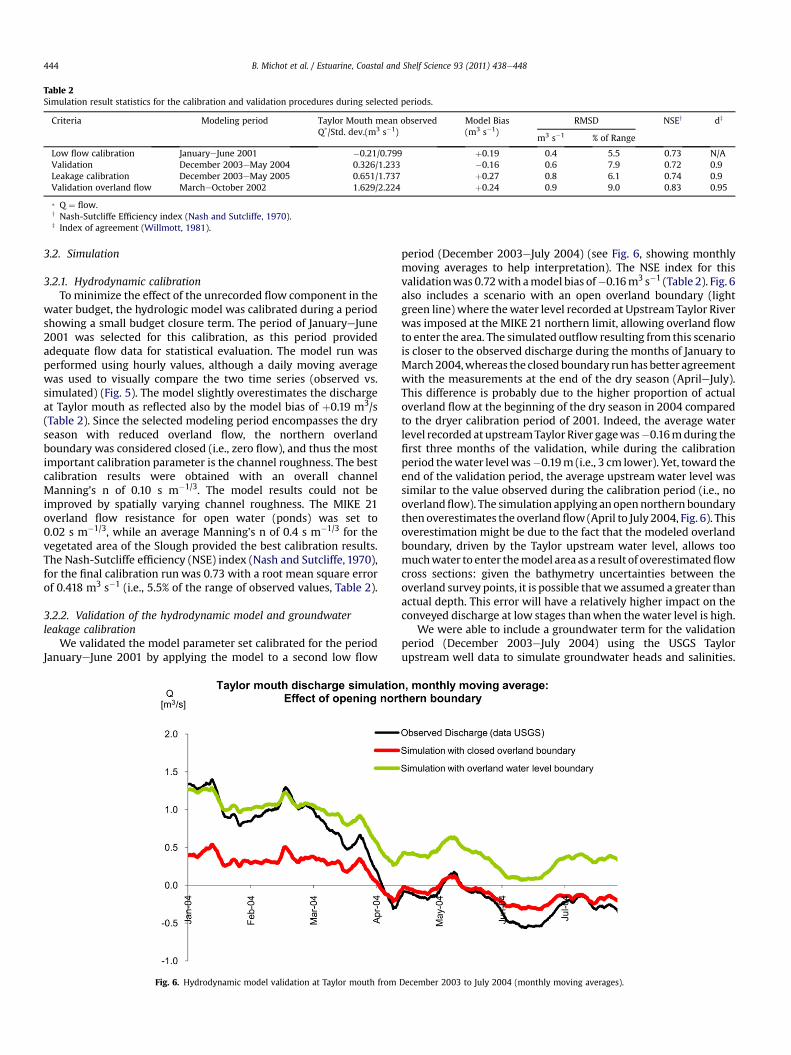
Table 2Simulation result statistics for the calibration and validation procedures during selected periods.
Criteria Modeling period Taylor Mouth mean observedQ*/Std. dev.(m3 s�1)
Model Bias(m3 s�1)
RMSD NSEy dz
m3 s�1 % of Range
Low flow calibration JanuaryeJune 2001 �0.21/0.799 þ0.19 0.4 5.5 0.73 N/AValidation December 2003eMay 2004 0.326/1.233 �0.16 0.6 7.9 0.72 0.9Leakage calibration December 2003eMay 2005 0.651/1.737 þ0.27 0.8 6.1 0.74 0.9Validation overland flow MarcheOctober 2002 1.629/2.224 þ0.24 0.9 9.0 0.83 0.95
* Q ¼ flow.y Nash-Sutcliffe Efficiency index (Nash and Sutcliffe, 1970).z Index of agreement (Willmott, 1981).
B. Michot et al. / Estuarine, Coastal and Shelf Science 93 (2011) 438e448444
3.2. Simulation
3.2.1. Hydrodynamic calibrationTo minimize the effect of the unrecorded flow component in the
water budget, the hydrologic model was calibrated during a periodshowing a small budget closure term. The period of JanuaryeJune2001 was selected for this calibration, as this period providedadequate flow data for statistical evaluation. The model run wasperformed using hourly values, although a daily moving averagewas used to visually compare the two time series (observed vs.simulated) (Fig. 5). The model slightly overestimates the dischargeat Taylor mouth as reflected also by the model bias of þ0.19 m3/s(Table 2). Since the selected modeling period encompasses the dryseason with reduced overland flow, the northern overlandboundary was considered closed (i.e., zero flow), and thus the mostimportant calibration parameter is the channel roughness. The bestcalibration results were obtained with an overall channelManning’s n of 0.10 s m�1/3. The model results could not beimproved by spatially varying channel roughness. The MIKE 21overland flow resistance for open water (ponds) was set to0.02 s m�1/3, while an average Manning’s n of 0.4 s m�1/3 for thevegetated area of the Slough provided the best calibration results.The Nash-Sutcliffe efficiency (NSE) index (Nash and Sutcliffe, 1970),for the final calibration run was 0.73 with a root mean square errorof 0.418 m3 s�1 (i.e., 5.5% of the range of observed values, Table 2).
3.2.2. Validation of the hydrodynamic model and groundwaterleakage calibration
We validated the model parameter set calibrated for the periodJanuaryeJune 2001 by applying the model to a second low flow
Fig. 6. Hydrodynamic model validation at Taylor mouth from
period (December 2003eJuly 2004) (see Fig. 6, showing monthlymoving averages to help interpretation). The NSE index for thisvalidationwas 0.72with amodel bias of�0.16m3 s�1 (Table 2). Fig. 6also includes a scenario with an open overland boundary (lightgreen line) where thewater level recorded at Upstream Taylor Riverwas imposed at the MIKE 21 northern limit, allowing overland flowto enter the area. The simulated outflow resulting from this scenariois closer to the observed discharge during the months of January toMarch2004,whereas the closedboundary runhas better agreementwith the measurements at the end of the dry season (AprileJuly).This difference is probably due to the higher proportion of actualoverland flow at the beginning of the dry season in 2004 comparedto the dryer calibration period of 2001. Indeed, the average waterlevel recorded at upstreamTaylor River gagewas�0.16mduring thefirst three months of the validation, while during the calibrationperiod thewater level was�0.19m (i.e., 3 cm lower). Yet, toward theend of the validation period, the average upstream water level wassimilar to the value observed during the calibration period (i.e., nooverlandflow). The simulation applying anopennorthern boundarythen overestimates the overlandflow (April to July 2004, Fig. 6). Thisoverestimation might be due to the fact that the modeled overlandboundary, driven by the Taylor upstream water level, allows toomuchwater to enter themodel area as a result of overestimatedflowcross sections: given the bathymetry uncertainties between theoverland survey points, it is possible thatwe assumed a greater thanactual depth. This error will have a relatively higher impact on theconveyed discharge at low stages thanwhen the water level is high.
We were able to include a groundwater term for the validationperiod (December 2003eJuly 2004) using the USGS Taylorupstream well data to simulate groundwater heads and salinities.
December 2003 to July 2004 (monthly moving averages).
0
10
20
30
40
50
60
Dec-03 Mar-04 May-04 Aug-04 Nov-04 Feb-05 May-05
[ppt]
Taylor River AD model:
simulated salinity in Pond 3, point 26
measured salinity, data Rivera-MonroySimulation with GW leakage factor 0.002
Fig. 7. Salinity simulation in Pond #3 located along Taylor River. Model simulationencompasses the period from December 2003 to May 2005.
B. Michot et al. / Estuarine, Coastal and Shelf Science 93 (2011) 438e448 445
The best fit for the leakage factor could not be achieved based onhydrodynamic considerations only. Thus, we used the AD salinitysimulations to guide the calibration of this parameter. In order toincrease reliability of the simulation results, the modeling periodwas extended until May 2005 to include all the available salinityobservation data (Rivera-Monroy, unpublished data). Dispersionwas assumed to be 5 m2 s�1 as recommended in the MIKE 21manual (DHI 2008). This value could not be calibrated due to thescarcity of salinity field measurements in the overland mangrovearea. Thus, calibration was performed graphically, as the smallnumber of observed data did not allow for statistical interpretation.The best calibration result for the period from December 2003 toMay 2005 was achieved by applying the Taylor mouth discharge atthe southern boundary of the MIKE 11 model channel, anda groundwater leakage factor of 0.002.
We assessed the salinity differences between observed andsimulation data at the locations where discrete seasonalmeasurements were available for the years 2003e2005 (Rivera-Monroy, unpublished data). Fig. 7 shows the discrete observationdata and the simulated salinity at Pond #3 located in the center ofthe modeling area (see Fig. 1). The overall pattern of salinitydynamics is well captured by the model. Additional salinity
-6
-4
-2
0
2
4
6
8
10
Mar
-02
Apr-0
2
May
-02
Jun-
02
Q
Taylor mouth discharge, daily average
Precipitation (average ENP-TR aObserved discharge, daily averagSimulated discharge with water leSimulated discharge using TIME
Fig. 8. Overland flow simulations in the Taylor Riv
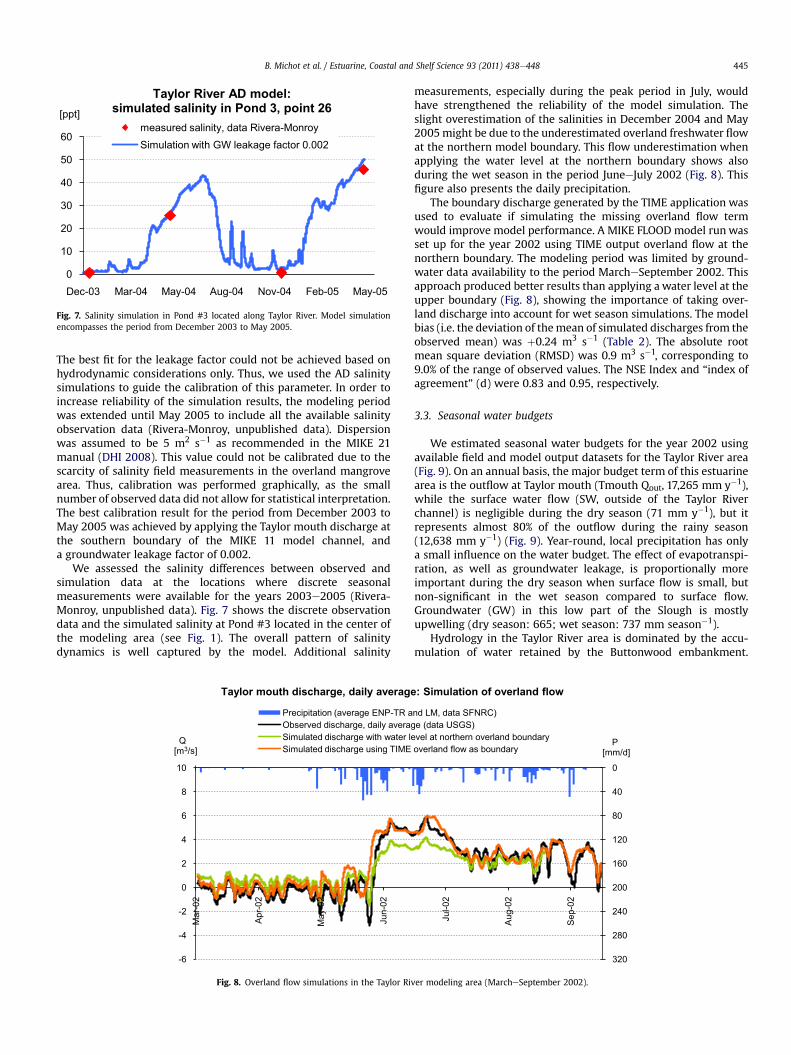
measurements, especially during the peak period in July, wouldhave strengthened the reliability of the model simulation. Theslight overestimation of the salinities in December 2004 and May2005might be due to the underestimated overland freshwater flowat the northern model boundary. This flow underestimation whenapplying the water level at the northern boundary shows alsoduring the wet season in the period JuneeJuly 2002 (Fig. 8). Thisfigure also presents the daily precipitation.
The boundary discharge generated by the TIME application wasused to evaluate if simulating the missing overland flow termwould improve model performance. A MIKE FLOOD model run wasset up for the year 2002 using TIME output overland flow at thenorthern boundary. The modeling period was limited by ground-water data availability to the period MarcheSeptember 2002. Thisapproach produced better results than applying a water level at theupper boundary (Fig. 8), showing the importance of taking over-land discharge into account for wet season simulations. The modelbias (i.e. the deviation of themean of simulated discharges from theobserved mean) was þ0.24 m3 s�1 (Table 2). The absolute rootmean square deviation (RMSD) was 0.9 m3 s�1, corresponding to9.0% of the range of observed values. The NSE Index and “index ofagreement” (d) were 0.83 and 0.95, respectively.
3.3. Seasonal water budgets
We estimated seasonal water budgets for the year 2002 usingavailable field and model output datasets for the Taylor River area(Fig. 9). On an annual basis, the major budget term of this estuarinearea is the outflow at Taylor mouth (Tmouth Qout, 17,265 mm y�1),while the surface water flow (SW, outside of the Taylor Riverchannel) is negligible during the dry season (71 mm y�1), but itrepresents almost 80% of the outflow during the rainy season(12,638 mm y�1) (Fig. 9). Year-round, local precipitation has onlya small influence on the water budget. The effect of evapotranspi-ration, as well as groundwater leakage, is proportionally moreimportant during the dry season when surface flow is small, butnon-significant in the wet season compared to surface flow.Groundwater (GW) in this low part of the Slough is mostlyupwelling (dry season: 665; wet season: 737 mm season�1).
Hydrology in the Taylor River area is dominated by the accu-mulation of water retained by the Buttonwood embankment.
0
40
80
120
160
200
240
280
320
Jul-0
2
Aug-
02
Sep-
02
P[mm/d]
: Simulation of overland flow
nd LM, data SFNRC)e (data USGS)vel at northern overland boundary
overland flow as boundary
er modeling area (MarcheSeptember 2002).

dry season: January – mid-June 2002 wet season: mid-June - December 2002
P = Precipitation from EDEN NEXRAD, average of Upstream Taylor River and Taylor Mouth data
ET = 80% of the Potential Evapotranspiration as given on the USGS Eden website for Taylor Upstream
SW = Surface water overland flow as simulated by Eric Swain's model, calibrated with MF model
Tup Qin = Cumulated measured discharge at USGS Upstream Taylor River gage, in mm/season
Tmouth Qout = Cumulated measured discharge at USGS Taylor River at Mouth gage, in mm/season
GW leak = Groundwater leakage estimate based on difference between GW head and stage at
Tupstream, calibrated with Mike Flood (DHI 2008) AD model
ΔS = Change in storage in the area, estimated by the stage difference at the beginning/end of the period
ε = P+ET+Tup+SW+GW+Tmouth+ΔS = Budget closure term
P ET
266 -559
Tup Qin ΔS -139
1,155 Tmouth Qout
SW Qin ε = -1,365
71
GW leak 665
94
P ET
715 -649
Tup Qin ΔS 151
2,649 Tmouth Qout
SW Qin ε = -15,900
12,638
GW leak 737
341
a b
Fig. 9. Taylor River cumulated water flow (mm/season). Direction of arrows indicates flow direction; positive and negative values indicate input and output, respectively. Arrow sizeis proportional to flow and weighted separately for each season.
B. Michot et al. / Estuarine, Coastal and Shelf Science 93 (2011) 438e448446
Water from a large part of the Slough converges at Taylor Rivermouth where it flows into Eastern Florida Bay. Thus, the waterinput through surfacewater in our modeling area is large relative toprecipitation. In this budget scheme, the budget closure term, e,includes a seasonal balance of all error terms. This term repre-sents �6.9% and �2.1% of the observed outflow at Taylor mouthduring the dry and wet seasons, respectively.
4. Discussion
4.1. Sensitivity analysis
Given the assumptions included in the model setup (e.g.,interpolated bathymetry data, gaps in the boundary conditions) aswell as the scarcity of field data to adequately calibrate themodel, itwas not possible to quantify the error affecting the water budgets.In order to estimate the variability of the different terms, and theoverall uncertainty of the modeling results, we performed a sensi-tivity analysis on the simulated discharge at Taylor mouth. Belowwe discuss eachmodel component uncertainty in the context of thehydrodynamic model performance.
Bathymetry. We investigated the uncertainty in the elevationdata interpolated for the slough area between the surveyed400� 400m elevation points. To evaluate the impact of bathymetryerrors, the elevation of the entiremodel domainwas raised by 0.1m,and then lowered by 0.2 m. The NSE model efficiency index lost 6%for the first scenario and 11% for the second (from0.79 itwent downto 0.74, then to 0.70). The impact of bathymetry errors is especiallyimportant during the lowflowseason, the influence being relativelysmaller as the water level rises. No sensitivity analysis has beenperformed for the channel profile, as the cross sections in theoutflow branch were well surveyed in their deepest regions. Onemodel run was performed with a reduced channel width in thelowermost creek branch, the results were almost identical.
Evapotranspiration (ET). Reducing the potential evapotranspi-ration (PET) rate by 25% (from 80% of the PET to 60%) showed thatthe sensitivity of the hydrodynamic model results to this term(expressed as Taylor mouth discharge) is small. The NSE indexchanged only by 0.002 points (i.e., from 0.812 to 0.814). A fine-tuning of the correction factor to be applied for calculating
actual ET from PET was not feasible under those conditions.However, especially for long-term simulations, the rate of evapo-transpiration seems to have a more noticeable impact on salinityof water overlying wetlands. As no salinity measurements in thevegetated area outside of channels or ponds are available, nostatistics could be calculated to evaluate the model performance inthose areas.
Precipitation. Another error source is the uncertainty of theprecipitation input, as there was no rain gage located inside themodeling area. However, changing the precipitation input fromgage data to the NEXRAD radar data (the two datasets showinga correlation coefficient of 85%) did not have a measurable effect onthe simulation results, showing the low model sensitivity toprecipitation. This result was expected given the small contributionof direct rainfall to the water budget (Fig. 9).
Roughness. The sensitivity of the modeled discharge at Taylormouth to the value of the channel roughness coefficient is highlysignificant since changing the channelManning’s n from0.15 sm�1/
3 to 0.10 s m�1/3 improved the NSE Index by more than 10%. Swainet al. (2004) measured flow velocity and estimated a value ofn ¼ 0.121 s m�1/3 (SD � 0.078 s m�1/3) using Manning’s formula.The SICS model calibration resulted in a value of 0.152 s m�1/3, butthis model does not consider channel flow separately. Thus, SICS’Manning’s n reflects an average between channel and overlandflow roughness.
In contrast, the sensitivity of our hydrodynamic model tooverland flow resistance was low, as changing the overlandManning’s n from 0.4 s m�1/3 to 0.45 s m�1/3 had almost no effecton the model efficiency even when the water level was high. Thus,no distinction was made between different vegetation covers.Swain et al. (2004) used a value of 0.43 s m�1/3 for sawgrass and0.38 s m�1/3 for rush/sawgrass. We did not find publishedManning’s n estimates for mangrove wetlands, which is thedominant vegetation in our model area.
Groundwater Leakage. Since no groundwater level time serieswere available for the model calibration period (JanuaryeJune2001), the first model validation (December 2003eJuly 2004) wasperformed without groundwater component, yielding a RMSE of8.1%. After calibration of the groundwater leakage factor using theAD simulation, the RMSE was reduced to 7.9%, while the NSE index

B. Michot et al. / Estuarine, Coastal and Shelf Science 93 (2011) 438e448 447
improved from 0.71 to 0.72. The AD model is more sensitive to theleakage factor as groundwater contributes a significant amount tothe salt budget within the model domain. However, no statisticscould be calculated for the AD simulations, given the scarcity of thefield observations available for calibration. Therefore, the evalua-tion relied on graphical inspection. The MIKE 21 AD module doesnot account for salt deposition on dry cells. This feature introducedan error since groundwater upwelling adds salt to cells that may beinitially dry. However, our analysis indicates that this error is notsignificant.
Boundary Overland flow. The largest modeling error is certainlyinduced by the unknown boundary overland flow term. For theDecember 2003eMay 2005 simulation, the model results weresignificantly impacted when an estimated boundary overland flowwas introduced. The RMSE improved from 8.3% to 6.1% while theNSE index improved from 0.52 to 0.74. We strongly recommendgathering field measurements of boundary overland flow consid-ering that it is the largest term in the water budget during the wetseason.
4.2. Relative importance of the overland flow component
Due to the spatial resolution of the elevation survey used tobuild our model grid at the landscape level, local topographicfeatures are missing and are not captured by the numerical model.In addition, since field measurements of overland flow velocitiesare not available, an overland upstream stage was imposed. Thus,errors in the marsh elevation would translate into an error in thevolume of overland flow entering the model domain. During sixmonths per year the water level is above �0.15 m (Fig. 2). Thiswater level exceeds the channel banks and inundates the wetlandareas. To correctly reproduce the regional flow dynamics, a moredetailed bathymetry survey is needed, especially at the modeldomain boundary locations. Water flow or at least stage recordingsat crucial boundary limits would enhance our understanding ofhydroperiod and hydrodynamics in the region.
The model only considers through-flow at the northern andnorthwestern boundary, while the results of the flow modeldeveloped by Langevin et al. (2004) show also lateral flow in theeastern part of our modeling area. An attempt to apply a flow timeseries simulated by the TIME model (Wang et al., 2007) at theeastern boundary was not successful due to the bathymetricdiscrepancies between the two models. However, observation ofnatural features in the area, as well as modeling results withobserved discharges applied at both Taylor upstream and mouth(causing the water level in the modeling area to rise above themeasured values) suggest that water might indeed leave the area insome part of the overland boundary.
4.3. Magnitude of the groundwater component
We used the USGS Upstream Taylor River groundwater leveltime series to estimate the groundwater contribution. It is over-reaching to consider one single observation point as representativefor the whole area, particularly in a karstic environment as in thecase of Taylor River. However, in absence of groundwater dischargedata (e.g. Price et al., 2006), this method is the only availablealternative. The best simulation result e with a leakage factorof 0.002 e yielded an average daily groundwater upwellingof 3.6 mm d�1 during the record period of December2003eSeptember 2007, with a maximum value of 7.9 mm d�1 onJanuary 18, 2005, and a minimum value of �0.3 mm d�1 (down-ward leakage) on June 1, 2004. Langevin et al. (2004) performeda regional hydrologic numerical simulation including surfacewater/groundwater exchange and determined an average
upwelling leakage of 0.9 mm d�1 in the vicinity of the Florida Bayfor the period 1996e2002.
4.4. Reverse flow component at the mouth of Taylor River
The hydrodynamic model often underestimates the reverse(i.e., negative ¼ flow in the upstream direction) discharge peaks atTaylor mouth (e.g. Fig. 6, in May 2001). It appears that during floodtide, when the Bay water enters Taylor River and flows north, themodel underestimates the absolute flow value. This underesti-mation is the result of the water level applied at this boundary,which does not reflect the convective acceleration term pushingthe flow upstream (as current or wind friction). This causes themodel to underestimate the volume of water pushed inlandthrough the river mouth. Sutula et al. (2003) analyzed the influ-ence of wind-driven forcing on flow direction in tidal creekscutting through the coastal ridge into Florida Bay and showed theinfluence of wind on creek discharges. Langevin et al. (2004) alsopointed out the importance of wind friction, especially for salinitymodeling. A graphical comparison of our simulation results withwind direction data measured at Joe Bay, about 10 km to the east(South Florida Natural Resources Center (SFNRC), 2008), showedthe influence of wind direction on channel discharge. Since theTaylor River estuary is roughly oriented in a NeS direction,southern winds from about 180� � 45� would induce upstreamflow. All the upstream flow peaks corresponded to southernwind events.
An attempt was made to include the wind effect into the modelsimulation, but the effect within the modeling area is not sufficient.Two approaches can be evaluated in the future to overcome thisproblem; one is to expand themodel domain to include a portion ofFlorida Bay. However, this approach would require a bathymetricsurvey of the bay. Another approach is to impose the observedTaylor mouth discharge time series as a boundary condition, anduse interior monitoring stations for calibration. This option willrequire installing additional continuous monitoring stations forstage, salinity, and nutrient concentrations.
5. Conclusion
We analyzed hydrologic data available in the Taylor River areafrom 1999 to 2007 to estimate a water budget for the modeldomain and develop a hydrodynamic model. A water budgetanalysis for this system showed that although the rainy seasonends in OctobereNovember, the mangrove ecotone zone does notdry out significantly until January. This seasonal pattern isprimarily because the predominant groundwater head, the debrislayer impeding drainage, and the water retention by the Button-wood Ridge prevent a faster dry-out. In contrast, at the beginningof the rainy season, the peat layer in the Slough first absorbs therainwater, before excess water accumulates to flow down toFlorida Bay. The seasonal hydrologic characteristics are verydistinctive (average Taylor River wet vs. dry season outflow was 6to 1 during 1999e2006) with a pronounced interannual variabilityof flow.
The water budget analysis of channel discharge data collectedbetween 1999 and 2006 by the USGS in the Taylor River was sup-plemented by a hydrologic modeling effort to determine ground-water and overland flow contributions. The water budget showsa net dominance of through flow in the tidal mixing zone, whilelocal precipitation and evapotranspiration play only a secondaryrole, at least in thewet season. The groundwater well data indicatesa mostly upwards-oriented leakage, which possibly equals theevapotranspiration term. This finding resulted from the hydrologicsimulation of water and salt dynamics in the area. While the

B. Michot et al. / Estuarine, Coastal and Shelf Science 93 (2011) 438e448448
groundwater term is negligible for the hydrodynamics on an annualbasis, its contribution to the salinity of the area is significant giventhe high salt concentrations of the upwelling groundwater.
The model performance is satisfactory during the dry seasonwhere surface flow in the area is confined to the Taylor Riverchannel. The model also provided guidance on the importance ofcapturing the overland flow component, which enters the area assheet flow during the rainy season. Nesting the local model pre-sented hereinwith regional hydrologic models improved themodelresults during the wet season, showing the ability of this model tocorrectly capture the hydrodynamic processes in the area providedthat accurate boundary data is available. In order to modelconstituent dynamics in this tidal mixing zone with greater degreeof certainty, we recommend gathering detailed field information onoverland flow discharges, as well as on salinity and nutrientconcentrations in the mangrove wetland region. This samplingapproach will allow for a thorough calibration of numerical modelsthat can be used to assess various hydrological restorationscenarios and water management strategies.
Role of the funding source
The South Florida Water Management District (PO No.450001265) supported this study.
Partial funding was also provided by the Florida Coastal Ever-glades-Long Term Ecological Research (FCE-LTER) program fundedby the National Science Foundation (Grants #DBI-0620409 and#DEB-9910514).
Acknowledgments
We would like to thank Richard J. Ewing from Coastal Engi-neering Consultants for their technical and field support duringelevation surveys. Special thanks to Eric Swain (U.S GeologicalSurvey) for kindly providing data and modeling output used duringmodel calibration. We also appreciate the help of Dr. Mark Zucker,USGS Florida, in obtaining gage data for USGS Taylor Upstreamgages, and Dr. Erik Stabenau’s assistance with data downloads fromEverglades National Park stations. We want also to thank DavidRudnick, Fred Sklar, and Christopher Madden (SFWMD) for adviceduring project planning and implementation. Thanks to the FloridaBay Interagency Science Center-Everglades National Park for itslogistic support during the study.
References
Boyer, J.N., Kelble, C.R., Ortner, P.B., Rudnick, D.T., 2009. Phytoplankton bloomstatus: chlorophyll a biomass as an indicator of water quality condition in thesouthern estuaries of Florida, USA. Ecological Indicators 9, S56eS67.
Briceno, H.O., Boyer, J.N., 2010. Climatic controls on phytoplankton biomass ina sub-tropical estuary, Florida Bay, USA. Estuaries and Coasts 33, 541e553.
Childers, D.L., Boyer, J.N., Davis, S., Madden, C.J., Rudnick, D., Sklar, F., 2005. Relatingprecipitation and water management to nutrient concentrations in the oligo-trophic “upside down” estuaries of the Florida Everglades. Limnology andOceanography 50.
Chow, V.T., Maidment, D., Mays, L., 1988. Applied Hydrology. McGraw-Hill, New York.Davis, S., Cabl, e J., Childers, D.L., Coronado-Molina, C., Day, J.W.J., Hittle, C.,
Madden, C.J., Reyes, E., Rudnick, D., Sklar, F., 2004. Importance of storm eventsin controlling ecosystem structure and function in a Florida Gulf Coast estuary.Journal of Coastal Research 20, 1198e1208.
Davis, S.M., Childers, D.L., Lorenz, J.J., Wanless, H.R., Hopkins, T.E., 2005.A conceptual model of ecological interactions in the mangrove estuaries of theFlorida Everglades. Wetlands 25, 832e884.
DHI, 2008. Integrated Flood Modeling Software. MIKE FLOOD. Denmark.FDEP/BSM, 2004. Florida Department of Environmental Protection, Bureau of
Survey and Mapping: Land Boundary Information System. Q1006NE. DigitalOrthographic Quarter Quad (DOQQ). http://data.labins.org/2003.
Fitterman, D.V., Deszcz-Pan, M., 1999. Geophysical mapping of saltwater intrusionin Everglades National Park (on CD-ROM). In 3rd International Symposium onEcohydraulics, Salt Lake City, Utah, 12e16 July 1999, p. 18 (on CD-ROM).
Fourqurean, J.W., Robblee, M.B., 1999. Florida Bay: a history of recent ecologicalchanges. Estuaries 22, 345e357.
Harvey, J.W., McCormick, P.V., 2009. Groundwater’s significance to changinghydrology, water chemistry, and biological communities of a floodplain ecosystem, Everglades, South Florida. Hydrogeology Journal 17 (1), 185e201.
Hittle, C., Patino, E., Zucker, M., 2001. Freshwater Flow from Estuarine Creeks intoNortheastern Florida Bay U.S. Geological Survey Water-Resources InvestigationsReport 01e4164.
Jacobs, J., Mecikalski, J., Paech, S., 2008. Satellite-based Solar Radiation, Net Radia-tion, and Potential and Reference Evapotranspiration. Technical Report. http://hdwp.er.usgs.gov/ET/GOES_FinalReport.pdf (accessed 4.8.11.).
Langevin, C.D., Swain, E.D., Wolfert, M.A., 2004. Simulation of Integrated Surface-water/Ground-water Flow and Salinity for a Coastal Wetland and AdjacentEstuary US Geological Survey Open-File Report 2004e1097.
Langevin, C.D., Swain, E.D., Wolfert, M.A., 2005. Simulation of integrated surface-water/ground-water flow and salinity for a coastal wetland and adjacentestuary. Journal of Hydrology 314, 212e234.
Nash, J.E., Sutcliffe, J.V., 1970. River flow forecasting through conceptual models partI d a discussion of principles. Journal of Hydrology 10 (3), 282e290.
Poret, N., Twilley, R.R., Rivera-Monroy, V.H., Coronado-Molina, C., 2007. Below-ground decomposition of mangrove roots in Florida Coastal Everglades. Estu-aries and Coasts 30 (3), 491e496.
Price, R.M., Swart, P.K., Fourqurean, J.W., 2006. Terrestrial brackish groundwaterdischarge e a significant source of phosphorus for the oligotrophic wetlands ofthe Everglades. Hydrobiologia 569.
Rivera-Monroy, V.H., Twlley, R.R., Davis, S.E., Childers, D., Simard, M., Chambers,D.P., Jaffe, R., Boyer, J.N., Rudnick, D.T., Zhang, K., Castaneda-Moya, E., Ewe,S.L.M., Price, R.M., Coronado-Molina, C., Ross, M., Smith, T.J., Michot, B., Meselhe,E., Nuttle, W., Troxler, T., Noe, G.B. The Role of the Everglades Mangrove EcotoneRegion (EMER) in regulating nutrient cycling and wetland productivity in SouthFlorida. Reviews in Environmental Science and Technology, in press.
Rudnick, D.T., Chen, Z., Childers, D.L., Fontaine, T.D., 1999. Phosphorous and nitrogeninputs to Florida Bay: the importance of the Everglades watershed. Estuaries 22,398e416.
Shoemaker, W.B., Sumner, D.M., 2006. Alternate corrections for estimating actualwetland evapotranspiration from potential evapotranspiration. Wetlands 26(2), 528e543.
Simard, M., Zhang, K.Q., Rivera-Monroy, V.H., Ross, M.S., Ruiz, P.L., Castaneda-Moya, E., Twilley, R.R., Rodriguez, E., 2006. Mapping height and biomass ofmangrove forests in Everglades National Park with SRTM elevation data.Photogrammetric Engineering and Remote Sensing 72, 299e311.
Sklar, F.H., Chimney, M.J., Newman, S., McCormick, P., Gawlik, D., Miao, S.L.,McVoy, C., Said, W., Newman, J., Coronado, C., Crozier, G., Korvela, M.,Rutchey, K., 2005. The ecological-societal underpinnings of Everglades resto-ration. Frontiers in Ecology and the Environment 3, 161e169.
South Florida Natural Resources Center (SFNRC), 2008. DataForEVER Dataset,Everglades National Park, Homestead, FL. generated by Erik Stabenau usingAppa server software. http://www.appaserver.com Sacramento, CA, Public URLnot currently available, please send data requests to [email protected], retrieved 28.8.08.
Sutula, M., Day, J., Cable, J., Rudnick, D.T., 2001. Hydrological and nutrient budgets offreshwater and estuarine wetlands of Taylor Slough in Southern Everglades,Florida (U.S.A.). Biogeochemistry 56, 287e310.
Sutula, M.A., Perez, B.C., Reyes, E., Childers, D.L., Davis, S., Day, J.W., Rudnick, D.,Sklar, F., 2003. Factors affecting spatial and temporal variability in materialexchange between the Southern Everglades wetlands and Floriday Bay (USA).Estuarine, Coastal and Shelf Science 57, 757e781.
Swain, E.D., Wolfert, M.A., Bales, J.D., Goodwin, C.R., 2004. Two-dimensionalHydrodynamic Simulation of Surface-water Flow and Transport to Florida BayThrough the Southern Inland and Coastal Systems (SICS). USGS Water-Resources Investigations Report 03-4287, 56 pp.
U.S. Geological Survey, 1996e2008a. South Florida Information Access Data Exchan-geeHydrologyData:UpstreamTaylorRiverandTaylorRiveratmouth.http://sofia.usgs.gov/exchange/zucker_woods_patino/index.html (accessed 14.02.08.).
U.S. Geological Survey, 1996e2008b. South Florida Information Access DataExchangeeHydrology Data: GroundwaterWells at UpstreamTaylor River. http://sofia.usgs.gov/exchange/zucker_woods_patino/index.html (accessed 18.08.08.).
U.S. Geological Survey, 2007. South Florida Information Access. High AccuracyElevation Data: Water Conservation Areas and Greater Everglades Region.Online dataset, http://sofia.usgs.gov/exchange/desmond/desmondelev.html(accessed 09.08.08.).
U.S. Geological Survey, 2008a. South Florida Information Access. Everglades DepthEstimation Network (EDEN): Evapotranspiration Data, Florida Bay. Onlinedataset, 208 KB, http://sofia.usgs.gov/eden/data/evapotrans/FLBAY_1995-2004_ET.zip (accessed 12.11.08.).
U.S. Geological Survey, 2008b. South Florida Information Access. Everglades DepthEstimation Network (EDEN): Rainfall Data, Florida Bay. Online dataset, 36 KB,http://sofia.usgs.gov/eden/data/nexrad/FLBAY_2002-2007_rainfall.zip(accessed 06.19.09.).
Wang, J.D., Swain, E.D., Wolfert, M.A., Langevin, C.D., James, D.E., Telis, P.A., 2007.Applications of Flow and Transport in a Linked Overland/Aquifer DensityDependent System (FTLOADDS) to Simulate Flow, Salinity, and Surface-waterStage in the Southern Everglades, Florida U.S. Geological Survey ScientificInvestigations Report 2007e5010.
Willmott, C.J., 1981. On the validation of models. Physical Geography 2, 184e194.