Embed Size (px)
Citation preview
7/27/2019 A Three-Stage Colonization Model - Kitchen Et Al
http://slidepdf.com/reader/full/a-three-stage-colonization-model-kitchen-et-al 1/7
A Three-Stage Colonization Model for the Peopling of the Americas
Andrew Kitchen1, Michael M. Miyamoto2, Connie J. Mulligan1*
1 Department of Anthropology, University of Florida, Gainesville, Florida, United States of America, 2 Department of Zoology, University of Florida, Gainesville, Florida,
United States of America
Abstract
Background: We evaluate the process by which the Americas were originally colonized and propose a three-stage modelthat integrates current genetic, archaeological, geological, and paleoecological data. Specifically, we analyze mitochondrialand nuclear genetic data by using complementary coalescent models of demographic history and incorporating non-genetic data to enhance the anthropological relevance of the analysis.
Methodology/Findings: Bayesian skyline plots, which provide dynamic representations of population size changes over time,indicate that Amerinds went through two stages of growth <40,000 and <15,000 years ago separated by a long period of population stability. Isolation-with-migration coalescent analyses, which utilize data from sister populations to estimate adivergence date and founder population sizes, suggest an Amerind population expansion starting <15,000 years ago.
Conclusions/Significance: These results support a model for the peopling of the New World in which Amerind ancestorsdiverged from the Asian gene pool prior to 40,000 years ago and experienced a gradual population expansion as they
moved into Beringia. After a long period of little change in population size in greater Beringia, Amerinds rapidly expandedinto the Americas <15,000 years ago either through an interior ice-free corridor or along the coast. This rapid colonizationof the New World was achieved by a founder group with an effective population size of <1,000–5,400 individuals. Ourmodel presents a detailed scenario for the timing and scale of the initial migration to the Americas, substantially refines theestimate of New World founders, and provides a unified theory for testing with future datasets and analytic methods.
Citation: Kitchen A, Miyamoto MM, Mulligan CJ (2008) A Three-Stage Colonization Model for the Peopling of the Americas. PLoS ONE 3(2): e1596. doi:10.1371/ journal.pone.0001596
Editor: Henry Harpending, University of Utah, United States of America
Received January 8, 2008; Accepted January 16, 2008; Published February 13, 2008
Copyright: ß 2008 Kitchen et al. This is an open-access article distributed under the terms of the Creative Commons Attribution License, which permitsunrestricted use, distribution, and reproduction in any medium, provided the original author and source are credited.
Funding: This study was supported by a grant from the National Science Foundation to CJM (BSR-0518530) and by funds from the Department of Zoology,University of Florida to MMM.
Competing Interests: The authors have declared that no competing interests exist.*E-mail: [email protected]
Introduction
For decades, intense and interdisciplinary attention has focused
on the colonization of the last habitable landmass on the planet-
the peopling of the Americas. The first comprehensive, interdis-
ciplinary model for New World colonization incorporated
linguistic, paleoanthropological, and genetic data and generated
great controversy, which was due at least in part, to the uniquely
broad scope of the research [1]. Since that time, more focused
studies have resulted in agreement on the general parameters of
the colonization process, such as a single migration in contrast to
the original three-migration model that distinguished Amerinds,Na-Dene, and Eskimo-Aleuts [1]. However, a full understanding
of the complex and dynamic nature of the timing and magnitude
of the colonization process remains elusive.
The majority of the genetic literature supports a single
migration of Paleoindians into the New World from an East
Asian source population [2]. Specifically, the reduced variation
and ubiquitous distribution of mitochondrial and Y chromosome
haplogroups and microsatellite diversity throughout the New
World relative to Asia argue strongly for a single migration [3,4].
However, a great many models have been proposed that differ
significantly in the timing and size of this migration event [2,5–15].
Different migration dates have been proposed ranging from <13
thousand years ago (kya) to <30–40 kya [2,5–15]. Numerical
estimates of the founder effective population size (Ne ) are
infrequent in the literature but vary substantially, from a high of
<5000 [6] to a low of <70 Paleoindian founders [16]. These dates
and population sizes have been proposed to accommodate a
wealth of scenarios including ancient, recent, and/or additional
migrations responsible for the peopling of the Americas.
Archaeological data provide clear support for a widespread
human presence in the Americas by <13 kya (all calendar dates
are recalibrated radiocarbon dates as reported in the cited
literature), the time by which the Clovis complex was establishedacross the interior of North America [17,18]. Older archaeological
sites, e.g. the Nenana Complex in Alaska [18], the Monte Verde
site in Chile [19], and the Schaefer, Hebior and Mud Lake sites in
Wisconsin [20,21], document an earlier chronology possibly
2,400 years before Clovis [18,20,21]. Additionally, very old
radiocarbon dates have been obtained from sites in Asian Beringia
suggesting that human populations had reached the north of
western Beringia by <30 kya [22,23].
The geological and paleoecological records for Beringia and
northwestern North America provide further constraints on the
timing for the peopling of the Americas. Beringia was a continuous
PLoS ONE | www.plosone.org 1 February 2008 | Volume 3 | Issue 2 | e1596

7/27/2019 A Three-Stage Colonization Model - Kitchen Et Al
http://slidepdf.com/reader/full/a-three-stage-colonization-model-kitchen-et-al 2/7
landmass that connected Asia and North America roughly 60 kya
until <11–10 kya [23–25]. However, Beringia was isolated from
continental North America until <14 kya when an intraconti-
nental ice-free corridor opened up between the Laurentide and
Cordilleran Ice Sheets [26]. Paleoecological data indicate that
Beringia was able to sustain at least small human populations.
Fossil pollen and plant macrofossils from ancient eastern Beringia
are indicative of a productive, dry grassland ecosystem [27] and
paleontological evidence from Alaska and Siberia demonstratesthat large mammals roamed Beringia [28].
After 11–10 kya, Late Pleistocene sea levels rose sufficiently to
re-inundate Beringia [24,25], creating the Bering strait that now
separates the New World from Siberia by at least 100 kilometers
(km) of open frigid water. Studies of human settlement throughout
the Pacific Islands indicate that open water distances of .100 km
constitute significant barriers to human migration, possibly
because ancient people were unlikely to travel further than one
day out of sight of land [29]. Similar constraints (if not worse)
would apply to early humans in Alaska and Siberia, thereby
severely reducing the migration rate between the New and Old
World once Beringia was re-inundated. Reduced migration due to
the Bering Strait remains valid even as recent rates of short-rangemigration have increased between Siberia and Alaska [13]. In
effect, the two continents were essentially geographically isolatedfrom 11–10 kya until modern times.
No detailed, unified theory of New World colonization currently
exists that can account for the breadth and complexity of theseinterdisciplinary data. We analyze Native American mitochondrial
DNA (mtDNA) coding genomes plus non-coding control regionsequences as well as a combined nuclear and mitochondrial coding
DNA dataset from New World and Asian populations. Mitochondrial
DNA data represent the ‘gold standard’ of genetic data types and
provide the most extensive comparative database for human
populations worldwide [30]. Furthermore, it has been proposed that
mtDNA may be more sensitive to demographic changes, such as
population bottlenecks, due to its smaller effective population size
[31]. The combined nuclear and mtDNA dataset was recently used to
propose an unusually small Ne for the Amerind founders [16], and
thus investigation of this dataset is of much interest when attempting
to reconcile the existing genetic evidence. We use two complementary
coalescent methods to develop a comprehensive scenario of New
World colonization, with a focus on the timing and scale of the
migration process. Bayesian skyline plot analyses use data from a
single population to provide an unbiased estimate of changes in Ne
through time, and thus are a powerful means for estimating past
population growth patterns when the nature of the growth (e.g.
exponential or constant) is unknown [32]. The isolation-by-migration
(IM) structured coalescent model uses data from sister populations to
jointly estimate population divergence time, migration rates and afounder Ne, with an assumption of exponential growth [16].
Importantly, we explicitly incorporate archaeological, geological,and paleoecological constraints into both analyses. Our goal is to
provide a comprehensive model for the initial settlement of the Americas that generates new testable hypotheses and has high
predictive power for the inclusion of new datasets. In light of our
results, we propose a three-stage model in which a recent, rapid
expansion into the Americas was preceded by a long period of
population stability in greater Beringia by the Paleoindian population
after divergence and expansion from their ancestral Asian population.
Results
Skyline Plot AnalysesOur alignment of 77 full mitochondrial coding genomes is one
of the largest published alignments of Native American mtDNA
coding genomes (Figure S1). It includes genomes from the four
major mtDNA haplogroups in the Americas (haplogroups A, B, C,
and D are each represented by 17–31% of the entire sample), as
well as the minor haplogroup X (2%). Correspondingly, this set of
77 complete coding mtDNA genomes represents geographically
and linguistically diverse populations distributed throughout the
New World [3]. Bayesian skyline plots [32] were used to visually
illustrate changes in Amerind female effective population size (N ef )
over time. Bayesian skyline plots assume a single migration event,which makes the approach ideal for questions concerning the
peopling of the Americas since it is generally agreed that there was
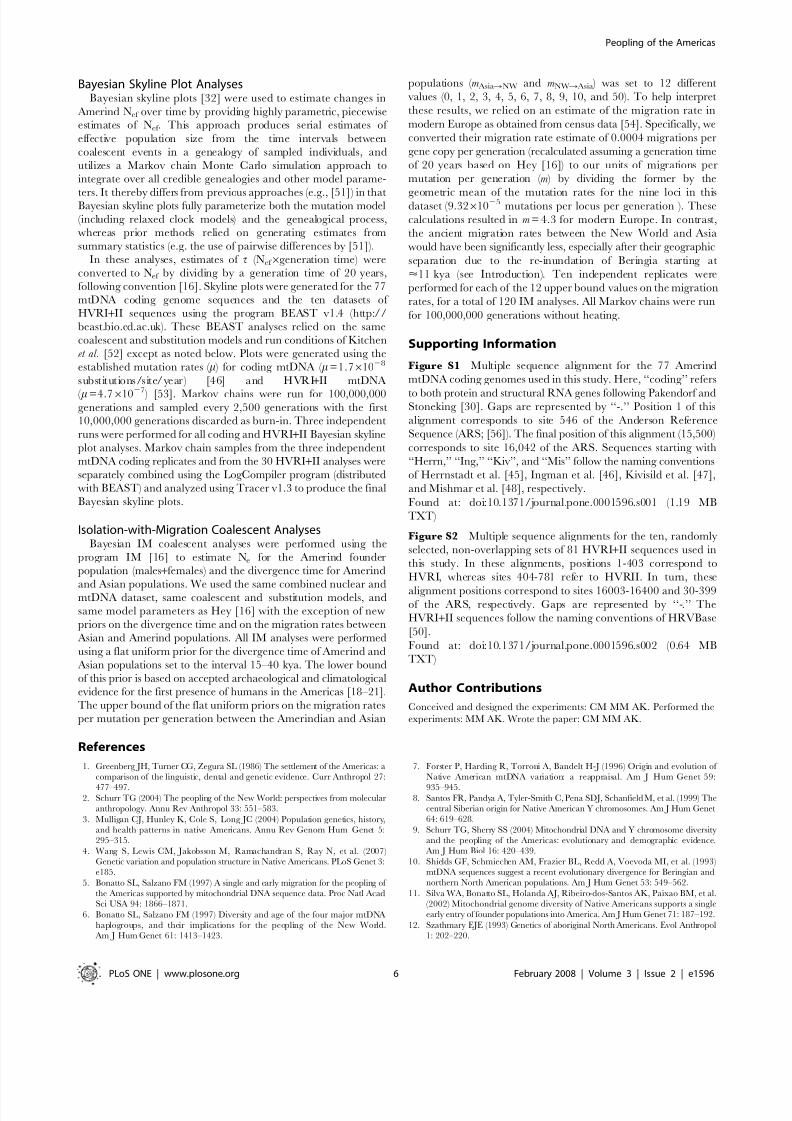
a single migration [3]. Our skyline plot of the coding genomes
describes a three-stage process in which there are two distinct
increases in Nef at <40 kya and <15 kya that are separated by a
long period of little to no growth (Figure 1). Specifically, Nef
increases from <640 [95% credible interval (CI) = 148–9,969] to
<4,400 individuals (95% CI = 235–18,708) at the first inflection
point, and from <4,000 (95% CI= 911–13,006) to <64,000
individuals (95% CI = 15,871–202,990) at the second inflection
point. There is also an apparent decrease in Nef prior to the second
inflection point in which median Nef drops to <2700 (95%
CI = 404–36,628). We define a significant change in population
size as the occurrence of non-overlapping 95% CIs at the
beginning and end of an increase (see shading in Figure 1). Thus,
we interpret the recent <16-fold increase in Nef over the interval
<16–9 kya as significant. The earlier <7-fold increase at <43–
36 kya is suggestive but not significant, although the increase is
significant when compared over a much longer time period, e.g.
from <25 kya to the coalescent. Overall, the recent increase is
consistent with a rapid, large-scale expansion into the Americas
while the older increase is suggestive of a gradual expansion within
Asia or Beringia.
The dataset of 812 concatenated mtDNA hypervariable region
(HVR) I and II sequences is one of the largest published
alignments of Native American HVRI+II sequences (Figure S2).
It includes all major New World haplogroups, and represents
geographically and linguistically diverse populations distributed
Figure 1. Bayesian skyline plot for the mtDNA coding genomesequences. The curve plots median Nef with its 95% CI indicated bythe light gray lines. The calculated Nef assumes a generation time of 20 years following Hey [16]; alternatively, using a generation time of 25 years [55] would uniformly decrease all estimates of Nef by 20%. ‘‘X’’marks the median coalescent time with its 95% CI given in brackets. Theshaded regions highlight two periods of substantial population growth.This skyline plot provides the principal evidence for our three-stagemodel of New World colonization, i.e. the three stages that are depictedand labeled here.doi:10.1371/journal.pone.0001596.g001
Peopling of the Americas
PLoS ONE | www.plosone.org 2 February 2008 | Volume 3 | Issue 2 | e1596
7/27/2019 A Three-Stage Colonization Model - Kitchen Et Al
http://slidepdf.com/reader/full/a-three-stage-colonization-model-kitchen-et-al 3/7
throughout the Americas. The HVRI+II dataset was randomly
divided into ten non-overlapping alignments of 81 HVRI+II
sequences, which allowed for ten independent trials for parameter
estimation with a sample size similar to the coding genome
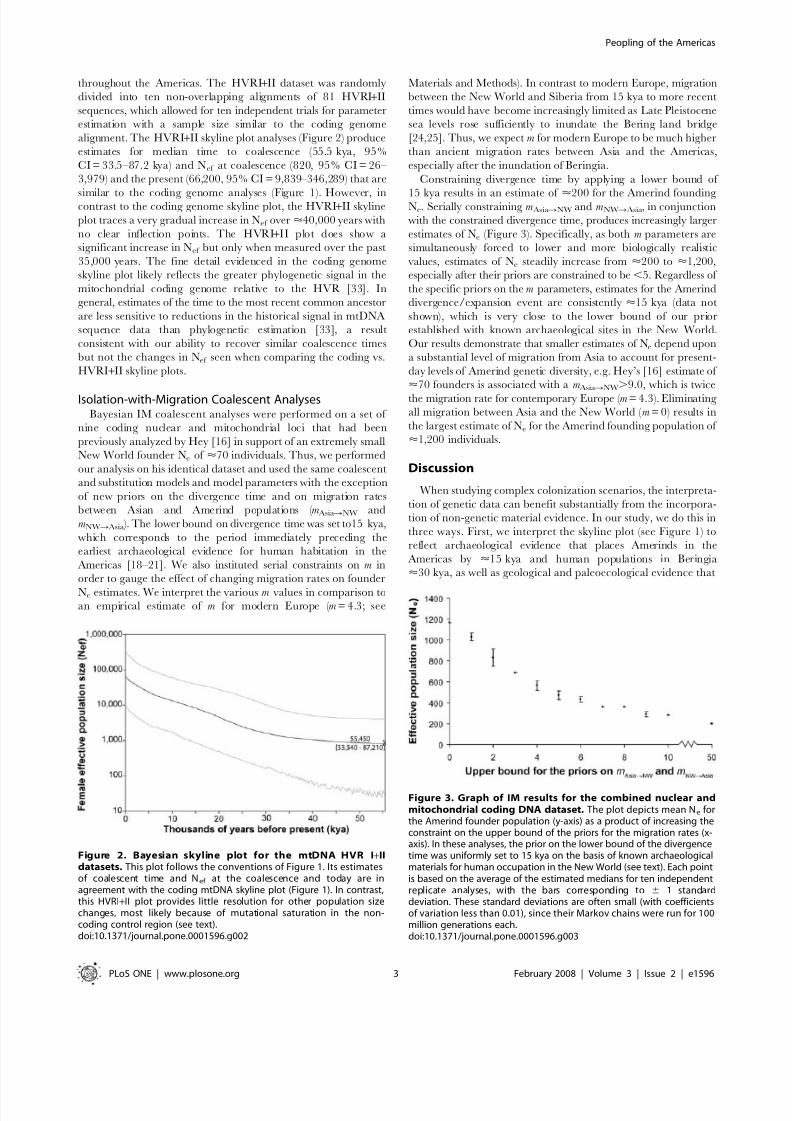
alignment. The HVRI+II skyline plot analyses (Figure 2) produce
estimates for median time to coalescence (55.5 kya, 95%
CI = 33.5–87.2 kya) and Nef at coalescence (820, 95% CI = 26–
3,979) and the present (66,200, 95% CI = 9,839–346,289) that are
similar to the coding genome analyses (Figure 1). However, incontrast to the coding genome skyline plot, the HVRI+II skyline
plot traces a very gradual increase in Nef over <40,000 years with
no clear inflection points. The HVRI+II plot does show a
significant increase in Nef but only when measured over the past
35,000 years. The fine detail evidenced in the coding genome
skyline plot likely reflects the greater phylogenetic signal in the
mitochondrial coding genome relative to the HVR [33]. In
general, estimates of the time to the most recent common ancestor
are less sensitive to reductions in the historical signal in mtDNA
sequence data than phylogenetic estimation [33], a result
consistent with our ability to recover similar coalescence times
but not the changes in Nef seen when comparing the coding vs.
HVRI+II skyline plots.
Isolation-with-Migration Coalescent AnalysesBayesian IM coalescent analyses were performed on a set of
nine coding nuclear and mitochondrial loci that had been
previously analyzed by Hey [16] in support of an extremely small
New World founder Ne of <70 individuals. Thus, we performed
our analysis on his identical dataset and used the same coalescent
and substitution models and model parameters with the exception
of new priors on the divergence time and on migration rates
between Asian and Amerind populations ( m AsiaRNW and
mNWR Asia ). The lower bound on divergence time was set to15 kya,
which corresponds to the period immediately preceding the
earliest archaeological evidence for human habitation in the
Americas [18–21]. We also instituted serial constraints on m in
order to gauge the effect of changing migration rates on founder
Ne estimates. We interpret the various m values in comparison toan empirical estimate of m for modern Europe ( m = 4.3; see
Materials and Methods). In contrast to modern Europe, migration
between the New World and Siberia from 15 kya to more recent
times would have become increasingly limited as Late Pleistocene
sea levels rose sufficiently to inundate the Bering land bridge
[24,25]. Thus, we expect m for modern Europe to be much higher
than ancient migration rates between Asia and the Americas,
especially after the inundation of Beringia.
Constraining divergence time by applying a lower bound of
15 kya results in an estimate of <
200 for the Amerind founding Ne. Serially constraining m AsiaRNW and mNWR Asia, in conjunction
with the constrained divergence time, produces increasingly larger
estimates of Ne (Figure 3). Specifically, as both m parameters are
simultaneously forced to lower and more biologically realistic
values, estimates of Ne steadily increase from <200 to <1,200,
especially after their priors are constrained to be ,5. Regardless of
the specific priors on the m parameters, estimates for the Amerind
divergence/expansion event are consistently <15 kya (data not
shown), which is very close to the lower bound of our prior
established with known archaeological sites in the New World.
Our results demonstrate that smaller estimates of Ne depend upon
a substantial level of migration from Asia to account for present-
day levels of Amerind genetic diversity, e.g. Hey’s [16] estimate of
<70 founders is associated with a m AsiaRNW.9.0, which is twice
the migration rate for contemporary Europe ( m = 4.3). Eliminating
all migration between Asia and the New World ( m = 0) results in
the largest estimate of Ne for the Amerind founding population of
<1,200 individuals.
Discussion
When studying complex colonization scenarios, the interpreta-
tion of genetic data can benefit substantially from the incorpora-
tion of non-genetic material evidence. In our study, we do this in
three ways. First, we interpret the skyline plot (see Figure 1) to
reflect archaeological evidence that places Amerinds in the
Americas by <15 kya and human populations in Beringia
<30 kya, as well as geological and paleoecological evidence that
Figure 2. Bayesian skyline plot for the mtDNA HVR I+IIdatasets. This plot follows the conventions of Figure 1. Its estimatesof coalescent time and Nef at the coalescence and today are inagreement with the coding mtDNA skyline plot (Figure 1). In contrast,this HVRI+II plot provides little resolution for other population sizechanges, most likely because of mutational saturation in the non-coding control region (see text).doi:10.1371/journal.pone.0001596.g002
Figure 3. Graph of IM results for the combined nuclear andmitochondrial coding DNA dataset. The plot depicts mean Ne forthe Amerind founder population (y-axis) as a product of increasing theconstraint on the upper bound of the priors for the migration rates (x-axis). In these analyses, the prior on the lower bound of the divergencetime was uniformly set to 15 kya on the basis of known archaeologicalmaterials for human occupation in the New World (see text). Each pointis based on the average of the estimated medians for ten independentreplicate analyses, with the bars corresponding to 6 1 standarddeviation. These standard deviations are often small (with coefficientsof variation less than 0.01), since their Markov chains were run for 100million generations each.doi:10.1371/journal.pone.0001596.g003
Peopling of the Americas
PLoS ONE | www.plosone.org 3 February 2008 | Volume 3 | Issue 2 | e1596
7/27/2019 A Three-Stage Colonization Model - Kitchen Et Al
http://slidepdf.com/reader/full/a-three-stage-colonization-model-kitchen-et-al 4/7
Beringia was habitable yet isolated from the Americas from
<30 kya to 17 kya. Second, we use archaeological radiocarbon
dates to constrain the divergence time prior in our IM analyses to
15 kya as the latest possible date for both the divergence of the
Amerind and Asian gene pools and the Amerind expansion into
North America (Figure 3). Since the IM model assumes that
divergence and expansion occur simultaneously, constraining the
time of the expansion also requires identical constraint of the
divergence date. Third, in our IM analyses we serially constrainthe migration rate parameters to smaller values and deduce likely
migration rates between Asia and the New World based on
empirical estimates of current migration rates within Europe
versus the greatly reduced migration rates of ancient people across
the Bering Strait starting <11–10 kya.
Based on our results, we propose a three-stage colonization
process for the peopling of the New World, with a specific focus on
the dating and magnitude of the Amerind population expansions
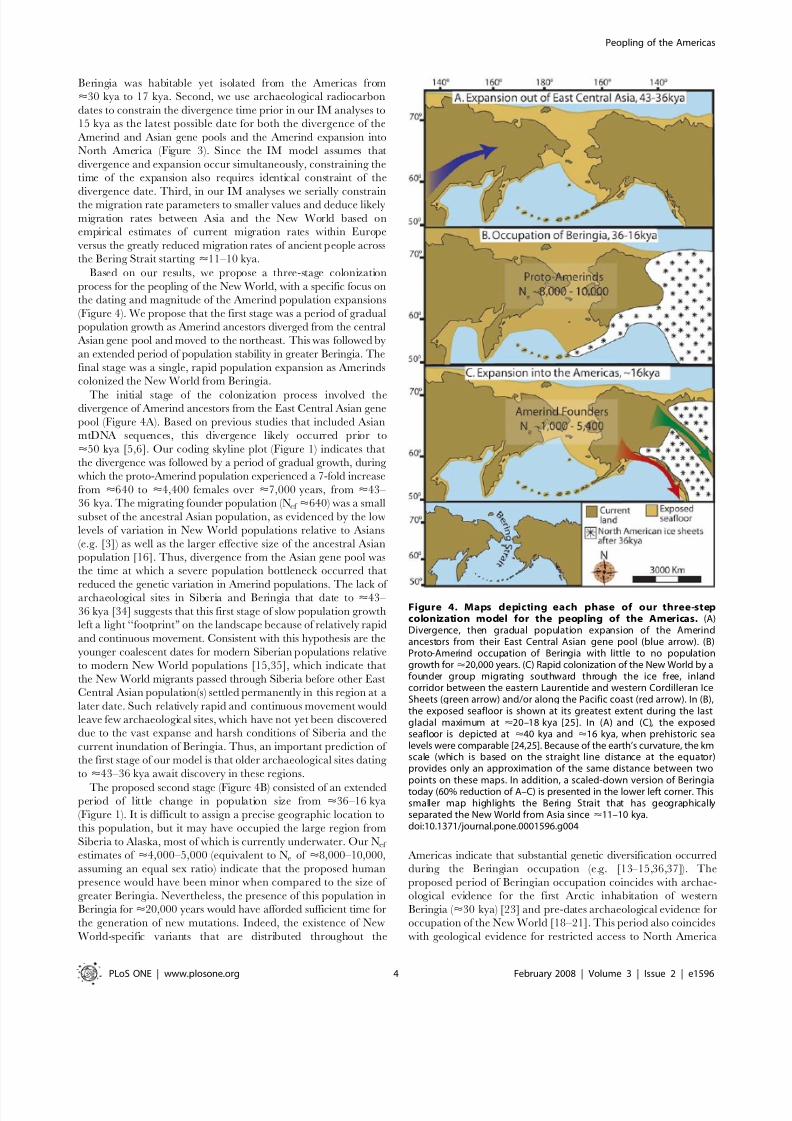
(Figure 4). We propose that the first stage was a period of gradual
population growth as Amerind ancestors diverged from the central
Asian gene pool and moved to the northeast. This was followed by
an extended period of population stability in greater Beringia. The
final stage was a single, rapid population expansion as Amerinds
colonized the New World from Beringia.
The initial stage of the colonization process involved thedivergence of Amerind ancestors from the East Central Asian gene
pool (Figure 4A). Based on previous studies that included Asian
mtDNA sequences, this divergence likely occurred prior to
<50 kya [5,6]. Our coding skyline plot (Figure 1) indicates that
the divergence was followed by a period of gradual growth, during
which the proto-Amerind population experienced a 7-fold increase
from <640 to <4,400 females over <7,000 years, from <43–
36 kya. The migrating founder population (Nef <640) was a small
subset of the ancestral Asian population, as evidenced by the low
levels of variation in New World populations relative to Asians
(e.g. [3]) as well as the larger effective size of the ancestral Asian
population [16]. Thus, divergence from the Asian gene pool was
the time at which a severe population bottleneck occurred that
reduced the genetic variation in Amerind populations. The lack of archaeological sites in Siberia and Beringia that date to <43–
36 kya [34] suggests that this first stage of slow population growth
left a light ‘‘footprint’’ on the landscape because of relatively rapid
and continuous movement. Consistent with this hypothesis are the
younger coalescent dates for modern Siberian populations relative
to modern New World populations [15,35], which indicate that
the New World migrants passed through Siberia before other East
Central Asian population(s) settled permanently in this region at a
later date. Such relatively rapid and continuous movement would
leave few archaeological sites, which have not yet been discovered
due to the vast expanse and harsh conditions of Siberia and the
current inundation of Beringia. Thus, an important prediction of
the first stage of our model is that older archaeological sites dating
to <43–36 kya await discovery in these regions.
The proposed second stage (Figure 4B) consisted of an extendedperiod of little change in population size from <36–16 kya
(Figure 1). It is difficult to assign a precise geographic location to
this population, but it may have occupied the large region from
Siberia to Alaska, most of which is currently underwater. Our Nef
estimates of <4,000–5,000 (equivalent to Ne of <8,000–10,000,
assuming an equal sex ratio) indicate that the proposed human
presence would have been minor when compared to the size of
greater Beringia. Nevertheless, the presence of this population in
Beringia for<20,000 years would have afforded sufficient time for
the generation of new mutations. Indeed, the existence of New
World-specific variants that are distributed throughout the
Americas indicate that substantial genetic diversification occurred
during the Beringian occupation (e.g. [13–15,36,37]). The
proposed period of Beringian occupation coincides with archae-
ological evidence for the first Arctic inhabitation of western
Beringia ( <30 kya) [23] and pre-dates archaeological evidence for
occupation of the New World [18–21]. This period also coincides
with geological evidence for restricted access to North America
Figure 4. Maps depicting each phase of our three-stepcolonization model for the peopling of the Americas. (A)Divergence, then gradual population expansion of the Amerindancestors from their East Central Asian gene pool (blue arrow). (B)Proto-Amerind occupation of Beringia with little to no populationgrowth for<20,000 years. (C) Rapid colonization of the New World by afounder group migrating southward through the ice free, inlandcorridor between the eastern Laurentide and western Cordilleran IceSheets (green arrow) and/or along the Pacific coast (red arrow). In (B),the exposed seafloor is shown at its greatest extent during the lastglacial maximum at <20–18 kya [25]. In (A) and (C), the exposedseafloor is depicted at <40 kya and <16 kya, when prehistoric sealevels were comparable [24,25]. Because of the earth’s curvature, the kmscale (which is based on the straight line distance at the equator)provides only an approximation of the same distance between two
points on these maps. In addition, a scaled-down version of Beringiatoday (60% reduction of A–C) is presented in the lower left corner. Thissmaller map highlights the Bering Strait that has geographicallyseparated the New World from Asia since <11–10 kya.doi:10.1371/journal.pone.0001596.g004
Peopling of the Americas
PLoS ONE | www.plosone.org 4 February 2008 | Volume 3 | Issue 2 | e1596

7/27/2019 A Three-Stage Colonization Model - Kitchen Et Al
http://slidepdf.com/reader/full/a-three-stage-colonization-model-kitchen-et-al 5/7
because of the impenetrability of the Cordilleran and Laurentide
ice sheets ( <17–30 kya) [38,39]. Botanical remains, such as
macrofossils and ancient pollen, indicate that Beringia was a
productive grassland ecosystem rather than an exceedingly harsh
Arctic desert environment [27]. Paleontological evidence from
Alaska and Siberia demonstrates that large mammals such as
steppe bison, mammoth, horse, lion, musk-oxen, sheep, wholly
rhinoceros, and caribou inhabited this area [28].Thus, the
paleoecological data are consistent with a human presence inBeringia although the carrying capacity of Beringia and
technological limitations of the human population may have
restricted growth until the population could expand into new and
fertile lands in the Americas. The rapid expansion of the
population only after an ice-free corridor into North America
opened (see below) suggests that the population may have
departed Beringia as soon as a viable alternative presented.
The final colonization stage (Figure 4C) was a rapid geographic
expansion into the New World resulting in a significant population
increase ( <16-fold; Figure 1). The rapid population increase
occurred over the period <16–9 kya according to the coding
skyline plot or over the past 15,000 years based on the IM analyses
(the latter results supported only the most recent and largest
expansion, most likely because IM analyses assume a single,
simultaneous divergence/expansion event). The geological recordindicates that North America became accessible from Beringia
between <17–14 kya, when the ice sheets covering what is now
Canada began to retreat [26,39]. The coincident timing of an ice-
free corridor into North America and the rapid expansion of the
Amerind population suggests that a land route may have been the
preferred entry into the New World. However, the northwest
Pacific coast of North America also may have been deglaciated by
<17 kya, thus presenting a viable coastal route to continental
North America [4,39]. This period also coincides with the initial
inundation of the Bering land bridge, after which migration with
Asia would have been severely limited. The first unequivocal
evidence for human occupation of the New World occurs in theform
of Clovis sites dating to <13 kya [18] and pre-Clovis sites in both
North and South America dating to<
14–15 kya [19–21]. Ourdatasets do not include typings from the Na-Dene or Esk-Aleut, so
we limit our scope to the largest, initial migration of Amerinds into
the New World. However, Na-Dene and Esk-Aleut genetic diversity
represents a subset of Amerind diversity (e.g. [40–42]) suggesting that
Na-Dene and Esk-Aleuts are derived from the same Beringian
source population as Amerinds. As stated above, extensive
archaeological evidence supports the presence of multiple distinct
Native American material cultures by <13 kya (e.g. Clovis, Nenana
and pre-Clovis lithic technologies [18]). Our results suggest that these
distinct cultures derive from a single New World founder population
and are most likely the product of an extensive and complex process
of post-peopling migrations within the Americas, possibly through a
combination of coastal and/or riverine routes [4,43].
Determination of the size of the Amerind founding population
has received considerable attention. Based on the coding Bayesianskyline plot (Figure 1), there is a slight decrease in population size
preceding the increase seen at <15 kya. This decrease is consistent
with a secondary founder effect in which a subset of the Beringian
population seeded the proto-Amerind expansion into the Amer-
icas. Assuming the apparent decrease in Nef is the result of such a
founder effect, the upper bound on the founder population size is
<5,400 individuals (Nef <2,700). Our IM analyses suggest that the
founder population size could be lower depending on prior
assumptions about the over water migration rates between the
Americas and Asia (see Figure 3). Migration rates ( m ) within
Europe today based on census data have been determined to be
4.3, which can be taken as an extreme upper bound of possible
ancient migration rates between the Americas and Asia, especially
after the appearance of the Bering Strait <11–10 kya. Restricting
migration rates to ,1 results in founder Ne estimates between
<1,000 and <1,200, with <1,200 serving as an asymptotic upper
bound (see Figure 3). Taken together, our Bayesian skyline plot
and IM analyses suggest that a founder population with
Ne = 1,000–5,400 colonized the New World in a process
characterized by a rapid geographic and population expansion.The range of Ne values can be translated into an approximatecensus population size by applying a scale factor estimated from
large mammal populations (scale factor= 5) [44], which suggests
that the founder population consisted of <5,000–27,000 people.
Our three-stage model now awaits further critical testing with new
datasets of independent nuclear loci and more sophisticated methods
of coalescent analysis. The extensive dataset of <700 autosomal
microsatellites, compiled by Wang et al. [4] for both Native
American and worldwide populations, offers the opportunity to
evaluate critically the size, timing, and duration of each step in our
model at essentially a population genomics level. Future versions of
BEAST will incorporate a structured coalescent where migration as
well as population growth will be allowed to occur among
populations from both the New World and Asia (http://evolve.
zoo.ox.ac.uk/beast/manual.html). In these BEAST analyses, themicrosatellites can be modeled under a stepwise ‘‘ladder process,’’
whereby alleles are inter-related according to their repeat lengths.
One can then summarize over these microsatellite loci by assuming
independence, which thereby allows for the multiplication of their
separate posterior distributions and final estimations of their
combined Bayesian skyline plot. In these ways, we fully anticipate
that such critical testing will lead to many important refinements of
our three-step model, including a further narrowing of our proposed
range for the size of the founding population as well as new details
about post-peopling expansions within the New World.
Materials and Methods
Datasets
Three datasets were collected for analysis including: ( i ) 77 mtDNAcoding genomes; ( ii ) 812 mtDNA HVRI+II sequences; and ( iii )
combined nuclear and mitochondrial coding DNA dataset. The 77mtDNA coding genomes were collected from publicly available
resources [45–48] and aligned using ClustalX [49]. The resultant
15,500 base pair (bp) multiple alignment was edited by hand to
minimize the number of unique gaps and to ensure the integrity of
the reading frame (available online as Figure S1). A total of 812
combined HVRI+II sequences were collected from HVRbase
(http://www.hvrbase.org) [50]. These sequences were aligned
following the coding mtDNAs, resulting in a multiple alignment of
771 bps (available online as Supplemental Figure S2). The complete
dataset of 812 HVRI+II sequences was randomly divided into ten
non-overlapping alignments of 81 sequences that approximate the
sample size for the coding mtDNA dataset. Skyline plot analyses of
larger datasets (up to 200 HVRI+II sequences) gave the same resultsas the 81 sequence datasets (data not shown). Thus, the smallerdatasets of 81 sequences each were emphasized here since they
avoided the likelihood rounding errors that can occur when using
large, heterogeneous datasets in Bayesian skyline plot analyses. The
coding nuclear and mtDNA dataset from Asian and Native
American populations of Hey (available at http://lifesci.rutgers.
edu/,heylab/) [16] consisted of two autosomal coding loci, five X-
chromosome coding loci, one Y-chromosome coding locus, and the
complete mtDNA coding genome (totaling 28,454 aligned bps). The
sample sizes for these nuclear loci and mitochondrial genome varied
from 12-108 sequences.
Peopling of the Americas
PLoS ONE | www.plosone.org 5 February 2008 | Volume 3 | Issue 2 | e1596
7/27/2019 A Three-Stage Colonization Model - Kitchen Et Al
http://slidepdf.com/reader/full/a-three-stage-colonization-model-kitchen-et-al 6/7
Bayesian Skyline Plot AnalysesBayesian skyline plots [32] were used to estimate changes in
Amerind Nef over time by providing highly parametric, piecewiseestimates of Nef . This approach produces serial estimates of
effective population size from the time intervals between
coalescent events in a genealogy of sampled individuals, and
utilizes a Markov chain Monte Carlo simulation approach to
integrate over all credible genealogies and other model parame-
ters. It thereby differs from previous approaches (e.g., [51]) in thatBayesian skyline plots fully parameterize both the mutation model
(including relaxed clock models) and the genealogical process,
whereas prior methods relied on generating estimates from
summary statistics (e.g. the use of pairwise differences by [51]).
In these analyses, estimates of t (Nef 6generation time) were
converted to Nef by dividing by a generation time of 20 years,
following convention [16]. Skyline plots were generated for the 77
mtDNA coding genome sequences and the ten datasets of
HVRI+II sequences using the program BEAST v1.4 (http://
beast.bio.ed.ac.uk). These BEAST analyses relied on the same
coalescent and substitution models and run conditions of Kitchen
et al. [52] except as noted below. Plots were generated using the
established mutation rates ( m ) for coding mtDNA ( m=1.761028
substitutions/site/year) [46] and HVRI+II mtDNA
( m=4.761027
) [53]. Markov chains were run for 100,000,000generations and sampled every 2,500 generations with the first10,000,000 generations discarded as burn-in. Three independent
runs were performed for all coding and HVRI+II Bayesian skyline
plot analyses. Markov chain samples from the three independent
mtDNA coding replicates and from the 30 HVRI+II analyses were
separately combined using the LogCompiler program (distributed
with BEAST) and analyzed using Tracer v1.3 to produce the final
Bayesian skyline plots.
Isolation-with-Migration Coalescent AnalysesBayesian IM coalescent analyses were performed using the
program IM [16] to estimate Ne for the Amerind founder
population (males+females) and the divergence time for Amerind
and Asian populations. We used the same combined nuclear andmtDNA dataset, same coalescent and substitution models, and
same model parameters as Hey [16] with the exception of new
priors on the divergence time and on the migration rates between
Asian and Amerind populations. All IM analyses were performed
using a flat uniform prior for the divergence time of Amerind and
Asian populations set to the interval 15–40 kya. The lower bound
of this prior is based on accepted archaeological and climatological
evidence for the first presence of humans in the Americas [18–21].
The upper bound of the flat uniform priors on the migration rates
per mutation per generation between the Amerindian and Asian
populations ( m AsiaRNW and mNWR Asia ) was set to 12 different
values (0, 1, 2, 3, 4, 5, 6, 7, 8, 9, 10, and 50). To help interpret
these results, we relied on an estimate of the migration rate in
modern Europe as obtained from census data [54]. Specifically, we
converted their migration rate estimate of 0.0004 migrations per
gene copy per generation (recalculated assuming a generation time
of 20 years based on Hey [16]) to our units of migrations per
mutation per generation ( m ) by dividing the former by the
geometric mean of the mutation rates for the nine loci in thisdataset (9.3261025 mutations per locus per generation ). These
calculations resulted in m = 4.3 for modern Europe. In contrast,
the ancient migration rates between the New World and Asia
would have been significantly less, especially after their geographic
separation due to the re-inundation of Beringia starting at
<11 kya (see Introduction). Ten independent replicates were
performed for each of the 12 upper bound values on the migration
rates, for a total of 120 IM analyses. All Markov chains were run
for 100,000,000 generations without heating.
Supporting Information
Figure S1 Multiple sequence alignment for the 77 Amerind
mtDNA coding genomes used in this study. Here, ‘‘coding’’ refers
to both protein and structural RNA genes following Pakendorf andStoneking [30]. Gaps are represented by ‘‘-.’’ Position 1 of this
alignment corresponds to site 546 of the Anderson Reference
Sequence (ARS; [56]). The final position of this alignment (15,500)
corresponds to site 16,042 of the ARS. Sequences starting with
‘‘Herrn,’’ ‘‘Ing,’’ ‘‘Kiv’’, and ‘‘Mis’’ follow the naming conventions
of Herrnstadt et al. [45], Ingman et al. [46], Kivisild et al. [47],
and Mishmar et al. [48], respectively.
Found at: doi:10.1371/journal.pone.0001596.s001 (1.19 MB
TXT)
Figure S2 Multiple sequence alignments for the ten, randomly
selected, non-overlapping sets of 81 HVRI+II sequences used in
this study. In these alignments, positions 1-403 correspond to
HVRI, whereas sites 404-781 refer to HVRII. In turn, these
alignment positions correspond to sites 16003-16400 and 30-399of the ARS, respectively. Gaps are represented by ‘‘-.’’ The
HVRI+II sequences follow the naming conventions of HRVBase
[50].
Found at: doi:10.1371/journal.pone.0001596.s002 (0.64 MB
TXT)
Author Contributions
Conceived and designed the experiments: CM MM AK. Performed the
experiments: MM AK. Wrote the paper: CM MM AK.
References
1. Greenberg JH, Turner CG, Zegura SL (1986) The settlement of the Americas: a
comparison of the linguistic, dental and genetic evidence. Curr Anthropol 27:
477–497.2. Schurr TG (2004) The peopling of the New World: perspectives from molecular
anthropology. Annu Rev Anthropol 33: 551–583.
3. Mulligan CJ, Hunley K, Cole S, Long JC (2004) Population genetics, history,
and health patterns in native Americans. Annu Rev Genom Hum Genet 5:
295–315.
4. Wang S, Lewis CM, Jakobsson M, Ramachandran S, Ray N, et al. (2007)
Genetic variation and population structure in Native Americans. PLoS Genet 3:
e185.
5. Bonatto SL, Salzano FM (1997) A single and early migration for the peopling of
the Americas supported by mitochondrial DNA sequence data. Proc Natl Acad
Sci USA 94: 1866–1871.
6. Bonatto SL, Salzano FM (1997) Diversity and age of the four major mtDNA
haplogroups, and their implications for the peopling of the New World.
Am J Hum Genet 61: 1413–1423.
7. Forster P, Harding R, Torroni A, Bandelt H-J (1996) Origin and evolution of
Native American mtDNA variation: a reappraisal. Am J Hum Genet 59:
935–945.8. Santos FR, Pandya A, Tyler-Smith C, Pena SDJ, Schanfield M, et al. (1999) The
central Siberian origin for Native American Y chromosomes. Am J Hum Genet
64: 619–628.
9. Schurr TG, Sherry SS (2004) Mitochondrial DNA and Y chromosome diversity
and the peopling of the Americas: evolutionary and demographic evidence.
Am J Hum Biol 16: 420–439.
10. Shields GF, Schmiechen AM, Frazier BL, Redd A, Voevoda MI, et al. (1993)
mtDNA sequences suggest a recent evolutionary divergence for Beringian and
northern North American populations. Am J Hum Genet 53: 549–562.
11. Silva WA, Bonatto SL, Holanda AJ, Ribeiro-dos-Santos AK, Paixao BM, et al.
(2002) Mitochondrial genome diversity of Native Americans supports a single
early entry of founder populations into America. Am J Hum Genet 71: 187–192.
12. Szathmary EJE (1993) Genetics of aboriginal North Americans. Evol Anthropol
1: 202–220.
Peopling of the Americas
PLoS ONE | www.plosone.org 6 February 2008 | Volume 3 | Issue 2 | e1596
7/27/2019 A Three-Stage Colonization Model - Kitchen Et Al
http://slidepdf.com/reader/full/a-three-stage-colonization-model-kitchen-et-al 7/7
13. Tamm E, Kivisild T, Reidla1 M, Metspalu1 M, Smith DG, et al. (2007) Beringianstandstill and spread of Native American founders. PLoS ONE 2: e829.
14. Torroni A, Schurr TG, Cabell MF, Brown MD, Neel JV, et al. (1993) Asianaffinities and continental radiation of the four founding Native AmericanmtDNAs. Am J Hum Genet 53: 563–590.
15. Torroni A, Sukernik RI, Schurr TG, Starikovskaya YB, Cabell MF, et al. (1993)mtDNA variation of aboriginal Siberians reveals distinct genetic affinities withNative Americans. Am J Hum Genet 53: 591–608.
16. Hey J (2005) On the number of New World founders: a population geneticportrait of the peopling of the Americas. PLoS Biol 3: e193.
17. Hamilton MJ, Buchanan B (2007) Spatial gradients in Clovis-age radiocarbon
dates across North America suggest rapid colonization from the north. Proc Natl Acad Sci USA 104: 15625–15630.18. Waters MR, Stafford TW (2007) Redefining the age of Clovis: implications for
the peopling of the Americas. Science 315: 1122–1126.19. Dillehay TD, ed (1997) The archaeological context and interpretation.
Washington, DC: Smithsonian Institution Press.20. Joyce DJ (2006) Chronology and new research on the Schaefer mammoth
( Mammuthus primigenius ) site, Kenosha County, Wisconsin, USA. Quat Intl 142:44–57.
21. Overstreet DF (2005) Late-glacial ice-marginal adaptation in southeasternWisconsin. In: Bonnichsen R, Lepper BT, Stanford D, Waters MR, eds.Paleoamerican origins: beyond Clovis. College Station, TX: Center for theStudy of the First Americans. pp 183–195.
22. Goebel T (2007) The missing years for modern humans. Science 315: 194–196.23. Pitulko VV, Nikolsky PA, Girya EY, Basilyan AE, Tumskoy VE, et al. (2004)
The Yana RHS site: humans in the Arctic before the last glacial maximum.Science 303: 52–56.
24. Elias SA, Short SK, Nelson CH, Birks HH (1996) Life and times of the Bering land bridge. Nature 382: 60–63.
25. Hopkins DM (1982) Aspects of the paleogeography of Beringia during the LatePleistocene. In: Hopkins DM, Matthews JV, Schweger CE, Young SB, eds.Paleoecology of Beringia. New York: Academic Press. pp 3–28.
26. Hoffecker JF, Powers WR, Goebel T (1993) The colonization of Beringia andthe peopling of the New World. Science 259: 46–53.
27. Zazula GD, Froese DG, Schweger CE, Mathewes RW, Beaudoin AB, et al.(2003) Ice-age steppe vegetation in east Beringia. Nature 426: 603.
28. Guthrie RD (1990) Frozen fauna of the mammoth steppe. Chicago: Universityof Chicago Press.
29. Jobling MA, Hurles ME, Tyler-Smith C (2004) Into new found lands. HumanEvolutionary Genetics. New York: Garland Science. pp 339–372.
30. Pakendorf B, Stoneking M (2005) Mitochondrial DNA and human evolution. Annu Rev Genom Hum Genet 6: 165–183.
31. Wilson A, Cann R, Carr S, George M, Gyllensten U, et al. (1985) MitochondrialDNA and two perspectives on evolutionary genetics. Biol J Linn Soc 26:375–400.
32. Drummond AJ, Rambaut A, Shapiro B, Pybus OG (2005) Bayesian coalescentinference of past population dynamics from molecular sequences. Mol Biol Evol22: 1185–1192.
33. Non AL, Kitchen A, Mulligan CJ (2007) Identification of the most informativeregions of the mitochondrial genome for phylogenetic and coalescent analyses.Mol Phylogenet Evol 44: 1164–1171.
34. Kuzmin YV, Keates SG (2005) Dates are not just data: paleolithic settlementpatterns in Siberia derived from radiocarbon records. Am Antiquity 70:773–789.
35. Derenko M, Malyarchuk B, Grzybowski T, Denisova G, Dambueva I, et al.(2007) Phylogeographic analysis of mitochondrial DNA in northern AsianPopulations. Am J Hum Genet 81: 1025–1041.
36. Malhi RS, Eshleman JA, Greenberg JA, Weiss DA, Shook BAS, et al. (2002) Thestructure of diversity within new world mitochondrial DNA haplogroups:
Implications for the prehistory of North America. Am J Hum Genet 70:905–919.
37. O’Rourke DH, Hayes MG, Carlyle SW (2000) Spatial and temporal stability of mtDNA haplogroup frequencies in native North America. Hum Biol 72: 15–34.
38. Hoffecker JF, Elias SA (2003) Environment and archaeology in Beringia. Evol Anthropol 12: 34–49.
39. Mandryk CAS, Josenhans H, Fedje DW, Mathewes RW (2001) Late Quaternarypaleoenvironments of Northwestern North America: implications for inland
versus coastal migration routes. Quat Sci Rev 20: 301–314.
40. Kolman CJ, Bermingham E, Cooke R, Ward RH, Arias TD, et al. (1995)Reduced mtDNA diversity in the Ngobe Amerinds of Panama. Genetics 140:
273–283.41. Kolman CJ, Sambuughin N, Bermingham E (1996) Mitochondrial DNA
analysis of Mongolian populations and implications for the origin of New Worldfounders. Genetics 142: 1321–1334.
42. Merriwether DA, Rothhamer F, Ferrell RE (1995) Distribution of the 4 founding lineage haplotypes in Native Americans suggests a single wave of migration forthe New World. Am J Phys Anthropol 98: 411–430.
43. Fix AG (2005) Rapid deployment of the five founding Amerind mtDNAhaplogroups via coastal and riverine colonization. Am J Phys Anthropol 128:430–436.
44. Templeton AR (1998) Human races: a genetic and evolutionary perspective. Am Anthropol 100: 632–650.
45. Herrnstadt C, Elson JL, Fahy E, Preston G, Turnbull DM, et al. (2002)Reduced-median-network analysis of complete mitochondrial DNA coding-region sequences for the major African, Asian, and European haplogroups.
Am J Hum Genet 70: 1152–1171.
46. Ingman M, Kaessmann H, Paabo S, Gyllensten U (2000) Mitochondrial genome variation and the origin of modern humans. Nature 408: 708–713.
47. Kivisild T, Shen P, Wall DP, Do B, Sung R, et al. (2006) The role of selection in
the evolution of human mitochondrial genomes. Genetics 172: 373–387.48. Mishmar D, Ruiz-Pesini E, Golik P, Macaulay V, Clark A, et al. (2003) Natural
selection shaped regional mtDNA variation in humans. Proc Natl Acad Sci USA100: 171–176.
49. Thompson JD, Higgins DG, Gibson TJ (1994) CLUSTALW: improving thesensitivity of progressive multiple sequence alignment through sequenceweighting, position-specific gap penalties and weight matrix choice. Nucl AcidsRes 22: 4673–4680.
50. Handt O, Meyer S, von Haeseler A (1998) Compilation of human mtDNAcontrol region sequences. Nucl Acids Res 26: 126–129.
51. Polanski A, Kimmel M, Chakraborty R (1998) Application of a time-dependentcoalescence process for inferring the history of population size changes fromDNA sequence data. Proc Natl Acad Sci USA 95: 5456–5461.
52. Kitchen A, Miyamoto MM, Mulligan CJ (2007) Utility of DNA viruses forstudying human host history: Case study of JC virus. Mol Phylogenet Evol: InPress.
53. Howell N, Smejkal CB, Mackey DA, Chinnery PF, Turnbull DM, et al. (2003)The pedigree rate of sequence divergence in the human mitochondrial genome:there is a difference between phylogenetic and pedigree rates. Am J Hum Genet
72: 659–670.54. Weale ME, Weiss DA, Jager RF, Bradman N, Thomas MG (2002) Y
chromosome evidence for Anglo-Saxon mass migration. Mol Biol Evol 19:1008–1021.
55. Fenner JN (2004) Cross-cultural estimation of the human generation interval foruse in genetics-based population divergence studies. Am J Phys Anthropol 128:415–423.
56. Anderson S, Bankier AT, Barrell BG, de Bruijn MH, Coulson AR, et al. (1981)Sequence and organization of the human mitochondrial genome. Nature 290:457–465.
Peopling of the Americas
PLoS ONE | www.plosone.org 7 February 2008 | Volume 3 | Issue 2 | e1596