Embed Size (px)
Citation preview

A Three-Dimensional Geographic and Storm Surge Data Integration System forEvacuation Planning
Jairo Pava1, Fausto Fleites1, Fang Ruan1, Kasturi Chatterjee1, Shu-Ching Chen1, Keqi Zhang21Distributed Multimedia Information Systems Laboratory
2International Hurricane Research CenterFlorida International University, Miami, FL 33199
1{jpava001, fflei001, ruanf, kchat001, chens}@cs.fiu.edu,[email protected]
Abstract
The rise of offshore water caused by the high winds ofa low pressure weather system, or storm surge, is a hurri-cane’s greatest threat to human life. As weather forecastersstruggle to enable coastal residents to make timely evacua-tion decisions, the need arises for more visually compellingand interactive storm surge visualization tools. This paperpresents an interactive and three-dimensional storm surgevisualization system. It integrates road, topographic, andbuilding data to construct accurate three-dimensional mod-els of major cities in the State of Florida. Storm surge dataare then used to construct a three-dimensional ocean po-sitioned over the terrain models. Ambient details such aswind, vegetation, ocean waves, and traffic are animatedbased on up-to-date wind and storm surge data. Videosof the storm surge visualizations are recorded and madeavailable to coastal residents through a web-interface. Thethree-dimensional visualization of geographic and stormsurge data provides a more visually compelling represen-tation of the potential effects of storm surge than tradi-tional two-dimensional models and is more capable to en-able coastal residents to make potentially life-saving evac-uation decisions.
Keywords: Information Integration, Data Visualization,Geographic Information Systems, Storm Surge
1. Introduction
Hurricanes are the most destructive natural hazards tothreaten the United States East and Gulf coasts. The great-est threat to human life and property by a hurricane is stormsurge. Historically, storm surge has led to 90% of fatalitiescaused by hurricanes. Salt water flooding is also a majorcause of damage to buildings and infrastructure [5][7].
As low pressure weather systems, such as hurricanes, ap-proach a coastal area, storm surge models are used to esti-mate the potential storm surge at the projected landfall area.One such type of model is the Coastal and Estuarine StormTide (CEST) model developed by the International Hurri-cane Research Center (IHRC) [22][25]. The model takesinto consideration the expected tide at landfall and atmo-spheric pressure and wind of the weather system. It alsotakes into consideration major coastal topographic featuressuch as coastal ridges and barrier islands. Based on stormsurge models, coastal residents are warned and advised onevacuations through television, Internet, radio, and newspa-pers. Coastal residents, however, have been unable to relatethe two-dimensional evacuation maps broadcast over mediaoutlets to their three-dimensional life experiences. Conse-quently, emergency planners have struggled to avoid underand over-evacuation of coastal areas.
To address the issue of applying information and knowl-edge for enhancing timely evacuation decision-making, wepropose a three-dimensional storm surge visualization sys-tem that integrates Light Detection and Ranging (LiDAR)measurements, storm surge data, and road data in DigitalLine Graphics (DLGs) in the State of Florida to effectivelyaid coastal residents as they prepare for a storm. With theterm three-dimensional, we refer to a computer-generatedvirtual environment that may be interacted with and viewedwithin the spatial dimensions of depth, height, and width.Coastal residents will better relate to three-dimensional an-imations of their homes or businesses under storm surgeconditions and instantly be more disposed to regard officialevacuation notices. The work in [23] presents a storm surgevisualization system to display the effects of a rising stormsurge on vehicles during a hypothetical hurricane. However,it is highly scripted and the individual components used toanimate the storm surge, wind, traffic, and rain have to becarefully configured before every initialization. Therefore,it is not practical to use such a time-consuming system when

coastal residents must make time-sensitive evacuation deci-sions hours before storm impact. Furthermore, the systemdoes not have support for any formal storm surge model andcan therefore not be used to simulate official storm surgedata.
Our proposed system will extend the work in [23]. Itwill utilize data from the CEST model to automatically con-figure and update the storm surge visualization system inreal-time as updated storm surge data become available.Real-time refers to the latest official storm surge projec-tions which are typically updated every three to six hoursas a hurricane approaches landfall. In this manner, coastalresidents will be better informed when making potentiallylife-saving evacuation decisions. Additionally, researcherswill now have the ability to use our system with historicaldata to further study the effects of storm surge and help mit-igate its damage in the future. We have also developed aweb-based interface to overcome the hardware limitationsimposed by [23] so that all coastal residents and emergencyplanners, regardless of their available computational power,have access to our system’s storm surge visualizations.
The main contributions of this paper are as follows: (1) itprovides techniques for a synergetic integration of LiDARand storm surge data; (2) it presents a novel methodology toaccurately visualize real-time and historical hurricane stormsurge scenarios in a three-dimensional environment; and (3)it elaborates on a web-based integration of two and three-dimensional storm surge visualizations for coastal residentsand emergency planners.
The rest of this paper is organized as follows. Thenext section discusses the system architecture of our vi-sualization system. Section 3 describes how our systemprocedurally generates digital terrain models (DTMs) andbuild footprints from LiDAR measurements and roads fromDLG data. Section 4 describes how the output from theCEST model is used to animate the visualization. Sec-tion 5 describes a web-based interface for coastal residentsand emergency planners to view storm surge visualizations.Section 6 discusses related work. Sections 7 and 8 presentconcluding remarks and acknowledgements.
2. System Architecture
The proposed system utilizes and extends the facilitiesin the open-source Virtual Terrain Project (VTP) [13]. TheVTP is a set of two programs, VTBuilder and Enviro, whichare used to construct and render three-dimensional visu-alizations of geographic data. VTBuilder provides an in-terface to construct terrains, structures, and roads. Enviroprovides a highly interactive three-dimensional runtime en-vironment using OpenGL [10]. We have extended bothprograms to integrate large CEST model data sets, LiDARmeasurements, and DLGs for roads into a compelling three-
Figure 1. System Architecture
dimensional visualization of storm surge data.Figure 1 presents a high-level four-tier system architec-
ture used to integrate geographic and storm surge data forinteractive visualization. The data processing layer pro-vides the data management facilities that allow for con-version of LiDAR, DLG, and CEST data into formats thatserve as accessible input data to VTBuilder. Processedinput data is used in the construction layer to constructthree-dimensional representations of terrain, structures, androads. These data are then integrated to construct a finaldigital representation of the terrain with roads and build-ings. Wind and storm surge data, obtained from the CESTmodel, are used in the construction layer to drive graphicsanimation engines for wind, storm surge, vegetation, rain,traffic, and ocean waves. Access to the VTBuilder interfaceis bi-directional so that a user may modify processed dataafter it has been constructed into three-dimensional form.The DTM, buildings, roads, and graphics animation enginesare then integrated and passed on as inputs to the VTP’s En-viro for final rendering in the animation layer. This layerprovides an interactive three-dimensional navigation of thedigital terrain along with animated storm surge, rain, light-ing, cloud, vegetation, traffic, and sun visualizations.
3. Terrain Data Integration
In this section we provide background information onLiDAR and DLG data and how they are used to accuratelyrepresent topography, buildings, and roads in our system.

We then discuss how these data are integrated into a stan-dard format usable by the VTP for three-dimensional visu-alization.
3.1. LiDAR
LiDAR is a remote sensing system used to collect to-pographic data. The National Oceanic and AtmosphericAdministration (NOAA) collects LiDAR data with aircraft-mounted lasers that are capable of recording elevation mea-surements at a rate of 2,000 to 5,000 pulses per second witha vertical precision of six inches. LiDAR data points arestored as XYZ data points in text files where x is longitude,y is latitude, and z is the elevation at that point. The laser-scanned data include topographical measurements as wellas non-ground objects such as cars, buildings, and vegeta-tion. The data must, therefore, be processed into separatemeasurements for ground and non-ground objects to be us-able for three-dimensional animation.
3.2. Digital Terrain Model
To construct a DTM from LiDAR data, measurementsfrom ground and non-ground features have to be identifiedand categorized. The methodology used to remove non-ground measurements from LiDAR data is the progressivemorphological filter investigated by Zhang et al. in [24].The filter is based on dilation and erosion fundamentals ofset theory and has the advantage of filtering out non-groundobjects without prior knowledge of the size and elevationof the terrain. Additionally, the morphological filters auto-matically derive elevations for gaps in the LiDAR data us-ing nearest neighborhood interpolation. The resulting out-put from the morphological filters is converted to the Bi-nary Terrain (BT) [2] format with VTBuilder. A BT fileis an elevation grid consisting of elevation values at speci-fied geo-coordinates. BT files are used by Enviro to renderthree-dimensional representations of DTMs.
In an effort to model the geographic extents of the Stateof Florida, DTMs of nine cities have been created usingLiDAR data. They are Pensacola, Jacksonville, Tampa,St. Petersburg, West Palm Beach, Ft. Lauderdale, MiamiBeach, Key Biscayne, and Key West.
3.3. Automatic Building Construction
Extending upon the morphological filter in [24], we usethe framework in [26] to automatically construct build-ings from LiDAR measurements. Ground and non-groundLiDAR measurements are separated using the progressivemorphological filter. Building measurements are then iden-tified using a region-growing algorithm based on plane-fitting techniques. Raw footprints for building measure-ments are identified by connecting boundary points. These
<StructureCollectionxmlns:gml="http://www.opengis.net/gml"><Building>
<Level FloorHeight="3.0"StoryCount="1">
<Footprint><gml:coordinates>
587225.873,2851049.22587206.933,2851075.11587200.844,2851059.76587223.588,2851034.80
</gml:coordinates></Footprint><Edge Material="Siding"
Color="ffffff"><EdgeElement Type="Wall"/>
</Edge></Level>
</Building></StructureCollection>
Figure 2. VTST Structure File
raw footprints are then automatically refined to removenoise caused by irregularly spaced LiDAR measurements.The heights of the buildings are identified by averaging theelevation differences between building measurements andthe DTM constructed from non-ground measurements.
After identifying building footprints, VTBuilder is usedto construct a Virtual Terrain Structure (VTST) [14] filebased on the extensible markup language (XML) format.VTST is readable by the VTP and allows for systematiccreation of 3D building models based on the footprints.VTST is built upon the definition for the OpenGIS Geog-raphy Markup Language (GML) Implementation Specifica-tion, version 2.1.2 [9]. It is the standard for encoding geo-graphic data in XML.
Figure 2 presents a sample building footprint in theVTST format. Building footprint points are specifiedin counter-clockwise order using the VTP’s own two-dimensional coordinate system which corresponds to thegeo-coordinates in the LiDAR data. The building’s floorheight is specified in meters, and a building may have morethan one floor with respect to the story count attribute.The footprint vertex with the lowest elevation becomes theheight of the base of the building. Furthermore, buildingsmay be systematically textured by adding the Edge elementwith the appropriate attributes for material and color.
There exist advantages to using LiDAR data to constructbuilding models rather than 3D model creation software asproposed in [23]. By using geo-referenced LiDAR data

Figure 3. System engines and modules
points, a building is placed at its exact geo-coordinates onthe DTM and with accurate distance between its neighbor-ing buildings. We are able to do this within minutes of pro-cessing LiDAR data whereas it typically takes two to threehours, on average, to manually design one building model.Most importantly, we can be certain that building heightsare accurate and the relative storm surge height in the visu-alization is precise. However, while the VTST files allowus to procedurally texture the generated building models,we must manually texture landmark buildings to look morerealistic.
3.4. Road Distribution
United States Geological Survey (USGS) DLG data aredigital vector representations of cartographic information.The data are publicly available for download from the of-ficial USGS website [12]. Since the road data captured inDLG comes from scanned cartography, it does not containroad widths, names of streets, or traffic direction. However,the precise geo-coordinates of the DLG files as well as pub-licly available road map data [4] allow our system to renderroads with accurate placements and dimensions. VTBuilderis then used to convert the data from DLG into Road MapFormat (RMF) [11], a binary file format that stores the ex-tents of the DLG dataset and road coordinates and intersec-
tions. Enviro uses the RMF file to appropriately render theroads over the terrain.
4. CEST Integration
In this section we describe how the IHRC’s CEST modelis used to drive all of the graphics animation engines andmodules in the VTP to accurately and realistically renderthree-dimensional storm surge scenarios.
Figure 3 presents a minimal class diagram of all theengines that utilize CEST model data for animation. ThevtEngine is an abstract class provided by the VTP that co-ordinates the behavior of every animation within visualiza-tion. Its abstract eval() function is invoked once per frameand must be implemented by every class that inherits fromvtEngine with code that renders some change to the anima-tion. All of the engines that inherit or are otherwise associ-ated with vtEngine are described in the following sections.
4.1. Time Engine
The Time class implements the time engine to updatethe wind and storm surge modules. It keeps track of thetime in terms of days, hours, minutes, and seconds. It canalso be set to begin at specific times upon initialization for

Figure 4. Ocean wave simulation
simulation of historical or projected storms and can elapseat accelerated rates. At every invocation of its eval() func-tion, the time engine updates the current time and reads inthe wind and storm surge data corresponding to the sametime interval in the supplied CEST data. At the completionof every interval in the simulation, the time engine updatesthe storm surge and wind modules with new CEST data.
4.2. Wind Module
At every update, the wind module, implemented by theWind class, receives updated CEST model wind data fromthe time engine and correspondingly updates its currentwind direction and speed by calculating an average of allthe wind measurements within a one mile radius from thecurrently simulated location. It does not need to keep trackof the next set of wind data to read at the following update asthis is managed by the time engine. It does not inherit fromthe vtEngine class since it only needs to be updated when anew time interval has been approached by the time engine.Wind direction is measured in degrees and wind speed ismeasured in miles per hour. To maintain a synchronizedand fluid animation with respect to wind, the wind moduleis invoked once per frame by the vegetation and rain en-gines.
4.3. Vegetation and Rain Engines
The Vegetation class implements the vegetation engineto manage all of the trees in the animation. It uses an imple-mentation of vertex weighting [20] for animation of three-dimensional trees. At every frame in the animation, thevegetation engine performs rotation, bend, and rupture of
Figure 5. Vehicles respond to storm surge
individual tree branches based on wind speed and directiondata. Tree animation is an integral component of ambientdetails that adds to the experience of the visualization.
Similarly, the Rain class implements the rain engine torender the direction and speed of rain droplets based onwind data. While the CEST model does not predict precip-itation, other sources may be used to automatically gatherand incorporate this data into the visualization [6].
4.4. Storm Surge Module and Ocean Wave Engine
The storm surge module, implemented by the Storm-Surge class, receives updated CEST model data from thetime engine and updates the current storm surge height bycalculating an average of all the storm surge measurementswithin a one mile radius from the currently simulated lo-cation. The storm surge module is invoked by the oceanwave engine once per frame to render the varying heightand waves of the ocean.
The ocean is modeled by animating a mesh usingFournier’s model for ocean waves [18]. This model an-imates water particles in circular or elliptical stationaryorbits and takes into account the surface of the ocean’sfloor for breaking waves on the shore. Specifically, eachwater particle describes a circle around its rest position(x0, y0, z0), and the particle’s motion around the circle isgiven by the following parametric equations inx0 for agivent and a constantz0:
x = x0 + rsin(kx0 − ωt)z = z0 − rcos(kx0 − ωt)
TheXZ plane is the horizontal plane, and the height ofa wave is given on theZ axis. The above equations de-

scribe the curve generated by a point at a distancer fromthe center of a circle of radius1k ; the circle rolls over a lineat distance1k under theX axis [18]. Fort = 0 andz0 = 0,the equations are
x = −αk − rsin(α)
z = −rcos(α)
whereα = −kx0, the height of the wave isH = 2r, thewavelength isL = 2π
k , the period isT = 2πω , the phase
speed isc = LT = ω
k , and the phase isφ = kx0 − ωt -assuming a phase of 0 forx0. In deep ocean, the period andwavelength are related byL = gT 2
2π [18].The surface of the ocean’s floor is accounted for by in-
cluding the depthh at the point(x0, y0, z0) in a cumulativeway, meaning that the phase delay introduced by the deptheffect is carried over from deep ocean to the shore. Thewave numberk (the reciprocal of the wavelength) is a func-tion of h, h is a function ofx0, and the phase is given by theequation:
φ = −ωt +x0∫0
k(x)dx wherek(x) = k∞√tanh(k∞h(x))
The termk∞ is the wave number at deep ocean (infinitedepth) and is calculated byk∞ = ktanh(kh). An approxi-mation to the above equation is given by [18]:
φ = −ωt +x0∑0
k∞√tanh(k∞h(x))
∆x
The angular frequencyω and the wave numberk utilizedto calculatek∞ are given as input parameters in our simula-tion, and the timet is obtained from the temporal successionof frames of the wave engine. The waves begin their motionat deep ocean, where the depth is an arbitrary large numberMAXDEPTH, and move towards the shore, whereh(x)is simulated as an increasing slope fromMAXDEPTHto zero depth on the shore. Figure 4 shows our water ani-mation using the model just described.
4.5. Traffic Engine
The traffic system engine developed in [19] is used torender traffic on the roads placed on the terrain. The traf-fic engine keeps track of all the vehicles in the animationand updates the position of vehicles at every frame whilemaking sure that they follow road directions (stop lights,lanes, road direction, etc.) and avoid collisions with eachother. Furthermore, the traffic engine’s dependency to thestorm surge module enables it to respond to changes instorm surge and correspondingly force all vehicles to slowdown or stop if the storm surge rises beyond predeterminedthresholds. Figure 5 presents a screenshot of stalled vehi-cles due to high storm surge.
4.6. Sound
OpenAL is used to implement sound in our system. Itis a free cross-platform audio Application Programming In-terface (API) used in many games and simulation software[8]. OpenAL is designed for efficient three-dimensional au-dio. That is, any engine in the animation may specify thevelocity, position, direction, and intensity of a sound in athree-dimensional space. This provides a more realistic au-ditory component in the animation for wind, rain, vehicles,lightning, and vegetation. For example, as wind speed in-creases, the intensity of the professionally-recorded soundalso increases. Furthermore, as one navigates through thevisualization, the direction and intensity of sound changeswith respect to the current location in the terrain and thesound sources. The Sound class is a singleton and there-fore vtEngine has a reference to only one instance. Thisallows it to coordinate sounds from all the engines throughits playSound() function.
5. Web-based Interface
To make the storm surge visualizations accessible tocoastal residents, we have designed a web-based interface.It is based on the Google Maps API [3] and uses HTML,JSP, Ajax, JavaScript, and Flash web technologies. Figure 6presents a screen capture of the web interface. For clarifica-tion, areas in the web interface discussed below are labeledwith a number enclosed in a box.
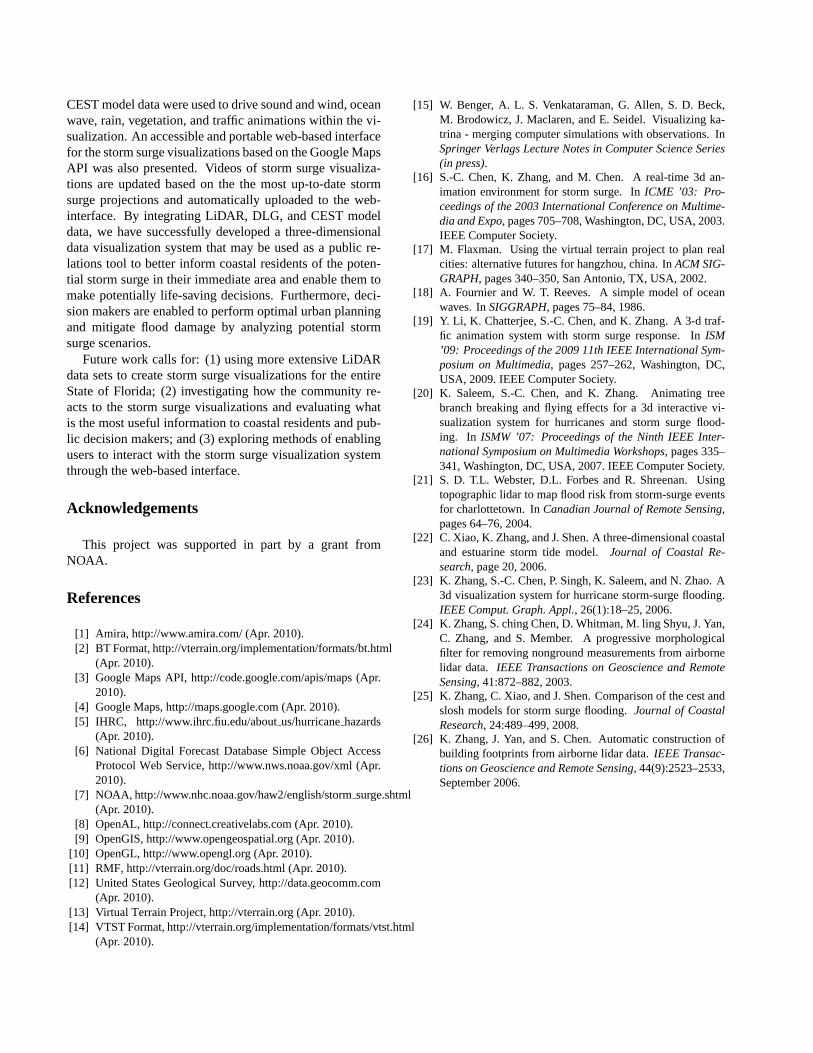
An interactive map of the State of Florida consumes ma-jor part of the user’s screen. To the right of the screen, asliding bar menu (label 1) contains an address locator whichprompts the user to enter the address of a storm surge vi-sualization he or she is interested in seeing. Upon havingan address submitted, the web interface queries a databaseof user-contributed storm surge multimedia within a twentymile radius. It then uses Ajax to seamlessly display the re-trieved images or videos without refreshing the page (label2). Simultaneously, the map on the screen centers on the ad-dress submitted, and a slightly transparent and color-codedimage (label 3) is superimposed over the map. The colorsof the image reflect the storm surge heights provided by thelatest CEST model data. If a visualization of the storm surgeis available at the location requested, a video icon (label 4)appears on the map. Clicking on the icon reveals a window,presented in Figure 7, with a video of the storm surge visu-alization. Videos are presented in Flash video format, havesound, and last for sixty seconds. Users have the option toset the size of the video to fit their screens. The videos areautomatically updated every three to six hours as updatedstorm surge data becomes available.
By presenting the visualizations of the storm surge sce-narios as videos, coastal residents are able to view the visu-
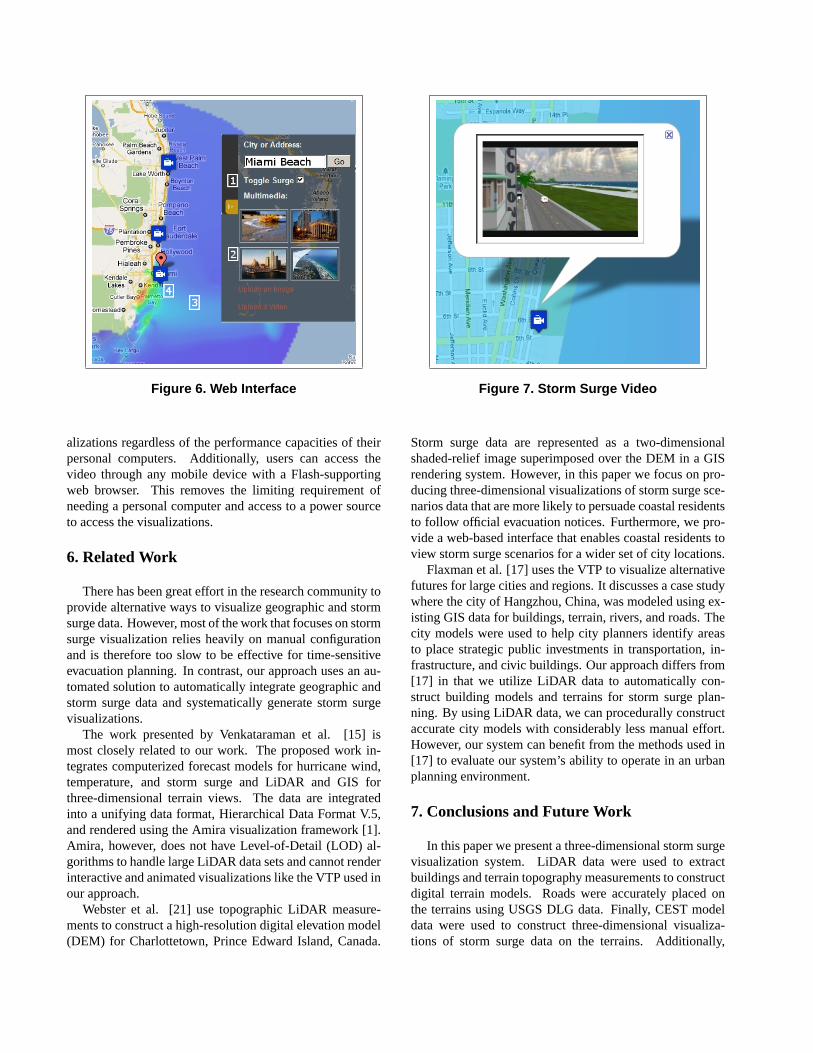
Figure 6. Web Interface
alizations regardless of the performance capacities of theirpersonal computers. Additionally, users can access thevideo through any mobile device with a Flash-supportingweb browser. This removes the limiting requirement ofneeding a personal computer and access to a power sourceto access the visualizations.
6. Related Work
There has been great effort in the research community toprovide alternative ways to visualize geographic and stormsurge data. However, most of the work that focuses on stormsurge visualization relies heavily on manual configurationand is therefore too slow to be effective for time-sensitiveevacuation planning. In contrast, our approach uses an au-tomated solution to automatically integrate geographic andstorm surge data and systematically generate storm surgevisualizations.
The work presented by Venkataraman et al. [15] ismost closely related to our work. The proposed work in-tegrates computerized forecast models for hurricane wind,temperature, and storm surge and LiDAR and GIS forthree-dimensional terrain views. The data are integratedinto a unifying data format, Hierarchical Data Format V.5,and rendered using the Amira visualization framework [1].Amira, however, does not have Level-of-Detail (LOD) al-gorithms to handle large LiDAR data sets and cannot renderinteractive and animated visualizations like the VTP used inour approach.
Webster et al. [21] use topographic LiDAR measure-ments to construct a high-resolution digital elevation model(DEM) for Charlottetown, Prince Edward Island, Canada.
Figure 7. Storm Surge Video
Storm surge data are represented as a two-dimensionalshaded-relief image superimposed over the DEM in a GISrendering system. However, in this paper we focus on pro-ducing three-dimensional visualizations of storm surge sce-narios data that are more likely to persuade coastal residentsto follow official evacuation notices. Furthermore, we pro-vide a web-based interface that enables coastal residents toview storm surge scenarios for a wider set of city locations.
Flaxman et al. [17] uses the VTP to visualize alternativefutures for large cities and regions. It discusses a case studywhere the city of Hangzhou, China, was modeled using ex-isting GIS data for buildings, terrain, rivers, and roads. Thecity models were used to help city planners identify areasto place strategic public investments in transportation, in-frastructure, and civic buildings. Our approach differs from[17] in that we utilize LiDAR data to automatically con-struct building models and terrains for storm surge plan-ning. By using LiDAR data, we can procedurally constructaccurate city models with considerably less manual effort.However, our system can benefit from the methods used in[17] to evaluate our system’s ability to operate in an urbanplanning environment.
7. Conclusions and Future Work
In this paper we present a three-dimensional storm surgevisualization system. LiDAR data were used to extractbuildings and terrain topography measurements to constructdigital terrain models. Roads were accurately placed onthe terrains using USGS DLG data. Finally, CEST modeldata were used to construct three-dimensional visualiza-tions of storm surge data on the terrains. Additionally,
CEST model data were used to drive sound and wind, oceanwave, rain, vegetation, and traffic animations within the vi-sualization. An accessible and portable web-based interfacefor the storm surge visualizations based on the Google MapsAPI was also presented. Videos of storm surge visualiza-tions are updated based on the the most up-to-date stormsurge projections and automatically uploaded to the web-interface. By integrating LiDAR, DLG, and CEST modeldata, we have successfully developed a three-dimensionaldata visualization system that may be used as a public re-lations tool to better inform coastal residents of the poten-tial storm surge in their immediate area and enable them tomake potentially life-saving decisions. Furthermore, deci-sion makers are enabled to perform optimal urban planningand mitigate flood damage by analyzing potential stormsurge scenarios.
Future work calls for: (1) using more extensive LiDARdata sets to create storm surge visualizations for the entireState of Florida; (2) investigating how the community re-acts to the storm surge visualizations and evaluating whatis the most useful information to coastal residents and pub-lic decision makers; and (3) exploring methods of enablingusers to interact with the storm surge visualization systemthrough the web-based interface.
Acknowledgements
This project was supported in part by a grant fromNOAA.
References
[1] Amira, http://www.amira.com/ (Apr. 2010).[2] BT Format, http://vterrain.org/implementation/formats/bt.html
(Apr. 2010).[3] Google Maps API, http://code.google.com/apis/maps (Apr.
2010).[4] Google Maps, http://maps.google.com (Apr. 2010).[5] IHRC, http://www.ihrc.fiu.edu/aboutus/hurricanehazards
(Apr. 2010).[6] National Digital Forecast Database Simple Object Access
Protocol Web Service, http://www.nws.noaa.gov/xml (Apr.2010).
[7] NOAA, http://www.nhc.noaa.gov/haw2/english/stormsurge.shtml(Apr. 2010).
[8] OpenAL, http://connect.creativelabs.com (Apr. 2010).[9] OpenGIS, http://www.opengeospatial.org (Apr. 2010).
[10] OpenGL, http://www.opengl.org (Apr. 2010).[11] RMF, http://vterrain.org/doc/roads.html (Apr. 2010).[12] United States Geological Survey, http://data.geocomm.com
(Apr. 2010).[13] Virtual Terrain Project, http://vterrain.org (Apr. 2010).[14] VTST Format, http://vterrain.org/implementation/formats/vtst.html
(Apr. 2010).
[15] W. Benger, A. L. S. Venkataraman, G. Allen, S. D. Beck,M. Brodowicz, J. Maclaren, and E. Seidel. Visualizing ka-trina - merging computer simulations with observations. InSpringer Verlags Lecture Notes in Computer Science Series(in press).
[16] S.-C. Chen, K. Zhang, and M. Chen. A real-time 3d an-imation environment for storm surge. InICME ’03: Pro-ceedings of the 2003 International Conference on Multime-dia and Expo, pages 705–708, Washington, DC, USA, 2003.IEEE Computer Society.
[17] M. Flaxman. Using the virtual terrain project to plan realcities: alternative futures for hangzhou, china. InACM SIG-GRAPH, pages 340–350, San Antonio, TX, USA, 2002.
[18] A. Fournier and W. T. Reeves. A simple model of oceanwaves. InSIGGRAPH, pages 75–84, 1986.
[19] Y. Li, K. Chatterjee, S.-C. Chen, and K. Zhang. A 3-d traf-fic animation system with storm surge response. InISM’09: Proceedings of the 2009 11th IEEE International Sym-posium on Multimedia, pages 257–262, Washington, DC,USA, 2009. IEEE Computer Society.
[20] K. Saleem, S.-C. Chen, and K. Zhang. Animating treebranch breaking and flying effects for a 3d interactive vi-sualization system for hurricanes and storm surge flood-ing. In ISMW ’07: Proceedings of the Ninth IEEE Inter-national Symposium on Multimedia Workshops, pages 335–341, Washington, DC, USA, 2007. IEEE Computer Society.
[21] S. D. T.L. Webster, D.L. Forbes and R. Shreenan. Usingtopographic lidar to map flood risk from storm-surge eventsfor charlottetown. InCanadian Journal of Remote Sensing,pages 64–76, 2004.
[22] C. Xiao, K. Zhang, and J. Shen. A three-dimensional coastaland estuarine storm tide model.Journal of Coastal Re-search, page 20, 2006.
[23] K. Zhang, S.-C. Chen, P. Singh, K. Saleem, and N. Zhao. A3d visualization system for hurricane storm-surge flooding.IEEE Comput. Graph. Appl., 26(1):18–25, 2006.
[24] K. Zhang, S. ching Chen, D. Whitman, M. ling Shyu, J. Yan,C. Zhang, and S. Member. A progressive morphologicalfilter for removing nonground measurements from airbornelidar data. IEEE Transactions on Geoscience and RemoteSensing, 41:872–882, 2003.
[25] K. Zhang, C. Xiao, and J. Shen. Comparison of the cest andslosh models for storm surge flooding.Journal of CoastalResearch, 24:489–499, 2008.
[26] K. Zhang, J. Yan, and S. Chen. Automatic construction ofbuilding footprints from airborne lidar data.IEEE Transac-tions on Geoscience and Remote Sensing, 44(9):2523–2533,September 2006.