Embed Size (px)
Citation preview
The Pennsylvania State University
The Graduate School
College of Health and Human Development
A THREE-COMPONENT FRAMEWORK FOR
TRADE SHOW PERFORMANCE EVALUATION
A Dissertation in
Recreation, Park and Tourism Management
by
Yeqiang Lin
2014 Yeqiang Lin
Submitted in Partial Fulfillment
of the Requirements
for the Degree of
Doctor of Philosophy
August 2014
The dissertation of Yeqiang Lin was reviewed and approved* by the following:
Deborah L. Kerstetter
Professor of Recreation, Park and Tourism Management
Professor in Charge of the Graduate Program
Dissertation Advisor
Chair of Committee
Alan R. Graefe
Professor of Recreation, Park and Tourism Management
Benjamin D. Hickerson
Assistant Professor of Recreation, Park and Tourism Management
Donald C. Hambrick
Evan Pugh Professor and the Smeal Chaired Professor of Management
*Signatures are on file in the Graduate School
iii
ABSTRACT
Satisfaction is one of the most studied subjects in the field of tourism, yet there
have been few studies of satisfaction with trade shows, which represent a sizeable and
increasingly important segment of the industry. Efforts to address satisfaction with trade
show performance at the theoretical level have been quite limited or nonexistent.
Furthermore, previous studies have failed to recognize the three key stakeholders in the
trade show industry (i.e., visitors, exhibitors, and organizers) and the outcomes (e.g.,
satisfaction and behaviors) of their interactions. This dissertation fills this gap by 1)
proposing a trade show performance evaluation framework that accounts for the
relationships between visitors, exhibitors, and organizers; 2) constructing a measurement
scale on exhibitors’ satisfaction based on the proposed conceptual framework; and 3)
applying the scale at multiple trade shows to examine its reliability and validity and the
relationships between the three dimensions and behavioral intention.
The results of the dissertation are spread out across three chapters (i.e., Chapter 2,
3 and 4), each of which is written as a separate manuscript. In the first manuscript
(Chapter 2) I proposed the Visitor-Exhibitor-Organizer (VEO) framework, which could
be used by trade show organizers to measure their customers’ (i.e., exhibitors and
visitors) satisfaction and positive behavioral intention. Based on the VEO framework, an
exhibitor and a visitor performance evaluation model were constructed. The results
validated the VEO framework by indicating that it is not adequate to focus on one
stakeholder when evaluating trade show performance.
The second manuscript (Chapter 3) focused on exhibitors’ satisfaction. This
manuscript outlined how I constructed and validated a measurement scale that accounts
iv
for the significant roles of all three key stakeholders through a pilot test, scale
purification and validation. The final instrument consisted of 46-items that represented 12
sub-dimensions and 3 dimensions of exhibitors’ satisfaction. The resulting instrument
was found to be superior to existing instruments in that it comprehensively measures
exhibitors’ performance at a trade show and explains a large portion of exhibitors’ overall
satisfaction.
In the third manuscript (Chapter 4) I applied the 46-item measurement scale on
exhibitors’ satisfaction to predict positive behavioral intention. Using data from 594
exhibitors at three trade shows, it was found that all three dimensions (i.e., satisfaction
with self-performance, satisfaction with organizers, and satisfaction with visitors) are
significantly and positively related to exhibitors’ positive behavioral intention.
Satisfaction with organizers turned out to be the dominant predictor and the three
dimensions in combination explained approximately two thirds of the variance in
exhibitors’ positive behavioral intention.
As a whole, the findings have significant theoretical and managerial implications.
This dissertation introduced a new approach to measuring satisfaction in the trade show
industry by incorporating key stakeholders in the evaluation framework. Trade show
organizers could use the measurement scale to assess exhibitors’ overall satisfaction,
measure their behavioral intention, and manage and promote their trade shows.
Furthermore, the findings indicated that satisfaction with organizers is the strongest
predictor of exhibitors’ positive behavioral intention, while satisfaction with self-
performance and visitors also positively affected positive behavioral intention.
v
TABLE OF CONTENTS
List of Figures .............................................................................................................. viii
List of Tables ............................................................................................................... ix
Acknowledgements ...................................................................................................... x
Chapter 1 Introduction ................................................................................................. 1
Literature Review ................................................................................................. 3 Trade Shows .................................................................................................. 3 Trade Shows in China ................................................................................... 4 Organizer-Oriented Trade Show Evaluation ................................................. 5 Key Stakeholders in Trade Show Evaluation ................................................ 6 Self-Performance ........................................................................................... 7 The Links between Visitors and Key Stakeholders ....................................... 10 The Exhibitor-Organizer Link ....................................................................... 12 Satisfaction .................................................................................................... 13 Behavioral Intention ...................................................................................... 15
Methods ................................................................................................................ 18 Scale Development ........................................................................................ 19 Content Validity ............................................................................................ 22 Pilot Testing ................................................................................................... 23 Scale Validation ............................................................................................. 24 Sampling ........................................................................................................ 24 Final Data Collection Method ....................................................................... 25 Survey Data Analysis Procedures ................................................................. 26
Chapter 2 A Three-Component Framework for Trade Show Organizers’
Performance Evaluation ........................................................................................ 38
Introduction ........................................................................................................... 38 Literature Review ................................................................................................. 39
Stakeholder theory and key stakeholders in trade shows .............................. 39 Trade show performance evaluation ............................................................. 42 Satisfaction .................................................................................................... 44 Behavioral intention ...................................................................................... 46
Methodology ......................................................................................................... 49 Data collection ............................................................................................... 49 Instrument ...................................................................................................... 50 Data analysis .................................................................................................. 51
Results................................................................................................................... 52 Conclusions and Discussion ................................................................................. 57 Limitations and Future Research .......................................................................... 60 References ............................................................................................................. 62
vi
Chapter 3 Developing a Trade Show Exhibitor’s Satisfaction Measurement Scale .... 70
INTRODUCTION ................................................................................................ 70 LITERATURE REVIEW ..................................................................................... 72
Satisfaction in Trade Shows .......................................................................... 72 Stakeholder Theory and Key Stakeholders in Trade Shows ......................... 73 Three Dimensions of Exhibitor’s Satisfaction .............................................. 77
SCALE DEVELOPMENT ................................................................................... 81 Item Generation and Content Validity .......................................................... 81 Purification of the Measurement Scale .......................................................... 84
SCALE VALIDATION ........................................................................................ 90 Convergent Validity ...................................................................................... 93 Discriminant Validity .................................................................................... 95 Predictive Validity ......................................................................................... 96
DISCUSSION AND IMPLICATIONS ................................................................ 97 MANAGERIAL IMPLICATIONS ...................................................................... 99 LIMITATIONS AND FUTURE RESEARCH .................................................... 100 REFERENCES ..................................................................................................... 103
Chapter 4 An Exploratory Study on Determinants of Exhibitors’ Behavioral
Intention ................................................................................................................ 111
Introduction ........................................................................................................... 111 Literature Review ................................................................................................. 114
Behavioral intention ...................................................................................... 114 Determinants of Exhibitors’ Positive Behavioral Intention .......................... 115
Methods ................................................................................................................ 120 Variables and Measurements ......................................................................... 121
Data Analysis and Results .................................................................................... 123 Sample Characteristics .................................................................................. 123 Measurement Model ...................................................................................... 127 Structural Equation Model ............................................................................ 130
Discussion and Implications ................................................................................. 133 Practical Implications .................................................................................... 135
Limitations and Direction for Future Studies ....................................................... 136 References ............................................................................................................. 138
Chapter 5 Conclusion ................................................................................................... 146
Summary of Key Findings .................................................................................... 146 The VEO Conceptual Framework ................................................................. 146 Measurement Scale on Exhibitors’ Satisfaction ............................................ 147 Determinants of Exhibitors’ Positive Behavioral Intention .......................... 147
Theoretical Implications ....................................................................................... 149 Managerial Implications ....................................................................................... 151
vii
Limitations and Direction for Future Research .................................................... 153 References ............................................................................................................. 162
Appendix: Final Survey Items .................................................................................... 166
viii
LIST OF FIGURES
Figure 1-1. Proposed VEO Framework for Trade Show Evaluation……...………………7
Figure 1-2. VEO Framework on Exhibitors’ Performance Evaluation…..……………….17
Figure 2-1. Proposed VEO Framework for Trade Show Evaluation………………….….41
Figure 2-2. VEO Framework on Exhibitor Evaluation……………..………...……….….48
Figure 2-3. VEO Framework on Visitor Evaluation ……………………………....….….49
Figure 2-4. SEM Results on the Exhibitor Model…………………...…………………....54
Figure 2-5. SEM Results on the Visitor Model ……………………...……………......….55
Figure 3-1. Proposed VEO Framework…………………………………….…….…...….76
Figure 3-2. VEO Framework on Exhibitor’ Satisfaction…………..……………...……...81
Figure 4-1. Proposed Model on Exhibitors’ Positive Behavioral Intention.……....….…114
Figure 4-2. Structural Model with Standardized Path Coefficients…………….…....….132
Figure 5-1. Mediation Model.…………………………………...…………….…….…..160
Figure 5-2. Conducting Evaluation and Firm Performance ……………...………….….161
ix
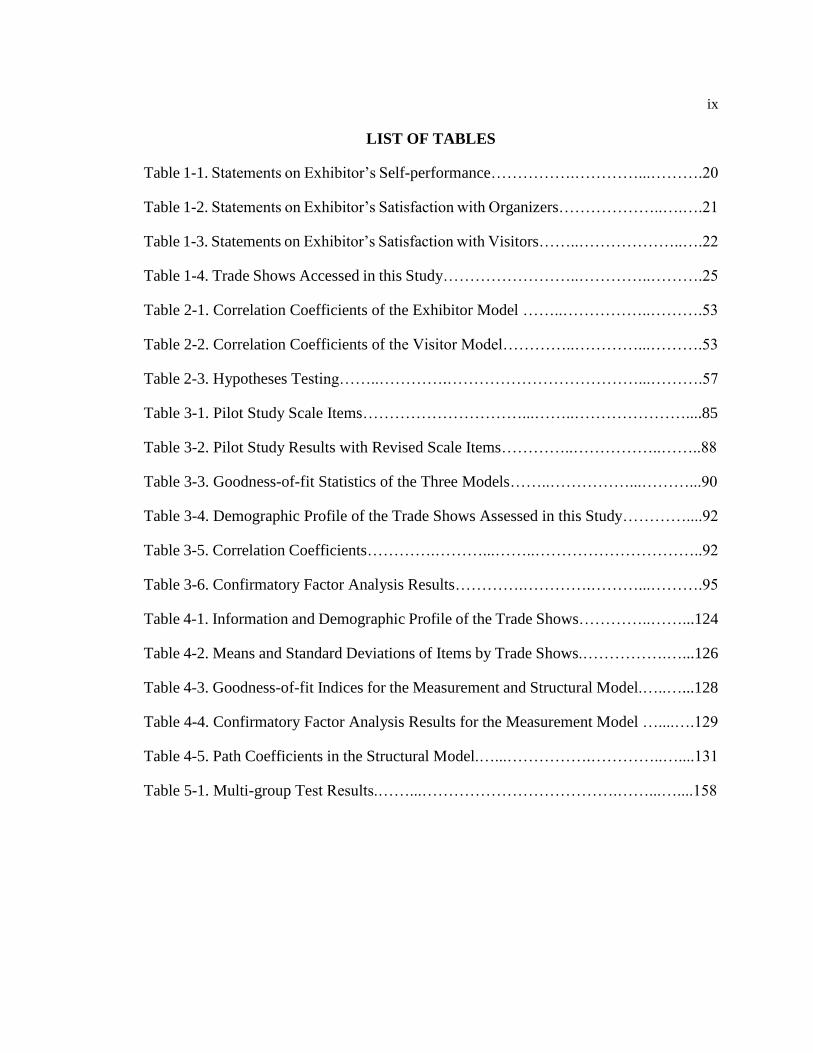
LIST OF TABLES
Table 1-1. Statements on Exhibitor’s Self-performance…………….…………...……….20
Table 1-2. Statements on Exhibitor’s Satisfaction with Organizers………………..….….21
Table 1-3. Statements on Exhibitor’s Satisfaction with Visitors……..………………..….22
Table 1-4. Trade Shows Accessed in this Study……………………..…………..……….25
Table 2-1. Correlation Coefficients of the Exhibitor Model ……..……………..……….53
Table 2-2. Correlation Coefficients of the Visitor Model…………..…………...……….53
Table 2-3. Hypotheses Testing……..………….………………………………...……….57
Table 3-1. Pilot Study Scale Items…………………………...……..…………………....85
Table 3-2. Pilot Study Results with Revised Scale Items…………..……………..……..88
Table 3-3. Goodness-of-fit Statistics of the Three Models……..……………...………...90
Table 3-4. Demographic Profile of the Trade Shows Assessed in this Study…………....92
Table 3-5. Correlation Coefficients………….………...……..…………………………..92
Table 3-6. Confirmatory Factor Analysis Results………….………….………...……….95
Table 4-1. Information and Demographic Profile of the Trade Shows…………..……...124
Table 4-2. Means and Standard Deviations of Items by Trade Shows.…………….…...126
Table 4-3. Goodness-of-fit Indices for the Measurement and Structural Model.…..…...128
Table 4-4. Confirmatory Factor Analysis Results for the Measurement Model …....….129
Table 4-5. Path Coefficients in the Structural Model.…...…………….…………..…....131
Table 5-1. Multi-group Test Results.……...……………………………….……...…....158

x
ACKNOWLEDGEMENTS
I would like to first thank Dr. Deborah Kerstetter for her guidance in the past four
years. Deb is the best advisor one can find in our field. I was lucky enough to have her as
my mentor and dissertation chair. Deb help me every step of the way, from my first
publication to my first lecture. And, of course, this dissertation would not be possible
without her meticulous editing and comments.
I would also like to acknowledge the great professors I have on my dissertation
committee. Dr. Alan Graefe is very knowledgeable about research design and statistics
and provided several constructive ideas on survey items used in this dissertation. With his
business administration background, Dr. Benjamin Hickerson discussed literature on
service quality with me and pointed out how service quality applied in the conceptual
framework proposed in this study. Dr. Donald Hambrick is a guru on management
theories. With years of experience in the academic field as well as the business field, Don
shared his insight on managerial innovation and the effects of upper echelon
characteristics on responses.
The staff at Huangpu International Convention and Exhibition Center contributed
tremendously to this dissertation. Thanks to their time on the trade show floor, I have
collected enough responses to conduct structural equation modeling. I would also like to
thank Ms. Carunchio, Ms. Rauscher, Mr. Shi and Mr. Hu for allowing me to collect data
at the trade shows they organized.
The faculty members, graduate students, and staff members in the department also
helped me a lot along the way. I would like to especially thank my fellow graduate

xi
students who have made my journey much more enjoyable by sharing their experiences
and accompanying me to sports and other recreational activities.
I would like to thank my mother, father, and grandpa for their support throughout
the years. They gave the strength to fight on during hard times. They also cheered for me
on every little achievement from kindergarten to graduate school. Lastly, I would like to
thank my wife for enduring me and taking good care of me in the past five years.
1
Chapter 1 Introduction
Customer satisfaction has been studied extensively in tourism (Gursoy, McCleary
& Lepsito 2007; Jung, 2005; Neal & Gursoy, 2008; Zhang, Qu, & Ma, 2010). However,
much of the research has been conducted with customers only and ignored other equally
important stakeholders (Lee & Back, 2009). This myopic approach is especially
problematic in one segment of the tourism industry—trade shows (Harris, 2000).
Trade shows are the largest business-to-business (B2B) marketing medium and a
multi-billion-dollar industry (American Business Media, 2013). Participants can visit
with more customers (the majority of whom have high levels of purchase influence) in
one hour than they normally would in a week (Gillette, 2001; Rosson & Seringhaus,
1995). Thus, trade shows constitute an important component of businesses’ marketing
portfolios.
Although there have been many studies on trade show performance, two major
issues have not been addressed. First, efforts to define trade show performance at the
theoretical level have been quite limited or nonexistent (Hansen, 2004); most studies
have focused on observational indicators such as actual sales at the show, number of
leads, and attraction efficiency (e.g., Dekimpe, François, Gopalakrishna, Lilien, & van
den Bulte, 1997; Gopalakrishna & Lilien, 1995; Kerin & Cron, 1987). The authors of
these studies have claimed that their measures are indicators of performance, but failed
to support those claims with clear definitions of specific dimensions or to provide
evidence of reliability and validity. As a result, the connection between the theoretical
and observational levels is not well demonstrated, and the trade show performance
2
literature lacks a comprehensive conceptual framework of trade show performance as
well as reliable and valid scales (Hansen, 2004).
Second, previous studies have failed to recognize the three key stakeholders (i.e.,
visitors, exhibitors, and organizers) and the outcomes (e.g., perceptions, behaviors) of
their interactions. Most of the literature on trade show performance evaluation has
examined the performance of one group at a time and ignored its interactions with other
stakeholders (e.g., Berne & García-Uceda, 2008; Gopalakrishna & Lilien, 1995; Hansen,
1999; Reinhold, Reinhold, & Schmitz, 2010). Exceptions include studies by Herbig,
O’Hara, and Palumbo (1997), Munuera and Ruiz (1999), and Jin, Weber, and Bauer
(2012). They accounted for the relationships between two stakeholders and their impacts
on trade show performance. No studies on the intricate relationships between all three
key stakeholders—trade show visitors, exhibitors, and organizers—exist.
Stakeholder theory (Freeman, 1984) recognizes that successful performance of a
business is dependent on the external environment, which is made up of key stakeholders.
In a trade show setting the key stakeholders or “actors” are visitors, exhibitors, and
organizers. Face-to-face contact is a key feature of a trade show that distinguishes it from
other types of B2B marketing and is one of its most valuable features (Godar &
O’Connor, 2001). The interactions that take place at a trade show also involve organizers
(Jin et al., 2012), the third key stakeholder, whose customers are visitors and exhibitors
(Jung, 2005). The eventual success of a trade show depends largely on its ability to meet
the objectives of all three key stakeholders (Gopalakrishna, Roster, & Sridhar, 2010).
The specific objectives of this study are to: 1) propose a trade show performance
evaluation framework that accounts for the relationships between visitors, exhibitors, and
3
organizers; 2) construct a measurement scale on exhibitors’ satisfaction based on the
proposed conceptual framework; and 3) apply the scale at multiple trade shows to
examine its reliability and validity. It is expected that the results of this study will lay the
groundwork for a new trade show performance evaluation framework that can be used in
future trade show research. Further, the results will contribute to the literature by
introducing a new comprehensive approach to measuring satisfaction and behavioral
intention in a trade show context.
Literature Review
Trade Shows
Trade shows represent a multi-billion dollar industry. In 1983, more than 91,000
firms spent $7 billion exhibiting products and services to more than 31 million
prospective buyers at more than 8,000 trade shows in the United States (U.S.; Trade
Show Bureau, 1986). By 1998, 1.5 million companies were spending 17.3% of their
marketing budget (i.e., $12.6 billion) on trade shows (Harris, 2000). The most recent
report indicates that trade show spending is now the biggest B2B marketing expenditure
(American Business Media, 2013).
The Convention Industry Council (CIC, 2004) defines a trade show as an
exhibition of products and/or services held for members of a common or related industry.
Its fundamental purpose is to bring buyers (i.e., visitors) and sellers (i.e., exhibitors)
together. As the largest B2B marketing medium (American Business Media, 2013), trade
shows allow exhibitors to visit with more visitors in an hour than they would normally
see in a week (Gillette, 2001), which is compelling because 79% to 90% of the visitors at
4
trade shows have high levels of purchase influence (Rosson & Seringhaus, 1995). But, do
these interactions lead to satisfactory outcomes such as higher profitability for the
exhibitor, intention to return, and positive word-of-mouth?
The advantages of trade shows have been discussed extensively through the years.
Average total costs per contact at a show for an exhibiting company have remained
consistently at one third of the cost of a personal sales call. According to the Trade Show
Bureau (1994), it takes an average of 3.7 sales calls to close a deal at $292 per call,
versus $185 to close a deal at a trade show followed by 0.8 follow-up sales calls. These
figures yield a total cost of $1,080 (3.7 x $292) for sales calls versus $419 ($185+0.8 x
$292) for trade shows. Additional advantages of using a trade show include: the
opportunity to affect multiple phases of the buying process in a single location; creating
awareness of new products or services; reinforcing existing customer relationships;
providing product or service demonstrations for evaluation; establishing relationships
between vendors and prospects; allowing sales of products or services on site; and
significantly influencing industrial buying during the need recognition and vendor
evaluation stages of the purchase process (Bonoma, 1983; Kerin & Cron, 1987).
Trade Shows in China
In recent years countries in other parts of the world have begun to support trade
shows. Asia has capitalized on this market with extensive investment in conference and
exhibition infrastructure (Weber & Ladkin, 2009). China’s trade show industry has
witnessed rapid development within the past decade. Convention centers are being built
all over the country and the government is extremely supportive of the development of
5
the trade show industry. According to the Global Association of the Exhibition Industry
(UFI), China’s indoor exhibition space amounted to 2.5 million square meters in 2007,
the third highest in the world after the U.S. and Germany. It was estimated that in 2010
the total indoor exhibition space in China would have increased to almost 3 million
square meters (UFI, 2007). Exhibitors’ satisfaction and decision-making with respect to
trade shows in China, however, has received relatively little attention. Thus, China is a
viable context in which to conduct this study.
Organizer-Oriented Trade Show Evaluation
Organizers are the main propeller of the trade show industry and play an
important role in its success. Despite their importance, management and marketing issues
organizers face have been given scant attention in the literature. Berne and García-Uceda
(2008) argued that with increased competition trade show organizers will have to
differentiate themselves by offering user-oriented services such as guarantees (i.e., trade
show will attract a large number of exhibitors and visitors) and/or evaluations that
organizers can use to assess their customers’ satisfaction and guide their future strategies.
A primary objective of trade show organizers is to create effective shows that
result in positive outcomes for both exhibitors and visitors. However, the amount of
research into what makes an effective trade show and what contributes to visitors’ and
exhibitors’ satisfaction remains limited (Gottlieb, Brown, & Drennan, 2011). Further, few
researchers have analyzed trade show evaluation systematically from the organizer’s
perspective.
6
Key Stakeholders in Trade Show Evaluation
A central argument of stakeholder theory is that businesses need to address all
stakeholders’ interests rather than maximize one group’s position to the detriment of
others (Freeman & McVea, 2001). In the context of trade shows, there are three
stakeholders: visitors, exhibitors, and organizers (Jin et al., 2012).
A common objective of trade show organizers is to increase the number of
exhibitors and visitors. To do this organizers must document and act upon the behaviors
and satisfaction of exhibitors and visitors and why and how they make decisions. In
documenting this information all key stakeholders must be studied as their satisfaction
and positive behavioral intention are dependent on other stakeholders. To date, most
studies on trade shows have only incidentally touched upon the intricate relationships
between the three key stakeholders (i.e., visitors, exhibitors, and organizers); they have
failed to account for (a) all of the stakeholders and (b) how their interactions with each
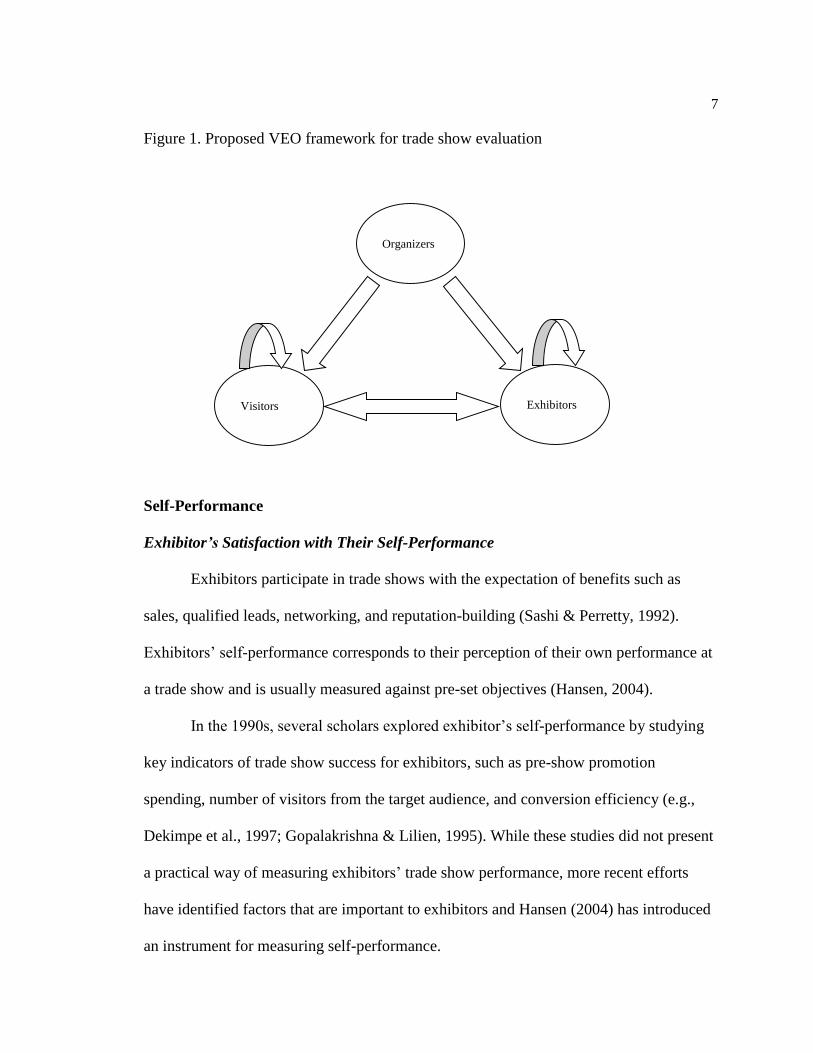
other impact their own satisfaction and positive behavioral intention. Thus, to begin, this
study intends to construct and validate a Visitor-Exhibitor-Organizer (VEO) conceptual
framework that emphasizes the relationships between the three key stakeholders (Figure
1). In the VEO framework exhibitors’ and visitors’ overall satisfaction with a trade show
consists of three components, satisfaction with self-performance and satisfaction with the
other two key stakeholders, respectively. Each of the links within the VEO framework
are addressed more thoroughly in the following sections.
7
Figure 1. Proposed VEO framework for trade show evaluation
Self-Performance
Exhibitor’s Satisfaction with Their Self-Performance
Exhibitors participate in trade shows with the expectation of benefits such as
sales, qualified leads, networking, and reputation-building (Sashi & Perretty, 1992).
Exhibitors’ self-performance corresponds to their perception of their own performance at
a trade show and is usually measured against pre-set objectives (Hansen, 2004).
In the 1990s, several scholars explored exhibitor’s self-performance by studying
key indicators of trade show success for exhibitors, such as pre-show promotion
spending, number of visitors from the target audience, and conversion efficiency (e.g.,
Dekimpe et al., 1997; Gopalakrishna & Lilien, 1995). While these studies did not present
a practical way of measuring exhibitors’ trade show performance, more recent efforts
have identified factors that are important to exhibitors and Hansen (2004) has introduced
an instrument for measuring self-performance.
Organizers
Visitors Exhibitors
8
Trade show exhibitors have indicated that qualified leads and customer
relationships are more important than selling activities (Seringhaus & Rosson, 2004). In
addition, they value information-sharing, sense-making, and developing relationship-
specific memories. Li (2007) contended that these outcomes could occur between
exhibitors and visitors in trade shows and that their influence on performance outcomes
as perceived by exhibitors was quite powerful.
Hansen (2004) argued that trade show performance should be evaluated using a
combination of outcome-based and behavior-based measures. Hansen constructed a
measurement scale that included one outcome-based dimension (sales-related activities)
and four behavior-based dimensions (information-gathering activities, image-building
activities, motivation activities, and relationship-building activities). These five
dimensions have been empirically examined and the results indicate excellent reliability
and validity.
Visitor’s Satisfaction with Their Self-performance
Customers of both trade show organizers and exhibitors are considered “visitors”
(Jung, 2005; Whitfield & Webber, 2011). The majority of the literature on visitor-
oriented trade show evaluation focuses on pre-show evaluation, which helps visitors to
decide which show best meets their needs. The reason researchers primarily focus on pre-
show evaluation with visitors may be because they do not spend as much money on and
effort associated with trade shows as do exhibitors. Furthermore, for visitors, their
primary motivations to participate in trade shows are to gather information about market
access, be exposed to new products, and meet potential suppliers (Munuera & Ruiz,
1999), as well as make alternative purchases (Godar & O’Connor, 2001). What really
9
matters for visitors is participating in the right show and meeting the right people. Thus,
the pre-show evaluation and selection process, rather than trade show performance
evaluation, is more important with visitors.
In a recent study conducted by Berne and García-Uceda (2008), three major
criteria were identified as the main determinants of trade show performance among
visitors: perception about the basic features of the trade show, the marketing objectives to
be attained at and after a trade show, and the perceived costs relative to trade show
attendance planning and budgeting. Munuera and Ruiz (1999) analyzed visitor-oriented
pre-show evaluation from a different perspective. They considered trade shows as
services (e.g., accommodations, entertainment) offered by trade show organizations, with
visitors as clients. Cox (1983) pointed out that visitors’ poor overall perception of a trade
show is often attributable to exhibitors’ booth personnel problems (Jung, 2005).
There has been extensive research on the objectives of trade show visitors. Similar
to exhibitors, how these objectives are achieved determine visitors’ perception of self-
performance (Godar & O’Connor, 2001). Morris (1988) identified five main objectives
for visitors attending a trade show: to see new products and developments, interest in the
specific field or focus (e.g., sports, electronics) of the show, to see a particular product or
company, to attend training sessions, and to obtain technical information about products.
Following the same line of research, Dudley (1990) found that visitors attend trade shows
to assess new products, to obtain product and technical information, to meet and compare
potential suppliers, and to gain new ideas. More recently, Godar and O’Connor (2001)
identified groups of visitors based on their motivations for attending trade shows and
labeled them short-term and long-term buyers, prospective buyers, current buyers, and
10
non-buyers. While buyer activities relate to buying goods and/or services at the trade
show, non-buyer activities have been conceptualized as ongoing information search,
networking, and attending seminars (Rittichainuwat & Mair, 2012). It is important to note
that trade show visitors are more likely to be non-buyers (Borghini, Golfetto, & Rinallo,
2006; Kepf & Smith, 1998). This is echoed by the decreasing importance of selling
activities reported by exhibitors (Bello & Lohtia, 1993; Hansen, 1999).
While visitors’ satisfaction with their self-performance is important, so too is their
satisfaction with other key stakeholders. Following is a summary of literature that has
addressed the link between visitors and exhibitors and visitors and organizers.
The Links between Visitors and Key Stakeholders
The Visitor-Exhibitor Link
Trade shows are a great platform for visitors and exhibitors to develop new
business relationships and work on existing business relationships (Blythe, 2002). Similar
to the studies on exhibitor’s self-performance, selling activities were the primary focus of
early studies on the visitor-exhibitor link (Bello, 1992; Gopalakrishna & Lilien, 1995;
Tanner & Chonko, 1995; Williams, Gopalakrishna, & Cox, 1993). Researchers assumed
that finding business partners and signing contracts were the only objectives of trade
show visitors and exhibitors. Today, researchers have found that getting sales is no longer
the primary goal of exhibitors and visitors (Seringhaus & Rosson, 2004). Godar and
O’Connor (2001) found that visitors placed less importance on purchase activities while
prioritizing non-sales activities such as information search and relation building with

11
exhibitors. The shift from sales activities to non-sales activities requires visitors and
exhibitors to reexamine their trade show strategies and focus on behavioral-based
activities such as information-gathering and relationship-building (Borghini et al., 2006;
Hansen, 1999).
The Visitor-Organizer Link
For trade show organizers, the success of a trade show depends not only on the
exhibitors, but also on the visitors (Munuera & Ruiz, 1999). A visitor at a trade show
could have achieved preset goals and had great interactions with exhibitors but still have
an overall negative perception of the trade show if the organizers fail to impress. Under
conditions of increased competition and demands from exhibitors, trade show organizers
have started to focus on attracting and serving not only exhibitors but also visitors.
In order to provide excellent service to and initiate positive behavioral intentions
from visitors, trade show organizers need to consider visitors’ decisions regarding the
location, schedule, and events for the trade show and provide optimal environmental
conditions for interactions between exhibitors and visitors (Munuera & Ruiz, 1999).
Furthermore, trade show organizers need to have better knowledge of visitors’ objectives
for attending the trade show. Knowing the objectives of visitors would allow organizers
to allocate their limited resources on the key areas that visitors value the most.
Ongoing information search is an important motivation for attendance at trade
shows (Borghini et al., 2006). This ongoing information search involves comparing
companies in order to establish contacts for future sales and observing what large
institutions are doing (Smith, Hama & Smith, 2003; Tanner, Chonko, & Ponzurick,
12
2001). Ongoing information search activities allow trade show visitors to confirm the
viability of their own business and their ability to compete in the market (Blythe, 2002;
Rittichainuwat & Mair, 2012). Thus, apart from focusing on providing excellent
communication channel between visitors and exhibitors, trade show organizers also need
to facilitate visitors’ ongoing information search.
The links between visitors and key stakeholders, which were addressed in this
section, are highlighted in the proposed VEO framework for trade show evaluation
(Figure 1). So, too, is the link between exhibitors and the organizer, which is reviewed in
the following section.
The Exhibitor-Organizer Link
It has been demonstrated that trade shows have a substantial service component,
with exhibitors and visitors being the customer and organizers being the service provider
(Konopacki, 1996; Munuera & Ruiz, 1999; O’Hara & Herbig, 1993). Thus, the link
between exhibitors and organizers corresponds to exhibitors’ perception of service
quality delivered by organizers.
Brady and Cronin’s (2001) multi-level model of service quality proposes that
interaction quality, environment quality, and outcome quality are the three dimensions
that influence perceptions of service quality. This framework has been applied in a trade
show context by Gottlieb et al. (2011), who developed a measurement model to examine
trade show participants’ perceptions of trade show effectiveness. Gottlieb et al. (2011)
found that the multi-level model of service quality works well in trade shows and all
three dimensions contribute significantly to trade show effectiveness.
13
Thus far the literature reviewed suggests that visitors and exhibitors take into
account various factors when assessing their self-performance as well as their satisfaction
with other key stakeholders. Unclear, however, is to what extent their level of satisfaction
with their self-performance or that of other key stakeholders influences overall
satisfaction or positive behavioral intention. Following is a review of the literature on
both variables.
Satisfaction
Satisfaction is a function of consumer perceptions (Neal & Gursoy, 2008). In
tourism research, tourist satisfaction has been defined as the comparison between a
tourist’s experience at the destination area and the expectations the tourist has about that
destination (Schofield, 2000). Tourism researchers have used several approaches to
examine tourist satisfaction, including expectation and disconfirmation theory (Cardozo,
1965); equity theory (Oliver & Swan, 1989); norm theory (LaTour & Peat, 1979); and the
perceived performance model (Tse & Wilton, 1988).
The most prevalent theory guiding satisfaction research in tourism is expectancy–
disconfirmation, originally developed by Cardozo (1965). According to this theory,
consumers have expectations about a product prior to purchase. They then compare their
actual experience with their previous expectations. If the actual experience is better than
previous expectations, there would be positive disconfirmation, which means that the
consumer is satisfied and might be willing to purchase the product again. If the actual
experience is worse than expected, it would be referred to as negative disconfirmation,
which means that the consumer is unsatisfied and might consider switching or actually
14
switch to other products in the future (Oliver, 1980). The major problem with this
approach is that in some cases researchers have found that consumers’ expectations are
not related to satisfaction (Tse & Wilton, 1988) and thus it might be a waste of time to
collect information on expectations.
According to equity theory, consumer satisfaction can be viewed as a relationship
between what the consumer spends and the benefits he/she anticipates (Oliver & Swan,
1989). Here, reality rather than expectation is compared with the experience. If the
benefits exceed the costs, consumers are likely to be satisfied (Heskett, Sasser, &
Schlesinger, 1997). Equity theory is often difficult to apply in the trade show setting
because it is hard to compare the costs (e.g., time, money, and labor) exhibitors spend on
the trade show against the benefits (e.g., sales made, sales leads obtained, and
information collected) because they are measured very differently.
LaTour and Peat introduced norm theory in 1979. They considered norms as the
reference for judging the product/service, and disconfirmation with these norms to be
“dissatisfaction.” This theory is a modification of the expectancy–disconfirmation theory.
In this case, norms take the place of expectation. The application of this theory, however,
is problematic if there is no well-established norm within the field.
Tse and Wilton (1988) introduced a perceived performance model. They argued
that consumer dissatisfaction is only a function of the actual performance, regardless of
consumers' expectations. This model claims that measuring perceived expectations and
perceived performance is redundant and only objective performance leads to satisfaction
(Neal & Gursoy, 2008). This model is suitable for consumers who do not know what they
want to obtain and experience. However, most of the visitors and exhibitors in trade
15
shows have strong motives and specific objectives.
In the trade show industry, where costs and benefits are measured using
completely different scales, customers have clear objectives, and norms are not
prominent, the expectancy–disconfirmation framework is the best option for studying
satisfaction. This study will use a subjective measurement of trade show exhibitors’
perception of their performance minus their expectation to obtain data on satisfaction.
Most studies on satisfaction in the trade show context have focused on overall
satisfaction (Lee & Back, 2009). The major problem with using overall satisfaction is that
it does not address the specific domains of satisfaction and, as a result, corresponding
managerial implications are limited. There might be several factors that contribute to the
exhibitor’s unsatisfactory experience. Without knowing the satisfaction levels associated
with specific domains of the trade show, organizers would have no idea how to fix the
problem. Hence, in this study satisfaction with self-performance as well as other key
stakeholders will be addressed.
Behavioral Intention
Findings from previous studies indicate that consumer satisfaction leads to
positive behavioral intention from customers such as willingness to return and positive
word-of-mouth (Cronin & Taylor, 1992; Dube, Renaghan, & Miller, 1994; Jung, 2005;
Kang & Schrier, 2011). A satisfied visitor may spread positive word-of-mouth to
potential visitors, thus contributing to the improved perceptions of the trade show as well
as the host destination (Tanford, Montgomery, & Nelson, 2012; Zhang et al., 2010).
Similarly, satisfied exhibitors are more likely to return to a trade show in the future if the
16
risk of uncertainty as to whether their exhibition will be successful or not has been
reduced (Kang & Schrier, 2011; Patterson & Spreng, 1997).
However, a high satisfaction level does not guarantee a revisit. Gitelson and
Crompton (1984) pointed out that although satisfaction with a particular destination could
be a necessary condition for explaining repeat visits, it is not sufficient to explain the
phenomenon since many respondents report a high satisfaction level and yet do not return
to the same destination. Factors other than satisfaction may have direct influence on
intention to revisit. By obtaining information about attendee's willingness to return and
positive word-of-mouth, trade show organizers may obtain a more accurate estimate of
the potential of future trade shows. Thus, positive behavioral intention will be used to
measure the predictive validity of the proposed measurement scale and overall merits of
the VEO framework.
In summary, a VEO conceptual framework was proposed to account for the
significant roles of all three key stakeholders in a trade show context. Then five
components of the VEO framework were discussed. Recognizing that there are outcomes
of satisfaction with self-performance and that of other key stakeholders, a review of the
literature on satisfaction and positive behavioral intention ensued. The result is an
extended VEO framework (Figure 2) that represents the theorized links between
satisfaction with self-performance, organizers, and visitors as components of overall
satisfaction and positive behavioral intention. The potential direct impacts of the three
satisfaction dimensions on positive behavioral intention will also be examined. Although
the VEO framework could be used to examine trade show performance of all three key
stakeholders, this study will focus only on constructing and empirically examining
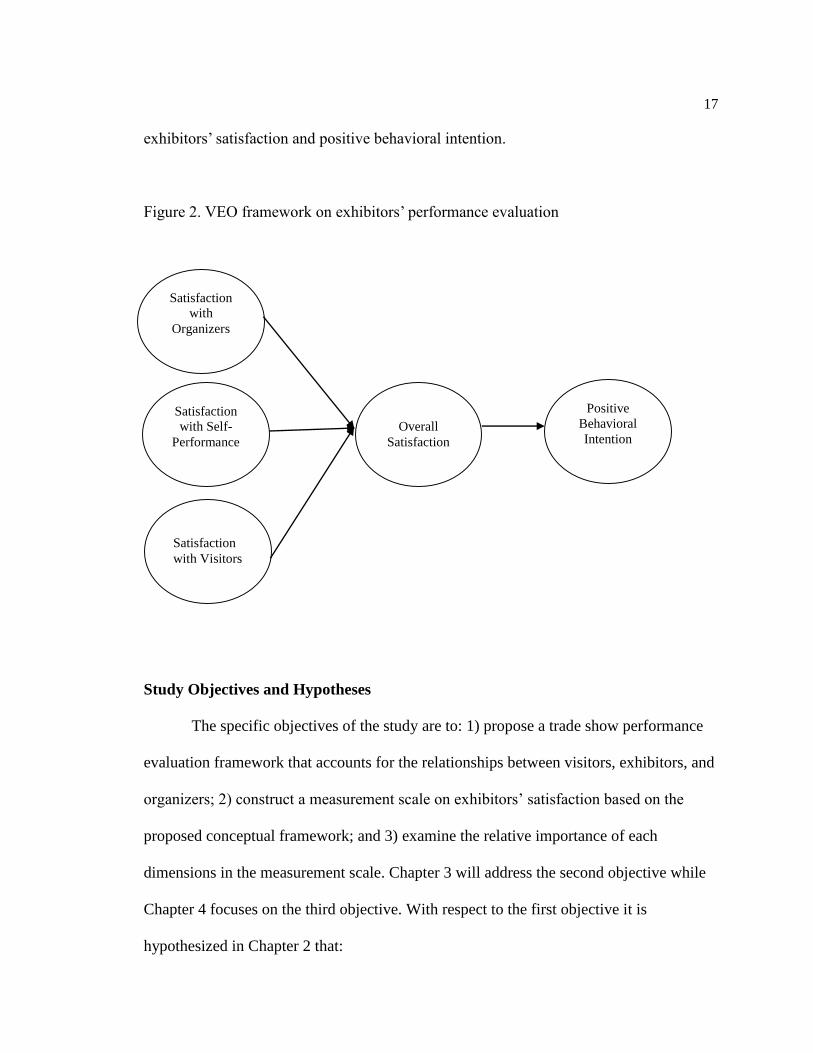
17
exhibitors’ satisfaction and positive behavioral intention.
Figure 2. VEO framework on exhibitors’ performance evaluation
Study Objectives and Hypotheses
The specific objectives of the study are to: 1) propose a trade show performance
evaluation framework that accounts for the relationships between visitors, exhibitors, and
organizers; 2) construct a measurement scale on exhibitors’ satisfaction based on the
proposed conceptual framework; and 3) examine the relative importance of each
dimensions in the measurement scale. Chapter 3 will address the second objective while
Chapter 4 focuses on the third objective. With respect to the first objective it is
hypothesized in Chapter 2 that:
Satisfaction
with
Organizers
Satisfaction
with Self-
Performance
Overall
Satisfaction
Positive
Behavioral
Intention
Satisfaction
with Visitors
18
Hypothesis 1a: Exhibitors' satisfaction with visitors is positively related to their
overall satisfaction with the trade show.
Hypothesis 1b: Exhibitors' satisfaction with self-performance is positively related
to their overall satisfaction with the trade show.
Hypothesis 1c: Exhibitors' satisfaction with organizers is positively related to
their overall satisfaction with the trade show.
Hypothesis 2a: Visitors' satisfaction with self-performance is positively related to
their overall satisfaction with the trade show.
Hypothesis 2b: Visitors' satisfaction with exhibitors is positively related to their
overall satisfaction with the trade show.
Hypothesis 2c: Visitors' satisfaction with organizers is positively related to their
overall satisfaction with the trade show.
Hypothesis 3: Exhibitors' overall satisfaction, determined by exhibitors’
satisfaction with visitors, self-performance, and organizers, is positively related to their
positive behavioral intention.
Hypothesis 4: Visitors' overall satisfaction, determined by visitors’ satisfaction
with self-performance, exhibitors, and organizers, is positively related to their positive
behavioral intention.
Methods
Based on the VEO conceptual framework (Figure 2), a measurement scale was
constructed and empirically tested. Two pilot tests were administered to examine the
19
reliability of the scale and to purify the scale. Finally, the measurement scale was applied,
in the form of a questionnaire, at three international trade shows in the People's Republic
of China.
Scale Development
Exhibitor’s satisfaction with self-performance
Hansen’s (1999) research is regarded as one of the most well-organized and
comprehensive studies on exhibitors’ self-performance (Seringhaus & Rosson, 2004).
Based on Hansen’s five-dimension conceptual framework and the study context, a 7-
point, 18-item scale (1= extremely poor, 7= extremely excellent) was created to enable
exhibitors to document their self-performance. Exhibitors were asked to read through
and rate their satisfaction with each of the self-performance statements highlighted in
Table 1.
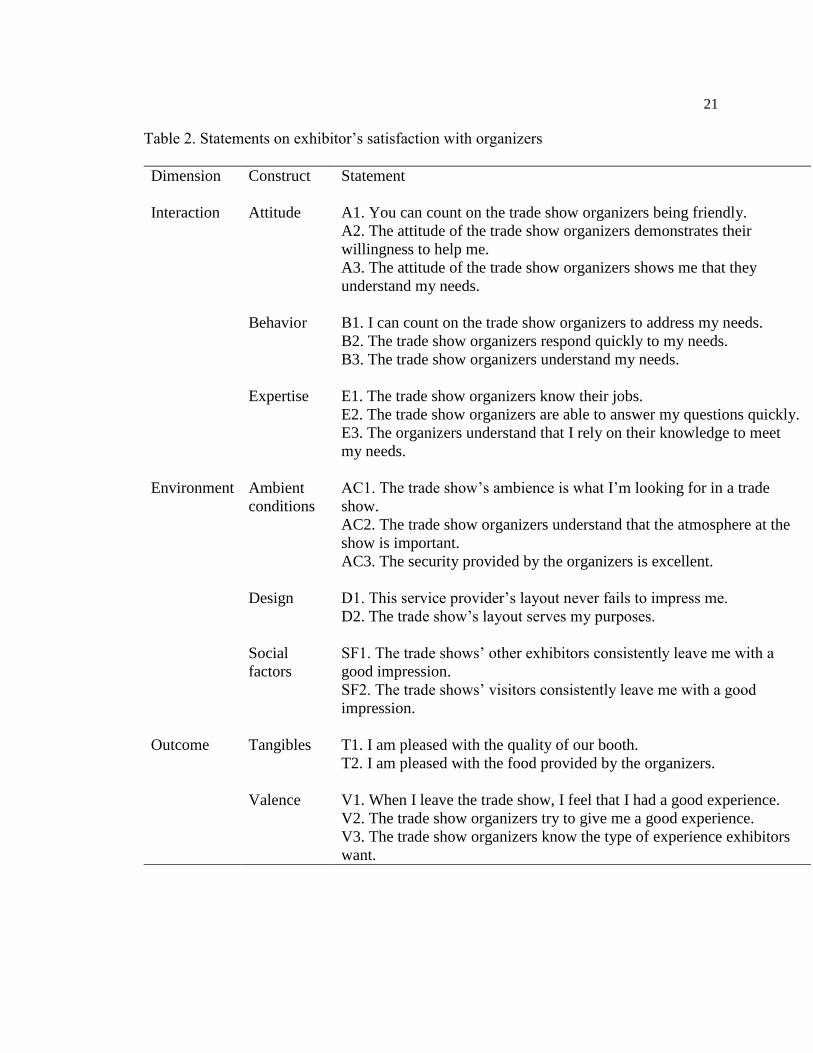
Exhibitor’s satisfaction with organizers
Brady and Cronin’s (2001) conceptual framework on service quality has been
used in the trade show context and exhibited excellent reliability and validity (Gottlieb et
al., 2011). After reviewing the framework and accounting for study context, a 7-point,
21-item scale (1= strongly disagree, 7=strongly agree) was used to enable exhibitors to
indicate their level of agreement with 21 statements about organizers. Specifically,
exhibitors were asked to read through the statements about organizers and rate their level
of agreement with each statement (see Table 2).
20
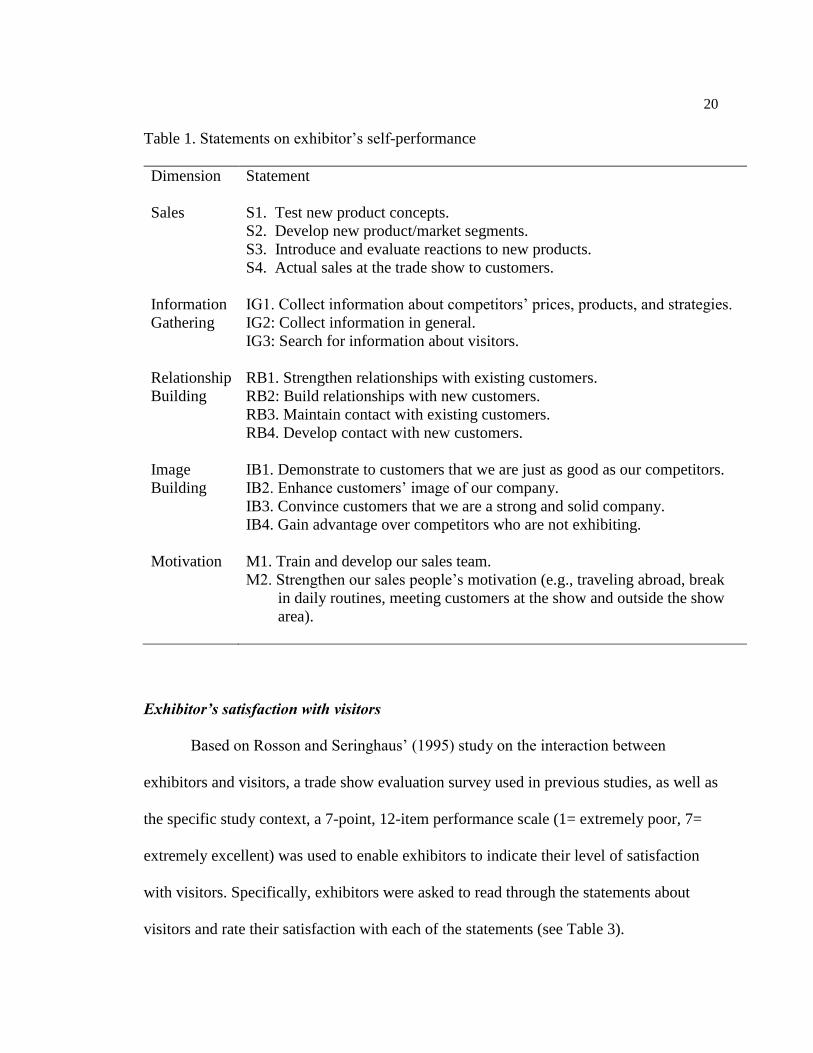
Table 1. Statements on exhibitor’s self-performance
Dimension Statement
Sales S1. Test new product concepts.
S2. Develop new product/market segments.
S3. Introduce and evaluate reactions to new products.
S4. Actual sales at the trade show to customers.
Information
Gathering
IG1. Collect information about competitors’ prices, products, and strategies.
IG2: Collect information in general.
IG3: Search for information about visitors.
Relationship
Building
RB1. Strengthen relationships with existing customers.
RB2: Build relationships with new customers.
RB3. Maintain contact with existing customers.
RB4. Develop contact with new customers.
Image
Building
IB1. Demonstrate to customers that we are just as good as our competitors.
IB2. Enhance customers’ image of our company.
IB3. Convince customers that we are a strong and solid company.
IB4. Gain advantage over competitors who are not exhibiting.
Motivation M1. Train and develop our sales team.
M2. Strengthen our sales people’s motivation (e.g., traveling abroad, break
in daily routines, meeting customers at the show and outside the show
area).
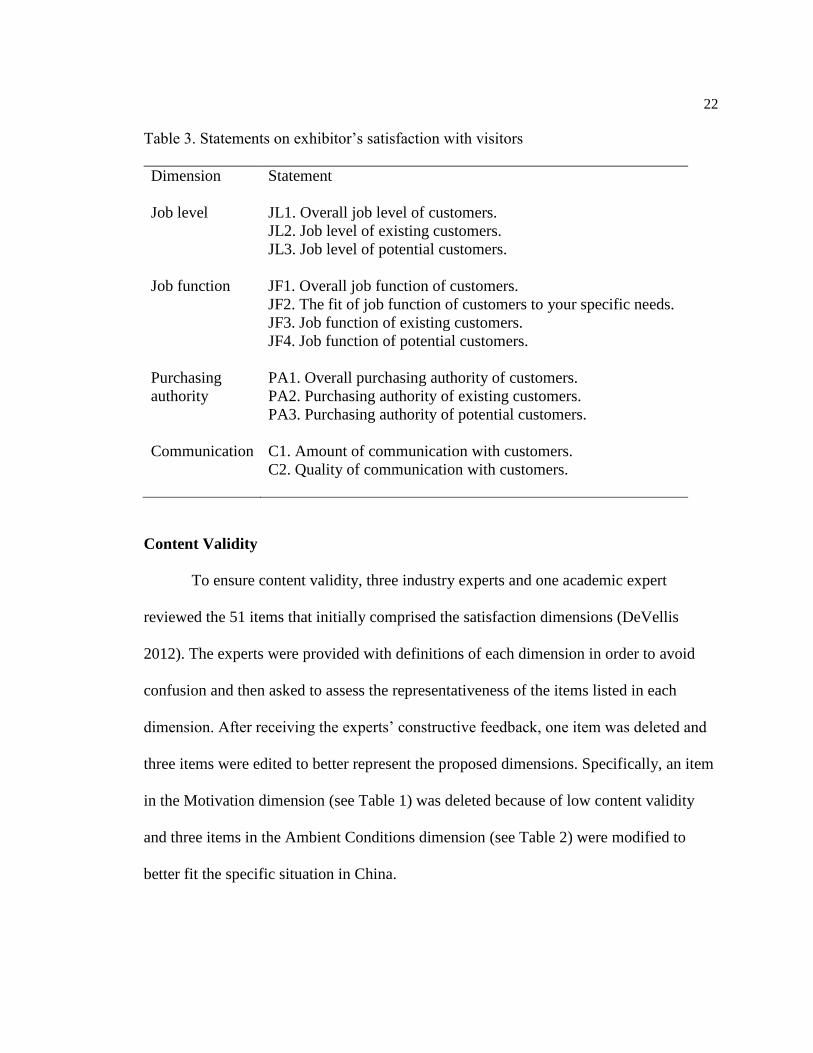
Exhibitor’s satisfaction with visitors
Based on Rosson and Seringhaus’ (1995) study on the interaction between
exhibitors and visitors, a trade show evaluation survey used in previous studies, as well as
the specific study context, a 7-point, 12-item performance scale (1= extremely poor, 7=
extremely excellent) was used to enable exhibitors to indicate their level of satisfaction
with visitors. Specifically, exhibitors were asked to read through the statements about
visitors and rate their satisfaction with each of the statements (see Table 3).
21
Table 2. Statements on exhibitor’s satisfaction with organizers
Dimension Construct Statement
Interaction Attitude A1. You can count on the trade show organizers being friendly.
A2. The attitude of the trade show organizers demonstrates their
willingness to help me.
A3. The attitude of the trade show organizers shows me that they
understand my needs.
Behavior B1. I can count on the trade show organizers to address my needs.
B2. The trade show organizers respond quickly to my needs.
B3. The trade show organizers understand my needs.
Expertise E1. The trade show organizers know their jobs.
E2. The trade show organizers are able to answer my questions quickly.
E3. The organizers understand that I rely on their knowledge to meet
my needs.
Environment Ambient
conditions
AC1. The trade show’s ambience is what I’m looking for in a trade
show.
AC2. The trade show organizers understand that the atmosphere at the
show is important.
AC3. The security provided by the organizers is excellent.
Design D1. This service provider’s layout never fails to impress me.
D2. The trade show’s layout serves my purposes.
Social
factors
SF1. The trade shows’ other exhibitors consistently leave me with a
good impression.
SF2. The trade shows’ visitors consistently leave me with a good
impression.
Outcome Tangibles T1. I am pleased with the quality of our booth.
T2. I am pleased with the food provided by the organizers.
Valence V1. When I leave the trade show, I feel that I had a good experience.
V2. The trade show organizers try to give me a good experience.
V3. The trade show organizers know the type of experience exhibitors
want.
22
Table 3. Statements on exhibitor’s satisfaction with visitors
Dimension Statement
Job level JL1. Overall job level of customers.
JL2. Job level of existing customers.
JL3. Job level of potential customers.
Job function JF1. Overall job function of customers.
JF2. The fit of job function of customers to your specific needs.
JF3. Job function of existing customers.
JF4. Job function of potential customers.
Purchasing
authority
PA1. Overall purchasing authority of customers.
PA2. Purchasing authority of existing customers.
PA3. Purchasing authority of potential customers.
Communication C1. Amount of communication with customers.
C2. Quality of communication with customers.
Content Validity
To ensure content validity, three industry experts and one academic expert
reviewed the 51 items that initially comprised the satisfaction dimensions (DeVellis
2012). The experts were provided with definitions of each dimension in order to avoid
confusion and then asked to assess the representativeness of the items listed in each
dimension. After receiving the experts’ constructive feedback, one item was deleted and
three items were edited to better represent the proposed dimensions. Specifically, an item
in the Motivation dimension (see Table 1) was deleted because of low content validity
and three items in the Ambient Conditions dimension (see Table 2) were modified to
better fit the specific situation in China.
23
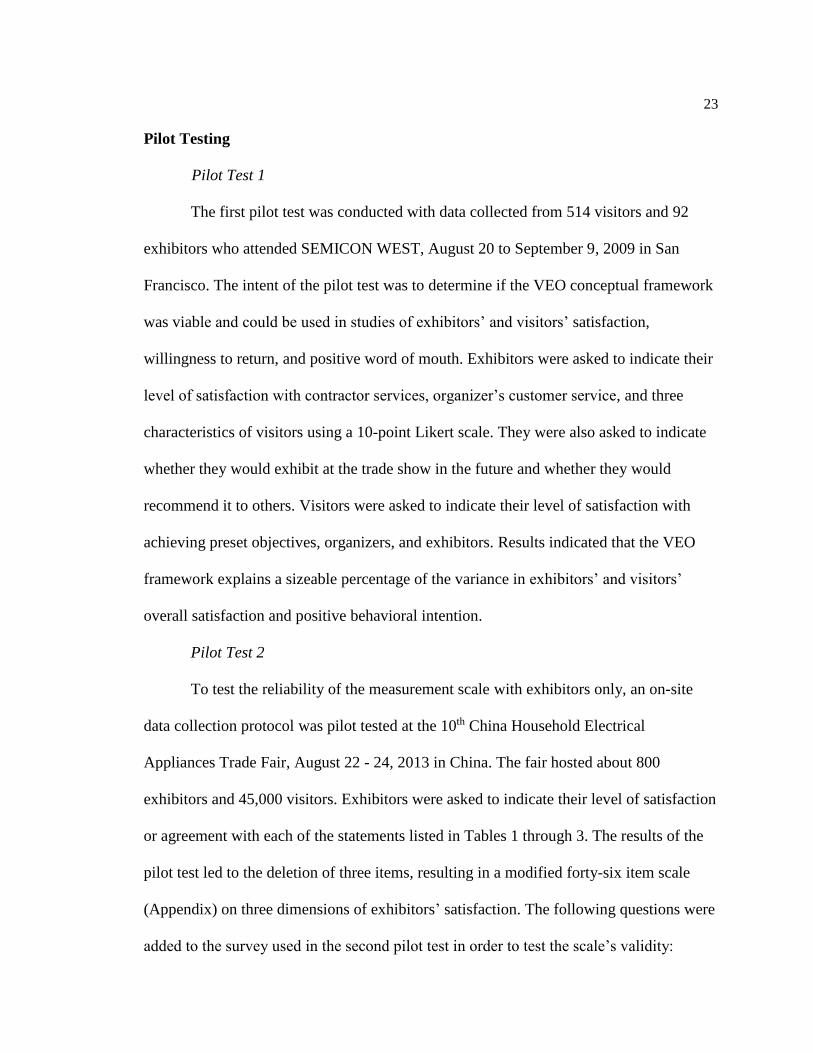
Pilot Testing
Pilot Test 1
The first pilot test was conducted with data collected from 514 visitors and 92
exhibitors who attended SEMICON WEST, August 20 to September 9, 2009 in San
Francisco. The intent of the pilot test was to determine if the VEO conceptual framework
was viable and could be used in studies of exhibitors’ and visitors’ satisfaction,
willingness to return, and positive word of mouth. Exhibitors were asked to indicate their
level of satisfaction with contractor services, organizer’s customer service, and three
characteristics of visitors using a 10-point Likert scale. They were also asked to indicate
whether they would exhibit at the trade show in the future and whether they would
recommend it to others. Visitors were asked to indicate their level of satisfaction with
achieving preset objectives, organizers, and exhibitors. Results indicated that the VEO
framework explains a sizeable percentage of the variance in exhibitors’ and visitors’
overall satisfaction and positive behavioral intention.
Pilot Test 2
To test the reliability of the measurement scale with exhibitors only, an on-site
data collection protocol was pilot tested at the 10th China Household Electrical
Appliances Trade Fair, August 22 - 24, 2013 in China. The fair hosted about 800
exhibitors and 45,000 visitors. Exhibitors were asked to indicate their level of satisfaction
or agreement with each of the statements listed in Tables 1 through 3. The results of the
pilot test led to the deletion of three items, resulting in a modified forty-six item scale
(Appendix) on three dimensions of exhibitors’ satisfaction. The following questions were
added to the survey used in the second pilot test in order to test the scale’s validity:
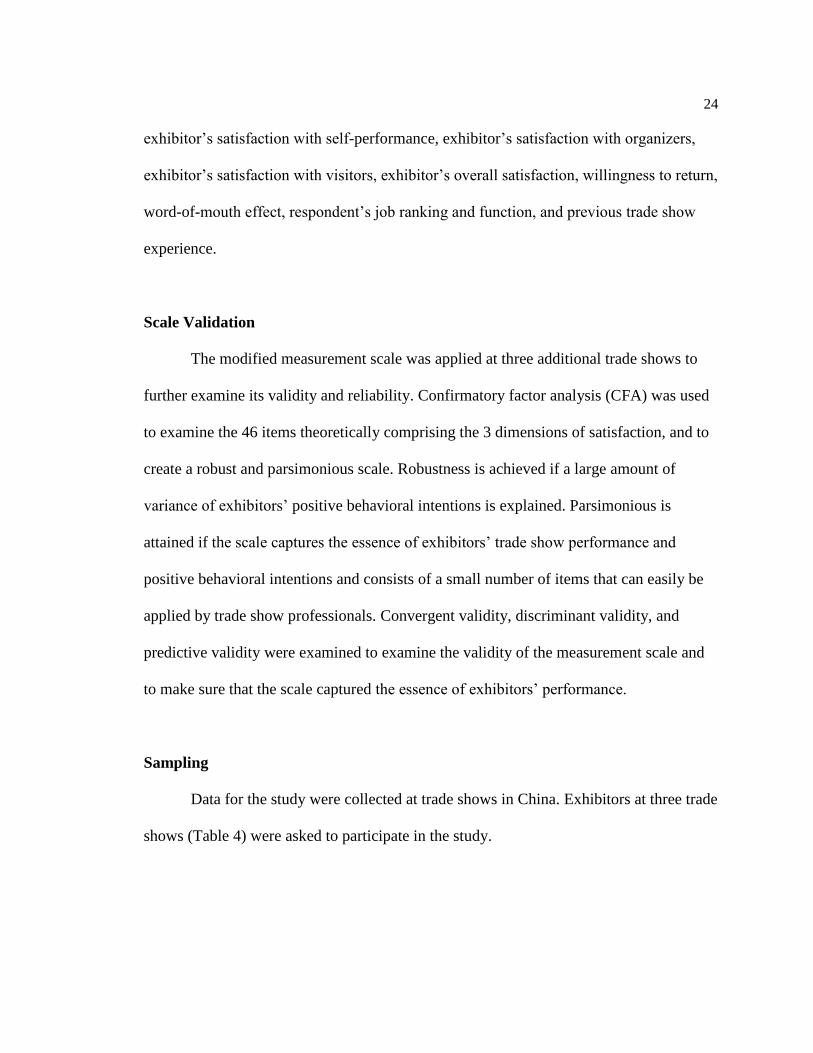
24
exhibitor’s satisfaction with self-performance, exhibitor’s satisfaction with organizers,
exhibitor’s satisfaction with visitors, exhibitor’s overall satisfaction, willingness to return,
word-of-mouth effect, respondent’s job ranking and function, and previous trade show
experience.
Scale Validation
The modified measurement scale was applied at three additional trade shows to
further examine its validity and reliability. Confirmatory factor analysis (CFA) was used
to examine the 46 items theoretically comprising the 3 dimensions of satisfaction, and to
create a robust and parsimonious scale. Robustness is achieved if a large amount of
variance of exhibitors’ positive behavioral intentions is explained. Parsimonious is
attained if the scale captures the essence of exhibitors’ trade show performance and
positive behavioral intentions and consists of a small number of items that can easily be
applied by trade show professionals. Convergent validity, discriminant validity, and
predictive validity were examined to examine the validity of the measurement scale and
to make sure that the scale captured the essence of exhibitors’ performance.
Sampling
Data for the study were collected at trade shows in China. Exhibitors at three trade
shows (Table 4) were asked to participate in the study.
25
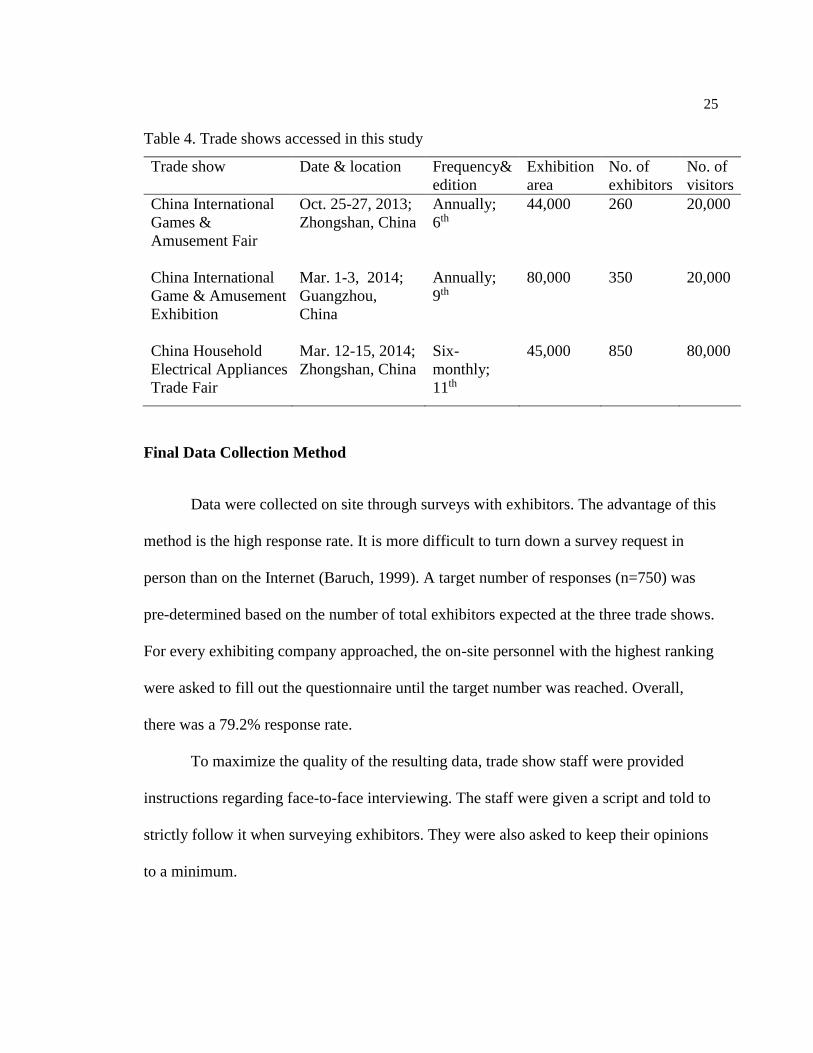
Table 4. Trade shows accessed in this study
Trade show Date & location Frequency&
edition
Exhibition
area
No. of
exhibitors
No. of
visitors
China International
Games &
Amusement Fair
Oct. 25-27, 2013;
Zhongshan, China
Annually;
6th
44,000 260 20,000
China International
Game & Amusement
Exhibition
Mar. 1-3, 2014;
Guangzhou,
China
Annually;
9th
80,000 350 20,000
China Household
Electrical Appliances
Trade Fair
Mar. 12-15, 2014;
Zhongshan, China
Six-
monthly;
11th
45,000 850 80,000
Final Data Collection Method
Data were collected on site through surveys with exhibitors. The advantage of this
method is the high response rate. It is more difficult to turn down a survey request in
person than on the Internet (Baruch, 1999). A target number of responses (n=750) was
pre-determined based on the number of total exhibitors expected at the three trade shows.
For every exhibiting company approached, the on-site personnel with the highest ranking
were asked to fill out the questionnaire until the target number was reached. Overall,
there was a 79.2% response rate.
To maximize the quality of the resulting data, trade show staff were provided
instructions regarding face-to-face interviewing. The staff were given a script and told to
strictly follow it when surveying exhibitors. They were also asked to keep their opinions
to a minimum.
26
Survey Data Analysis Procedures
Confirmatory Factor Analysis (CFA) and the Maximum Likelihood Method
(MLM) of estimation were used to examine the proposed models and test the hypotheses.
Structural equation modeling is designed to evaluate how well a proposed conceptual
model fits the collected data (Yoon, Gursoy, & Chen, 2001) and measure the
relationships among sets of construct variables (Turner & Reisinger, 2001; Yoon &
Uysal, 2005). Thus, the structural equation modeling procedure is an appropriate solution
for the proposed models. Correlation matrices, standard deviations, and goodness-of-fit
statistics were reported to examine the hypothesized models. In order to compare
different paths, standardized solutions were used to report the results. Model fit was
evaluated with three goodness-of-fit indices: the comparative fit index (CFI; Bentler,
1990); the root-mean-square error of approximation (RMSEA; Steiger, 1990); and the
Tucker-Lewis index (TLI; Tucker & Lewis, 1973). Minimum TLIs and CFIs of .90 are
required for model acceptance, and values of .95 or greater are regarded as an indication
of good model fit. RMSEAs of less than .06 are indicators of a good-fitting model (Hu &
Bentler, 1998).
To confirm the reliability of the model, Cronbach’s alpha was calculated. A value
higher than .70 is considered acceptable (Nunnally, 1978). To establish convergent
validity, path coefficients were examined for significance and Cronbach’s alpha was also
used as a proxy for convergent validity. Thus, a high Cronbach’s alpha not only indicates
a satisfactory reliability but also a satisfactory convergent validity.
27
Convergent validity was examined by looking at the significance of item loadings
on their respective hypothesized dimensions (Anderson & Gerbing, 1988). To establish
discriminant validity, two SEM models were run, one with the relationships between
constructs fixed to be one and the other one with free parameters. A chi-square test was
conducted to test the difference between the two models. Discriminant validity was
established if the chi-square test turns out to be significant (Anderson & Gerbing, 1988;
Bagozzi & Heatherton, 1994). Predictive validity is defined as the ability of the scale to
estimate an outcome variable that is external to the measuring instrument itself (Nunally
& Bernstein, 1994). To establish the predictive validity of the measurement scale, the
endogenous latent variable behavioral intent with two observed variables (i.e.,
willingness to return and word-of-mouth) was added to the structural equation. The
standardized path coefficients and squared multiple correlation were examined to
establish the predictive validity of the scale.
Apart from scale development and validation, the relationships between the three
dimensions (i.e., satisfaction with self-performance, satisfaction with visitors, and
satisfaction with organizers) and overall satisfaction and positive behavioral intention
were also examined. Multiple hypotheses were proposed on the structure of exhibitor’s
satisfaction and positive behavioral intention. The strength of the standardized path
coefficients was used to examine the hypotheses and indicate the importance of certain
domains. The potential direct impact of the three dimensions on positive behavioral
intention was also examined.
28
Presentation of Results
The following three chapters highlight the results of this dissertation. In Chapter 2
I propose the Visitor-Exhibitor-Organizer (VEO) framework and empirically examine it
through testing with 92 exhibitors and 514 visitors at a trade show in San Francisco,
California. In Chapter 3 I review the results of a second pilot test. In this instance, the
focus was on testing the reliability and validity of a measurement scale adhering to the
VEO framework and designed for exhibitors only. Data were collected from exhibitors at
a trade show in China. In Chapter 4 the modified version of the measurement scale tested
during the second pilot test was again applied in a trade show context to examine
relationships between the three satisfaction dimensions and positive behavioral intention.
These data were also used to answer the study hypotheses.
The final chapter (i.e., Chapter 5) provides a summary of the results presented in
Chapters 2 through 4. A discussion of the overall findings, limitations, and potential for
future research also are included in this chapter.
REFERENCES
Anderson, J. C., & Gerbing, D. W. (1988). Structural equation modeling in practice: A
review and recommended two-step approach. Psychological Bulletin, 103(3), 411-
423.
American Business Media. (2013, May 24). B2B media and info industry revenues up
3.4% in 2012. Retrieved from http://www.marketingcharts.com/wp/print/b2b-
media-and-info-industry-revenues-up-3-4-in-2012-29788/
29
Bagozzi, R.P., & Heatherton, T. F. (1994). A general approach to representing
multifaceted personality constructs: Application to state self-esteem. Structural
Equation Modeling, 1(1), 35-67.
Baruch, Y. (1999). Response rate in academic studies: A comparative analysis. Human
Relations, 52(4), 421-438.
Bello, D. C. (1992). Industrial buyer behavior at trade shows: Implications for selling
effectiveness. Journal of Business Research, 25(1), 59-80.
Bello, D. C., & Lohtia, R. (1993). Improving trade show effectiveness by analyzing
attendees. Industrial Marketing Management, 22(4), 311-318.
Bentler, P. M. (1990). Comparative fit indexes in structural models. Psychological
Bulletin, 107(2), 238-246.
Berne, C., & García-Uceda, M. (2008). Criteria involved in evaluation of trade shows to
visit. Industrial Marketing Management, 37(5), 565-579.
Blythe, J. (2002). Using trade fairs in key account management. Industrial Marketing
Management, 31(7), 627-635.
Bonoma, T. V. (1983). Get more out of your trade shows. Harvard Business Review,
61(January/February), 75-83.
Borghini, S., Golfetto, F., & Rinallo, D. (2006). Ongoing search among industrial
buyers. Journal of Business Research, 59(10-11), 1151-1159.
Brady, M. K. & Cronin, J. J. (2001). Some new thoughts on conceptualizing perceived
service quality: A hierarchical approach. Journal of Marketing, 65(3), 34-49.
Cardozo, R. N. (1965). An experimental study of customer effort, expectation, and
satisfaction. Journal of Marketing Research, 2(3), 244–249.
30
Convention Industry Council. (2004). APEX industry glossary. Retrieved from
http://www.conventionindustry.org/glossary/
Cox, J. M. (1983). How effective is your exhibit? Successful Meetings, 32(August), 59-
61.
Cronin, J. J., & Taylor, S. A. (1992). Measuring service quality: A reexamination and
extension. Journal of Marketing, 56(3), 55-68.
Dekimpe, M., François, P., Gopalakrishna, S., Lilien, G., & van den Bulte, C. (1997).
Generalizing about trade show effectiveness: A cross-national comparison. Journal
of Marketing, 61(4), 55-64.
DeVellis, R. F. (2012). Scale development: Theory and applications. Thousand Oaks,
Calif: SAGE.
Dube, L., Renaghan, L. M., & Miller J. M. (1994). Measuring customer satisfaction for
strategic management. Cornell Hotel and Restaurant Administration Quarterly,
35(February), 30-47.
Dudley, J. W. (1990). Successful exhibiting. London: Kogan-Page.
Freeman, R. (1984). Strategic management: A stakeholder’s approach. Boston, MA:
Pitman.
Freeman, R. & McVea, J. (2001). “A stakeholder approach to strategic management”, in
Hitt, M., Freeman, R. & Harrison, J. (Eds), The Blackwell Handbook of Strategic
Management. Oxford: Blackwell Business, 189-207.
31
Gillette, B. (2001, January 8). Trade show powerful tool for reaching clients and
customers. Mississippi Business Journal. Retrieved from
http://msbusiness.com/blog/2001/01/08/trade-show-powerful-tool-for-reaching-
clients-customers/
Gitelson, R. J., & Crompton, J. L. (1984). Insights into the Repeat Vacation Phenomenon.
Annals of Tourism Research, 11(2), 199-217.
Godar, S., & O’Connor, P. (2001). Same time next year – Buyer trade show motives.
Industrial Marketing Management, 30(1), 77-86.
Gopalakrishna, S., & Lilien, G. (1995). A three-stage model of industrial trade show
performance. Marketing Science, 14(1), 22-42.
Gopalakrishna, S., Roster, C. A., & Sridhar, S. (2010). An exploratory study of attendee
activities at a business trade show. Journal of Business & Industrial Marketing,
25(4), 241-248.
Gottlieb, U. R., Brown, M. R., & Drennan, J. (2011). The influence of service quality
and trade show effectiveness on post-show purchase intention. European Journal of
Marketing, 45(11/12), 1642-1659.
Gursoy, D., McCleary, K. W., & Lepsito, L. R. (2007). Propensity to complain: Effects
of personality and behavioral factors. Journal of Hospitality & Tourism Research,
31(3), 358-386.
Hansen, K. (2004). Measuring performance at trade shows: Scale development and
validation. Journal of Business Research, 57(1), 1-13.
Hansen, K. (1999). Trade show performance: A conceptual framework and its
implications for future research. Academy of Marketing Science Review, 8, 1–21.

32
Harris, D. (2000). The shows will go on. Sales & Marketing Management, 152(5), 85.
Herbig, P., O’Hara, B., & Palumbo, F. (1997). Differences between trade show exhibitors
and non-exhibitors. Journal of Business & Industrial Marketing, 12(6), 368-382.
Heskett, J. L., Sasser, E. W., & Schlesinger, L. A. (1997). The Service Profit Chain.
New York: Free Press.
Hu, L., & Bentler, P. M. (1998). Fit indices in covariance structure modeling: Sensitivity
to underparameterized model misspecification. Psychological Methods, 3(4), 424–
453.
Jin, X., Weber, K., & Bauer, T. (2012). Relationship quality between exhibitors and
organizers: A perspective from Mainland China’s exhibition industry. International
Journal of Hospitality Management, 31(4), 1222-1234.
Jung, M. (2005). Determinants of exhibition service quality as perceived by attendees.
Journal of Convention & Event Tourism, 7(3-4), 85-98.
Kang, J., & Schrier, T. (2011). The decision-making process of tradeshow exhibitors:
The effects of social value, company size, and prior experience on satisfaction and
behavioral intentions. Journal of Convention & Event Tourism, 12(2), 65-85.
Kepf, D. S., & Smith, R. E. (1998). Consumer processing of product trial and the
influence of prior advertising: A structural modeling approach. Journal of Marketing
Research, 35(3), 325-328.
Kerin, R., & Cron, W. (1987). Assessing trade show functions and performance: An
exploratory study. Journal of Marketing, 51(3), 87-94.
Konopacki, A. (1996). Tricks of the trade show. Marketing News, 30(3), 3-4.
33
LaTour, S. A., & Peat, N. C. (1979). Conceptual and methodological Issues in consumer
satisfaction research, Ralph day, Bloomington Wilkie, W.L. (Eds.), (pp. 31-35), IN:
Indiana University Press.
Lee, J., & Back, K. (2009). Examining the effect of self-image congruence, relative to
education and networking, on conference evaluation through its competing models
and moderating effect. Journal of Convention & Event Tourism, 10(4), 256-275.
Li, L-Y. (2007). Marketing resources and performance of exhibitor firms in trade shows:
A contingent resource perspective. Industrial Marketing Management, 36(3), 360-
370.
Munuera, J., & Ruiz, S. (1999). Trade fairs as services: A look at visitors’ objectives in
Spain. Journal of Business Research, 44(1), 17-24.
Morris, M. H. (1988). Industrial and organizational Marketing. Columbus, OH: Merrill
Publishing Company.
Neal, J. D., & Gursoy, D. (2008). A multifaceted analysis of tourism satisfaction. Journal
of Travel Research, 47(1), 53-62.
Nunnally, J. C. (1978). Psychometric theory (2nd ed.). New York: McGraw-Hill.
Nunnally, J. C., & Bernstein, I. H. (1994). Psychometric theory (3rd ed.). New York:
McGraw-Hill.
O'Hara, B. S., & Herbig, P. A. (1993). Trade shows: What do the exhibitors think? A
Personal Selling Perspective. Journal of Business & Industrial Marketing, 8(4), 18-
25.
Oliver, R. L. (1980). A cognitive model for the antecedents and consequences of
satisfaction decisions. Journal of Marketing Research, 27 (4), 460-469.
34
Oliver, R. L., & Swan, J. E. (1989). Consumer perceptions of interpersonal equity and
satisfaction in transactions: A field survey approach. Journal of Marketing, 53(2),
21–35.
Patterson, P. G., & Spreng, R. A. (1997). Modelling the relationship between perceived
value, satisfaction and repurchase intentions in a business to business, services
context: An empirical examination. International Journal of Service Industry
Management, 8(5), 414-434.
Reinhold, M., Reinhold, S., & Schmitz, C. (2010). Exhibitor satisfaction in business-to-
business trade shows: Understanding performance patterns from Vavra’s
Importance Grid perspective. In EMAC 2010. Brüssel: European Marketing
Academy.
Rittichainuwat, B., & Mair, J. (2012). Visitor attendance motivations at consumer travel
exhibitions. Tourism Management, 33(5), 1236-1244.
Rosson, P. J., & Seringhaus, F. H. R. (1995). Visitor and exhibitor interaction at
industrial trade fairs. Journal of Business Research, 32(1), 81-90.
Sashi, M., & Perretty, J. (1992). Do trade shows provide value? Industrial Marketing
Management, 21(3), 249–255.
Schofield, P. (2000). Evaluating castlefield urban heritage park from the consumer
perspective: Destination attribute importance, visitor perception, and satisfaction.
Tourism Analysis, 5(2–4), 183–189.
Seringhaus, F., & Rosson, P. (2004, October). An analysis model for performance
measurement of international trade fair exhibitors. Retrieved from
http://citt.management.dal.ca/Files/pdf’s/DP-198.pdf
35
Smith, T. M., Hama, K., & Smith, P. M. (2003). The effect of successful trade show
attendance on future exhibition interest: Exploring Japanese attendee perspectives of
domestic and offshore international events. Journal of Business & Industrial
Marketing, 18(4/5), 403-418.
Steiger, J. H. (1990). Structural model evaluation and modification: An interval
estimation approach. Multivariate Behavioral Research, 25(2), 173–180.
Tanford, S., Montgomery, R., & Nelson, K. B. (2012). Factors that influence attendance,
satisfaction, and loyalty for conventions. Journal of Convention & Event Tourism,
13(4), 290-318.
Tanner, J. F., & Chonko, L. B. (1995). Trade show objectives, management, and staffing
practices. Industrial Marketing Management, 24(4), 257-264.
Tanner, J. F., Chonko, L. B., & Ponzurick, T. V. (2001). A learning model of trade
exhibition attendance. Journal of Convention and Exhibition Management, 3(3), 3-
26.
Trade Show Bureau. (1994). A guide to the exposition industry. Denver, CO: Trade Show
Bureau Resource Center.
Trade Show Bureau. (1986). Exhibit management – Setting objectives and the evaluation
of results. Denver, CO: Trade Show Bureau.
Tse, D. K., & Wilton, P. C. (1988). Models of consumer satisfaction formation: An
extension. Journal of Marketing Research, 25(2), 204–212.
Tucker, L. R., & Lewis, C. (1973). A reliability coefficient for maximum likelihood
factor analysis. Psychometrika, 38(1), 1–10.
36
Turner, L. W., & Reisinger, Y. (2001). Shopping satisfaction for domestic tourists.
Journal of Retailing and Consumer Services, 8(1), 15-27.
UFI. (2007). The World Map of Exhibition Venues and Future Trends. Retrieved from:
www.ufinet.org/media/publicationspress/2007ufiworldmapofexhibitionvenues.pdf
Weber, K., & Ladkin, A. (2009). Career anchors of convention and exhibition industry
professionals in Asia. Journal of Convention & Event Tourism, 10(4), 243-255.
Whitfield, J., & Webber, D. J. (2011). Which exhibition attributes create repeat
visitation? International Journal of Hospitality Management, 30(2), 439-447.
Williams, J. D., Gopalakrishna, S., & Cox, J., M. (1993). Trade show guidelines for
smaller firms. Industrial Marketing Management, 22(4), 265-75.
Yoon, Y., Gursoy, D., & Chen, J. (2001). Validating a tourism development theory with
structural equation modeling. Tourism Management, 22(4), 363–372.
Yoon, Y., & M. Uysal (2005). An examination of the effects of motivation and
satisfaction on destination loyalty: A structural model. Tourism Management, 26(1):
45-56.
Zhang, L., Qu, H., & Ma, J. (2010). Examining the relationship of exhibition attendees’
satisfaction and expenditure: The case of two major exhibitions in China. Journal of
Convention & Event Tourism, 11(2), 100-118.
37
Chapter 2
Chapter 2 was written as an independent manuscript for submission to the peer-
reviewed Journal of Convention & Event Tourism. It was formatted per the
specifications of the journal. As an exploratory study, this manuscript intends to
demonstrate the importance of accounting for key stakeholders in the trade show
industry. Chapter 3 follows up by developing a measurement instrument with specific
items on exhibitors’ satisfaction.
The purpose of this study was to propose and examine a three–component
conceptual framework that could be used by trade show organizers to measure their
customers’ (i.e., exhibitors and visitors) satisfaction. After a review of previous literature
on trade show performance evaluation, the VEO framework was proposed to account for
the intricate relationships between three key stakeholders (i.e., exhibitors, visitors,
organizers) in trade shows. Based on the VEO framework, an exhibitor and a visitor
performance evaluation model were constructed and tested using data from 92 exhibitors
and 514 visitors. The results validated the VEO framework by indicating that it is not
adequate to focus on one stakeholder when evaluating trade show performance. Visitors,
exhibitors, and organizers are closely connected and their satisfaction levels and
behaviors interact with one another.
38
Chapter 2 A Three-Component Framework for
Trade Show Organizers’ Performance Evaluation
Introduction
Customer satisfaction, one of the most studied constructs in tourism (Gursoy,
McCleary & Lepsito 2007; Neal & Gursoy, 2008), reflects the perceived quality of
products or services (Pizam & Ellis, 1999), and is considered essential for the survival of
all tourism businesses (Berkman & Gilson, 1986). Researchers have shown that
customer satisfaction can lead to positive word-of-mouth (Zhang, Qu, & Ma, 2010),
higher profitability (Kang & Schrier, 2011), and intention to return (Bowen & Chen,
2001; Jung, 2005), all of which are treated as indicators of business performance. Much
of the research employing these indicators has been conducted with customers and
ignored other, equally important, stakeholders (Lee & Back, 2009). This myopic
approach to customer satisfaction is especially problematic in one segment of the
tourism industry—trade shows (Harris, 2000), which is comprised of three key
stakeholders—visitors, exhibitors, and organizers (Jin, Weber, & Bauer, 2012).
While the relationships between visitors, exhibitors, and organizers have been
acknowledged (Bruhn & Hadwich, 2005; Jin & Weber, 2013), researchers have focused
on one of the key stakeholders and ignored its interactions with the others (e.g., Berne &
García-Uceda, 2008; Gopalakrishna & Lilien, 1995; Hansen, 1999; Reinhold, Reinhold,
& Schmitz, 2010). Exceptions include studies by Herbig, O’Hara, and Palumbo (1997),
Munuera and Ruiz (1999), and Jin et al. (2012). These authors accounted for the
39
interactions between two groups and the impacts of the interactions on trade show
performance. No studies on the intricate relationships between all three key stakeholders
exist. Thus, the objectives of this paper are to: 1) propose a three-component trade show
performance evaluation framework that accounts for the relationships between visitors,
exhibitors, and organizers and 2) empirically examine the proposed conceptual
framework.
Literature Review
Stakeholder theory and key stakeholders in trade shows
The origins of stakeholder theory draw on four key academic fields –sociology,
economics, politics and ethics (Mainardes, Alves, & Raposo, 2011). According to
Freeman (1984), businesses must account for their relationships with the key stakeholders
in their external environment. The goal of stakeholder theory is to help organizations
realize, analyze, and examine the characteristics of individuals or groups influencing or
being influenced by organizational behavior (Mainardes et al., 2011).
In the context of trade shows, there are three key stakeholders: visitors, exhibitors,
and organizers (Jin et al., 2012). Understanding the three key stakeholders could allow
trade show organizers to provide better service and attract more exhibitors and visitors to
their shows. In order to achieve this goal, knowing the behaviors of exhibitors and
visitors and why and how they make certain decisions is important. This information
helps trade show organizers modify their marketing campaign to better cater to the needs
40
of the exhibitors, attract more visitors, and allow organizers to gain a strategic advantage
in the marketplace (Oppermann & Chon, 1997). The fast development of the trade show
industry allows both exhibitors and visitors to choose from many different trade shows,
all of which are experiencing a high level of competition and pressure to consider
differentiation strategies (Berne & García-Uceda, 2008). To survive in this competitive
environment, organizers need to guarantee a trade show's potential to attract a large
number of exhibitors and visitors (Cox, Sequeira, & Bock, 1986).
Exhibitors tend to be interested in well-organized trade shows with high quality
visitors, while visitors want to meet with an adequate number of exhibitors and to obtain
relevant information through organizers. Jago and Deery (2005) conducted semi-
structured interviews to explore the relationships between visitors, organizers, and
international associations in the convention industry. They argued that most studies on
convention site selection have ignored the impact of the relationships between the three
key stakeholders. The same argument could apply to trade show performance evaluation.
Most researchers have only incidentally touched upon the intricate relationships between
the three key stakeholders of a trade show; they have failed to recognize the importance
of all three key stakeholders and how their interactions impact their own satisfaction and
positive behavioral intention. Thus, this study intends to construct and validate a Visitor-
Exhibitor-Organizer (VEO) conceptual framework that emphasizes the relationships
between these three stakeholders when conducting trade show performance evaluation
(Figure 1). The arrows connecting visitors, exhibitors, and organizers indicate that there
are interactions taking place between all three stakeholders in a trade show context and
that their satisfactions and behaviors influence each other. It can be argued that visitors’
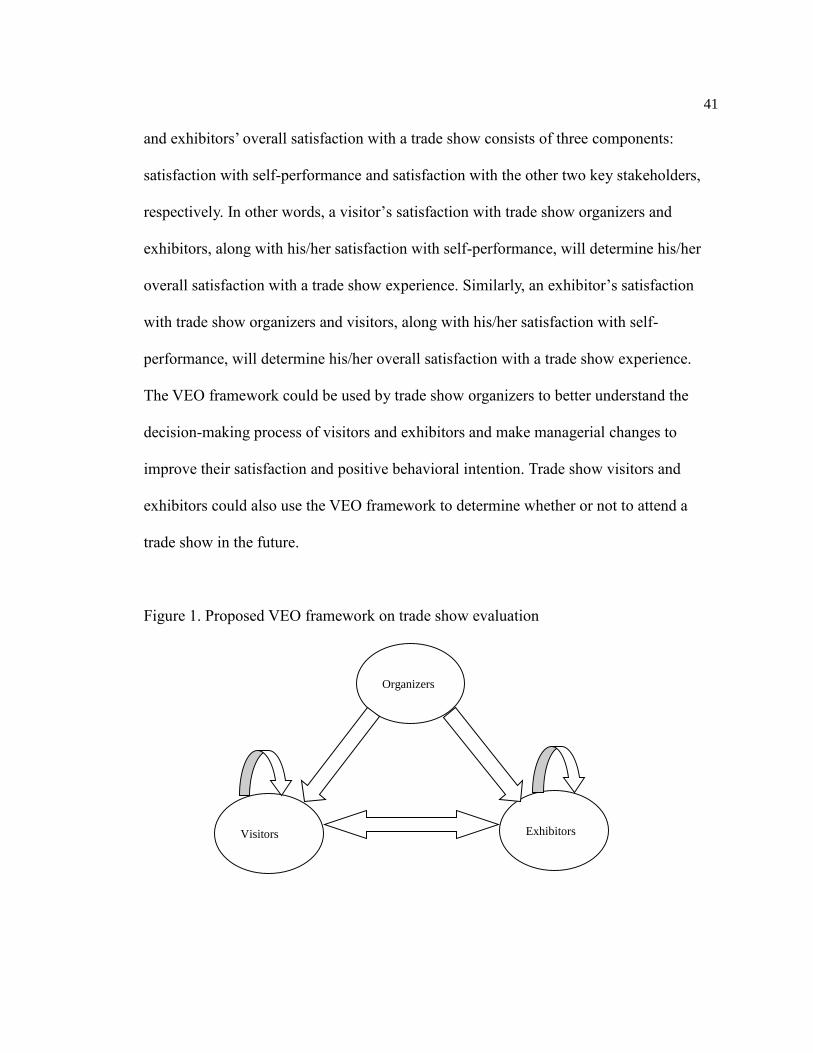
41
and exhibitors’ overall satisfaction with a trade show consists of three components:
satisfaction with self-performance and satisfaction with the other two key stakeholders,
respectively. In other words, a visitor’s satisfaction with trade show organizers and
exhibitors, along with his/her satisfaction with self-performance, will determine his/her
overall satisfaction with a trade show experience. Similarly, an exhibitor’s satisfaction
with trade show organizers and visitors, along with his/her satisfaction with self-
performance, will determine his/her overall satisfaction with a trade show experience.
The VEO framework could be used by trade show organizers to better understand the
decision-making process of visitors and exhibitors and make managerial changes to
improve their satisfaction and positive behavioral intention. Trade show visitors and
exhibitors could also use the VEO framework to determine whether or not to attend a
trade show in the future.
Figure 1. Proposed VEO framework on trade show evaluation
Organizers
Visitors Exhibitors
42
Trade show performance evaluation
Evaluation research has been divided into three major areas: 1) analysis related to
conceptualization and design (i.e., formative evaluation); 2) monitoring of program
implementation (i.e., process evaluation); and 3) assessment of program effectiveness
and efficiency (i.e., summative evaluation; Pearlman & Mollere, 2009; Rossi &
Freeman, 1989). Trade show performance evaluation falls under the summative
evaluation category and its focus is to assess the effectiveness of management and
administration and provide recommendations for improvement.
There are two major lines of research on trade show performance evaluation, i.e.
exhibitor-oriented and visitor-oriented. Hansen’s (2004) work is one of the most well-
organized and comprehensive among the studies conducted on trade show evaluation
from an exhibitor’s perspective (Seringhaus & Rosson, 2004). Hansen argues that show
performance, which has traditionally been evaluated using outcome-based measures,
ignores behavior-based measures. Thus, he set up a preliminary trade show performance
construct, which included one outcome-based dimension (sales-related activities) and
four behavior-based dimensions (information-gathering activities, image-building
activities, motivation activities, and relationship-building activities). Apart from
relationship-building activities, the other four dimensions are mostly about the
exhibitors’ perception of self-performance. The role of organizers and visitors is largely
missing in Hansen’s framework. In a more recent study, Li (2007) focused on the
relationship learning process at a trade show between exhibitors and visitors. Li
contended that learning could occur between exhibitors and visitors and that it had a
43
powerful influence on the performance outcomes as perceived by exhibitors. Although
the relationship between visitors and exhibitors was emphasized in Li’s study, the other
two interrelationships (visitors and organizers; exhibitors and organizers) were
unaccounted for.
The visitor-oriented trade show evaluation literature has primarily focused on the
expected benefits of trade shows for visitors. Munuera and Ruiz (1999) suggested that
trade shows provide a necessary platform for the business relationship between trade
show organizers and visitors. Organizers offer various services, such as accommodation,
entertainment, and business services, and the visitors are the buyers of those services.
Berne and García-Uceda (2008), on the other hand, argued that visitors assess the
performance of a trade show based on their perception of the basic features of the trade
show, attainment of marketing objectives prior to and after a trade show, and the
perceived costs relative to trade show attendance planning and budgeting. These three
criteria do not account for the dynamic interactions between visitors and the other two
key stakeholders at a trade show. Cox (1983) pointed out that visitors’ poor overall
perception of a trade show is often attributable to problems with the personnel at
exhibitors’ booths or, more specifically, when visitors fail to connect with the right types
of booth personnel (Jung, 2005). These results suggest that the relationship between
visitors and exhibitors (i.e., exhibitors’ ability to attract and connect with visitors and
visitors’ knowledge of the exhibits) is a significant predictor of visitors’ overall
satisfaction.
Although the role of organizers has been mentioned in the literature (e.g., Berne &
García-Uceda, 2008; Munuera & Ruiz, 1999) and the management and marketing issues
44
facing organizers are crucial to the success of any trade show, few researchers have
conducted systematic trade show evaluations from the organizer’s perspective.
Organizers are the main propeller of the trade show industry and, as such, play an
important role in the success of the industry. Berne and García-Uceda (2008) suggest
that increased competition between trade show organizers will force them to differentiate
themselves by offering user-oriented services. They also need to conduct trade show
evaluations that will help them obtain more information from visitors and exhibitors to
evaluate their own performance and guide their future improvement. In order to stay
competitive, organizers need to have good relationships with visitors and exhibitors and
create a favorable environment for interactions between visitors and exhibitors.
A primary objective of trade show organizers is to create effective shows that result
in positive outcomes for both exhibitors and visitors. However, the amount of research
into what makes an effective trade show and what contributes to visitors’ and exhibitors’
satisfaction is limited (Gottlieb, Brown, & Drennan, 2011). Few researchers have
analyzed trade show evaluation systematically from the organizer’s perspective. Thus,
the VEO conceptual framework (Figure 1) will be invaluable to organizers interested in
evaluating visitors’ and exhibitors’ overall satisfaction with a trade show.
Satisfaction
Overall satisfaction has been used extensively in trade show studies (e.g., Kang &
Schrier, 2011; Lee & Back, 2009; Oh, 2000). Although it is valuable to know customers’
(i.e., visitors and exhibitors) overall satisfaction, the major problem with using an
45
overall satisfaction measure is that it does not address the specific dimensions of
satisfaction and, as such, is of limited value to managers.
For visitors and exhibitors, being satisfied with a trade show could lower
uncertainty, increase intention to return, and minimize other constraints to participation
in future trade shows. However, there is a lack of comprehensive research concerning
trade show participation behavior and overall satisfaction levels (Pearlman & Mollere,
2009). Previous literature on visitor and exhibitor overall satisfaction with trade shows
has focused on one or two stakeholders and ignored the interactions between all three
stakeholders. Studies on exhibitors’ satisfaction and positive behavioral intention have
focused on exhibitors’ self-performance and/or the interactions between exhibitors and
visitors (Jin et al., 2012; Li, 2007). Few studies have included the role of organizers in
shaping exhibitors’ satisfaction and positive behavioral intention along with visitors and
their self-performance. In order to validate the VEO framework (refer to Figure 1), the
specific dimensions need to be positively related to overall satisfaction with the trade
show. Thus, the following hypotheses are proposed:
Hypothesis 1a: Exhibitors' satisfaction with visitors is positively related to their
overall satisfaction with the trade show.
Hypothesis 1b: Exhibitors' satisfaction with self-performance is positively related to
their overall satisfaction with the trade show.
Hypothesis 1c: Exhibitors' satisfaction with organizers is positively related to their
overall satisfaction with the trade show.
Hypothesis 2a: Visitors' satisfaction with self-performance is positively related to
their overall satisfaction with the trade show.
46
Hypothesis 2b: Visitors' satisfaction with exhibitors is positively related to their
overall satisfaction with the trade show.
Hypothesis 2c: Visitors' satisfaction with organizers is positively related to their
overall satisfaction with the trade show.
Behavioral intention
Behavioral intention refers to the stated likelihood to engage in a particular behavior
(Oliver, 1980). Researchers have documented that consumer satisfaction leads to
positive behavioral intention, such as willingness to return and positive word-of-mouth
(Cronin & Taylor, 1992; Dube, Renaghan, & Miller, 1994). When the two behavioral
components are favorable, customers indicate that they are likely to revisit the service
provider and spread positive reviews to others. When the two behavioral components are
negative, the opposite behaviors are likely to occur (Jani & Han, 2011; Peter & Olson,
2003).
Jung (2005) and Kang and Schrier (2011) found that trade show visitors’ satisfaction
has a positive influence on their intention to revisit and to positively comment on their
experience. These positive outcomes contribute to an improved perception of the trade
show and the host destination (Tanford, Montgomery, & Nelson, 2012; Zhang et al.,
2010). Patterson and Spreng (1997) and Kang and Schrier (2011) found that exhibitors
were more likely to return to a trade show in the future if the risk of uncertainty (e.g.,
whether their exhibition will be successful) had been reduced.
However, it is important to note that a high satisfaction level does not guarantee
47
revisitation. Although satisfaction with a particular destination could be a necessary
condition for explaining repeat visits, it is not sufficient to explain the phenomenon since
many respondents report a high satisfaction level and do not return to the same
destination (Gitelson & Crompton, 1984; Kozak, 2001). Other factors that influence
intent to revisit include past experience with the destination (Gitelson & Crompton,
1984) and travel motivations (Yoon & Uysal, 2005). Given the fact that these other
factors influence individuals’ intent to revisit, trade show organizers may want to obtain
information about attendee's intention to revisit and their willingness to say positive
things about the trade show. After all, organizers have to ensure that they can attract
enough attendees over time to survive in the increasingly competitive trade show
industry.
Securing repeat visitation is important for sustaining the competitiveness of trade
shows. Repeat visitors are more likely to spend more money, to return, and to
recommend the event to others compared to first-time visitors (Shani, Rivera, & Hara,
2009). Thus, studying behaviors of repeat visitors will elicit invaluable market
information for a trade show attempting to maintain its competitive edge (Huang & Hsu,
2009) and increase the number of repeat customers. On the other hand, in order to attract
new customers, trade show organizers need to facilitate positive word-of-mouth (Rosson
& Seringhaus, 1995). Previous studies have only used satisfaction with one key
stakeholder to predict positive behavioral intention (e.g., Kang & Schrier, 2011); they
have not considered the impacts of all three key stakeholders. No matter how many sales
leads exhibitors get during a trade show, if their booths were damaged due to organizers’
negligence, they might not be satisfied with their overall experience and might choose to
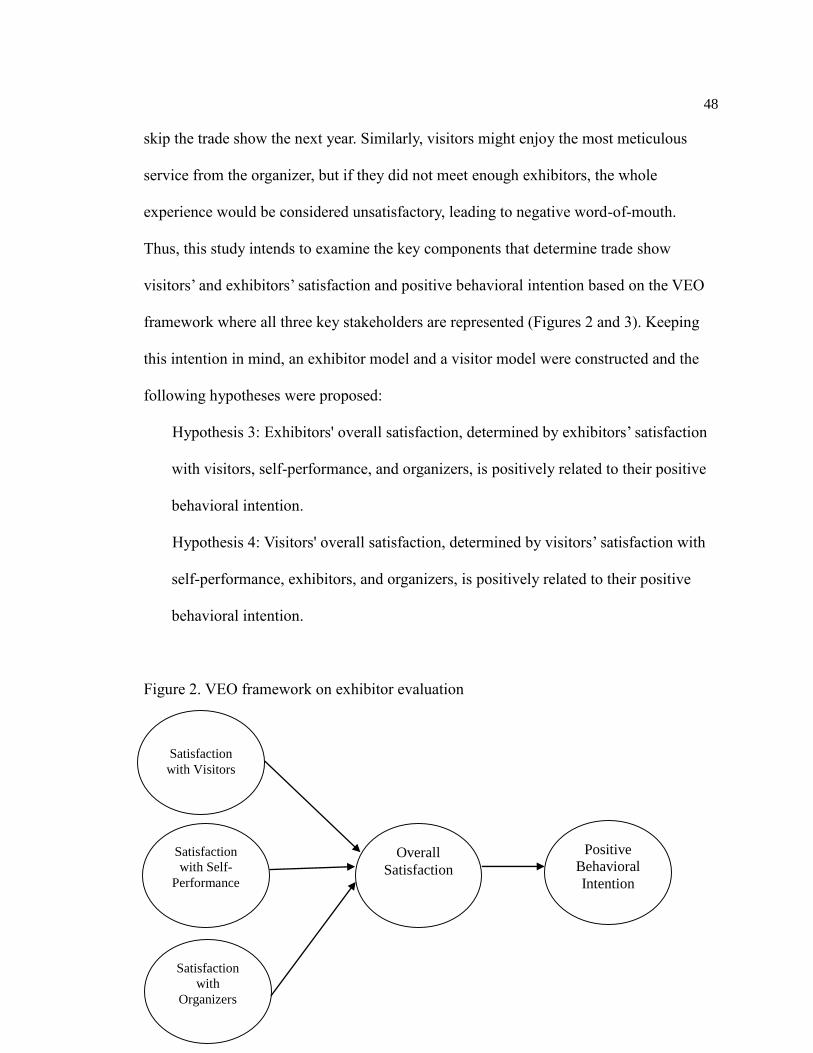
48
skip the trade show the next year. Similarly, visitors might enjoy the most meticulous
service from the organizer, but if they did not meet enough exhibitors, the whole
experience would be considered unsatisfactory, leading to negative word-of-mouth.
Thus, this study intends to examine the key components that determine trade show
visitors’ and exhibitors’ satisfaction and positive behavioral intention based on the VEO
framework where all three key stakeholders are represented (Figures 2 and 3). Keeping
this intention in mind, an exhibitor model and a visitor model were constructed and the
following hypotheses were proposed:
Hypothesis 3: Exhibitors' overall satisfaction, determined by exhibitors’ satisfaction
with visitors, self-performance, and organizers, is positively related to their positive
behavioral intention.
Hypothesis 4: Visitors' overall satisfaction, determined by visitors’ satisfaction with
self-performance, exhibitors, and organizers, is positively related to their positive
behavioral intention.
Figure 2. VEO framework on exhibitor evaluation
Satisfaction
with Visitors
Satisfaction
with Self-
Performance
Overall
Satisfaction
Positive
Behavioral
Intention
Satisfaction
with
Organizers
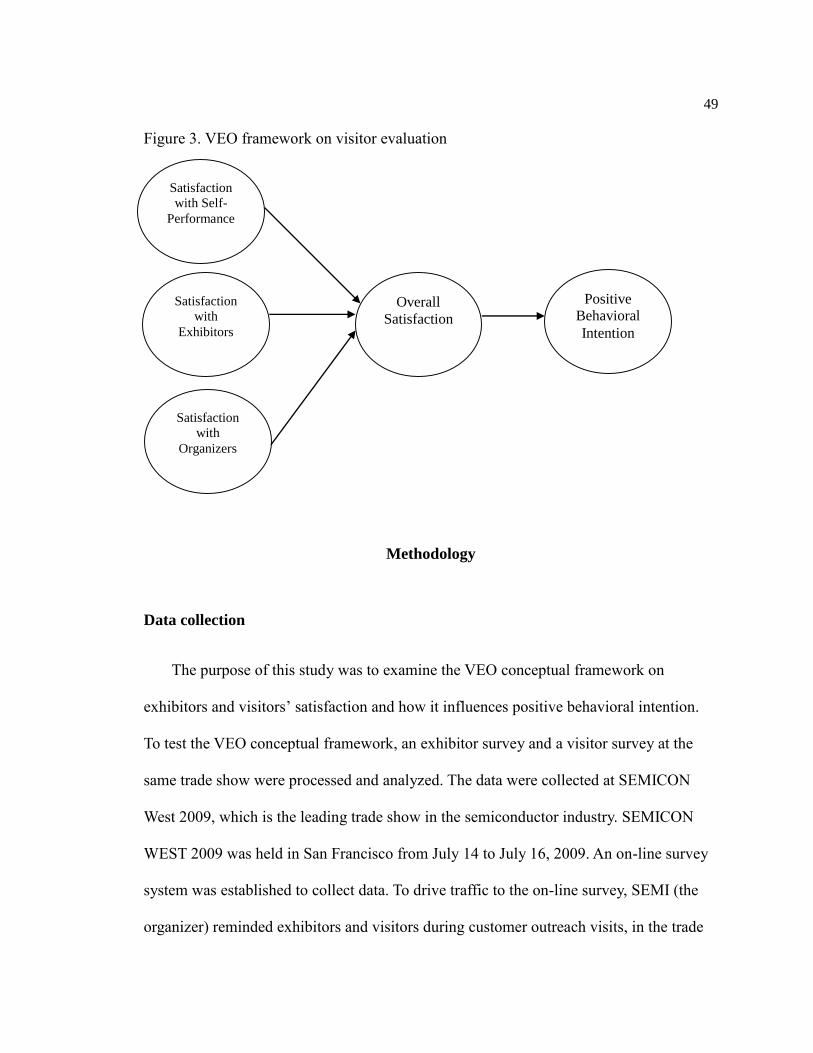
49
Figure 3. VEO framework on visitor evaluation
Methodology
Data collection
The purpose of this study was to examine the VEO conceptual framework on
exhibitors and visitors’ satisfaction and how it influences positive behavioral intention.
To test the VEO conceptual framework, an exhibitor survey and a visitor survey at the
same trade show were processed and analyzed. The data were collected at SEMICON
West 2009, which is the leading trade show in the semiconductor industry. SEMICON
WEST 2009 was held in San Francisco from July 14 to July 16, 2009. An on-line survey
system was established to collect data. To drive traffic to the on-line survey, SEMI (the
organizer) reminded exhibitors and visitors during customer outreach visits, in the trade
Satisfaction
with Self-
Performance
Satisfaction
with
Exhibitors
Overall
Satisfaction
Positive
Behavioral
Intention
Satisfaction
with
Organizers
50
show exhibitor update, and in an e-mail follow-up newsletter to complete the on-line
survey. In order to achieve anonymity and elicit honest feedback, no demographic
information was collected. The time period for the visitors and exhibitors to submit
responses was from August 20 to September 9, 2009.
Instrument
Satisfaction was measured on a 10-point Likert scale ranging from “extremely
unsatisfied” (1) to "extremely satisfied” (10). Exhibitors were asked to indicate their
overall satisfaction with contractor services and their overall satisfaction with
organizer’s customer service. Exhibitors' satisfaction with visitors was measured on
three aspects of visitors’ job level, purchasing authority, and job function using a
10-point Likert scale.
Previous studies on exhibitor trade show performance evaluation have mainly
focused on motivations to participate (Barczyk, George, & William, 1989; Montgomery
& Strick, 1995). In this study, satisfaction with achieving goals at the trade show was
used to measure self-performance. Specifically, exhibitors were asked how satisfied they
were in meeting their objectives at the trade show and their overall satisfaction with the
trade show on a 10-point Likert scale.
Willingness to return and positive word-of-mouth were used as measures of
exhibitors’ behavioral intention (Ainscough, 2005; Kim, Lee, & Yoo, 2006).
Specifically, exhibitors were asked to provide yes or no answers to the following
questions: 1) “Would you exhibit at this trade show in the future?” and 2) “Would you
51
recommend this trade show to other companies?”
A single item on a 10-point Likert scale was used to measure visitors’ satisfaction
with organizers, exhibitors, and self-performance, respectively. Visitors’ overall
satisfaction was assessed by asking individuals to “please rate your overall satisfaction
with this trade show.” Behavioral intention was measured by asking visitors to provide
yes or no answers to the following questions: “Would you attend this trade show in the
future?” and 2) “Would you recommend this trade show to others?”
Data analysis
Data were entered into SPSS 21.0 and AMOS 21.0. Structural equation modeling
(SEM) and the Maximum Likelihood Method (MLM) of estimation were used to
examine the proposed models and test the hypotheses. SEM is designed to evaluate how
well a proposed conceptual model fits the collected data (Yoon, Gursoy, & Chen, 2001)
and measure the relationships among sets of construct variables (Turner & Reisinger,
2001; Yoon & Uysal, 2005). The SEM procedure was considered to be an appropriate
solution for the proposed models. Correlation matrices, standard deviations, and
goodness of fit statistics were utilized to examine the hypothesized models in SEM. In
order to compare different paths, standardized solutions were utilized to report the
results. Model fit was evaluated with three goodness-of-fit indices: the comparative fit
index (CFI; Bentler, 1990), the root-mean-square error of approximation (RMSEA;
Steiger, 1990), and the Tucker-Lewis index (TLI; Tucker & Lewis, 1973). Minimum
TLIs and CFIs of .90 were required for model acceptance, and values of .95 or greater
52
were regarded as an indication of good model fit. RMSEAs of less than .06 were
indicators of a good-fitting model (Hu & Bentler, 1998).
Results
A total of 514 valid surveys were completed by visitors and 92 were completed by
exhibitors. Correlation matrices of the exhibitor model and of the visitor model are
presented in Tables 1 and 2. Most variables were significantly correlated with each other
and in the expected direction. The Cronbach’s alphas were found to be at an acceptable
level of .7 or higher, providing evidence of construct reliability.
The results of SEM provided support for the convergent validity of measures since
estimated loadings for all indicators were significant at p <.01 (Anderson & Gerbing,
1988). In order to examine the measurement model, the goodness of fit indices for the
proposed model were examined. The CFI, TLI, and RMSEA of the exhibitor model were
within the accepted cut-off values [χ2 (23, N = 92) = 28.93, p = .18, CFI = .99, TLI
= .98, RMSEA = .05] (Hu & Bentler, 1998). The variances of the satisfaction and
positive behavioral intention constructs explained by exogenous variables (i.e., squared
multiple correlation) ranged from .15 to .66. The standardized path coefficients are
highlighted in Figure 4.
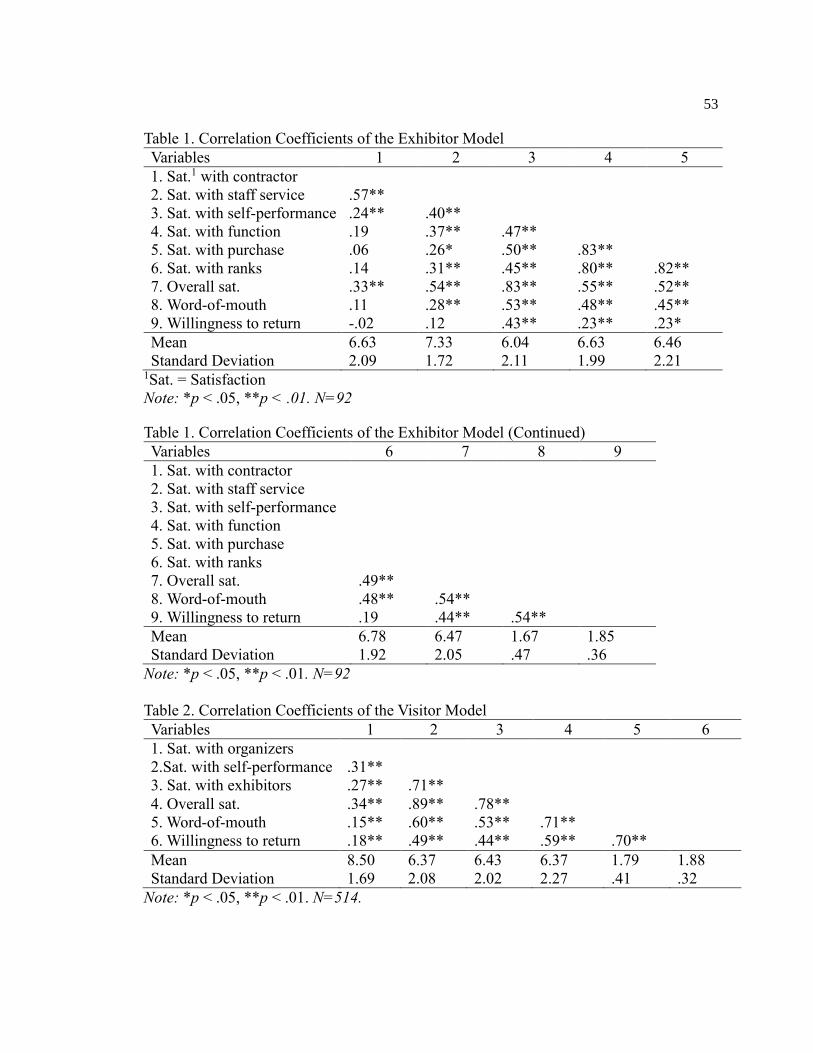
53
Table 1. Correlation Coefficients of the Exhibitor Model
Variables 1 2 3 4 5
1. Sat.1 with contractor
2. Sat. with staff service .57**
3. Sat. with self-performance .24** .40**
4. Sat. with function .19 .37** .47**
5. Sat. with purchase .06 .26* .50** .83**
6. Sat. with ranks .14 .31** .45** .80** .82**
7. Overall sat. .33** .54** .83** .55** .52**
8. Word-of-mouth .11 .28** .53** .48** .45**
9. Willingness to return -.02 .12 .43** .23** .23*
Mean 6.63 7.33 6.04 6.63 6.46
Standard Deviation 2.09 1.72 2.11 1.99 2.21 1Sat. = Satisfaction
Note: *p < .05, **p < .01. N=92
Table 1. Correlation Coefficients of the Exhibitor Model (Continued)
Variables 6 7 8 9
1. Sat. with contractor
2. Sat. with staff service
3. Sat. with self-performance
4. Sat. with function
5. Sat. with purchase
6. Sat. with ranks
7. Overall sat. .49**
8. Word-of-mouth .48** .54**
9. Willingness to return .19 .44** .54**
Mean 6.78 6.47 1.67 1.85
Standard Deviation 1.92 2.05 .47 .36
Note: *p < .05, **p < .01. N=92
Table 2. Correlation Coefficients of the Visitor Model
Variables 1 2 3 4 5 6
1. Sat. with organizers
2.Sat. with self-performance .31**
3. Sat. with exhibitors .27** .71**
4. Overall sat. .34** .89** .78**
5. Word-of-mouth .15** .60** .53** .71**
6. Willingness to return .18** .49** .44** .59** .70**
Mean 8.50 6.37 6.43 6.37 1.79 1.88
Standard Deviation 1.69 2.08 2.02 2.27 .41 .32
Note: *p < .05, **p < .01. N=514.
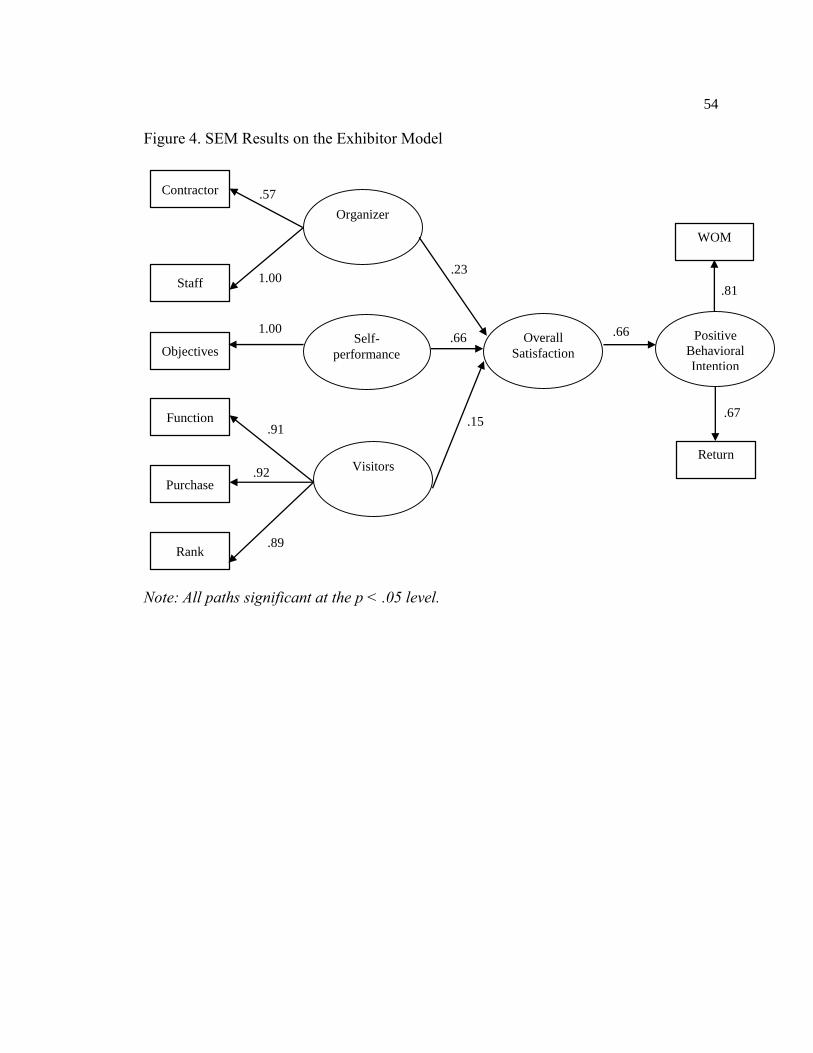
54
Figure 4. SEM Results on the Exhibitor Model
Note: All paths significant at the p < .05 level.
Contractor
Staff
Objectives
Function
Purchase
Rank
Overall
Satisfaction
Positive
Behavioral
Intention
Organizer
Self-
performance
Visitors
1
.00
.
91 .
92
.
89
WOM
Return
.81
.
67
.57
1.00
1.00
.91
.92
.89
.23
.66
.15
.66
.67
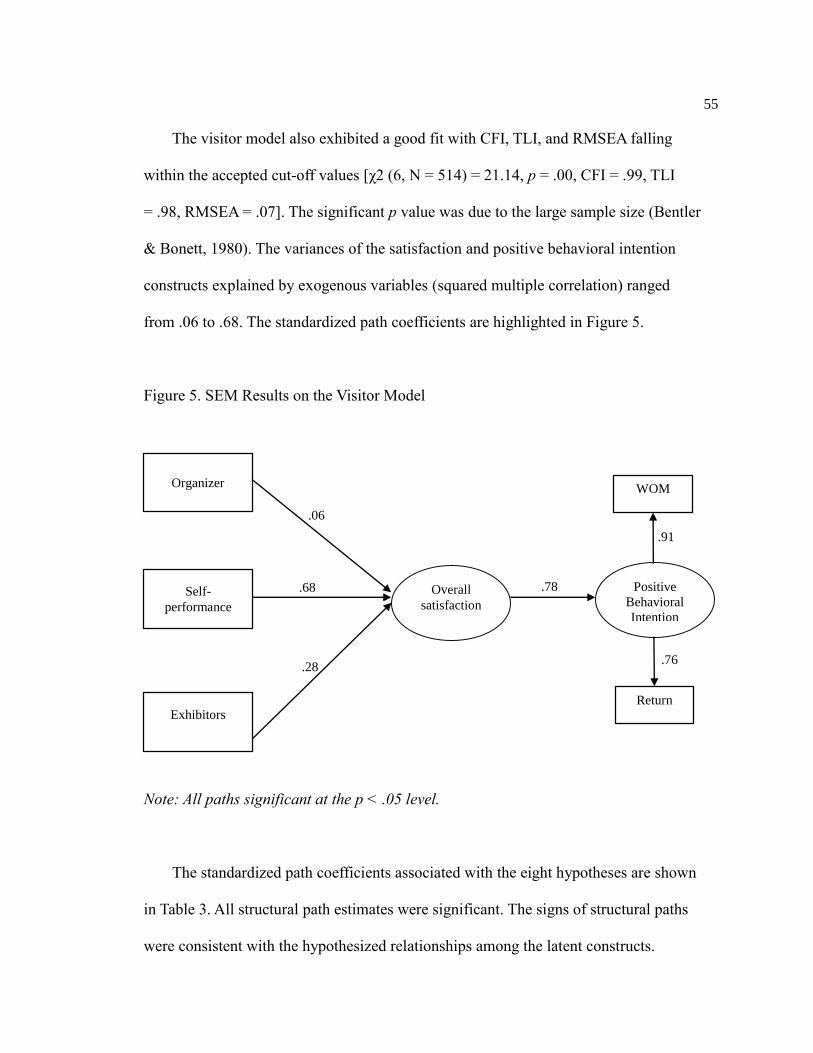
55
The visitor model also exhibited a good fit with CFI, TLI, and RMSEA falling
within the accepted cut-off values [χ2 (6, N = 514) = 21.14, p = .00, CFI = .99, TLI
= .98, RMSEA = .07]. The significant p value was due to the large sample size (Bentler
& Bonett, 1980). The variances of the satisfaction and positive behavioral intention
constructs explained by exogenous variables (squared multiple correlation) ranged
from .06 to .68. The standardized path coefficients are highlighted in Figure 5.
Figure 5. SEM Results on the Visitor Model
Note: All paths significant at the p < .05 level.
The standardized path coefficients associated with the eight hypotheses are shown
in Table 3. All structural path estimates were significant. The signs of structural paths
were consistent with the hypothesized relationships among the latent constructs.
Overall
satisfaction
Positive
Behavioral
Intention
WOM
Return
.
91
.
76
Organizer
Self-
performance
Exhibitors
.
06
.
68
.
28
.
78
.06
.68
.28
.78
.91
.76
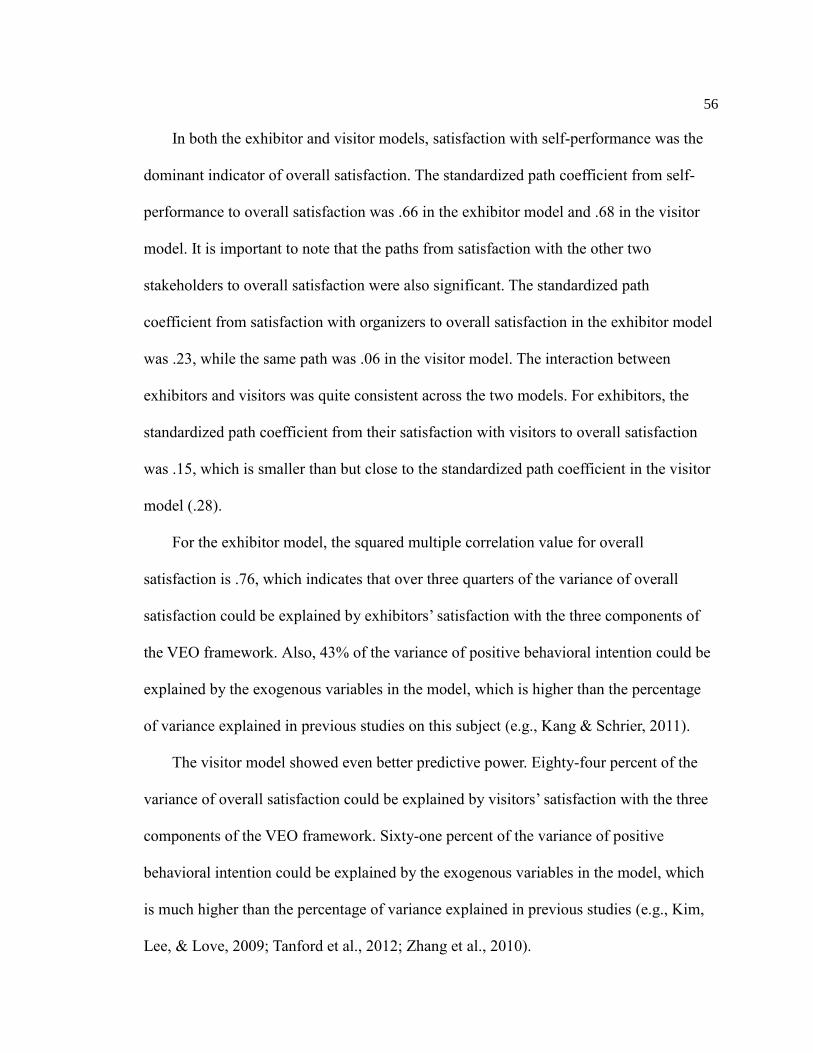
56
In both the exhibitor and visitor models, satisfaction with self-performance was the
dominant indicator of overall satisfaction. The standardized path coefficient from self-
performance to overall satisfaction was .66 in the exhibitor model and .68 in the visitor
model. It is important to note that the paths from satisfaction with the other two
stakeholders to overall satisfaction were also significant. The standardized path
coefficient from satisfaction with organizers to overall satisfaction in the exhibitor model
was .23, while the same path was .06 in the visitor model. The interaction between
exhibitors and visitors was quite consistent across the two models. For exhibitors, the
standardized path coefficient from their satisfaction with visitors to overall satisfaction
was .15, which is smaller than but close to the standardized path coefficient in the visitor
model (.28).
For the exhibitor model, the squared multiple correlation value for overall
satisfaction is .76, which indicates that over three quarters of the variance of overall
satisfaction could be explained by exhibitors’ satisfaction with the three components of
the VEO framework. Also, 43% of the variance of positive behavioral intention could be
explained by the exogenous variables in the model, which is higher than the percentage
of variance explained in previous studies on this subject (e.g., Kang & Schrier, 2011).
The visitor model showed even better predictive power. Eighty-four percent of the
variance of overall satisfaction could be explained by visitors’ satisfaction with the three
components of the VEO framework. Sixty-one percent of the variance of positive
behavioral intention could be explained by the exogenous variables in the model, which
is much higher than the percentage of variance explained in previous studies (e.g., Kim,
Lee, & Love, 2009; Tanford et al., 2012; Zhang et al., 2010).
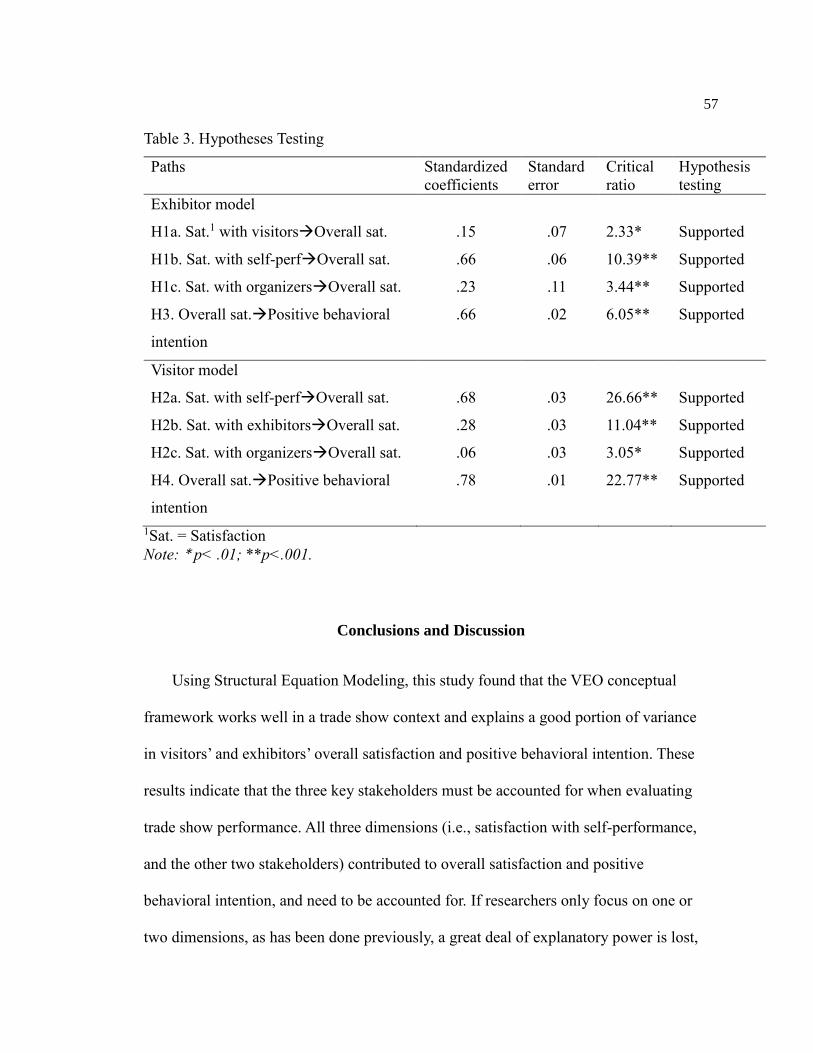
57
Table 3. Hypotheses Testing
Paths Standardized
coefficients
Standard
error
Critical
ratio
Hypothesis
testing
Exhibitor model
H1a. Sat.1 with visitorsOverall sat.
H1b. Sat. with self-perfOverall sat.
H1c. Sat. with organizersOverall sat.
H3. Overall sat.Positive behavioral
intention
.15
.66
.23
.66
.07
.06
.11
.02
2.33*
10.39**
3.44**
6.05**
Supported
Supported
Supported
Supported
Visitor model
H2a. Sat. with self-perfOverall sat.
H2b. Sat. with exhibitorsOverall sat.
H2c. Sat. with organizersOverall sat.
H4. Overall sat.Positive behavioral
intention
.68
.28
.06
.78
.03
.03
.03
.01
26.66**
11.04**
3.05*
22.77**
Supported
Supported
Supported
Supported
1Sat. = Satisfaction
Note: * p< .01; **p<.001.
Conclusions and Discussion
Using Structural Equation Modeling, this study found that the VEO conceptual
framework works well in a trade show context and explains a good portion of variance
in visitors’ and exhibitors’ overall satisfaction and positive behavioral intention. These
results indicate that the three key stakeholders must be accounted for when evaluating
trade show performance. All three dimensions (i.e., satisfaction with self-performance,
and the other two stakeholders) contributed to overall satisfaction and positive
behavioral intention, and need to be accounted for. If researchers only focus on one or
two dimensions, as has been done previously, a great deal of explanatory power is lost,
58
the results are less meaningful, and the recommendations for improving exhibitors’ and
visitors’ trade show experience are less comprehensive.
Satisfaction with self-performance turned out to be the strongest predictor of overall
satisfaction in both the exhibitor and visitor models, which confirmed the importance of
self-performance discussed by Hansen (1999) and Li (2007). However, it is important to
note that satisfaction with the other two groups was also essential to overall satisfaction.
In the exhibitor model, satisfaction with organizers and satisfaction with visitors both
contributed significantly to overall satisfaction, indicating that lots of information would
have been lost if the focus was only on exhibitors (Jin et al., 2012). The same argument
applies to the visitor survey. Visitors’ satisfaction with exhibitors and organizers both
contributed significantly to visitors’ overall satisfaction. Positive behavioral intention
was also better explained when all three stakeholders were taken into consideration.
Overall, the results indicate that trade show exhibitors’ and visitors’ overall
satisfaction depends on not only their self-performance, but also their perceptions of
other key stakeholders (Jin et al., 2012). Self-performance is the most important
predictor of visitors’ and exhibitors’ overall satisfaction and positive behavioral
intention. In addition, understanding the interdependent relationships between
stakeholders may help trade show organizers provide more services desired by visitors
and exhibitors. For example, the interaction quality between visitors and exhibitors is
essential for the success of a trade show (Jin & Weber, 2013). Organizers need to ask
their customers what kind of interaction they are looking for and, based on the feedback,
provide a platform that facilitates the interaction and promotes the quality and quantity
of the interaction. In the meantime, organizers should not overlook the importance of
59
service quality. Trade shows are not only about number of transactions or times of media
exposure, organizers’ service quality is a significant determinant of customers’ overall
satisfaction. Organizers should treat their trade show as a service and make sure their
customers are well taken care of.
Organizers need to understand exhibitors’ and visitors’ motivations and provide
assistance accordingly. For example, to better satisfy exhibitors trade show organizers
should 1) provide more services desired by exhibitors (e.g., assistance in marketing,
presentations, and booth design, results of visitor satisfaction survey); 2) enhance the
quality of the services desired by exhibitors; 3) better inform visitors of the spectrum of
exhibits; and 4) identify and attract more visitors of high quality with high decision-
making and buying authority (Bello, 1992). To enhance visitors’ satisfaction level and
positive behavioral intention trade show organizers should: 1) strive to better understand,
and in turn help exhibitors better understand, the objectives of trade show visitors
(Kozak & Kayar, 2009); 2) provide a convincing spectrum of exhibits; and 3) provide
better visitor services.
Trade show organizers could also use the VEO framework to design their post-show
evaluation questionnaire. Based on the specific attributes of the trade show, organizers
could develop specific items under each of the three dimensions (i.e., satisfaction with
visitors, self-performance, and organizers) for the exhibitor survey and different items
for each of the three dimensions (i.e., satisfaction with self-performance, exhibitors, and
organizers) for the visitor survey. Rather than just asking about overall satisfaction, the
results of a comprehensive post-show evaluation could help organizers identify the
major problems with their trade show and allocate their limited resources to address the
60
problems. Overall, trade show organizers need to not only provide excellent service to
exhibitors and visitors, but also cater to the specific needs of their customers and create a
good platform for exhibitors and visitors to interact.
Limitations and Future Research
While the results of this study challenge researchers and practitioners interested in
the trade show industry to think about the outcomes associated with the relationships
that exist between key stakeholders, further research is required. First, to measure
satisfaction with each of the three dimensions of the VEO framework, two or three items
for the exhibitor model and a single item for the visitor model were used. In order to
further establish the reliability and validity of the VEO framework and produce more
applicable managerial implications, multiple items need to be developed to represent
each satisfaction dimension. For example, rather than asking visitors’ about their general
perception of the organizer’s performance, researchers should question visitors about the
specific services provided by the organizer such as accommodations, onsite services, and
networking opportunities. Scale development procedures should follow to examine the
composite reliability, content validity, convergent validity, discriminant validity, and
predictive validity (Churchill, 1979; DeVellis, 2012; and Fornell & Larcker, 1981), in
order to fully establish the reliability and validity of the VEO framework and lay the
groundwork for future studies on key stakeholders.
Second, the samples used in this study were self-selected rather than probability
samples. The voluntary respondents are active exhibitors or visitors, and their opinions
61
may differ from attendees who did not respond to the on-line survey. A probability
sample should be used in the future in order to extrapolate the results to all trade show
participants.
Third, the survey used in this study was conducted online; an approach that
continues to be controversial. Internet users tend to be younger and more highly
educated than the general U.S. population (Purcell, Rainie, Mitchell, Rosenstiel, &
Olmstead, 2010). Visitors and exhibitors at SEMICON 2009 were people in the
semiconductor industry who are familiar with technology and the Internet, and most
likely are highly educated. Thus, the use of an on-line survey in this study context may
not have been an issue. Further, web-based surveys are thought to provide high-quality
samples for populations who are likely to frequent the Internet (University of Texas,
Austin, 2010). So, again, using an online method of data collection in this study may
have only slightly affected the representativeness of respondents.
Fourth, this study focused on one particular trade show in one industry. Caution
should be taken when applying the results and conclusions to other trade shows. As a
pilot study proposing the VEO framework, an objective of this study was to lay the
groundwork with this new perspective. Future studies should apply the framework at
trade shows in other industries and geographic locations to examine the influence of
industry and culture on the performance of the VEO framework.
Despite the limitations, this study has revealed and validated the VEO conceptual
framework, providing researchers and practitioners with new insight to the relationships
that exist between the three key stakeholders and the outcomes of those relationships
that may have important impacts on the success of the trade show industry.
62
References
Anderson, J. C., & Gerbing, D. W. (1988). Structural equation modeling in practice: A
review and recommended two-step approach. Psychological Bulletin, 103(3), 411-
423.
Ainscough, T. L. (2005). The effect of brand, agent, and price on consumer evaluation of
travel services. Journal of Travel & Tourism Marketing, 19(1), 39-48.
Barczyk, C., George G., & William, C. (1989). Trade show participation: Inter-industry
and organizational motives. Journal of Professional Services Marketing, 4(1), 131-
147.
Bello, D. C. (1992). Industrial buyer behaviour at trade shows - Implications for selling
effectiveness. Journal of Business Research, 25(1), 59-80.
Bentler, P. M. (1990). Comparative fit indexes in structural models. Psychological
Bulletin, 107(2), 238-246.
Bentler, P. M., & Bonett, D. G. (1980). Significance tests and goodness-of-fit in the
analysis of covariance structures. Psychological Bulletin, 88(3), 588-600.
Berkman, H. W., & Gilson. C. (1986). Consumer Behavior Concepts and Strategies (3rd
ed.). Boston: Kent.
Berne, C., & García-Uceda, M. (2008). Criteria involved in evaluation of trade shows to
visit. Industrial Marketing Management, 37(5), 565-579.
Bowen, J. T., & Chen, S. L. (2001). The relationship between customer loyalty and
customer satisfaction. International Journal of Contemporary Hospitality
Management, 13(5), 213–217.
63
Bruhn, M., & Hadwich, K. (2005). Managing the service quality of trade fairs. In M.
Kirchgeorg (Ed.), Trade show management: Planning, implementing and controlling
of trade shows, conventions and events (pp. 787-821). Gabler Verlag.
Churchill, G. A. (1979). A paradigm for developing better measures of marketing
constructs. Journal of Marketing Research, 16(1), 64-73.
Cox, J. M. (1983). How effective is your exhibit? Successful Meetings, 32, 59-61.
Cox, J. M., Sequeira, I. K., & Bock, L. L. (1986). Trade shows trends: Audience quality
remains high. Business Marketing, 72(5), 108-114.
Cronin, J. J., & Taylor, S. A. (1992). Measuring service quality: A reexamination and
extension. Journal of Marketing, 56(3), 55-68.
Devellis, R. F. (2012). Scale development: Theory and applications (3e). Los Angeles:
Sage.
Dube, L., Renaghan, L. M., & Miller J. M. (1994). Measuring customer satisfaction for
strategic management. Cornell Hotel and Restaurant Administration Quarterly,
35(February), 30-47.
Fornell, C., & Larcker, D. F. (1981). Evaluating structural equation models with
unobservable variables and measurement error. Journal of Marketing Research,
18(1), 39-50.
Freeman, R. (1984). Strategic management: A stakeholder’s approach. Boston, MA:
Pitman.
Gitelson, R. J., & Crompton, J. L. (1984). Insights into the Repeat Vacation Phenomenon.
Annals of Tourism Research, 11(2), 199-217.
Gopalakrishna, S., & Lilien, G. (1995). A three-stage model of industrial trade show
64
performance. Marketing Science, 14(1), 22-42.
Gottlieb, U. R., Brown, M. R., & Drennan, J. (2011). The influence of service quality
and trade show effectiveness on post-show purchase intention. European Journal of
Marketing, 45(11/12), 1642-1659.
Gursoy, D., McCleary, K. W., & Lepsito, L. R. (2007). Propensity to complain: Effects
of personality and behavioral factors. Journal of Hospitality & Tourism Research,
31(3), 358-386.
Hansen, K. (2004). Measuring performance at trade shows: Scale development and
validation. Journal of Business Research, 57(1), 1-13.
Hansen, K. (1999). Trade show performance: A conceptual framework and its
implications for future research. Academy of Marketing Science Review, 8, 1–21.
Harris, D. (2000). The shows will go on. Sales & Marketing Management, 152(5), 85.
Herbig, P., O’Hara, B., & Palumbo, F. (1997). Differences between trade show exhibitors
and non-exhibitors. Journal of Business & Industrial Marketing, 12(6), 368-382.
Hu, L., & Bentler, P. M. (1998). Fit indices in covariance structure modeling: Sensitivity
to underparameterized model misspecification. Psychological Methods, 3(4), 424–
453.
Huang, S. & Hsu, C. C. (2009). Effects of travel motivation, past experience, perceived
constraint, and attitude on revisit intention. Journal of Travel Research, 48(1) 29-44.
Jago, L. K. & Deery, M. (2005). Relationships and factors influencing convention
decision making. Journal of Convention & Event Tourism, 7(1), 23-41.
Jani, D., & Han, H. (2011). Investigating the key factors affecting behavioral intentions:
Evidence from a full-service restaurant setting. International Journal of
65
Contemporary Hospitality Management, 23(7), 1000-1018.
Jin, X., & Weber, K. (2013). Developing and testing a model of exhibition brand
preference: The exhibitors’ perspective. Tourism Management, 38, 94-104.
Jin, X., Weber, K., & Bauer, T. (2012). Relationship quality between exhibitors and
organizers: A perspective from Mainland China’s exhibition industry. International
Journal of Hospitality Management, 31(4), 1222-1234.
Jung, M. (2005). Determinants of exhibition service quality as perceived by attendees.
Journal of Convention & Event Tourism, 7(3-4), 85-98.
Kang, J., & Schrier, T. (2011). The decision-making process of tradeshow exhibitors:
The effects of social value, company size, and prior experience on satisfaction and
behavioral intentions. Journal of Convention & Event Tourism, 12(2), 65-85.
Kim, Y., Lee, Y., & Love, C. (2009). A case study examining the influence of conference
food function on attendee satisfaction and return intention at a corporate conference.
Journal of Convention & Event Tourism, 10(3), 211-230.
Kim, W. G., Lee, Y. K., & Yoo, Y. J. (2006). Predictors of relationship quality and
relationship outcomes in luxury restaurants. Journal of Hospitality & Tourism
Research, 30(2), 143–169.
Kozak, M. (2001). Repeaters’ behavior at two distinct destinations. Annals of Tourism
Research, 28(3), 784-807.
Kozak, N., & Kayar, C. H. (2009). Visitors’ objectives for trade exhibition attendance: A
case study on the East Meditaerranean international toursm and travel exhibition
(EMITT). Event Management, 12, 133-141.
Lee, J., & Back, K. (2009). Examining the effect of self-image congruence, relative to
66
education and networking, on conference evaluation through its competing models
and moderating effect. Journal of Convention & Event Tourism, 10(4), 256-275.
Li, L-Y. (2007). Marketing resources and performance of exhibitor firms in trade shows:
A contingent resource perspective. Industrial Marketing Management, 36(3), 360-
370. doi:10.1016/j.indmarman.2005.11.001
Mainardes, E. W., Alves, H., & Raposo, M. (2011). Stakeholder theory: Issues to
resolve. Management Decision, 49(2), 226-252.
Munuera, J., & Ruiz, S. (1999). Trade fairs as services: A look at visitors’ objectives in
Spain. Journal of Business Research, 44(1), 17-24.
Montgomery, R., & Strick, S. (1995). Meetings, conventions, and expositions—an
introduction to the industry. New York: Van Nostrand Reinhold.
Neal, J. D., & Gursoy, D. (2008). A multifaceted analysis of tourism satisfaction. Journal
of Travel Research, 47(1), 53-62.
Oh, H. (2000). Diners’ perception of quality, value, and satisfaction: A practical
viewpoint. Cornell Hotel and Restaurant Administration Quarterly, 41(3), 58–66.
Oliver, R. L. (1980). A cognitive model for the antecedents and consequences of
satisfaction decisions. Journal of Marketing Research, 27 (4), 460-469.
Oppermann, M., & Chon, K. S. (1997). Convention participation decision-making
process. Annals of Tourism Research, 24(1), 178–191.
Patterson, P. G., & Spreng, R. A. (1997). Modelling the relationship between perceived
value, satisfaction and repurchase intentions in a business to business, services
context: An empirical examination. International Journal of Service Industry
Management, 8(5), 414-434.
67
Pearlman, D. M., & Mollere, L. (2009). Meetings, incentive, convention, and exhibition
evaluation practices: An exploratory study among destination marketing
organizations. Journal of Convention and Event Tourism, 10(3), 147-165.
Peter, J.P. & Olson, J.C. (2003). Consumer behavior and marketing strategy, 6th ed..
Singapore: McGraw-Hill.
Pizam, A., & Ellis. T. (1999). Customer satisfaction and its measurement in hospitality
enterprises. International Journal of Contemporary Hospitality Management, 11(7),
326-339.
Purcell, K., Rainie, L., Mitchell, A., Rosenstiel, T., & Olmstead, K. (2010).
Understanding the participatory news consumer. Retrieved from
http://www.scribd.com/doc/27659331/Pew-Internet-Survey-Understanding-the-
Participatory-News-Consumer
Reinhold, M., Reinhold, S., & Schmitz, C. (2010). Exhibitor satisfaction in business-to-
business trade shows: Understanding performance patterns from Vavra’s
Importance Grid perspective. In EMAC 2010. Brüssel: European Marketing
Academy.
Rossi, P. H., & Freeman, H. E. (1989). Evaluation: A systematic approach, 4th ed.
Newbury Park, CA: Sage Publications Inc.
Rosson, P. J., & Seringhaus, F. H. R. (1995). Visitor and exhibitor interaction at industrial
trade fairs. Journal of Business Research, 32(1), 81-90.
Seringhaus, F., & Rosson, P. (2004, October). An analysis model for performance
measurement of international trade fair exhibitors. Retrieved from
http://citt.management.dal.ca/Files/pdf’s/DP-198.pdf
68
Shani, A., Rivera, M. A., & Hara, T. (2009). Assessing the viability of repeat visitors to
cultural events: Evidence from the Zora! Festival. Journal of Convention & Event
Tourism, 10(2), 89-104.
Steiger, J. H. (1990). Structural model evaluation and modification: An interval
estimation approach. Multivariate Behavioral Research, 25(2), 173–180.
Tanford, S., Montgomery, R., & Nelson, K. B. (2012). Factors that influence attendance,
satisfaction, and loyalty for conventions. Journal of Convention & Event Tourism,
13(4), 290-318.
Tucker, L. R., & Lewis, C. (1973). A reliability coefficient for maximum likelihood
factor analysis. Psychometrika, 38(1), 1–10.
Turner, L. W., & Reisinger, Y. (2001). Shopping satisfaction for domestic tourists.
Journal of Retailing and Consumer Services, 8(1), 15-27.
University of Texas, Austin. (2010). Sample quality. Retrieved from
http://www.utexas.edu/learn/surveys/disadvantages.html
Yoon, Y., Gursoy, D., & Chen, J. (2001). Validating a tourism development theory with
structural equation modeling. Tourism Management, 22(4), 363–372.
Yoon, Y., & M. Uysal (2005). An examination of the effects of motivation and
satisfaction on destination loyalty: A structural model. Tourism Management, 26(1):
45-56.
Zhang, L., Qu, H., & Ma, J. (2010). Examining the relationship of exhibition attendees’
satisfaction and expenditure: The case of two major exhibitions in China. Journal of
Convention & Event Tourism, 11(2), 100-118.
69
Chapter 3
Chapter 3 was written as an independent manuscript for submission to the peer-
reviewed International Journal of Hospitality Management. It was formatted per the
specifications of the journal. Chapter 2 demonstrated that all three dimensions (i.e.,
satisfaction with self-performance and satisfaction with the other two stakeholders)
contributed significantly to exhibitors’ and visitors’ overall satisfaction. Focusing on
exhibitors only, Chapter 3 intends to develop an instrument with good reliability and
validity to comprehensively measure exhibitors’ satisfaction.
A measurement scale accounting for the significant roles of three key
stakeholders (i.e., trade show visitors, exhibitors, and organizers) in a trade show context
was constructed and validated through a pilot test, scale purification and validation. The
final instrument consisted of 46-items representing 3 dimensions and 12 sub-dimensions
of exhibitors’ satisfaction. Reliability, unidimensionality, content validity, construct
validity, discriminant validity, and predictive validity of the scale were tested and
established using 594 responses from 3 trade shows in China. The resulting instrument
was found to be superior to existing instruments in that it comprehensively measures
exhibitors’ performance at a trade show and explains a large portion of exhibitors’
overall satisfaction.
70
Chapter 3 Developing a Trade Show Exhibitor’s Satisfaction
Measurement Scale
INTRODUCTION
Researchers have conducted extensive studies with trade show exhibitors to
identify the key determinants of their satisfaction (Jung, 2005; Lee & Back, 2009).
Results have been used to help exhibitors better manage their trade show participation
(Dekimpe, François, Gopalakrishna, Lilien, & van den Bulte, 1997) and trade show
organizers provide better service to exhibitors (Jin & Weber, 2013). However, these
results have been derived from observational outcome indicators (e.g., actual sales at the
show, number of leads) that have not been clearly defined or shown to be reliable and
valid (Gopalakrishna & Lilien, 1995; Kerin & Cron, 1987). These outcome indicators
also have been found to be weakly related to exhibitor’s overall satisfaction and positive
behavioral intention (Hansen, 2004; Jin, Weber, & Bauer, 2012). As a result, the trade
show performance literature lacks a comprehensive conceptual framework for the
determinants of exhibitor’s satisfaction, as well as scales with adequate evidence of
reliability and validity (Hansen, 2004).
An additional limitation of previous trade show studies is that most have focused
on exhibitors only, failing to acknowledge the roles of the other two key stakeholders—
trade show organizers and visitors (e.g., Berne & García-Uceda, 2008; Bruhn &
Hadwich, 2005; Jin & Weber, 2013; Reinhold, Reinhold, & Schmitz, 2010). Exceptions
include studies by Herbig, O’Hara, and Palumbo (1997), Munuera and Ruiz (1999), and
71
Jin et al. (2012). These authors accounted for the relationships between two groups of
stakeholders and their impacts on trade show performance. However, there have been no
studies on the intricate relationships between all three key stakeholders in the trade show
industry.
Stakeholder theory, which was introduced by Freeman in 1984, recognizes that
successful performance of a business is dependent, in part, on the external environment,
which is made up of key stakeholders. In a trade show setting the key stakeholders or
“actors” are visitors, exhibitors, and organizers. Face-to-face contact is a key feature of a
trade show that distinguishes it from other types of business to business (B2B) marketing
and is one of its most valuable features (Godar & O’Connor, 2001). Through face-to-face
interactions, exhibitors and visitors share their common interests, discuss industry trends,
build relationships in a cost-effective way, and adopt specific roles throughout the
purchasing process, should it occur (Kang & Schrier, 2011; Rosson & Seringhaus, 1995).
Face to face interactions also involve organizers whose customers are visitors and
exhibitors (Jin et al., 2012; Jung, 2005). Thus, the eventual success of a trade show
depends largely on its ability to meet the objectives of all three key stakeholders
(Gopalakrishna, Roster, & Sridhar, 2010).
The trade show literature lacks a comprehensive conceptual framework, valid and
reliable scales, and an understanding of the interactions between the three key
stakeholders, making research on key determinants of satisfaction for exhibitors difficult.
Thus, the specific objectives of this study are to: 1) construct a measurement scale on
trade show exhibitor’s satisfaction that accounts for all three key stakeholders in the trade
show industry and 2) empirically examine the scale’s reliability and validity. It is
72
expected that trade show organizers will be able to use the proposed measurement scale
in their post-show evaluation to identify what has the most influence on exhibitor’s
overall satisfaction and positive behavioral intention.
Following is a review of the literature that informed this study; results related to
the development, purification, and validation of a measurement scale on trade show
exhibitor’s satisfaction; and a discussion of the results that will lay the groundwork for a
new trade show performance evaluation framework that can be used in future trade show
research.
LITERATURE REVIEW
Satisfaction in Trade Shows
Most studies on satisfaction in the trade show context have focused on overall
satisfaction (Lee & Back, 2009; Lee & Beeler, 2009; Oh, 1999). Overall satisfaction is
conceptualized as “an overall evaluation based on the total purchase and consumption
experience with a good or service over time” (Anderson, Fornell, & Lehmann, 1994, p.
54). The major problem with using overall satisfaction is that it does not address the
specific dimensions of satisfaction and, as such, corresponding managerial implications
are limited. For example, an exhibitor’s overall satisfaction with a trade show might be 1
out of 5, 5 being extremely satisfied. Without knowing the satisfaction levels associated
with each specific dimensions of the trade show, organizers would have no idea how to
fix the problem or improve their service quality.
73
The main benefit organizations receive from satisfying customers is generally
higher profitability (Kang & Schrier, 2011). Results of previous studies have indicated
that satisfied customers show positive behavioral intentions, such as having a greater
intention to return (Bowen & Chen, 2001; Jung, 2005; Servert, Wang, Chen, & Breiter,
2007) and a higher likelihood to share positive comments about their experience (Zhang,
Qu, & Ma, 2010). Because trade show participation is a major cost for exhibitors, being
satisfied with a trade show could lower their uncertainty, increase intention to return, and
minimize their constraints to future participation. This contention lacks empirical
evidence, particularly with respect to trade show participation behavior and overall
satisfaction levels (Pearlman & Mollere, 2009).
Previous literature on visitor and exhibitor overall satisfaction with trade shows
has focused on one or two stakeholders and ignored the intricate interactions between all
three stakeholders (i.e., visitors, exhibitors, organizers). For example, most studies on
exhibitors’ satisfaction and positive behavioral intentions have focused on exhibitors’
self-performance and/or the interactions between exhibitors and visitors (Jin et al., 2012).
Few have included the role of key stakeholders such as organizers or visitors who may
shape exhibitors’ satisfaction and positive behavioral intention.
Stakeholder Theory and Key Stakeholders in Trade Shows
Freeman (1984), in his work entitled Strategic Management: A Stakeholder
Approach, defined how stakeholders with similar interests form a group and recognized it
is important for businesses to account for their relationship with the external
74
environment. He also argued that a company can not be self-sufficient because it is
dependent on the external environment, which is made up of key stakeholders.
One central tenet of stakeholder theory is that successful strategies need to
correspond to the integration of all stakeholder interests rather than the maximization of
one group’s position to the detriment of others (Freeman & McVea, 2001). According to
Mainardes, Alves, and Raposo (2011), the goal of stakeholder theory is to help
organizations realize, analyze, and examine the characteristics of individuals or groups
influencing or being influenced by organizational behavior. These individuals or groups
are referred to as stakeholders and they have clear expectations of their relational
experience with the organization, evaluate the results obtained, and act in accordance
with the results of the evaluation (Polonsky, 1996). Thus, the performance of one
stakeholder is not only dependent on but also impacts the performance of other key
stakeholders.
In the trade show context there are three stakeholders: visitors, exhibitors, and
organizers (Jin et al., 2012). Trade shows no longer function solely as a venue in which
sales are made; instead, they have become a platform for information exchange and
networking (Rosson & Seringhaus, 1995; Stoeck & Schaudy, 2005). The evolving
function of trade shows has an important impact on trade show operation and behaviors
as well as the relationships between visitors, exhibitors, and organizers (Jin et al., 2012).
A potentially viable research paradigm for studying the relationships between
visitors, exhibitors, and organizers is the "network research approach" (Axelsson &
Easton, 1992; Ford, 1990). Rather than focusing solely on dyadic buyer-seller
relationships, the network research approach recognizes that buyer-seller relationships are
75
only one part of the web of relationships. It extends the analysis beyond the buyer-seller
dyad and explores the triad of relationships between visitors, exhibitors, and organizers,
representing an important step in better understanding the way that trade shows work, and
the factors contributing to the success of each stakeholder (Rosson & Seringhaus, 1995).
Understanding the three key stakeholders is important because a common
objective of trade show organizers is maximization of the number of exhibitors and
visitors. Jung (2005) found that visitors at trade shows were most concerned with the
number of participating exhibitors, quality of products or services exhibited, and events
organized at the trade show, all of which demonstrated strong interactions with exhibitors
and organizers. Lee, Yeung, and Dewald (2010) found that trade show visitors are more
motivated than public show visitors and expect more from the organizers and exhibitors.
Similarly, exhibitors regard trade show participation as a major business investment and
expect positive results from visitors and organizers (Hansen, 2004). Thus, the successes
of visitors, exhibitors, and organizers are tied together. It is difficult to imagine that
organizers would consider a trade show a success without considering both exhibitors’
and visitors’ assessment of their own performance. Thus, there needs to be a conceptual
framework that accounts for the triad of relationships between visitors, exhibitors, and
organizers.
This study intends to construct and validate a Visitor-Exhibitor-Organizer (VEO)
conceptual framework that emphasizes the relationships between these three stakeholders
when conducting trade show performance evaluation from the trade show organizer’s
perspective (Figure 1). The arrows connecting visitors, exhibitors, and organizers indicate
that there are interactions taking place between all three stakeholders in a trade show
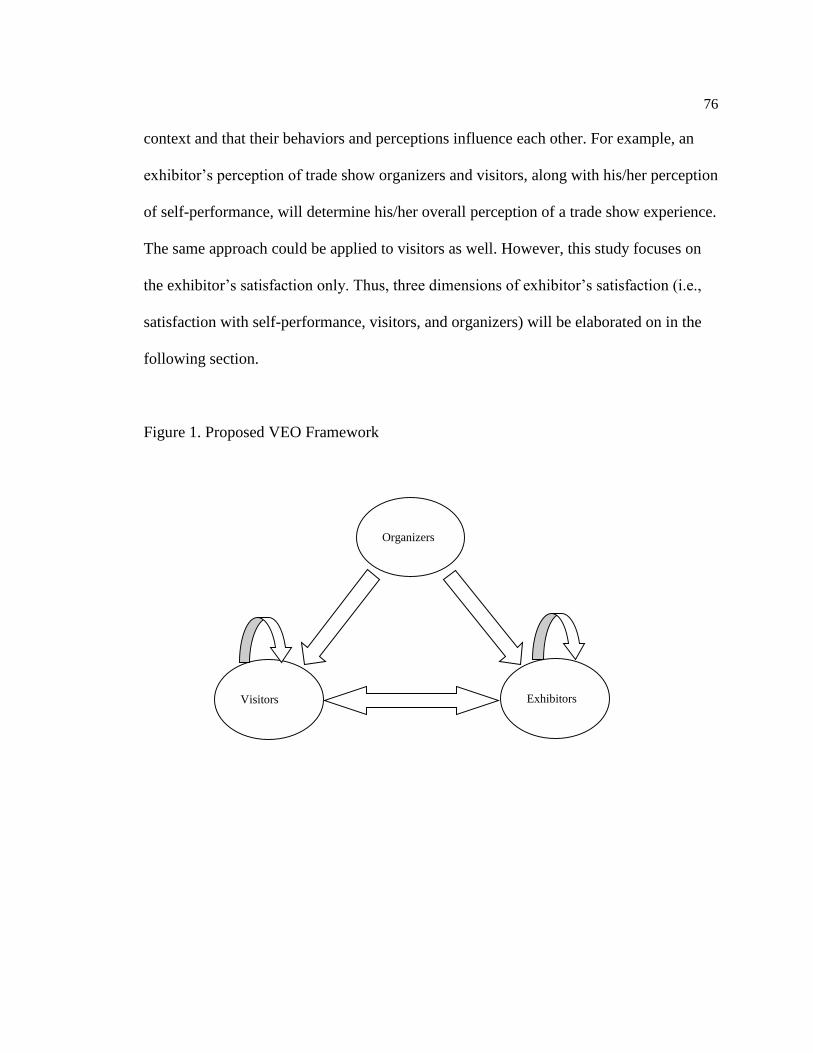
76
context and that their behaviors and perceptions influence each other. For example, an
exhibitor’s perception of trade show organizers and visitors, along with his/her perception
of self-performance, will determine his/her overall perception of a trade show experience.
The same approach could be applied to visitors as well. However, this study focuses on
the exhibitor’s satisfaction only. Thus, three dimensions of exhibitor’s satisfaction (i.e.,
satisfaction with self-performance, visitors, and organizers) will be elaborated on in the
following section.
Figure 1. Proposed VEO Framework
Organizers
Visitors Exhibitors
77
Three Dimensions of Exhibitor’s Satisfaction
Exhibitor’s Self-Performance
Exhibitors’ self-performance corresponds to their perception of their own
performance at a trade show, which is the most common indicator of exhibitors’ trade
show performance and is usually measured against pre-set objectives (Hansen, 2004).
Companies participate in trade shows with the expectation of benefits (Sashi & Perretty,
1992), which may include sales, qualified leads, networking, reputation-building and so
on. Sales are often considered the ultimate objective of an exhibitor at a trade show and
were the primary focus of research on trade shows in the 1990s (Dekimpe et al., 1997).
Gopalakrishna and Lilien (1995) analyzed industrial trade show performance using
a three-stage model reflecting the multi-activity nature of exhibiting. The three stages
were attraction, contact, and conversion efficiency. The results showed that performance
was enhanced by different factors for each of the stages and company-controlled
activities in trade shows are crucial to exhibitors' overall performance. Dekimpe et al.
(1997) extended Gopalakrishna and Lilien’s work (1995) by using an attraction
effectiveness index, which was computed as the number of attendees from the target
audience who visited the booth to talk or obtain literature, divided by the size of the
target audience. The key determinants of performance were found to be pre-show
promotion spending, size of booth, number of personnel per square foot, and use of
vertical trade shows. However, these authors’ performance measures do not present a
practical way of measuring trade show performance for exhibitors because the data
78
required for the measures are not easily available without a sophisticated system for
collecting data on visitors’ interests and intentions (Hansen, 2004).
Researchers have recently argued that compared to selling activities, qualified leads
and customer relationships are more important during the trade show and could be
converted into sales through follow-up activities (Seringhaus & Rosson, 2004). Hansen
(1999), who conducted one of the most well-organized and comprehensive studies on
exhibitors’ self-performance, argued that trade show performance has traditionally been
evaluated using outcome-based measures, and the behavior-based measures are ignored.
Hansen set up a preliminary trade show performance construct, which included one
outcome-based dimension (sales-related activities) and four behavior-based dimensions
(information-gathering activities, image-building activities, motivation activities, and
relationship-building activities). These five dimensions are the essence of exhibitor’s
performance and it is believed that high values associated with these dimensions lead to a
satisfactory overall experience.
The Exhibitor-Visitor Link
Exhibitors (i.e., sellers) and visitors (i.e., buyers) use trade shows to develop new
business relationships and work on existing business relationships (Blythe, 2002).
Visitors also attend trade shows to reduce their social and technological distance from
exhibitors (Ford, 1980). Direct contact between seller and buyer is one of the key features
that distinguish trade shows from advertising and promotion. Furthermore, trade shows
differ from sales calls because the contact is initiated by the buyer rather than the seller
(Munuera & Ruiz, 1999).
79
Early research on the exhibitor-visitor link focused primarily on selling activities
(Bello, 1992; Cavanaugh, 1976; Gopalakrishna & Lilien, 1995; Williams, Gopalakrishna,
& Cox, 1993). Tanner and Chonko (1995) found that the primary goal of exhibitors was
to get sales. Bello and Lohtia (1993) found that the visitor’s job ranking positively related
to the final purchase decision making while firm size negatively related to purchase
decision. Recent studies (Seringhaus & Rosson, 2004) found that getting sales was no
longer the primary goal of exhibitors and visitors.
Godar and O’Connor (2001) found that visitors attend trade shows for reasons
(e.g., reinforce contact and support industry) weakly related or unrelated to purchase
intentions. Borghini, Golfetto, and Rinallo (2006) documented the increased importance
of information search among trade show visitors and argued that it poses challenges to
the way exhibitors traditionally manage their trade show participations or measure returns
on trade show investments. Their finding also led to the conclusion that exhibitors need
to take good care of potential buyers but also need to dedicate sufficient attention to
visitors who are not interested in an immediate purchase. Furthermore, Bello (1992)
pointed out that the characteristics of visitors influence the type of information exchange
taking place at a trade show. Bello found that visitors holding higher ranking positions
are more likely to engage in purchase decision-making and obtaining transaction
information, while visitors in lower ranking positions are more likely to obtain technical
information. Thus, visitors’ job level and job function play an important part in
exhibitors’ success at trade shows.
80
The Exhibitor-Organizer Link
At industrial trade shows exhibitors are more valuable than visitors because
organizers collect most of their revenue from exhibitors. Hence, it is in the organizers’
best interest to cater to the needs of and deliver satisfactory services to exhibitors. The
conceptualization of trade shows as services is manifest for all key stakeholders of trade
shows (Gottlieb, Brown, & Drennan, 2011). Previous research has demonstrated that
trade show visitors (Konopacki, 1996; Munuera & Ruiz, 1999), exhibitors (O’Hara &
Herbig, 1993), and organizers (Munuera & Ruiz, 1999) identify trade shows as having a
substantial service component. Thus, the link between exhibitors and organizers
corresponds to exhibitors’ perception of service quality delivered by organizers.
Adopting Brady and Cronin’s (2001) multi-level model of service quality,
Gottlieb et al. (2011) established a model to examine trade show visitors’ perceptions of
trade show effectiveness. The model proposes that interaction quality, environment
quality, and outcome quality are factors that influence perceptions of service quality and
suggests that trade show effectiveness mediates the effect of perceived service quality on
perceptions of overall service outcomes. The same approach could also apply to
exhibitors’ perception of service quality delivered by organizers. Jin et al. (2012)
investigated the relationship quality between exhibitors and organizers in view of its
potential to significantly affect the success of a particular trade show. The results
indicated that relationship quality between exhibitors and organizers is critical for the
successful and sustainable development of trade shows.
Based on the literature reviewed so far, it is clear that visitors, exhibitors, and
organizers are the three key stakeholders of trade shows and their interactions with and
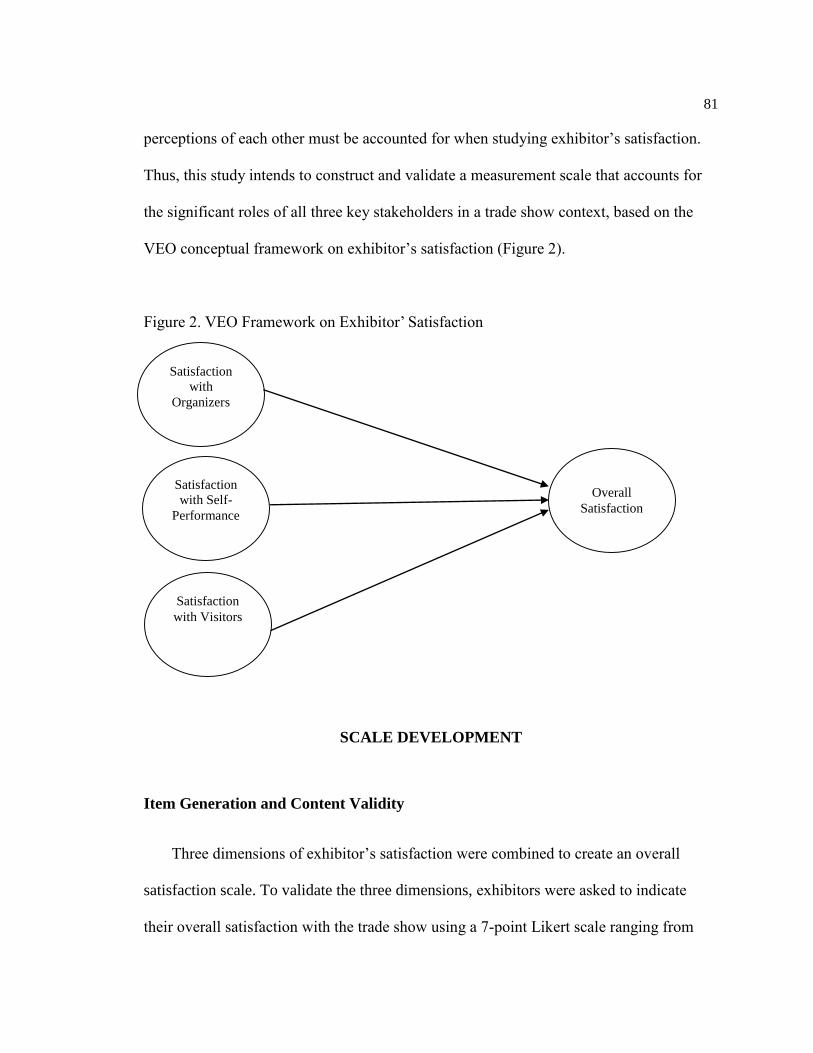
81
perceptions of each other must be accounted for when studying exhibitor’s satisfaction.
Thus, this study intends to construct and validate a measurement scale that accounts for
the significant roles of all three key stakeholders in a trade show context, based on the
VEO conceptual framework on exhibitor’s satisfaction (Figure 2).
Figure 2. VEO Framework on Exhibitor’ Satisfaction
SCALE DEVELOPMENT
Item Generation and Content Validity
Three dimensions of exhibitor’s satisfaction were combined to create an overall
satisfaction scale. To validate the three dimensions, exhibitors were asked to indicate
their overall satisfaction with the trade show using a 7-point Likert scale ranging from
Satisfaction
with
Organizers
Satisfaction
with Self-
Performance
Overall
Satisfaction
Satisfaction
with Visitors
82
“extremely unsatisfied” (1) to "extremely satisfied” (7). A description of each dimension
follows.
Exhibitor’s satisfaction with self-performance
Hansen’s (1999) five-dimension conceptual framework was used to enable
exhibitors to document their self-performance. Hansen’s framework includes one
outcome-based dimension (sales-related activities) and four behavior-based dimensions
(information-gathering activities, image-building activities, motivation activities, and
relationship-building activities), which were considered the essence of exhibitors’
performance. This five-dimension framework emphasizes non-sales activities and was
utilized in one of the most well-organized and comprehensive studies on exhibitors’ self-
performance (Seringhaus & Rosson, 2004). Exhibitors were asked to rate their level of
satisfaction with each statement using a 7-point, 18-item scale (1= extremely poor, 7=
extremely excellent).
Exhibitor’s satisfaction with organizers
Based on their own qualitative research and Rust and Oliver’s (1994) three-
component service quality model, Brady and Cronin (2001) found that service quality is a
third-order construct that consists of three primary dimensions: interaction quality,
environment quality, and outcome quality. Each of the primary dimensions has three sub-
dimensions. Interaction quality contains attitude, behavior, and expertise; environment
quality contains ambient conditions, design, and social factors; and outcome quality
contains waiting time, tangibles, and valence. Brady and Cronin’s measure has been used
in the trade show context and has exhibited excellent reliability and validity (see Gottlieb
et al., 2011). For this study, the sub-dimension waiting time was dropped because it does
83
not apply to the trade show industry. As a result, a 21 item measure based on Brady and
Cronin’s (2001) multi-level model on service quality was used to document exhibitors’
level of satisfaction with organizers (Appendix). Exhibitors were asked to rate their level
of agreement using a 7-point scale (1= strongly disagree, 7=strongly agree).
Exhibitor’s satisfaction with visitors
A 7-point, 12-item performance scale (1= extremely poor, 7= extremely
excellent) drawn from a study I conducted (Lin, 2011) was used to enable exhibitors to
indicate their level of satisfaction with visitors. Four sub-dimensions captured exhibitors’
satisfaction with visitors: visitors’ job level, job function, purchasing authority, and
interaction. All four sub-dimensions have been found to influence exhibitors’ satisfaction
with visitors (Bello, 1992; Bello & Lohtia, 1993; Rosson & Seringhaus, 1995).
Content Validity
Four experts (three from the industry and one from academia) reviewed the three
dimensions of the satisfaction scale to ensure content validity (Devellis 2003). The
experts suggested eliminating one item (i.e., “motivate customers”) and editing three
items (i.e., AC1, AC2, and AC3 in the Ambient Conditions dimension, see Table 1). A
total of 50 items were retained to measure the three dimensions of trade show exhibitor’s
satisfaction.
84
Purification of the Measurement Scale
A pilot test of the 50-item satisfaction scale was undertaken using data collected
from the 10th China Household Electrical Appliances Trade Fair, which was held from
August 22 - 24, 2013 in Zhongshan, China. The Fair hosted 800 exhibitors and over
60,000 visitors (i.e., professional buyers). A total of 400 exhibitors were approached
during the last day of the trade show and asked to participate in a survey. For every
exhibiting company approached, the on-site personnel with the highest ranking were
asked to fill out the questionnaire until the target number (n=400) was reached. Multiple
trade show staff were involved with the data collection process. They were provided
instructions regarding face-to-face interviewing before the Fair and were given a script
and told to strictly follow it when surveying exhibitors. Trade show staff were also asked
to keep their opinions to a minimum. The survey instrument included the three-dimension
satisfaction scale. Exhibitors were asked to use a 7-point Likert scale to indicate their
level of agreement with each of the 50 statements (Table 1).
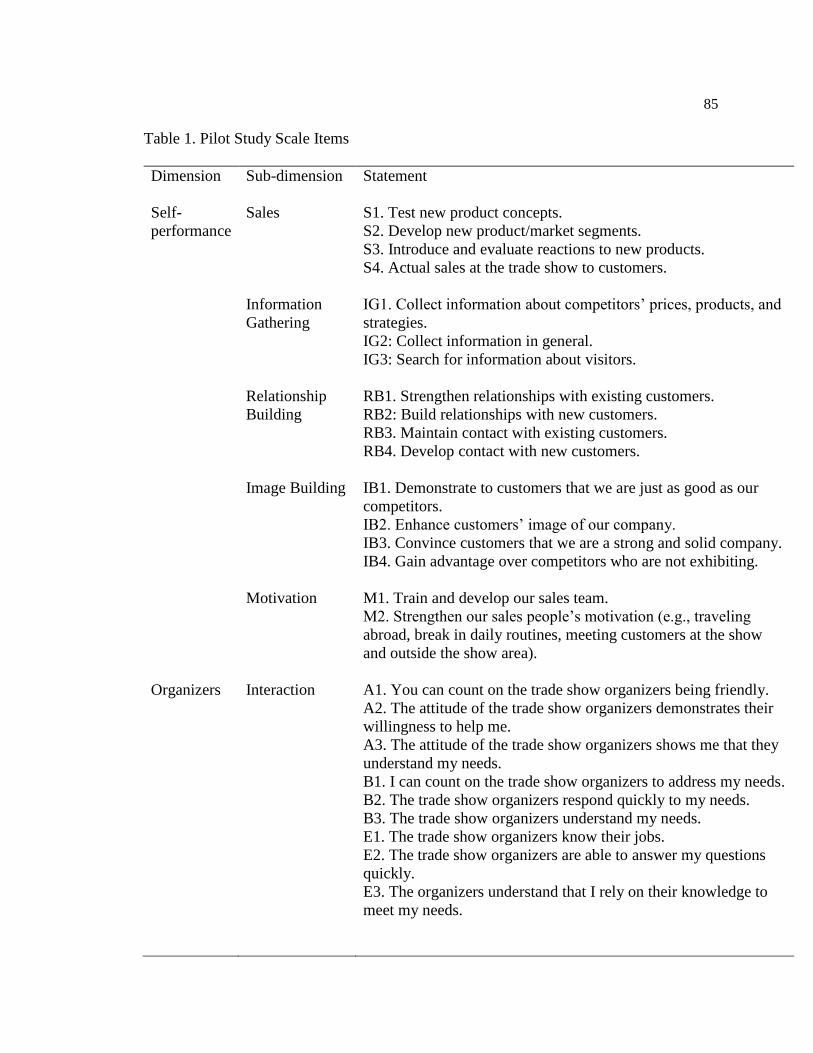
85
Table 1. Pilot Study Scale Items
Dimension Sub-dimension Statement
Self-
performance
Sales S1. Test new product concepts.
S2. Develop new product/market segments.
S3. Introduce and evaluate reactions to new products.
S4. Actual sales at the trade show to customers.
Information
Gathering
IG1. Collect information about competitors’ prices, products, and
strategies.
IG2: Collect information in general.
IG3: Search for information about visitors.
Relationship
Building
RB1. Strengthen relationships with existing customers.
RB2: Build relationships with new customers.
RB3. Maintain contact with existing customers.
RB4. Develop contact with new customers.
Image Building IB1. Demonstrate to customers that we are just as good as our
competitors.
IB2. Enhance customers’ image of our company.
IB3. Convince customers that we are a strong and solid company.
IB4. Gain advantage over competitors who are not exhibiting.
Motivation M1. Train and develop our sales team.
M2. Strengthen our sales people’s motivation (e.g., traveling
abroad, break in daily routines, meeting customers at the show
and outside the show area).
Organizers Interaction A1. You can count on the trade show organizers being friendly.
A2. The attitude of the trade show organizers demonstrates their
willingness to help me.
A3. The attitude of the trade show organizers shows me that they
understand my needs.
B1. I can count on the trade show organizers to address my needs.
B2. The trade show organizers respond quickly to my needs.
B3. The trade show organizers understand my needs.
E1. The trade show organizers know their jobs.
E2. The trade show organizers are able to answer my questions
quickly.
E3. The organizers understand that I rely on their knowledge to
meet my needs.
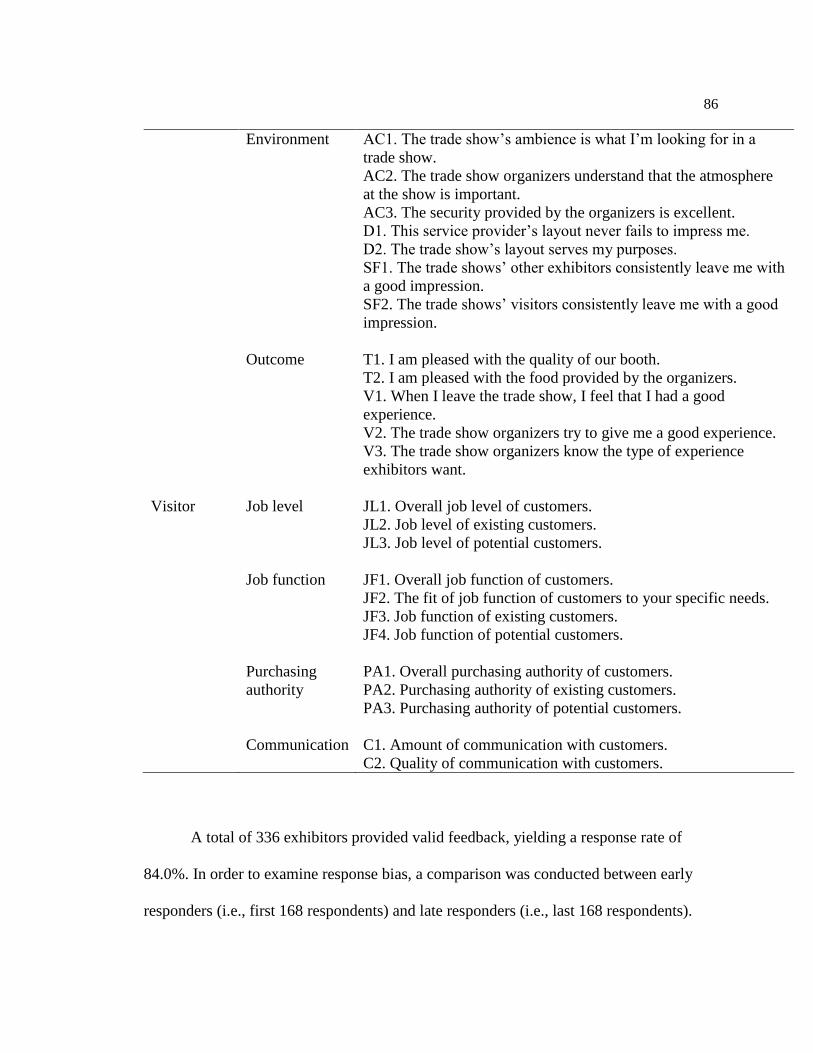
86
Environment AC1. The trade show’s ambience is what I’m looking for in a
trade show.
AC2. The trade show organizers understand that the atmosphere
at the show is important.
AC3. The security provided by the organizers is excellent.
D1. This service provider’s layout never fails to impress me.
D2. The trade show’s layout serves my purposes.
SF1. The trade shows’ other exhibitors consistently leave me with
a good impression.
SF2. The trade shows’ visitors consistently leave me with a good
impression.
Outcome T1. I am pleased with the quality of our booth.
T2. I am pleased with the food provided by the organizers.
V1. When I leave the trade show, I feel that I had a good
experience.
V2. The trade show organizers try to give me a good experience.
V3. The trade show organizers know the type of experience
exhibitors want.
Visitor Job level JL1. Overall job level of customers.
JL2. Job level of existing customers.
JL3. Job level of potential customers.
Job function JF1. Overall job function of customers.
JF2. The fit of job function of customers to your specific needs.
JF3. Job function of existing customers.
JF4. Job function of potential customers.
Purchasing
authority
PA1. Overall purchasing authority of customers.
PA2. Purchasing authority of existing customers.
PA3. Purchasing authority of potential customers.
Communication C1. Amount of communication with customers.
C2. Quality of communication with customers.
A total of 336 exhibitors provided valid feedback, yielding a response rate of
84.0%. In order to examine response bias, a comparison was conducted between early
responders (i.e., first 168 respondents) and late responders (i.e., last 168 respondents).
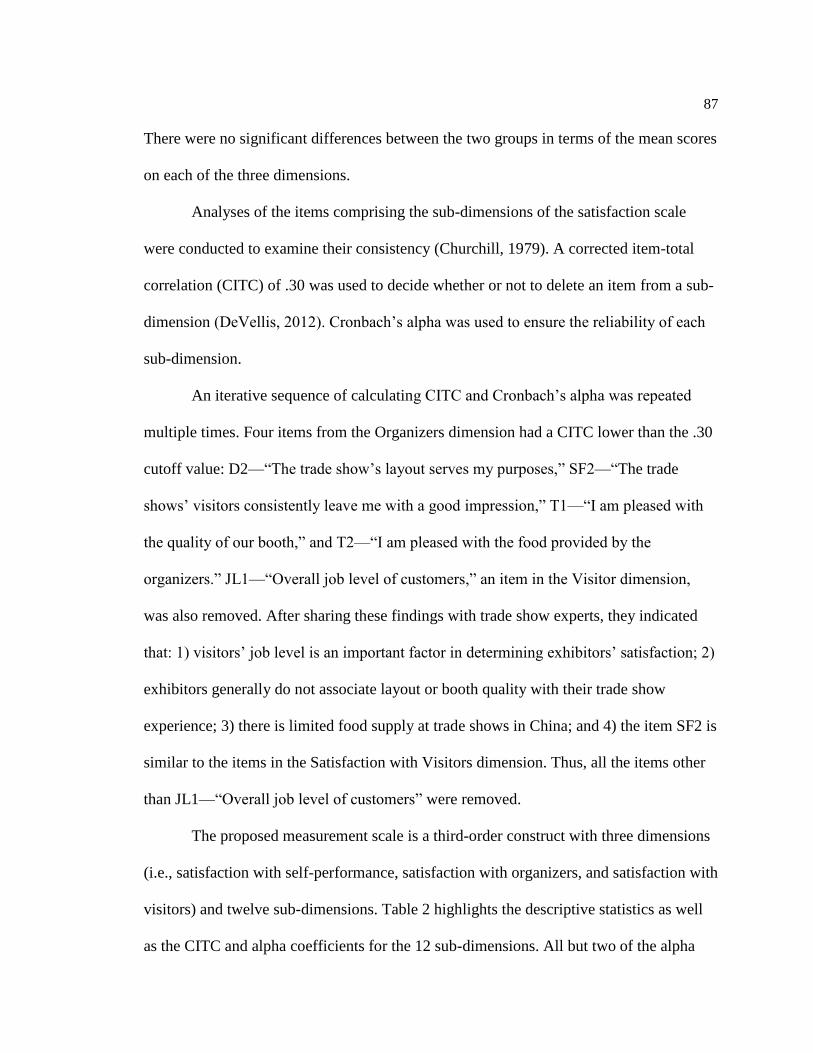
87
There were no significant differences between the two groups in terms of the mean scores
on each of the three dimensions.
Analyses of the items comprising the sub-dimensions of the satisfaction scale
were conducted to examine their consistency (Churchill, 1979). A corrected item-total
correlation (CITC) of .30 was used to decide whether or not to delete an item from a sub-
dimension (DeVellis, 2012). Cronbach’s alpha was used to ensure the reliability of each
sub-dimension.
An iterative sequence of calculating CITC and Cronbach’s alpha was repeated
multiple times. Four items from the Organizers dimension had a CITC lower than the .30
cutoff value: D2—“The trade show’s layout serves my purposes,” SF2—“The trade
shows’ visitors consistently leave me with a good impression,” T1—“I am pleased with
the quality of our booth,” and T2—“I am pleased with the food provided by the
organizers.” JL1—“Overall job level of customers,” an item in the Visitor dimension,
was also removed. After sharing these findings with trade show experts, they indicated
that: 1) visitors’ job level is an important factor in determining exhibitors’ satisfaction; 2)
exhibitors generally do not associate layout or booth quality with their trade show
experience; 3) there is limited food supply at trade shows in China; and 4) the item SF2 is
similar to the items in the Satisfaction with Visitors dimension. Thus, all the items other
than JL1—“Overall job level of customers” were removed.
The proposed measurement scale is a third-order construct with three dimensions
(i.e., satisfaction with self-performance, satisfaction with organizers, and satisfaction with
visitors) and twelve sub-dimensions. Table 2 highlights the descriptive statistics as well
as the CITC and alpha coefficients for the 12 sub-dimensions. All but two of the alpha
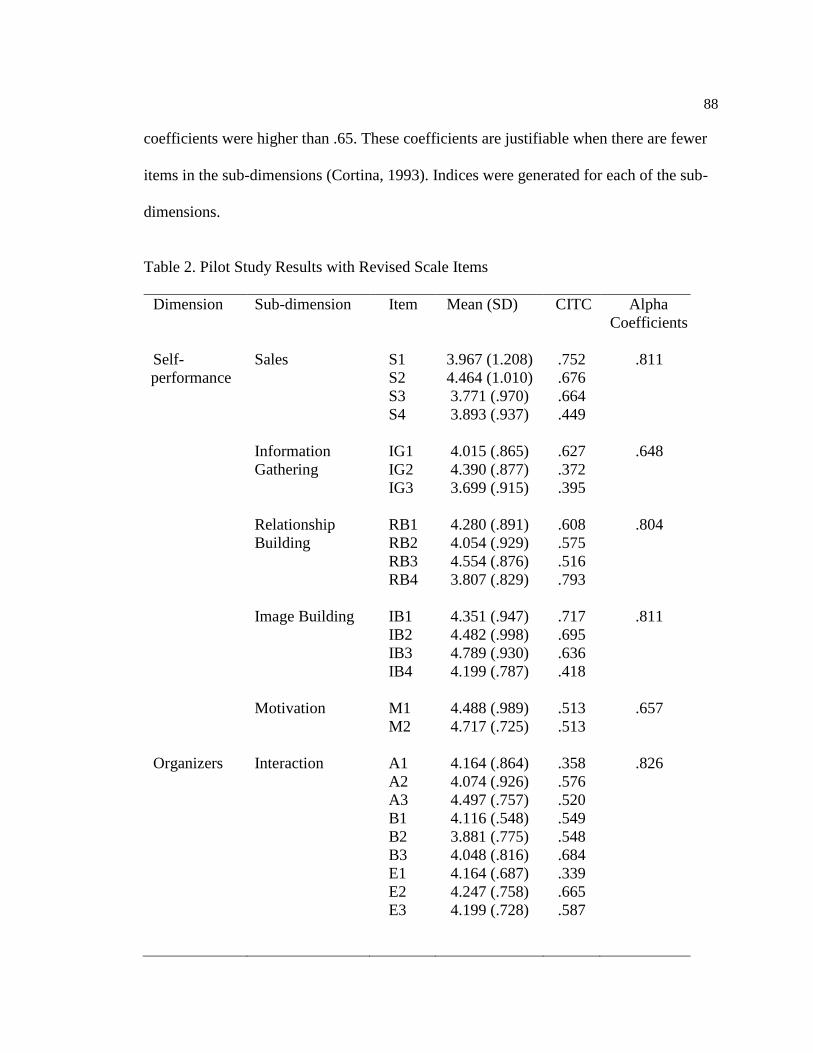
88
coefficients were higher than .65. These coefficients are justifiable when there are fewer
items in the sub-dimensions (Cortina, 1993). Indices were generated for each of the sub-
dimensions.
Table 2. Pilot Study Results with Revised Scale Items
Dimension Sub-dimension Item
Mean (SD) CITC Alpha
Coefficients
Self-
performance
Sales
S1
S2
S3
S4
3.967 (1.208)
4.464 (1.010)
3.771 (.970)
3.893 (.937)
.752
.676
.664
.449
.811
Information
Gathering
IG1
IG2
IG3
4.015 (.865)
4.390 (.877)
3.699 (.915)
.627
.372
.395
.648
Relationship
Building
RB1
RB2
RB3
RB4
4.280 (.891)
4.054 (.929)
4.554 (.876)
3.807 (.829)
.608
.575
.516
.793
.804
Image Building IB1
IB2
IB3
IB4
4.351 (.947)
4.482 (.998)
4.789 (.930)
4.199 (.787)
.717
.695
.636
.418
.811
Motivation M1
M2
4.488 (.989)
4.717 (.725)
.513
.513
.657
Organizers Interaction A1
A2
A3
4.164 (.864)
4.074 (.926)
4.497 (.757)
.358
.576
.520
.826
B1
B2
B3
4.116 (.548)
3.881 (.775)
4.048 (.816)
.549
.548
.684
E1
E2
E3
4.164 (.687)
4.247 (.758)
4.199 (.728)
.339
.665
.587
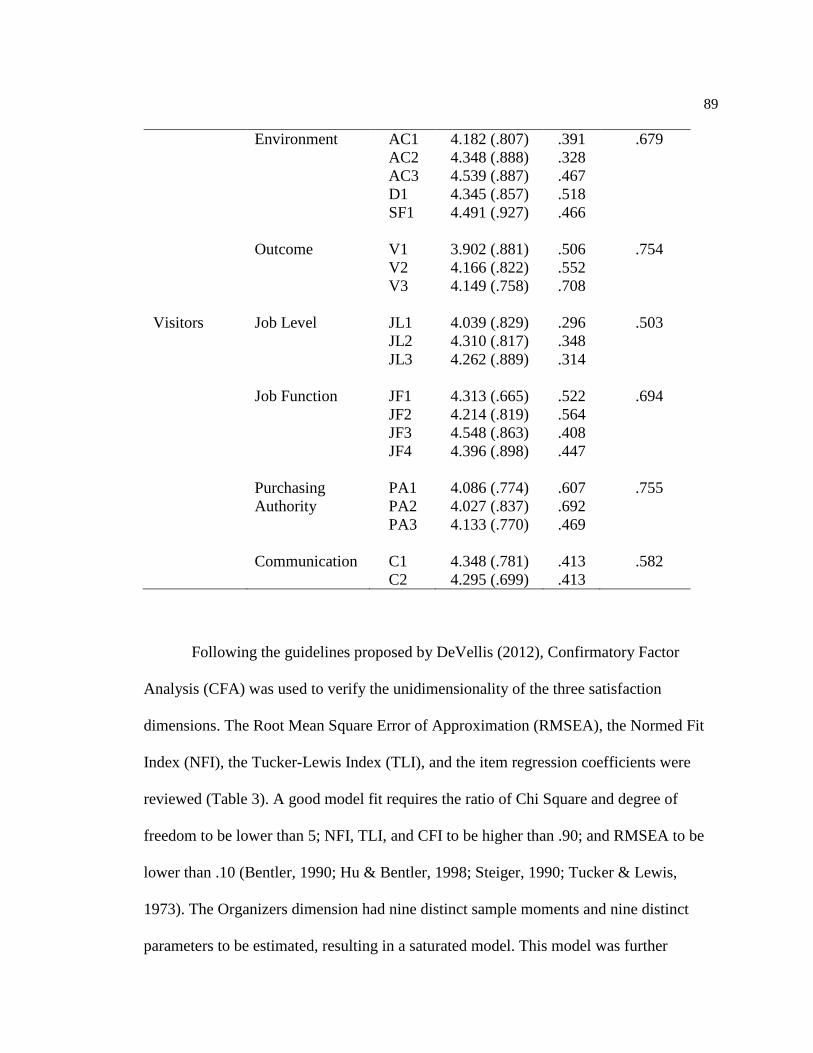
89
Environment AC1
AC2
AC3
4.182 (.807)
4.348 (.888)
4.539 (.887)
.391
.328
.467
.679
D1 4.345 (.857) .518
SF1
4.491 (.927) .466
Outcome V1
V2
V3
3.902 (.881)
4.166 (.822)
4.149 (.758)
.506
.552
.708
.754
Visitors Job Level JL1
JL2
JL3
4.039 (.829)
4.310 (.817)
4.262 (.889)
.296
.348
.314
.503
Job Function JF1
JF2
JF3
4.313 (.665)
4.214 (.819)
4.548 (.863)
.522
.564
.408
.694
JF4
4.396 (.898) .447
Purchasing
Authority
PA1
PA2
PA3
4.086 (.774)
4.027 (.837)
4.133 (.770)
.607
.692
.469
.755
Communication C1
C2
4.348 (.781)
4.295 (.699)
.413
.413
.582
Following the guidelines proposed by DeVellis (2012), Confirmatory Factor
Analysis (CFA) was used to verify the unidimensionality of the three satisfaction
dimensions. The Root Mean Square Error of Approximation (RMSEA), the Normed Fit
Index (NFI), the Tucker-Lewis Index (TLI), and the item regression coefficients were
reviewed (Table 3). A good model fit requires the ratio of Chi Square and degree of
freedom to be lower than 5; NFI, TLI, and CFI to be higher than .90; and RMSEA to be
lower than .10 (Bentler, 1990; Hu & Bentler, 1998; Steiger, 1990; Tucker & Lewis,
1973). The Organizers dimension had nine distinct sample moments and nine distinct
parameters to be estimated, resulting in a saturated model. This model was further
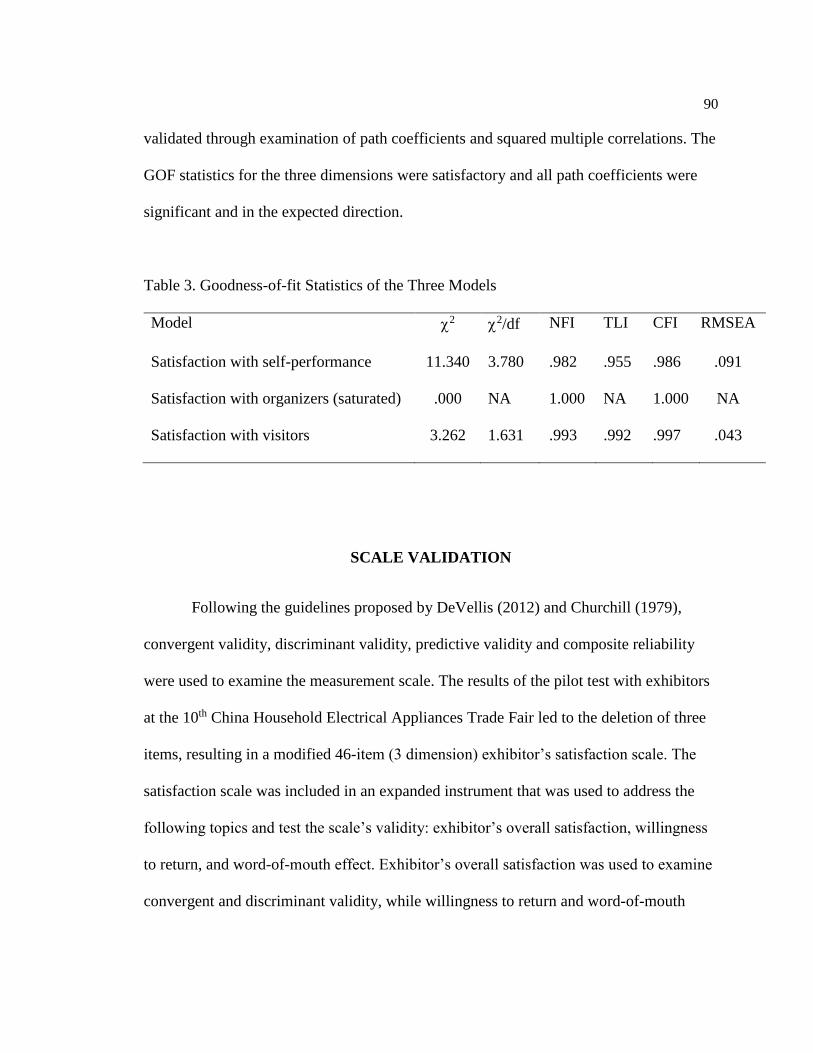
90
validated through examination of path coefficients and squared multiple correlations. The
GOF statistics for the three dimensions were satisfactory and all path coefficients were
significant and in the expected direction.
Table 3. Goodness-of-fit Statistics of the Three Models
Model 2 2/df NFI TLI CFI RMSEA
Satisfaction with self-performance 11.340 3.780 .982 .955 .986 .091
Satisfaction with organizers (saturated) .000 NA 1.000 NA 1.000 NA
Satisfaction with visitors 3.262 1.631 .993 .992 .997 .043
SCALE VALIDATION
Following the guidelines proposed by DeVellis (2012) and Churchill (1979),
convergent validity, discriminant validity, predictive validity and composite reliability
were used to examine the measurement scale. The results of the pilot test with exhibitors
at the 10th China Household Electrical Appliances Trade Fair led to the deletion of three
items, resulting in a modified 46-item (3 dimension) exhibitor’s satisfaction scale. The
satisfaction scale was included in an expanded instrument that was used to address the
following topics and test the scale’s validity: exhibitor’s overall satisfaction, willingness
to return, and word-of-mouth effect. Exhibitor’s overall satisfaction was used to examine
convergent and discriminant validity, while willingness to return and word-of-mouth
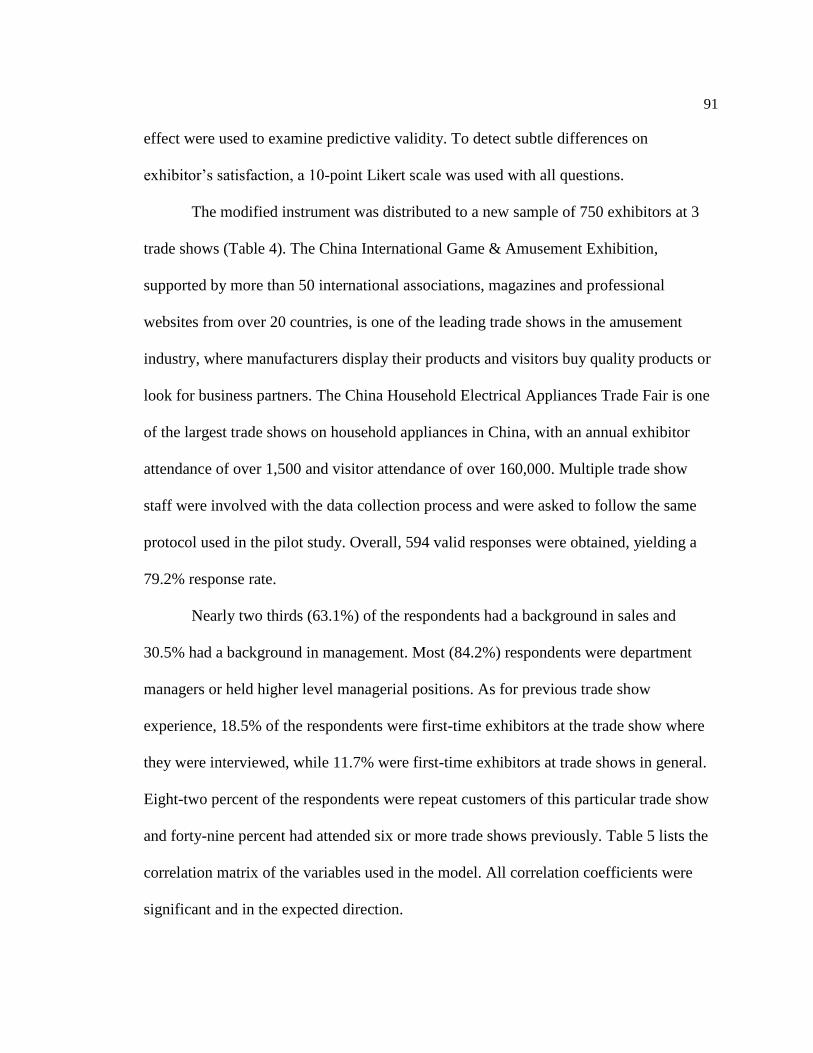
91
effect were used to examine predictive validity. To detect subtle differences on
exhibitor’s satisfaction, a 10-point Likert scale was used with all questions.
The modified instrument was distributed to a new sample of 750 exhibitors at 3
trade shows (Table 4). The China International Game & Amusement Exhibition,
supported by more than 50 international associations, magazines and professional
websites from over 20 countries, is one of the leading trade shows in the amusement
industry, where manufacturers display their products and visitors buy quality products or
look for business partners. The China Household Electrical Appliances Trade Fair is one
of the largest trade shows on household appliances in China, with an annual exhibitor
attendance of over 1,500 and visitor attendance of over 160,000. Multiple trade show
staff were involved with the data collection process and were asked to follow the same
protocol used in the pilot study. Overall, 594 valid responses were obtained, yielding a
79.2% response rate.
Nearly two thirds (63.1%) of the respondents had a background in sales and
30.5% had a background in management. Most (84.2%) respondents were department
managers or held higher level managerial positions. As for previous trade show
experience, 18.5% of the respondents were first-time exhibitors at the trade show where
they were interviewed, while 11.7% were first-time exhibitors at trade shows in general.
Eight-two percent of the respondents were repeat customers of this particular trade show
and forty-nine percent had attended six or more trade shows previously. Table 5 lists the
correlation matrix of the variables used in the model. All correlation coefficients were
significant and in the expected direction.
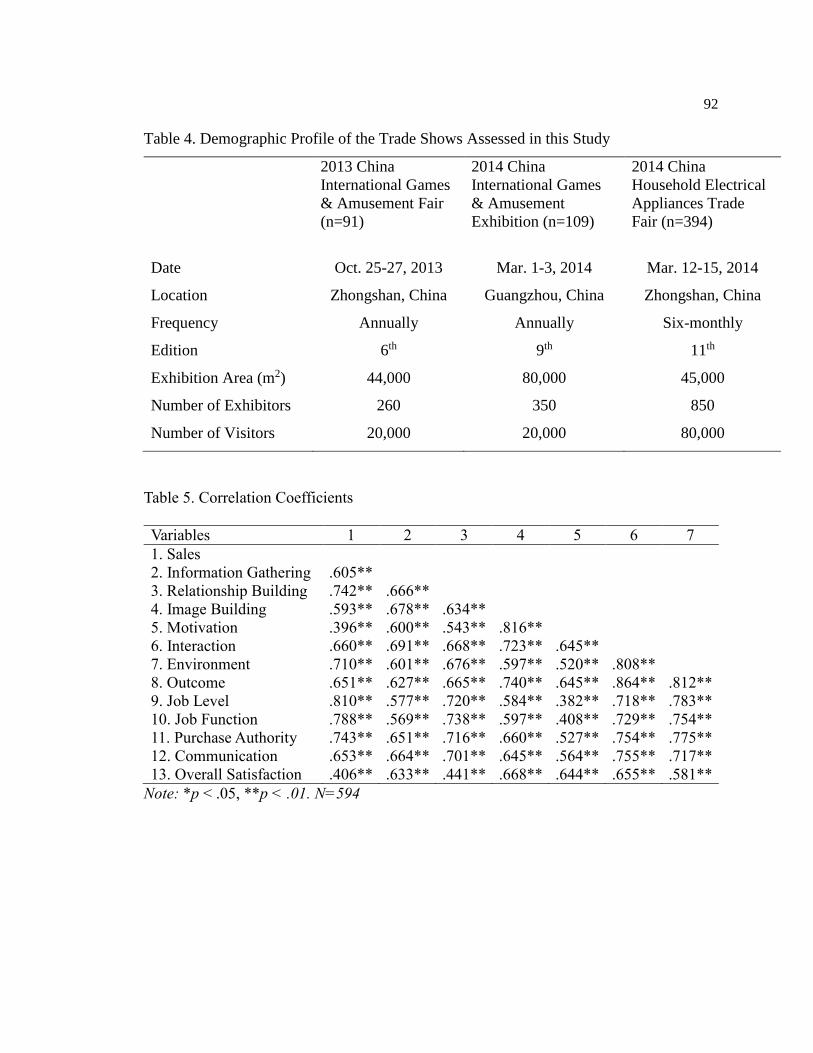
92
Table 4. Demographic Profile of the Trade Shows Assessed in this Study
2013 China
International Games
& Amusement Fair
(n=91)
2014 China
International Games
& Amusement
Exhibition (n=109)
2014 China
Household Electrical
Appliances Trade
Fair (n=394)
Date
Oct. 25-27, 2013
Mar. 1-3, 2014
Mar. 12-15, 2014
Location Zhongshan, China Guangzhou, China Zhongshan, China
Frequency Annually Annually Six-monthly
Edition 6th 9th 11th
Exhibition Area (m2) 44,000 80,000 45,000
Number of Exhibitors 260 350 850
Number of Visitors 20,000 20,000 80,000
Table 5. Correlation Coefficients
Variables 1 2 3 4 5 6 7
1. Sales
2. Information Gathering .605**
3. Relationship Building .742** .666**
4. Image Building .593** .678** .634**
5. Motivation .396** .600** .543** .816**
6. Interaction .660** .691** .668** .723** .645**
7. Environment .710** .601** .676** .597** .520** .808**
8. Outcome .651** .627** .665** .740** .645** .864** .812**
9. Job Level .810** .577** .720** .584** .382** .718** .783**
10. Job Function
11. Purchase Authority
12. Communication
13. Overall Satisfaction
.788**
.743**
.653**
.406**
.569**
.651**
.664**
.633**
.738**
.716**
.701**
.441**
.597**
.660**
.645**
.668**
.408**
.527**
.564**
.644**
.729**
.754**
.755**
.655**
.754**
.775**
.717**
.581**
Note: *p < .05, **p < .01. N=594
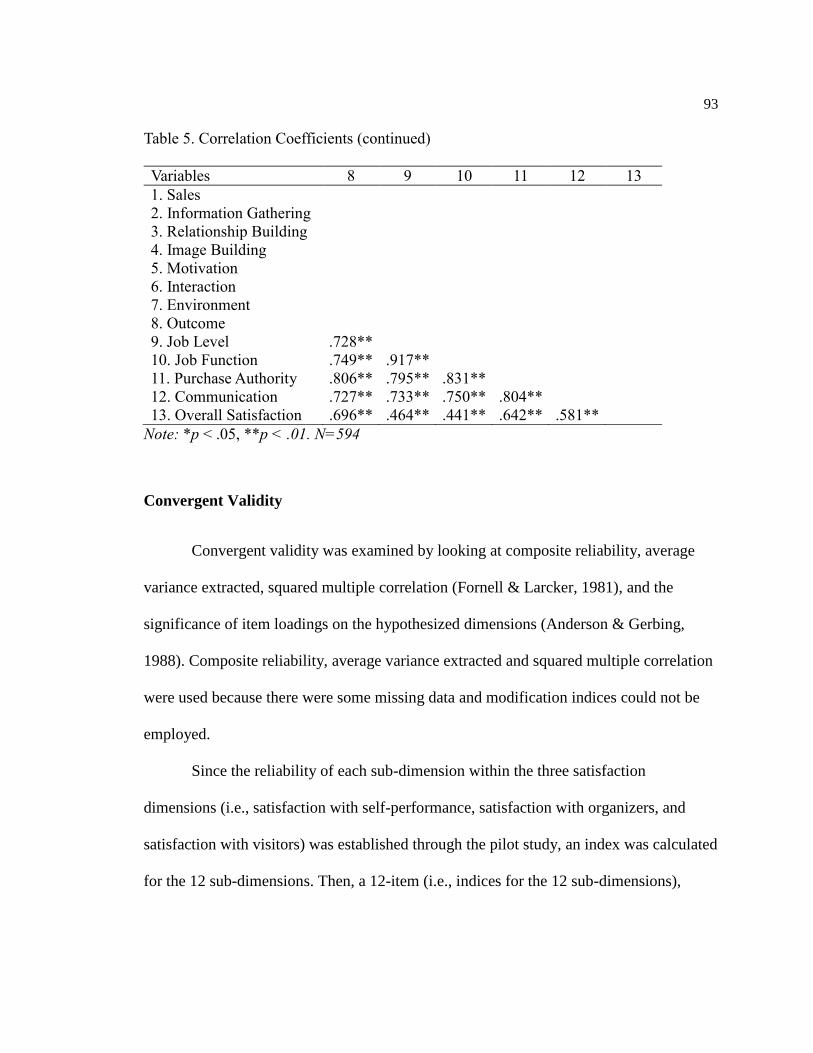
93
Table 5. Correlation Coefficients (continued)
Variables 8 9 10 11 12 13
1. Sales
2. Information Gathering
3. Relationship Building
4. Image Building
5. Motivation
6. Interaction
7. Environment
8. Outcome
9. Job Level .728**
10. Job Function
11. Purchase Authority
12. Communication
13. Overall Satisfaction
.749**
.806**
.727**
.696**
.917**
.795**
.733**
.464**
.831**
.750**
.441**
.804**
.642**
.581**
Note: *p < .05, **p < .01. N=594
Convergent Validity
Convergent validity was examined by looking at composite reliability, average
variance extracted, squared multiple correlation (Fornell & Larcker, 1981), and the
significance of item loadings on the hypothesized dimensions (Anderson & Gerbing,
1988). Composite reliability, average variance extracted and squared multiple correlation
were used because there were some missing data and modification indices could not be
employed.
Since the reliability of each sub-dimension within the three satisfaction
dimensions (i.e., satisfaction with self-performance, satisfaction with organizers, and
satisfaction with visitors) was established through the pilot study, an index was calculated
for the 12 sub-dimensions. Then, a 12-item (i.e., indices for the 12 sub-dimensions),
94
three-dimensional (i.e., 3 satisfaction dimensions) confirmatory factor model was
conducted.
To establish convergent validity, the following conditions must be met: 1) all item
loadings need to be statistically significant; 2) composite reliability needs to be higher
than .70; 3) average variance extracted needs to be higher than .50; 4) and squared
multiple correlation needs to be higher than .50 (Bagozzi & Yi, 1988; Fornell & Larcker,
1981). The results indicated that all item loadings were statistically significant (p < .001)
and the goodness-of-fit statistics for the model were satisfactory (2 (58) = 301.589, p =
.000, CFI = .968, TLI = .950, RMSEA = .086). Composite reliabilities for the three
dimensions exceeded the cutoff value of .70. Average variance extracted and squared
multiple correlation both exceeded the cutoff value of .50. The relevant statistics are
presented in Table 6. Overall, the results established the convergent validity of the
measurement scale.
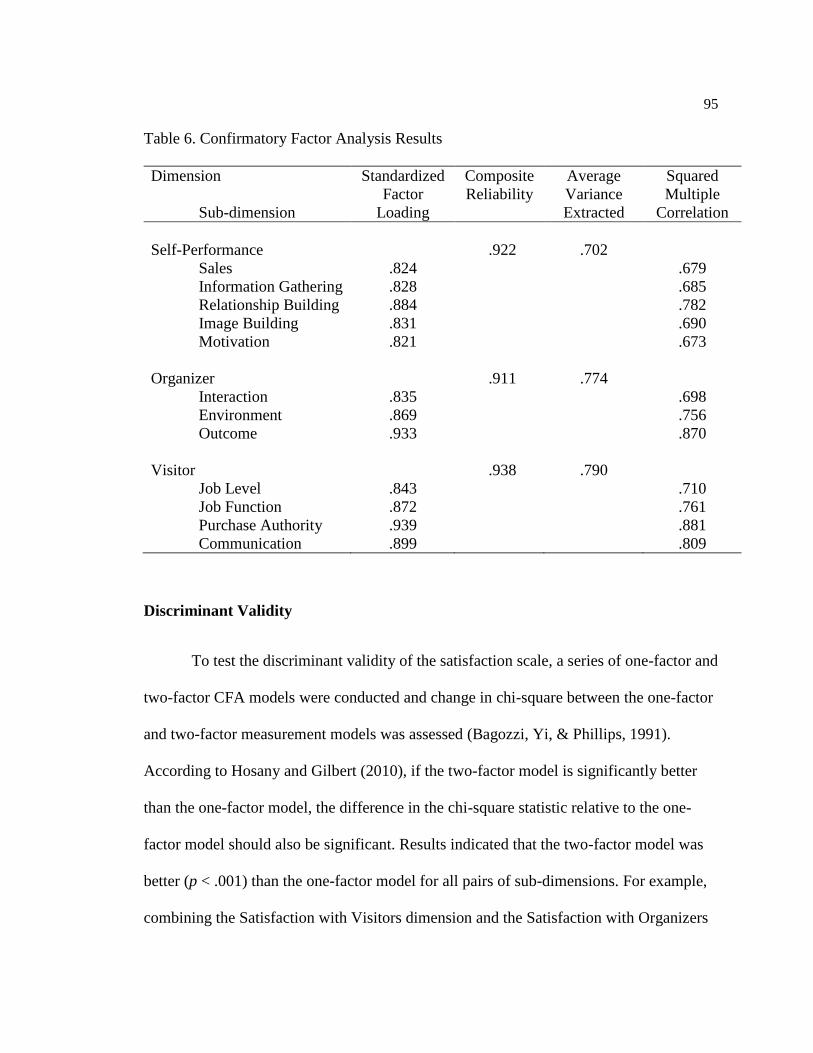
95
Table 6. Confirmatory Factor Analysis Results
Dimension
Sub-dimension
Standardized
Factor
Loading
Composite
Reliability
Average
Variance
Extracted
Squared
Multiple
Correlation
Self-Performance
Sales
Information Gathering
Relationship Building
Image Building
Motivation
.824
.828
.884
.831
.821
.922
.702
.679
.685
.782
.690
.673
Organizer
Interaction
Environment
Outcome
.835
.869
.933
.911
.774
.698
.756
.870
Visitor
Job Level
Job Function
Purchase Authority
Communication
.843
.872
.939
.899
.938
.790
.710
.761
.881
.809
Discriminant Validity
To test the discriminant validity of the satisfaction scale, a series of one-factor and
two-factor CFA models were conducted and change in chi-square between the one-factor
and two-factor measurement models was assessed (Bagozzi, Yi, & Phillips, 1991).
According to Hosany and Gilbert (2010), if the two-factor model is significantly better
than the one-factor model, the difference in the chi-square statistic relative to the one-
factor model should also be significant. Results indicated that the two-factor model was
better (p < .001) than the one-factor model for all pairs of sub-dimensions. For example,
combining the Satisfaction with Visitors dimension and the Satisfaction with Organizers
96
dimension into a single factor produced a significantly worse fit (2 (32) = 441.012, p <
.001, CFI= .914, TLI= .852, RMSEA = .150) than a two-factor model (2 (28) = 178.220,
p < .001, CFI= .968, TLI= .938, RMSEA = .097). The chi-square difference test also
indicated that the two-factor model was superior to the one-factor model. Thus, these
results established the discriminant validity of the measurement scale.
Predictive Validity
Predictive validity is defined as the ability of the scale to estimate an outcome
variable that is external to the measurement instrument itself (Nunnally & Bernstein,
1994). Researchers have shown that customer satisfaction can lead to positive word-of-
mouth (Zhang et al., 2010) and intention to return (Bowen & Chen, 2001; Jung, 2005).
Thus, to establish the predictive validity of the scale, the endogenous latent variable—
positive behavioral intention—and two observed variables—word-of-mouth and
willingness to return—were added to the structural equation model with the three
dimensions of exhibitor’s satisfaction and overall satisfaction. For willingness to return,
exhibitors were asked whether or not they would return to the same trade show next year.
For word-of-mouth effect, exhibitors were asked whether or not they would recommend
the trade show to their colleagues and other companies. Both variables were measured
using a 10-point Likert scale (1 = least likely; 10 = most likely). A path from overall
satisfaction to behavioral intention was drawn to test the predictive power of the
proposed model.
97
Standardized path coefficients and squared multiple correlations were examined
to establish the predictive validity of the scale. The goodness-of-fit of the model turned
out to be satisfactory (2 (83) = 452.126, p < .001, CFI= .960, TLI= .942, RMSEA =
.088). All path coefficients were statistically significant (p <.01) and the squared multiple
correlation for the positive behavioral intention was .741, which means that 74.1% of the
variance in positive behavioral intention could be explained by the three satisfaction
dimensions. Thus, the predictive validity of the measurement scale was established.
DISCUSSION AND IMPLICATIONS
The objectives of this study were to construct a valid and reliable exhibitor
satisfaction scale that accounts for the three stakeholders in the trade show industry.
Following a review of the literature, a VEO framework was proposed to account for the
three key stakeholders in the trade show industry. Based on the VEO framework and the
scale development procedure recommended by DeVellis (2012) and Churchill (1979), an
exhibitor satisfaction scale was successfully constructed and validated. The final scale
consisted of 46-items that represented 12 sub-dimensions and 3 dimensions of
satisfaction. Reliability, unidimensionality, content validity, construct validity,
discriminant validity, and predictive validity of the scale were tested and established
using 594 responses from 3 trade shows in China. The goodness-of-fit indices indicated a
satisfactory fit for the proposed scale.
A major contribution of this study is that it introduces a new approach to
measuring satisfaction in the trade show industry. Previous measures focused on one
98
specific stakeholder and ignored the interactions taking place with other stakeholders
(Godar & O’Connor, 2001; Jin et al., 2012). This approach was problematic because it
failed to capture the significant impacts of all three key stakeholders. No matter how
many sales leads exhibitors get during a trade show, if their booths are damaged due to
organizers’ negligence, they might not be satisfied with their overall experience and
might choose to skip the trade show the next year. Similarly, visitors might enjoy the
most meticulous service from the organizer, but if they did not meet enough exhibitors,
the whole experience would be considered unsatisfactory, leading to negative word-of-
mouth.
The results of this study showed that all three dimensions of exhibitor’s
satisfaction (i.e., self, visitor, and organizer) contributed significantly to overall
satisfaction. Predictive validity statistics showed that all of the standardized path
coefficients from the three dimensions to overall satisfaction were significant and that a
sizeable percentage of variance in overall satisfaction (67.6%) and positive behavioral
intention (74.1%) was explained by the three-dimension model. These results indicated
that overall satisfaction and positive behavioral intention are better explained when all
three stakeholders are taken into account.
In line with previous research on trade show service quality (Brady & Cronin,
2001; Gottlieb et al., 2011), three sub-dimensions of satisfaction with organizers (i.e.,
interaction, environment, and outcome) contributed significantly to overall satisfaction
with standardized loadings ranging from .836 to .934. However, it is not sufficient to only
look at service quality when evaluating exhibitor’s overall satisfaction. Exhibitor’s
satisfaction with self-performance contributed significantly to their overall satisfaction as
99
well. The five sub-dimensions of self-performance (i.e., sales, information gathering,
image building, relationship building, and motivation) turned out to be quite significant,
with standardized loadings ranging from .821 to .884, further validating Hansen’s (2004)
five-dimension framework on trade show performance. The four sub-dimensions of
satisfaction with visitors also were statistically significant, with standardized loadings
ranging from .843 to .940. Consistent with previous research, visitors’ job level, job
function, purchase power, and communication all contributed significantly to exhibitor’s
overall satisfaction (Bello, 1992; Rosson & Seringhaus, 1995). It turned out that job level
was a significant item within exhibitor’s satisfaction with visitors, which was consistent
with previous literature (Bello, 1992). Thus, maintaining it in the scale proved to be a
good decision.
MANAGERIAL IMPLICATIONS
With increased competition trade show organizers will have to differentiate
themselves by offering user-oriented services (Berne & García-Uceda, 2008). However,
information about what makes an effective trade show and what contributes to visitors
and exhibitors satisfaction remains limited (Gottlieb et al., 2011). Few researchers have
analyzed trade show evaluation systematically from the organizer’s perspective. With this
study, this situation is changing. Trade show organizers can use the exhibitor satisfaction
scale constructed and validated in this study to evaluate their trade shows. This is of
immense value as a primary objective of trade show organizers is to create effective
shows that result in positive outcomes for both exhibitors and visitors.
100
Trade show organizers can use the measurement scale to detect the relative
importance of each dimension, sub-dimension, and items within each sub-dimension.
Once the organizers know which items carry the most weight in their particular trade
show, they can allocate their limited resources to improve upon or address problems
associated with the items. In addition, trade show organizers could customize the
measurement scale to fit their particular trade show. Since trade show exhibitors are
mostly executives with limited time to spare, organizers could use a scale consisting of
the 12 sub-dimensions rather than the full model with 46 items. Analysis of data at
different levels would allow the flexibility of general versus detailed evaluation.
LIMITATIONS AND FUTURE RESEARCH
Visitors, exhibitors, and organizers are the three key stakeholders in the trade
show industry. However, there are other stakeholders that might influence the satisfaction
level of exhibitors and their positive behavioral intention. For example, the host city and
members of the local community could impact exhibitor’s trade show participation
experience (Oppermann & Chon, 1997). Zhang, Leung, and Qu (2007) pointed out that
attractiveness (e.g., friendliness of local people, sightseeing opportunity) and accessibility
(e.g., distance of the trip, availability of direct flight) of the convention destination are
important in attracting exhibitors. Thus, future studies should integrate other stakeholders
into the conceptual framework and develop a modified exhibitor satisfaction scale that
accounts for four or more stakeholders in the trade show industry. It would also be
interesting to investigate the dynamic impact of stakeholders on one another.
101
Second, this study only focused on exhibitors’ satisfaction. It is expected that the
VEO conceptual framework will be successful with visitors as well. Based on the VEO
framework, visitor’s satisfaction consists of three dimensions: visitor’s satisfaction with
self-performance, exhibitors, and organizers. To further validate the VEO framework,
future studies should focus on visitor’s satisfaction. Based on the results of this study, it
is expected that the three dimensions would contribute significantly to visitor’s overall
satisfaction and positive behavioral intention.
Third, to further establish the predictive validity of the scale, actual behavior,
instead of positive behavioral intention, should be measured. Previous findings have
shown that the strength of correlation between positive behavioral intention to actual
behavior ranges between .41 and .53 (O’Keefe, 2002). Temporal stability of intention
(Ajzen & Fishbein, 1977) and the degree to which the behavior was planned (Sheeran,
Orbell, & Trafimow, 1999) are known to influence the conversion rate from intention to
behavior. Most trade shows are held annually and these factors could well come into play
during that one year gap. Exhibitors could change their minds even if they indicated that
they would be coming back next year. Thus, adopting a longitudinal design by collecting
data on both positive behavioral intention and actual behavior could strengthen the
predictive validity of the measurement scale and provide additional insight into
exhibitor’s satisfaction and decision-making.
Fourth, trade show practices tend to vary across different market environments
(Dekimpe et al., 1997). In this study data were collected from trade shows for the
household electronics industry and the game and amusement equipment industry, all of
which were held in China. Future research should cross validate the VEO conceptual
102
framework and the measurement scale using trade shows from other industries and other
geographic locations.
In conclusion, this study contributes to the satisfaction literature by building upon
stakeholder theory and introducing a valid and reliable satisfaction measurement scale
that is readily available for use in trade show and event settings.
103
REFERENCES
Anderson, E, Fornell, C., & Lehmann, D. (1994). Customer satisfaction, market share,
and profitability: Findings from Sweden. Journal of Marketing, 58(3), 53–66.
Anderson, J. C., & Gerbing, D. W. (1988). Structural equation modeling in practice: A
review and recommended two-step approach. Psychological Bulletin, 103(3), 411-
423.
Ajzen, I., & Fishbein, M. (1977). Attitude-Behavior relations: A theoretical analysis and
review of empirical research. Psychological Bulletin, 84(5), 888–918.
Axelsson, B., & Easton, G. (1992). Industrial networks: A new view of reality. London:
Routledge.
Bagozzi, R. P., & Yi, Y. (1988). On the evaluation of structural equation models.
Journal of the Academy of Marketing Science, 16(1), 74-94.
Bagozzi, R. P., Yi, Y., & Phillips, L. W. (1991). Assessing construct validity in
organizational research. Administrative Science Quarterly, 36(3), 421-458.
Bello, D. C. (1992). Industrial buyer behavior at trade shows: Implications for selling
effectiveness. Journal of Business Research, 25(1), 59-80.
Bello, D. C., & Lohtia, R. (1993). Improving trade show effectiveness by analyzing
attendees. Industrial Marketing Management, 22(4), 311-318.
Bentler, P. M. (1990). Comparative fit indexes in structural models. Psychological
Bulletin, 107(2), 238–246.
Berne, C., & García-Uceda, M. (2008). Criteria involved in evaluation of trade shows to
visit. Industrial Marketing Management, 37(5), 565-579.
104
Blythe, J. (2002). Using trade fairs in key account management. Industrial Marketing
Management, 31(7), 627-635.
Borghini, S., Golfetto, F., & Rinallo, D. (2006). Ongoing search among industrial
buyers. Journal of Business Research, 59(10-11), 1151-1159.
Bowen, J. T., & Chen, S. L. (2001). The relationship between customer loyalty and
customer satisfaction. International Journal of Contemporary Hospitality
Management, 13(5), 213–217.
Brady, M. K. & Cronin, J. J. (2001). Some new thoughts on conceptualizing perceived
service quality: A hierarchical approach. Journal of Marketing, 65(3), 34-49.
Bruhn, M., & Hadwich, K. (2005). Managing the service quality of trade fairs. In M.
Kirchgeorg (Ed.), Trade show management: Planning, implementing and controlling
of trade shows, conventions and events (pp. 787-821). Gabler Verlag.
Cavanaugh S. (1976). Setting objectives and evaluating the effectiveness of trade show
exhibits. Journal of Marking, 40(4), 100–103.
Churchill, G. A. (1979). A paradigm for developing better measures of marketing
constructs. Journal of Marking Research, 16(1), 64–77.
Cortina, J. M. (1993). What is coefficient alpha? An examination of theory and
applications. Journal of Applied Psychology, 78(1), 98–104.
Dekimpe, M., François, P., Gopalakrishna, S., Lilien, G., & van den Bulte, C. (1997).
Generalizing about trade show effectiveness: A cross-national comparison. Journal
of Marketing, 61(4), 55-64.
DeVellis, R. F. (2012). Scale development: Theory and applications. Thousand Oaks,
Calif: SAGE.
105
Freeman, R. (1984). Strategic management: A stakeholder’s approach. Boston, MA:
Pitman.
Freeman, R. & McVea, J. (2001). A stakeholder approach to strategic management, in
Hitt, M., Freeman, R. & Harrison, J. (Eds), The Blackwell Handbook of Strategic
Management. Oxford: Blackwell Business, 189-207.
Ford, D. (1990). Understanding business markets: Interaction, relationships, and
networks. London: Academic Press.
Fornell, C., & Larcker, D. F. (1981). Evaluating structural equation models with
unobservable variables and measurement error. Journal of Marketing Research,
18(1), 39-50.
Godar, S., & O’Connor, P. (2001). Same time next year – Buyer trade show motives.
Industrial Marketing Management, 30(1), 77-86.
Gopalakrishna, S., & Lilien, G. (1995). A three-stage model of industrial trade show
performance. Marketing Science, 14(1), 22-42.
Gopalakrishna, S., Roster, C. A., & Sridhar, S. (2010). An exploratory study of attendee
activities at a business trade show. Journal of Business & Industrial Marketing,
25(4), 241-248.
Gottlieb, U. R., Brown, M. R., & Drennan, J. (2011). The influence of service quality
and trade show effectiveness on post-show purchase intention. European Journal of
Marketing, 45(11/12), 1642-1659.
Hansen, K. (2004). Measuring performance at trade shows: Scale development and
validation. Journal of Business Research, 57(1), 1-13.
106
Hansen, K. (1999). Trade show performance: A conceptual framework and its
implications for future research. Academy of Marketing Science Review, 8, 1–21.
Herbig, P., O’Hara, B., & Palumbo, F. (1997). Differences between trade show exhibitors
and non-exhibitors. Journal of Business & Industrial Marketing, 12(6), 368-382.
Hosany, S. & Gilbert, D. (2010). Measuring tourists’ emotional experiences toward
hedonic holiday destinations. Journal of Travel Research, 49(4), 13-526.
Hu, L., & Bentler, P. M. (1998). Fit indices in covariance structure modeling: Sensitivity
to underparameterized model misspecification. Psychological Methods, 3(4), 424–
453.
Jin, X., & Weber, K. (2013). Developing and testing a model of exhibition brand
preference: The exhibitors’ perspective. Tourism Management, 38, 94-104.
Jin, X., Weber, K., & Bauer, T. (2012). Relationship quality between exhibitors and
organizers: A perspective from Mainland China’s exhibition industry. International
Journal of Hospitality Management, 31(4), 1222-1234.
Jung, M. (2005). Determinants of exhibition service quality as perceived by attendees.
Journal of Convention & Event Tourism, 7(3-4), 85-98.
Kang, J., & Schrier, T. (2011). The decision-making process of tradeshow exhibitors:
The effects of social value, company size, and prior experience on satisfaction and
behavioral intentions. Journal of Convention & Event Tourism, 12(2), 65-85.
Kerin, R., & Cron, W. (1987). Assessing trade show functions and performance: An
exploratory study. Journal of Marketing, 51(3), 87-94.
Konopacki, A. (1996). Tricks of the trade show. Marketing News, 30(3), 3-4.
107
Lee, J., & Back, K. (2009). Examining the effect of self-image congruence, relative to
education and networking, on conference evaluation through its competing models
and moderating effect. Journal of Convention & Event Tourism, 10(4), 256-275.
Lee, J. & Beeler, C. (2009). An investigation of predictors of satisfaction and future
intention: Links to motivation, involvement, and service quality in a local festival.
Event Management, 13(1), 17-29.
Lee, M. J., Yeung, S., Dewald, B. (2010). An exploratory study examining the
determinant of attendance motivations as perceived by attendees at Hong Kong
Exhibitions. Journal of Convention & Event Tourism, 11(3), 195-208.
Lin, Y. (2011). An exploratory study of organizer-oriented post-show evaluation. Peking
University Cultural Industries Review, 3, 276-303.
Mainardes, E. W., Alves, H., & Raposo, M. (2011). Stakeholder theory: Issues to
resolve. Management Decision, 49(2), 226-252.
Munuera, J., & Ruiz, S. (1999). Trade fairs as services: A look at visitors’ objectives in
Spain. Journal of Business Research, 44(1), 17-24.
Nunnally, J. C., & Bernstein, I. H. (1994). Psychometric theory (3rd ed.). New York:
McGraw-Hill.
Oh, H. (2000). Diners’ perception of quality, value, and satisfaction: A practical
viewpoint. Cornell Hotel and Restaurant Administration Quarterly, 41(3), 58–66.
O'Hara, B. S., & Herbig, P. A. (1993). Trade shows: What do the exhibitors think? A
personal selling perspective. Journal of Business & Industrial Marketing, 8(4), 18-
25.
108
O’Keefe, D. J. (2002). Persuasion: Theory and research (2nd ed.). Thousand Oaks, CA:
Sage.
Oppermann, M., & Chon, K. S. (1997). Convention participation decision-making
process. Annals of Tourism Research, 24(1), 178–191.
Pearlman, D. M., & Mollere, L. (2009). Meetings, incentive, convention, and exhibition
evaluation practices: An exploratory study among destination marketing
organizations. Journal of Convention and Event Tourism, 10(3), 147-165.
Polonsky, M. (1996). Stakeholder management and the stakeholder matrix: Potential
strategic marketing tools. Journal of Marketing-Focused Management, 1(1), 209-
229.
Reinhold, M., Reinhold, S., & Schmitz, C. (2010). Exhibitor satisfaction in business-to-
business trade shows: Understanding performance patterns from Vavra’s
Importance Grid perspective. In EMAC 2010. Brüssel: European Marketing
Academy.
Rosson, P. J., & Seringhaus, F. H. R. (1995). Visitor and exhibitor interaction at
industrial trade fairs. Journal of Business Research, 32(1), 81-90.
Rust, R. T., & R. L. Oliver. (1994). Service quality: New directions in theory and
practice. Thousand Oaks, CA: Sage Publications.
Sashi, M., & Perretty, J. (1992). Do trade shows provide value? Industrial Marketing
Management, 21(3), 249–255.
Seringhaus, F., & Rosson, P. (2004, October). An analysis model for performance
measurement of international trade fair exhibitors. Retrieved from
http://citt.management.dal.ca/Files/pdf’s/DP-198.pdf
109
Servert, D., Wang, Y., Chen, P. J., & Breiter, D. (2007). Examining the motivation,
perceived performance, and behavioral intentions of convention attendees: Evidence
from a regional conference. Tourism Management, 28(2), 399–408.
Sheeran, P., Orbell, S., & Trafimow, D. (1999). Does the temporal stability of
behavioral intentions moderate intention-behavior and past behavior-future behavior
relations? Personality and Social Psychology Bulletin, 25(6), 721-730.
Steiger, J. H. (1990). Structural model evaluation and modification: An interval
estimation approach. Multivariate Behavioral Research, 25(2), 173–180.
Stoeck, N., & Schraudy, K. (2005). From trade show company to integrated
communication service provider. In: Kirchgeorg, M. (Ed.), Trade Show
Management: Planning, Implementing and Controlling of Trade Shows,
Conventions and Events. Gabler, Wiesbaden, pp. 199–210.
Tanner, J. F., & Chonko, L. B. (1995). Trade show objectives, management, and staffing
practices. Industrial Marketing Management, 24(4), 257-264.
Tucker, L. R., & Lewis, C. (1973). A reliability coefficient for maximum likelihood
factor analysis. Psychometrika, 38(1), 1–10.
Williams, J. D., Gopalakrishna, S., & Cox, J., M. (1993). Trade show guidelines for
smaller firms. Industrial Marketing Management, 22(4), 265-75.
Zhang, H. Q., Leung, V., & Qu, H. (2007). A refined model of factors affecting
convention participation decision-making. Tourism Management, 28(4), 1123-1127.
Zhang, L., Qu, H., & Ma, J. (2010). Examining the relationship of exhibition attendees’
satisfaction and expenditure: The case of two major exhibitions in China. Journal of
Convention & Event Tourism, 11(2), 100-118.
110
Chapter 4
Chapter 4 was written as an independent manuscript for submission to the peer-
reviewed Journal of Convention & Event Tourism. It was formatted per the specifications
of the journal. Based on the measurement instrument developed in Chapter 3, this
manuscript intends to examine the effects of the three dimensions (i.e., satisfaction with
self-performance, satisfaction with organizers, and satisfaction with visitors) on
exhibitors’ positive behavioral intention.
Applying stakeholder theory in the trade show industry, this study used a 46-item
measurement scale on exhibitors’ satisfaction to predict positive behavioral intention.
Three dimensions were proposed to account for three key stakeholders in the trade show
industry: visitors, exhibitors, and organizers. Using data from 594 exhibitors at 3 trade
shows, it was found that satisfaction with self-performance, satisfaction with organizers,
and satisfaction with visitors are significantly and positively related to exhibitors’
positive behavioral intention. Satisfaction with organizers turned out to be the dominant
predictor and the three dimensions in combination explained approximately two thirds of
the variance in exhibitors’ positive behavioral intention.
111
Chapter 4 An Exploratory Study on Determinants of
Exhibitors’ Behavioral Intention
Introduction
Companies spend a substantial portion of their marketing budget exhibiting at
trade shows. In 2006, trade shows surpassed print as the largest source of Business-to
Business (B2B) media and information industry revenues (American Business Media,
2007). More recently, trade shows were responsible for nearly one-half of B2B media
and information industry revenues (American Business Media, 2013). Along with the
jump in expenditures, there has been a substantial increase in infrastructure development
for and the number of trade shows in the past few decades (Jin & Weber, 2013). In order
to compete in this burgeoning market, organizers—the main propeller of the trade show
industry—need to identify the key factors that attract new exhibitors as well as the factors
that retain existing exhibitors (Lee & Beeler, 2009). Hence, it is crucial for trade show
organizers to know about the key dimensions that influence the behavioral intention of
their exhibitors (Hutchinson, Wellington, Saad, & Cox, 2011).
The main objective of trade show organizers is to put on an effective trade show
that results in positive outcomes for both exhibitors and visitors (Gottlieb, Brown, &
Drennan, 2011). However, previous research on what constitutes an effective trade show
has been fragmented (Seringhaus & Rosson, 2004) and fails to acknowledge the various
stakeholders in the trade show industry (Jin, Weber, & Bauer, 2012). According to
stakeholder theory, businesses must account for their relationships with the key
112
stakeholders in their external environment and examine the characteristics of these
stakeholders to improve business performance (Freeman, 1984; Mainardes, Alves, &
Raposo, 2011). To study trade shows, researchers must recognize that three primary
stakeholders are involved in trade shows: visitors, exhibitors, and organizers (Bruhn &
Hadwich, 2005). Organizers establish the trade show and market it to potential exhibitors
and visitors (Jung, 2005). Exhibitors exhibit at trade shows to enhance sales, improve
their public image, network, and motivate employees (Friedman, 2009; Whitfield &
Webber, 2011). Visitors are the customers of both organizers and exhibitors and they
attend trade shows to gather information about the market, meet potential suppliers, and
make alternative purchases (Godar & O’Connor, 2001; Munuera & Ruiz, 1999).
Although the three key stakeholders have been studied previously, (a) they have
not been studied simultaneously and (b) the factors (i.e., self-performance, organizers,
and visitors) that theoretically lead to exhibitors’ positive behavioral intention have not
been simultaneously addressed. The majority of previous studies on exhibitors’
behavioral intention has focused on their self-performance (e.g., Dekimpe, François,
Gopalakrishna, Lilien, & van den Bulte, 1997; Gopalakrishna & Lilien, 1995; Hansen,
2004). The premise of these studies is that exhibitors participate in trade shows to make
sales, get leads, build their reputation, and more (Sashi & Perretty, 1992). Reason would
indicate that the degree to which these self-performance goals are achieved would affect
exhibitors’ positive behavioral intention. Since most of these goals are associated with
visitors, researchers have also addressed the exhibitors’ perception of visitors’ impact
(Borghini, Golfetto, & Rinallo, 2006; Li, 2007). Findings suggest that exhibitors perceive
113
a successful exhibit to involve demonstration, presentation and interaction with visitors
(Seringhaus & Rosson, 2004).
In recent years researchers have realized that trade shows are about more than
exhibitors and visitors and started to study the impacts of organizers on exhibitors’
satisfaction and positive behavioral intention (e.g., Gottlieb et al., 2011; Jin & Weber,
2013). For example, Jin et al. (2012) found that exhibitors’ perception of the quality of
service offered by organizers is critical for the successful and sustainable development of
trade shows. Thus, satisfaction with organizers is likely an indispensable factor in
determining exhibitors’ positive behavioral intention.
While researchers have studied individual factors that affect positive behavioral
intention or other outcomes of exhibiting at trade shows, none have assessed self-
performance, organizers, and visitors simultaneously and examined their relative
importance when studying exhibitors’ positive behavioral intention. Thus, the purpose of
this study is twofold. First, drawing from the literature on key stakeholders in the trade
show industry (i.e., visitors, exhibitors, and organizers), three determinants of exhibitors’
positive behavioral intention are proposed. Satisfaction with self-performance,
satisfaction with organizers, and satisfaction with visitors are all expected to contribute
significantly to exhibitors’ positive behavioral intention (Figure 1). Second, using survey
data from 594 exhibitors at 3 international trade shows held in China, the proposed model
was tested and 3 hypotheses were examined.
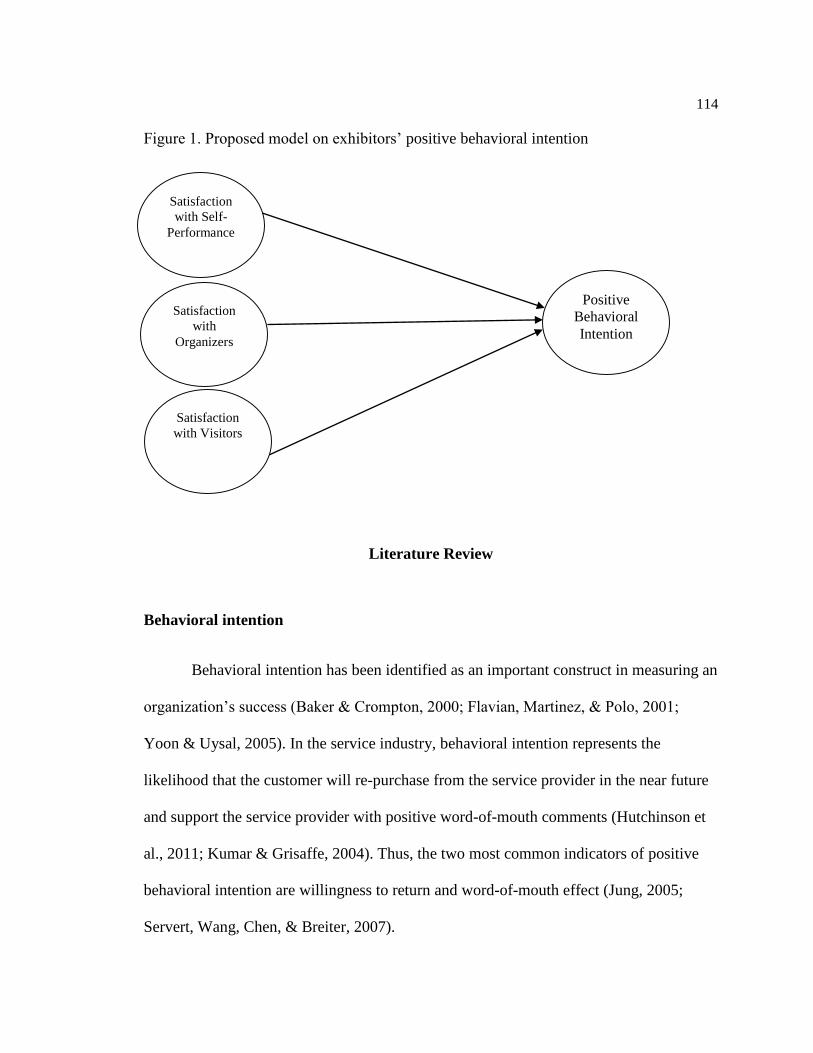
114
Figure 1. Proposed model on exhibitors’ positive behavioral intention
Literature Review
Behavioral intention
Behavioral intention has been identified as an important construct in measuring an
organization’s success (Baker & Crompton, 2000; Flavian, Martinez, & Polo, 2001;
Yoon & Uysal, 2005). In the service industry, behavioral intention represents the
likelihood that the customer will re-purchase from the service provider in the near future
and support the service provider with positive word-of-mouth comments (Hutchinson et
al., 2011; Kumar & Grisaffe, 2004). Thus, the two most common indicators of positive
behavioral intention are willingness to return and word-of-mouth effect (Jung, 2005;
Servert, Wang, Chen, & Breiter, 2007).
Satisfaction
with Self-
Performance
Satisfaction
with
Organizers
Positive
Behavioral
Intention
Satisfaction
with Visitors
115
In the trade show context, willingness to return is a key indicator of how well the
trade show organizers do with retaining existing exhibitors and visitors. Retaining
existing customers is more cost-effective than advertising and a high turn-over rate often
corresponds to perceptions of bad service. Ensuring that most customers are willing to
return to the next trade show is one of the organizer’s key goals. On the other hand,
word-of-mouth effect has been one of the strongest predictors for shaping the future
client base (Brown & Reingen, 1987; Servert et al., 2007). Word-of-mouth is free
advertising and very effective in attracting new customers. In order to have sustainable
development, organizers need to be able to attract new customers and retain existing
customers and thus improve the positive behavioral intention of exhibitors. The first step,
however, is to identify the key dimensions that influence exhibitors’ positive behavioral
intention so that organizers know where to spend their time and money.
Determinants of Exhibitors’ Positive Behavioral Intention
Satisfaction with Self-Performance
Each exhibitor has its own objectives for exhibiting at a trade show. The degree to
which these objectives are met corresponds to self-performance and influences
exhibitors’ positive behavioral intention (Hansen, 2004). Early studies proposed that
exhibitors attend trade shows to primarily sell products and services and used numbers
associated with selling activities to measure exhibitors’ self-performance (e.g., Dekimpe
et al., 1997; Gopalakrishna & Lilien, 1995). Researchers have since found that exhibitors
116
attend trade shows not only to sell, but also to test new products and to network
(Martínez & Martínez, 2010; Seringhaus & Rosson, 2004).
Early researchers (e.g., Kerin & Cron, 1987) treated non-sales objectives as
unidimensional, which is problematic in that each exhibitor has his or her unique set of
non-sales objectives. For example, some exhibitors use trade shows as a platform to
introduce new products and educate the public; networking in this instance might not be a
key factor in determining the exhibitor’s positive behavioral intention. Other exhibitors
may participate in prominent trade shows to showcase their leadership in the industry. In
these instances media exposure will be more valuable than the service provided by the
trade show organizers. Hence, using a single indicator to measure exhibitors’ non-sales
performance is misleading and fails to provide meaningful managerial implications. To
provide a comprehensive framework to capture exhibitors’ self-performance, Hansen
(2004) set up an exhibitor performance construct, which included one outcome-based
dimension (sales-related activities) and four behavior-based dimensions (information-
gathering activities, image-building activities, motivation activities, and relationship-
building activities). His research indicated that all five dimensions contributed
significantly to exhibitors’ overall performance. Thus, the following hypothesis is
proposed:
H1: Satisfaction with self-performance has a significant positive effect on
exhibitors’ positive behavioral intention.
117
Satisfaction with Organizers
An event is essentially a service because it consists of intangible experiences of
finite duration in a managed atmosphere (Getz, O’Neil, & Carlsen, 2001). Similar to
other types of services, an event such as a trade show is produced and consumed
simultaneously, highly heterogeneous, and very difficult to store. Hence, exhibitors and
visitors want organizers of trade shows to provide high quality service. Kijewski, Yoon,
and Young (1993) found that the top three objectives for exhibitors to attend a trade show
are developing new prospects in existing markets, supporting selling activities, and
enhancing relationship with current customers. The top three objectives for visitors to
attend a trade show are discovering new products, contacting potential suppliers, and
seeking new ideas and carrying out market research (Munuera & Ruiz, 1999). These
objectives are all related to the service nature of trade shows. Thus, satisfaction with
organizers corresponds to exhibitors’ perception of service quality delivered by
organizers.
Researchers have been exploring different taxonomies to describe the nature of
service quality since the 1980s. Grönroos (1982) was the first to develop a service quality
model, which was later followed by other conceptualizations of service quality (e.g.
Parasuraman, Zeithaml, & Berry, 1985). Brady and Cronin (2001), for example,
suggested that consumers aggregate their evaluations on each of the sub-dimensions to
arrive at a conclusion on each of the primary dimensions of service quality. These
conclusions lead to an overall service quality perception, which is constructed by
evaluating different service dimensions at multiple levels (Martínez & Martínez, 2010).
118
Brady and Cronin’s model has been applied in the tourism context as well as the
trade show context (e.g., Caro & Garcia, 2008; Gottlieb et al., 2011) and the results
indicate that the model fits well with good reliability and validity. In these studies the
primary dimensions as well as the sub-dimensions were kept intact, while the specific
items under each sub-dimension were modified to fit the tourism or trade show context.
Gottlieb et al. (2011) studied the impact of service quality on positive behavioral
intentions at trade shows. They found that higher service quality led to visitors’ positive
perception of trade show effectiveness and that service quality and trade show
effectiveness are both positively related to the intention to participate in future trade
shows. The authors argued that by treating trade shows as service encounters, the
organizers need to focus on service quality and service outcome in order to provide a
successful trade show. Jin et al. (2010) studied the relationship quality between trade
show organizers and exhibitors and found that relationship quality is essential to
exhibitors’ trade show performance. Several other researchers also found that satisfaction
with organizers is one of the strongest predictors of exhibitors’ positive behavioral
intention (Jin & Weber, 2013; Jung, 2005). Thus, the following hypothesis is proposed:
H2: Satisfaction with organizers has a significant positive effect on exhibitors’
positive behavioral intention.
Satisfaction with Visitors
Exhibitors attend trade shows to meet visitors (Blythe, 2002), but the degree to
which visitors affect exhibitors’ satisfaction and positive behavioral intention has been
ignored. Researchers have assumed that finding business partners and signing contracts
119
were the only objectives of trade show exhibitors and they used conversion efficiency to
measure exhibitors’ performance (e.g., Dekimpe et al., 1997; Gopalakrishna & Lilien,
1995). However, B2B transactions often take several months, if not years, to complete.
And, some of the leads obtained at the trade show might lead to nowhere while others
might come to fruition many years in the future. Thus, focusing on short-term sales
numbers is misleading.
In addition, researchers have realized that selling activities are just one part of a
set of complex interactions taking place between exhibitors and visitors (Seringhaus &
Rosson, 2004). Godar and O’Connor (2001) found that attendees at trade shows prioritize
non-sales activities such as information search and relation building. The shift from sales
activities to non-sales activities requires exhibitors to reexamine their trade show
strategies and evaluate their performance through a more comprehensive perspective
(Hansen, 1999). Researchers also have found that the characteristics of visitors (e.g., job
ranking, purchase authority, and previous experience) have a significant effect on
exhibitors’ overall satisfaction and positive behavioral intention (Bello, 1992; Kang &
Schrier, 2011; Bello & Lohtia, 1993). Rather than using a unilateral index such as
conversion efficiency or sales numbers, then, this study adopted a comprehensive
approach by focusing on exhibitors’ satisfaction with visitors and its effect on exhibitors’
positive behavioral intention. The following hypothesis is proposed:
H3: Satisfaction with visitors has a significant positive effect on exhibitors’
positive behavioral intention.
120
Methods
A 46-item (3 dimension) exhibitor satisfaction scale tested for validity and
reliability through multiple pilot tests (see Chapters 2 and 3) was used to assess
exhibitors’ satisfaction with their self-performance, the service quality provided by
organizers, and visitors. To detect subtle differences in exhibitors’ satisfaction and
positive behavioral intention, the 7-point Likert scale originally used in the pilot tests of
the scale was changed to a 10-point Likert scale. The modified survey was distributed to
a sample of 750 exhibitors at 3 trade shows in China (Table 1). Multiple trade show staff
were involved with the data collection process and were asked to follow the same
protocol used in the pilot study1. Overall, 594 valid responses were obtained, yielding a
79.2% response rate.
Structural equation modeling (SEM) was used to examine the relationships
between the three dimensions and positive behavioral intention in the proposed model
(see Figure 1). Previous research has found SEM to be a statistical technique that is
superior to others when testing the level at which a proposed model accurately accounts
for the relationships that are observed in a sample (Kline, 1998). The goodness of fit for
the proposed model was examined to test the proposed model. Standardized path
coefficients were used to examine the relative strength of each of the three dimensions on
exhibitors’ positive behavioral intention.
1 Exhibitors were approached the last day of the trade show. On-site personnel with the highest
ranking were asked to fill out the questionnaire. Multiple trade show staff were involved with the
data collection process. They were provided instructions regarding face-to-face interviewing, a
script to follow, and asked to keep their opinions to a minimum.
121
Variables and Measurements
Based on the literature reviewed, two variables were used to measure exhibitors’
positive behavioral intention: willingness to return and word-of-mouth effect. For
willingness to return, exhibitors were asked whether or not they would return to the same
trade show next year. For word-of-mouth effect, exhibitors were asked whether or not
they would recommend the trade show to their colleagues and other companies. Both
variables were measured using a 10-point Likert scale (1 = least likely; 10 = most likely).
Self-performance was measured using Hansen’s (1999) five-dimension
conceptual framework. Hansen’s framework includes one outcome-based dimension
(sales-related activities) and four behavior-based dimensions (information-gathering
activities, image-building activities, motivation activities, and relationship-building
activities). This five-dimension framework emphasizes non-sales activities and is
regarded as one of the most comprehensive studies on exhibitors’ self-performance
(Seringhaus & Rosson, 2004). Specifically, exhibitors were asked to rate their level of
satisfaction with each statement using a 10-point, 17-item scale (1 = extremely poor, 10 =
extremely excellent).
Satisfaction with organizers was measured using 17 items that were adopted from
Brady and Cronin’s (2001) multi-level service quality model. Brady and Cronin’s model
has been used in the trade show context and has exhibited excellent reliability and
validity (Gottlieb et al., 2011). The multi-level model consists of three dimensions (i.e.,
interaction quality, environment quality, and outcome quality) and each of the
dimensions has three sub-dimensions. Interaction quality contains attitude, behavior, and
122
expertise; environment quality contains ambient conditions, design, and social factors;
and outcome quality contains waiting time, tangibles, and valence. The sub-dimension
waiting time was dropped because it does not apply to the trade show industry. Exhibitors
were asked to rate their level of agreement using a 10-point Likert scale (1 = strongly
disagree, 10 = strongly agree).
A 10-point, 12-item Likert scale (1 = extremely poor, 10 = extremely excellent)
drawn from a study conducted by the author was used to enable exhibitors to rate their
satisfaction with visitors. The scale covers four sub-dimensions of exhibitors’ satisfaction
with visitors: visitors’ job level, job function, purchasing authority, and communication.
All four sub-dimensions have been found to affect exhibitors’ satisfaction with visitors
(Bello, 1992; Bello & Lohtia, 1993; Rosson & Seringhaus, 1995).
Executives’ experiences, values, and personalities greatly influence their
interpretations of the situations they face and, in turn, affect their strategic choices
(Hambrick, 2007). Previous studies have found that the values and cognitive bases of
managers are a function of their work background and experience (Carpenter,
Geletkanycz, & Sanders, 2004; Geletkanycz & Black, 2001; Kang & Schrier, 2011).
Furthermore, this study used data from three trade shows. To control for the effect of
different trade shows, the 2013 China International Games & Amusement Fair was used
as the baseline and two dummy variables (i.e., “app14” for the China Household
Electrical Appliances Trade Fair and “game14” for the China International Games &
Amusement Exhibition) were created to control for the effects of the other trade shows.
In total, five control variables (three Likert scale and two dichotomous) were included in
123
the survey: exhibitors’ job level, previous experience with this particular trade show,
previous experience with trade shows, app14, and game14.
Data Analysis and Results
A detailed description of the methods and results of the survey items validation
can be found in Chapter 3. After purification and validation, the final version of the
survey exhibited good reliability and validity and included 17 items relating to
satisfaction with organizers, 17 items for the satisfaction with self-performance construct,
12 items for satisfaction with visitors, and 2 items for positive behavioral intention.
Sample Characteristics
Overall, 594 valid responses were obtained, yielding a 79.2% response rate.
Missing values, outliers, and the distribution of every variable were examined. Keeping
in mind the large sample size and the complexity of the model (Allison, 1987; West,
Finch, & Curran, 1995), no serious violations of statistical analysis were found.
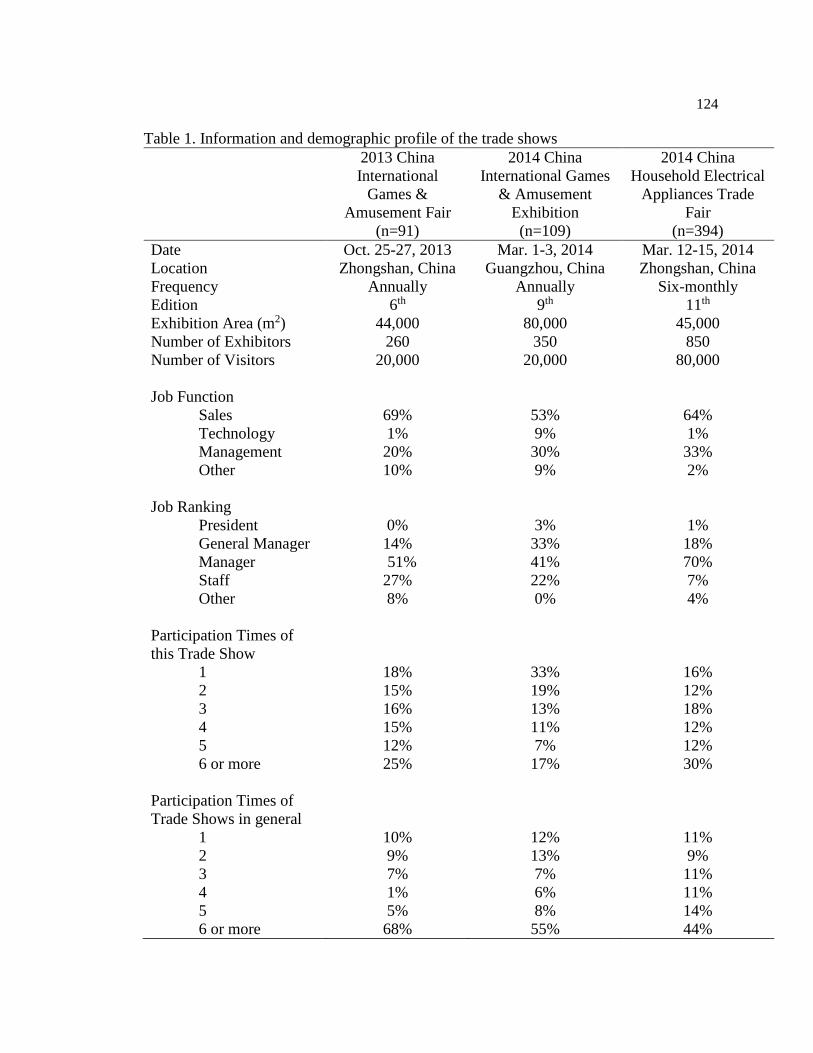
124
Table 1. Information and demographic profile of the trade shows
2013 China
International
Games &
Amusement Fair
(n=91)
2014 China
International Games
& Amusement
Exhibition
(n=109)
2014 China
Household Electrical
Appliances Trade
Fair
(n=394)
Date Oct. 25-27, 2013 Mar. 1-3, 2014 Mar. 12-15, 2014
Location Zhongshan, China Guangzhou, China Zhongshan, China
Frequency Annually Annually Six-monthly
Edition 6th 9th 11th
Exhibition Area (m2) 44,000 80,000 45,000
Number of Exhibitors 260 350 850
Number of Visitors 20,000 20,000 80,000
Job Function
Sales
Technology
Management
Other
69%
1%
20%
10%
53%
9%
30%
9%
64%
1%
33%
2%
Job Ranking
President
General Manager
Manager
Staff
Other
0%
14%
51%
27%
8%
3%
33%
41%
22%
0%
1%
18%
70%
7%
4%
Participation Times of
this Trade Show
1
2
3
4
5
6 or more
18%
15%
16%
15%
12%
25%
33%
19%
13%
11%
7%
17%
16%
12%
18%
12%
12%
30%
Participation Times of
Trade Shows in general
1
2
3
4
5
6 or more
10%
9%
7%
1%
5%
68%
12%
13%
7%
6%
8%
55%
11%
9%
11%
11%
14%
44%
125
In terms of the distribution of socio-demographic variables, there were no major
differences between the three trade shows (Table 1). The only exception was with the
2014 China Household Electrical Appliances Trade Fair, which had a higher percentage
of respondents with high-ranking positions than the other two trade shows. Averaged
across the three trade shows, approximately 30% of the respondents had a background in
management and the remaining two thirds mostly had (63.1%) a background in sales.
Most (84.2%) respondents reported being managers or higher. As for previous trade show
experience, 82% of the respondents were repeat customers and 49% had attended 6 or
more trade shows previously. Hence, most respondents reported having extensive trade
show experience, which suggests that they should be able to express their opinions about
various aspects of a trade show. Table 2 lists the means and standard deviations of the
sub-dimensions within satisfaction with self-performance, satisfaction with organizers,
satisfaction with visitors, and behavioral intention.
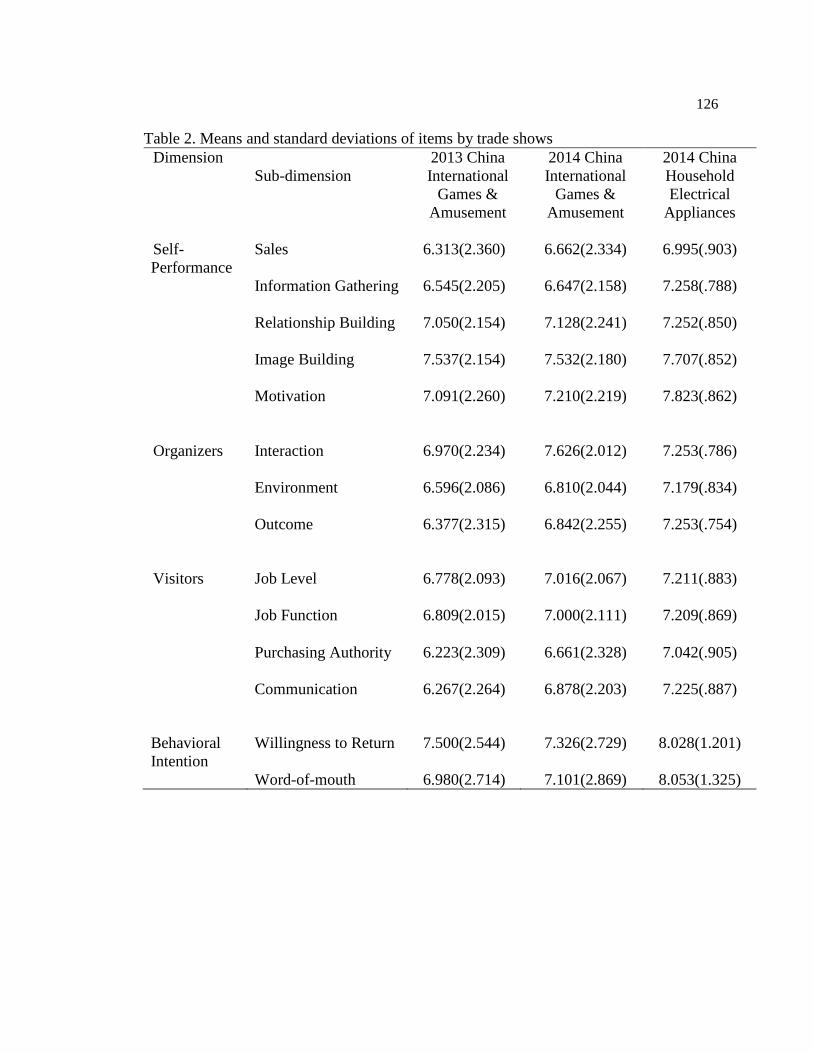
126
Table 2. Means and standard deviations of items by trade shows
Dimension
Sub-dimension
2013 China
International
Games &
Amusement
2014 China
International
Games &
Amusement
2014 China
Household
Electrical
Appliances
Self-
Performance
Sales
6.313(2.360)
6.662(2.334)
6.995(.903)
Information Gathering 6.545(2.205)
6.647(2.158) 7.258(.788)
Relationship Building 7.050(2.154)
7.128(2.241) 7.252(.850)
Image Building 7.537(2.154)
7.532(2.180) 7.707(.852)
Motivation 7.091(2.260) 7.210(2.219) 7.823(.862)
Organizers Interaction 6.970(2.234) 7.626(2.012) 7.253(.786)
Environment 6.596(2.086) 6.810(2.044) 7.179(.834)
Outcome 6.377(2.315) 6.842(2.255) 7.253(.754)
Visitors Job Level 6.778(2.093) 7.016(2.067) 7.211(.883)
Job Function 6.809(2.015) 7.000(2.111) 7.209(.869)
Purchasing Authority 6.223(2.309) 6.661(2.328) 7.042(.905)
Communication 6.267(2.264) 6.878(2.203) 7.225(.887)
Behavioral
Intention
Willingness to Return
Word-of-mouth
7.500(2.544)
6.980(2.714)
7.326(2.729)
7.101(2.869)
8.028(1.201)
8.053(1.325)
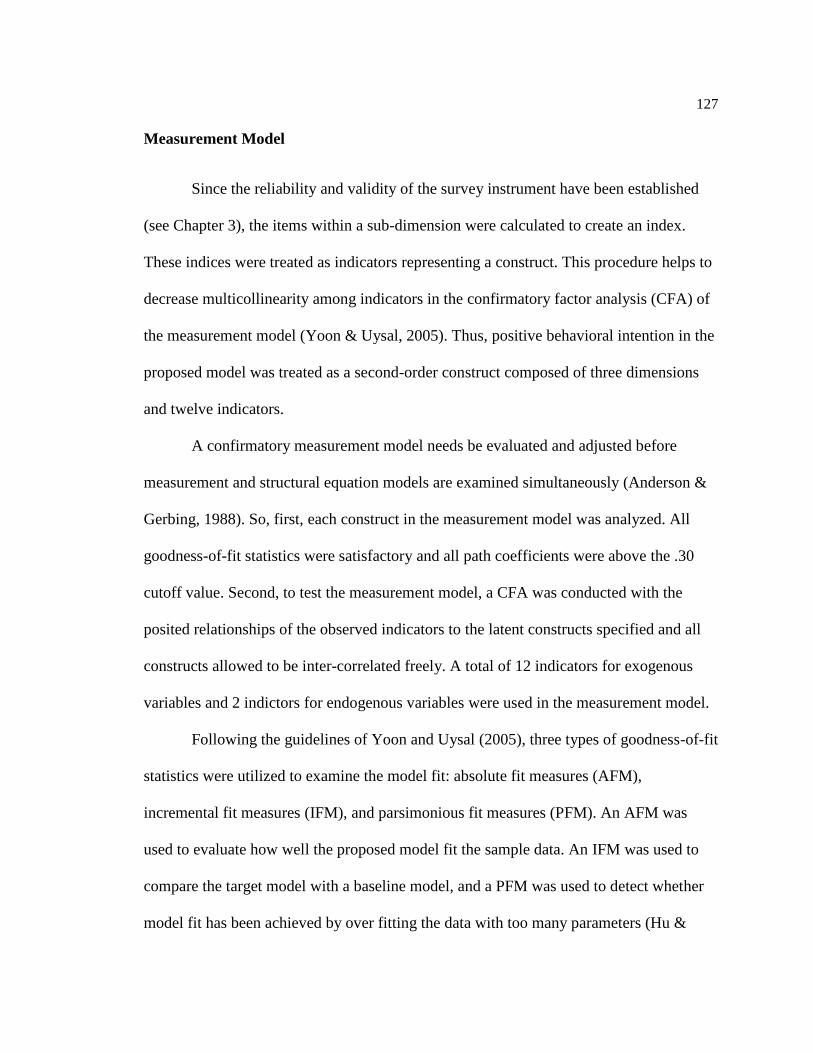
127
Measurement Model
Since the reliability and validity of the survey instrument have been established
(see Chapter 3), the items within a sub-dimension were calculated to create an index.
These indices were treated as indicators representing a construct. This procedure helps to
decrease multicollinearity among indicators in the confirmatory factor analysis (CFA) of
the measurement model (Yoon & Uysal, 2005). Thus, positive behavioral intention in the
proposed model was treated as a second-order construct composed of three dimensions
and twelve indicators.
A confirmatory measurement model needs be evaluated and adjusted before
measurement and structural equation models are examined simultaneously (Anderson &
Gerbing, 1988). So, first, each construct in the measurement model was analyzed. All
goodness-of-fit statistics were satisfactory and all path coefficients were above the .30
cutoff value. Second, to test the measurement model, a CFA was conducted with the
posited relationships of the observed indicators to the latent constructs specified and all
constructs allowed to be inter-correlated freely. A total of 12 indicators for exogenous
variables and 2 indictors for endogenous variables were used in the measurement model.
Following the guidelines of Yoon and Uysal (2005), three types of goodness-of-fit
statistics were utilized to examine the model fit: absolute fit measures (AFM),
incremental fit measures (IFM), and parsimonious fit measures (PFM). An AFM was
used to evaluate how well the proposed model fit the sample data. An IFM was used to
compare the target model with a baseline model, and a PFM was used to detect whether
model fit has been achieved by over fitting the data with too many parameters (Hu &
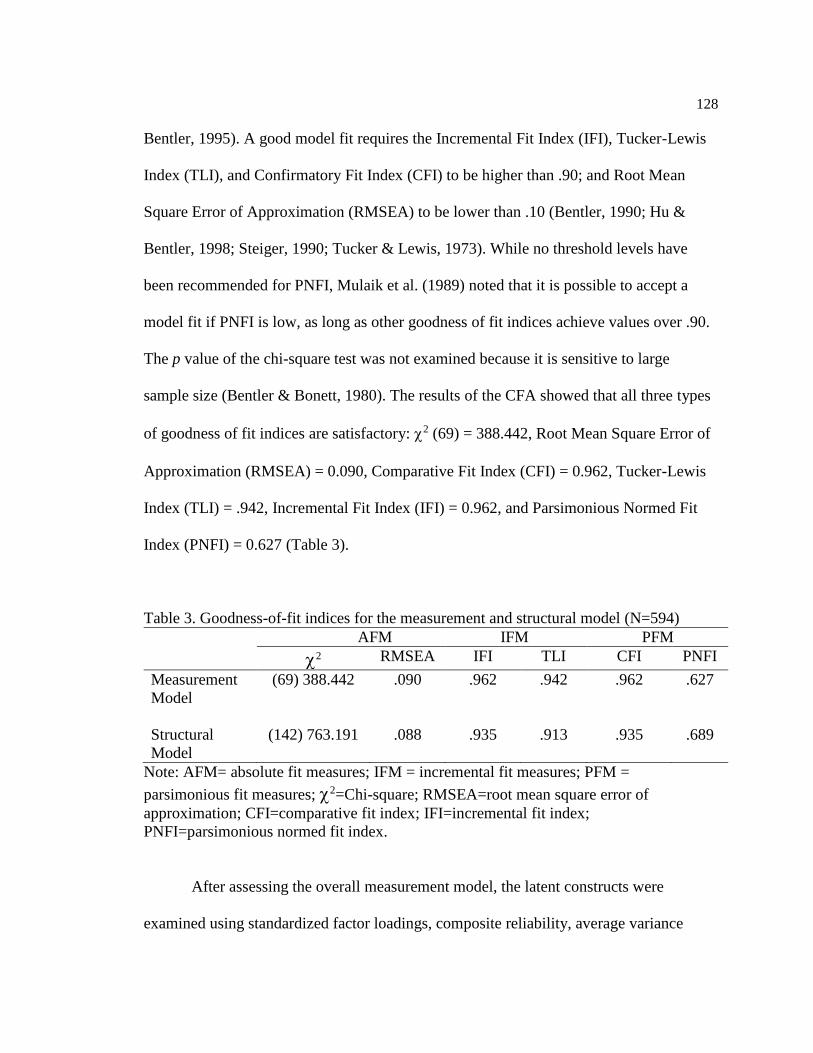
128
Bentler, 1995). A good model fit requires the Incremental Fit Index (IFI), Tucker-Lewis
Index (TLI), and Confirmatory Fit Index (CFI) to be higher than .90; and Root Mean
Square Error of Approximation (RMSEA) to be lower than .10 (Bentler, 1990; Hu &
Bentler, 1998; Steiger, 1990; Tucker & Lewis, 1973). While no threshold levels have
been recommended for PNFI, Mulaik et al. (1989) noted that it is possible to accept a
model fit if PNFI is low, as long as other goodness of fit indices achieve values over .90.
The p value of the chi-square test was not examined because it is sensitive to large
sample size (Bentler & Bonett, 1980). The results of the CFA showed that all three types
of goodness of fit indices are satisfactory: 2 (69) = 388.442, Root Mean Square Error of
Approximation (RMSEA) = 0.090, Comparative Fit Index (CFI) = 0.962, Tucker-Lewis
Index (TLI) = .942, Incremental Fit Index (IFI) = 0.962, and Parsimonious Normed Fit
Index (PNFI) = 0.627 (Table 3).
Table 3. Goodness-of-fit indices for the measurement and structural model (N=594)
AFM IFM PFM
2 RMSEA IFI TLI CFI PNFI
Measurement
Model
(69) 388.442 .090 .962 .942 .962 .627
Structural
Model
(142) 763.191
.088 .935 .913 .935 .689
Note: AFM= absolute fit measures; IFM = incremental fit measures; PFM =
parsimonious fit measures; 2=Chi-square; RMSEA=root mean square error of
approximation; CFI=comparative fit index; IFI=incremental fit index;
PNFI=parsimonious normed fit index.
After assessing the overall measurement model, the latent constructs were
examined using standardized factor loadings, composite reliability, average variance
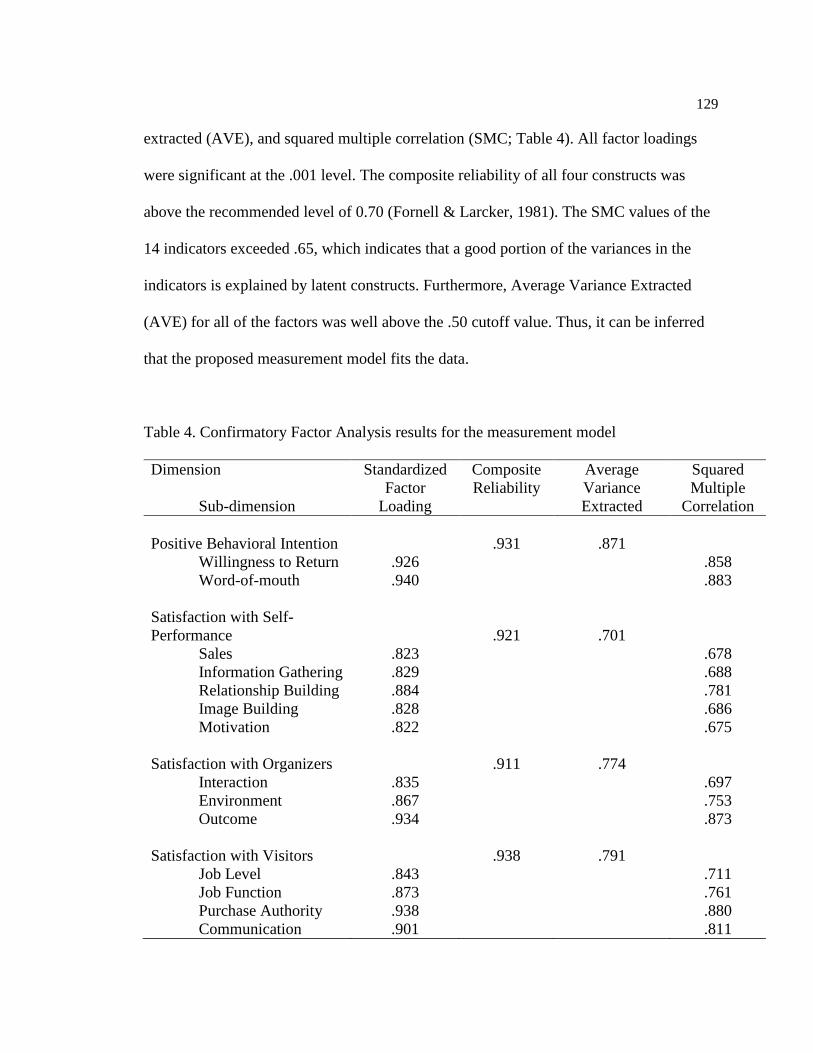
129
extracted (AVE), and squared multiple correlation (SMC; Table 4). All factor loadings
were significant at the .001 level. The composite reliability of all four constructs was
above the recommended level of 0.70 (Fornell & Larcker, 1981). The SMC values of the
14 indicators exceeded .65, which indicates that a good portion of the variances in the
indicators is explained by latent constructs. Furthermore, Average Variance Extracted
(AVE) for all of the factors was well above the .50 cutoff value. Thus, it can be inferred
that the proposed measurement model fits the data.
Table 4. Confirmatory Factor Analysis results for the measurement model
Dimension
Sub-dimension
Standardized
Factor
Loading
Composite
Reliability
Average
Variance
Extracted
Squared
Multiple
Correlation
Positive Behavioral Intention
Willingness to Return
Word-of-mouth
.926
.940
.931
.871
.858
.883
Satisfaction with Self-
Performance
Sales
Information Gathering
Relationship Building
Image Building
Motivation
.823
.829
.884
.828
.822
.921
.701
.678
.688
.781
.686
.675
Satisfaction with Organizers
Interaction
Environment
Outcome
.835
.867
.934
.911
.774
.697
.753
.873
Satisfaction with Visitors
Job Level
Job Function
Purchase Authority
Communication
.843
.873
.938
.901
.938
.791
.711
.761
.880
.811
130
Structural Equation Model
The proposed structural model has three exogenous constructs (i.e., satisfaction
with self-performance, satisfaction with organizers, and satisfaction with visitors), one
endogenous construct (i.e., positive behavioral intention), and five control variables (i.e.,
respondents’ job ranking, previous experience with this particular trade show, previous
experience with trade shows, app14, and game14). The three exogenous constructs were
allowed to correlate with each other, while three paths were proposed to address the three
hypotheses: a) from satisfaction with self-performance to positive behavioral intention; b)
from satisfaction with organizers to positive behavioral intention; and c) from satisfaction
with visitors to positive behavioral intention.
As discussed previously, the p value of the chi-square test is heavily influenced by
sample size. Thus, other goodness-of-fit statistics were used to evaluate the model fit.
The results showed that all three types of goodness of fit indices are satisfactory: 2 (142)
= 763.191, Root Mean Square Error of Approximation (RMSEA) = 0.088, Comparative
Fit Index (CFI) = 0.935, Tucker-Lewis Index (TLI) = .913, Incremental Fit Index (IFI) =
0.935, and Parsimonious Normed Fit Index (PNFI) = 0.689 (Table 3).
Table 5 lists the standardized path coefficients of the structural model. All
standardized path coefficients are significant at the .05 level except for the paths between
positive behavioral intention and the four control variables (i.e., app14, game14, job
ranking, and previous experience with trade shows). A visual diagram depicting the
structural model is shown in Figure 2. For clear illustration, error structures and control
variables were omitted in the figure. Satisfaction with organizers is the strongest
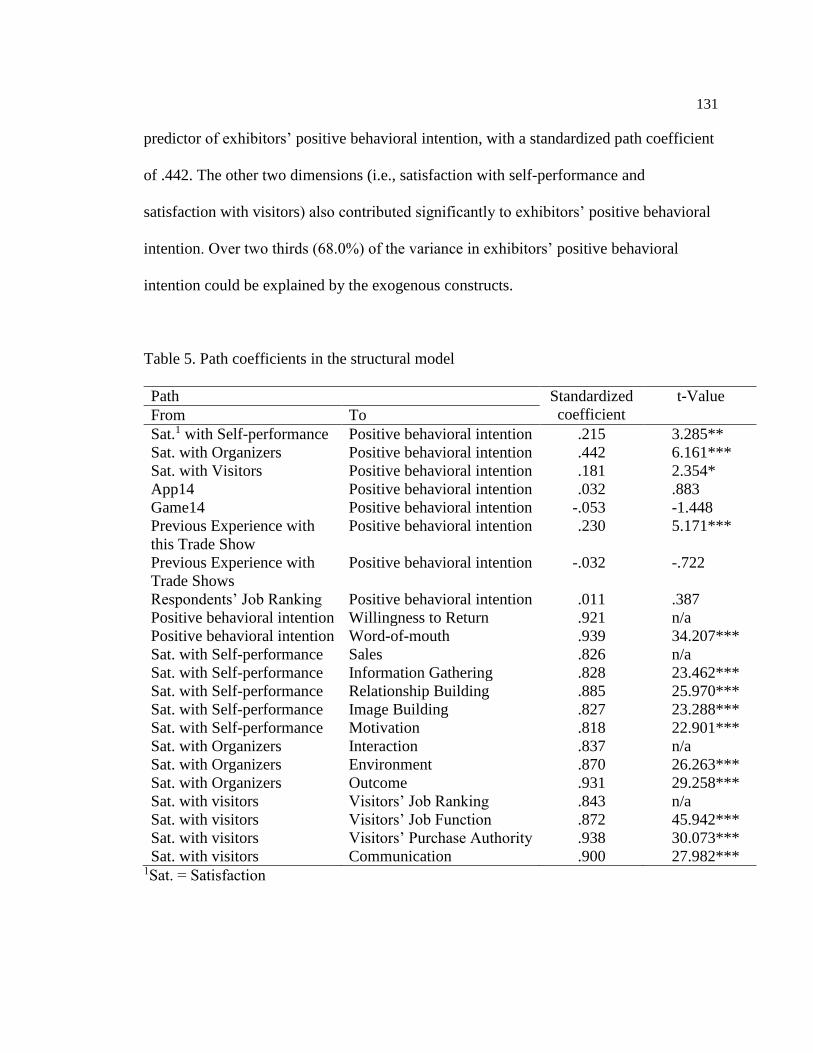
131
predictor of exhibitors’ positive behavioral intention, with a standardized path coefficient
of .442. The other two dimensions (i.e., satisfaction with self-performance and
satisfaction with visitors) also contributed significantly to exhibitors’ positive behavioral
intention. Over two thirds (68.0%) of the variance in exhibitors’ positive behavioral
intention could be explained by the exogenous constructs.
Table 5. Path coefficients in the structural model
Path Standardized
coefficient
t-Value
From To
Sat.1 with Self-performance Positive behavioral intention .215 3.285**
Sat. with Organizers Positive behavioral intention .442 6.161***
Sat. with Visitors Positive behavioral intention .181 2.354*
App14 Positive behavioral intention .032 .883
Game14 Positive behavioral intention -.053 -1.448
Previous Experience with
this Trade Show
Positive behavioral intention .230 5.171***
Previous Experience with
Trade Shows
Positive behavioral intention -.032 -.722
Respondents’ Job Ranking Positive behavioral intention .011 .387
Positive behavioral intention Willingness to Return .921 n/a
Positive behavioral intention Word-of-mouth .939 34.207***
Sat. with Self-performance Sales .826 n/a
Sat. with Self-performance Information Gathering .828 23.462***
Sat. with Self-performance Relationship Building .885 25.970***
Sat. with Self-performance Image Building .827 23.288***
Sat. with Self-performance Motivation .818 22.901***
Sat. with Organizers Interaction .837 n/a
Sat. with Organizers Environment .870 26.263***
Sat. with Organizers Outcome .931 29.258***
Sat. with visitors Visitors’ Job Ranking .843 n/a
Sat. with visitors Visitors’ Job Function .872 45.942***
Sat. with visitors Visitors’ Purchase Authority .938 30.073***
Sat. with visitors Communication .900 27.982*** 1Sat. = Satisfaction
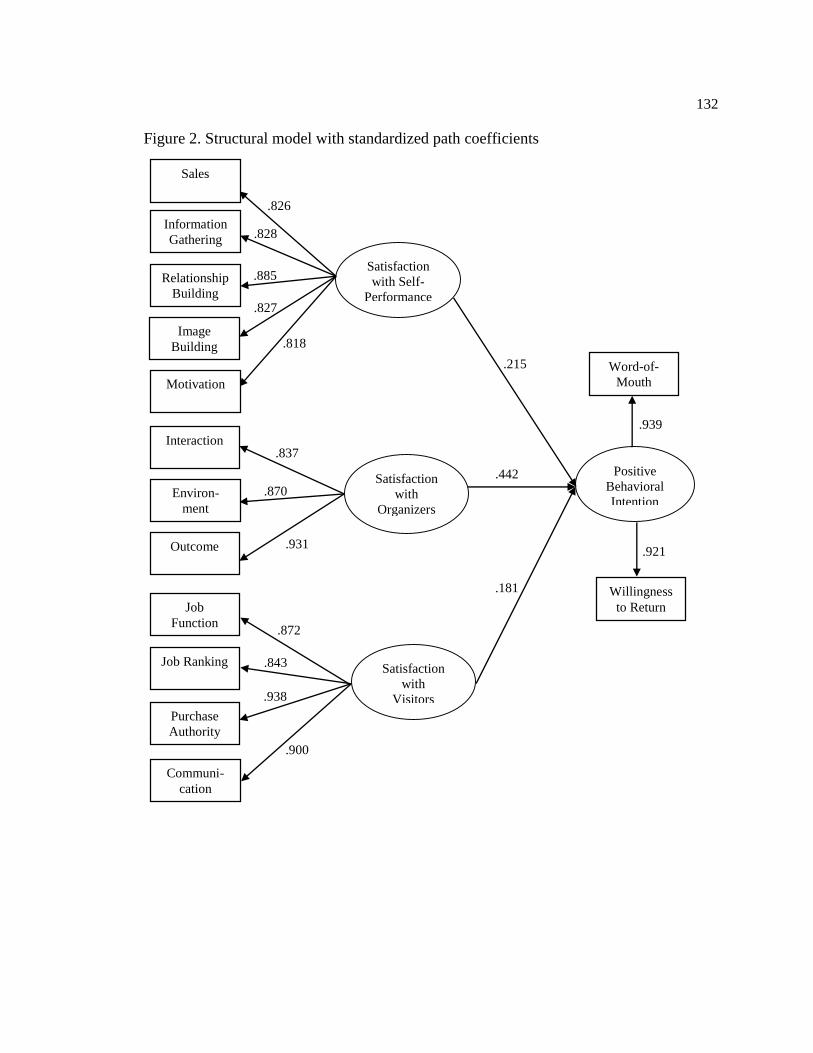
132
Figure 2. Structural model with standardized path coefficients
Positive
Behavioral
Intention
Satisfaction
with Self-
Performance
.
826
.
818
.
872
.
939
.
921
Satisfaction
with
Organizers
Satisfaction
with
Visitors
Information
Gathering .
828 .
885 .
827
.
837 .
870
.
931
.
843 .
938
.
900
.
215
.
442
.
181
Sales
Relationship
Building
Image
Building
Motivation
Interaction
Environ-
ment
Outcome
Job
Function
Job Ranking
Purchase
Authority
Communi-
cation
Word-of-
Mouth
Willingness
to Return
.826
.828
.885
.827
.818
.837
.870
.931
.872
.843
.938
.900
.215
.442
.181
.939
.921
133
Discussion and Implications
The purpose of this study was to test a proposed model indicating that satisfaction
with self-performance, satisfaction with organizers, and satisfaction with visitors will be
significantly, positively, and directly related to exhibitors’ positive behavioral intention.
The results offered support for the structural model.
Hypothesis 1 proposed that satisfaction with self-performance has a significant
positive effect on exhibitors’ positive behavioral intention. The result showed that the
standardized path coefficient from satisfaction with self-performance to positive
behavioral intention was .215 and significant at the .05 level (t-value = 3.285, p = .001).
Thus, hypothesis 1 is supported.
Hypothesis 2 proposed that satisfaction with organizers has a significant positive
effect on exhibitors’ positive behavioral intention. The result showed that the
standardized path coefficient from satisfaction with organizers to positive behavioral
intention was .442 and significant (t-value = 6.161, p = .000). Thus, hypothesis 2 is
supported.
Hypothesis 3 proposed that satisfaction with visitors has a significant positive
effect on exhibitors’ positive behavioral intention. The result showed that the
standardized path coefficient from satisfaction with visitors to positive behavioral
intention was .181 and significant (t-value = 2.354, p = .019). Thus, hypothesis 3 is
supported.
In line with previous research (Lee & Beeler, 2009; Jin & Weber, 2013; Jung,
2005), this study found that satisfaction with organizers (i.e., service quality) is the
134
dominant predictor of exhibitors’ positive behavioral intention. This result challenges the
notion that exhibitors attend trade shows only for sales activities. Trade shows by nature
are a service. In order to secure existing customers and attract new customers, organizers
need to focus on the delivery of their service and improve upon the quality of their
interactions, the environment, and service outcomes. Satisfaction with self-performance
and satisfaction with visitors also positively affected exhibitors’ positive behavioral
intention. In combination, these three dimensions explained approximately 65% of the
variance in exhibitors’ positive behavioral intention.
Furthermore, previous experience with the current trade show, one of the five
control variables, also significantly affected positive behavioral intention. Previous
experience with this particular trade show had a significant positive effect on exhibitors’
positive behavioral intention, which is in line with findings from previous research on
loyalty that indicates more previous experience with an organization leads to a higher
likelihood of return and referral (Yoon & Uysal, 2005). It is important to note that the
four additional control variables (i.e., app 14, game 14, job ranking, previous experience
with trade shows in general) turned out to be non-significant. The non-significant effects
of app 14 and game 14 indicate that the path coefficients are almost identical across the
three trade shows, which suggests that the proposed model works across a wide range of
trade shows.
Overall, the model proposed in this study showed satisfactory reliability, validity,
and goodness-of-fit statistics. Drawn from Hansen’s (2004) five-dimension framework,
Brady and Cronin’s (2001) hierarchical service quality model, and a measurement scale
on satisfaction with visitors developed by the author, the model accounted for the three
135
key stakeholders in the trade show industry simultaneously with 17 items relating to
satisfaction with organizers, 17 items representing satisfaction with self-performance, and
12 items for satisfaction with visitors. Previous studies have only focused on one or two
stakeholders (e.g., Dekimpe et al., 1997; Gopalakrishna & Lilien, 1995; Hansen, 2004;
Jin et al., 2012). The results of this study showed that exhibitors, organizers, and visitors
all have a significant impact on exhibitors’ positive behavioral intention. Thus, for the
first time, the model proposed in this study showcased the importance of considering all
three key stakeholders when studying exhibitors’ positive behavioral intention.
Practical Implications
The findings also have significant managerial implications for trade show
organizers. Satisfaction with self-performance, satisfaction with organizers, and
satisfaction with visitors contributed significantly to exhibitors’ positive behavioral
intention and are within trade show organizers’ control. The starting point should be with
the three sub-dimensions of service quality (i.e., interaction quality, environment quality,
and outcome quality). Organizers can ensure that exhibitors’ voice is heard loud and clear
and that their problems are addressed in a timely manner. In addition, organizers can
provide an environment that facilitates exhibitors’ agenda (e.g., giving out awards for the
best booth) at the trade show. And, organizers can enhance outcome quality by helping
exhibitors reap what they sow by following up with visitors.
As for exhibitors’ self-performance, organizers need to identify their major
objectives and allocate their limited resources accordingly. For example, if a large portion
136
of exhibitors participate in the trade show to break into a new market, organizers should
then recruit high quality domestic and overseas buyers and arrange special networking
sessions that allow them to get to know one another. Organizers could also work on
exhibitors’ satisfaction with visitors. A major responsibility of organizers is to facilitate
the relationship-building process between exhibitors and visitors at different stages of an
event (Jin & Weber, 2013). The results of this study indicated that visitors’ job ranking,
job function, purchase authority, and community quality all positively affected
exhibitors’ positive behavioral intention. Organizers should build on this finding by
recruiting visitors with fitting positions and purchasing power and then ensuring that
exhibitors will have plenty of opportunities to interact with them. Organizers could even
pay high profile international buyers (i.e., visitors) to attend the trade show to increase
exhibitors’ positive behavioral intention.
Limitations and Direction for Future Studies
This study has several limitations. First, positive behavioral intention might not
transform into actual behavior. Many factors (e.g., budget cuts, time conflict, new
management, and change in strategy) might come into play during the one-year or six-
month gap between trade shows. Furthermore, some effects of trade shows are delayed
and might influence exhibitors’ positive behavioral intention long after the trade show.
For example, securing qualified leads during the trade show might encourage exhibitors
to return. However, if these qualified leads fail to convert into actual sales through
follow-up activity, the exhibitor might end up disappointed with the trade show and
137
change his or her intention to return. In some industries where the purchase price is very
high, it can take months or even years for exhibitors to realize the effects of a trade show
(Seringhaus & Rosson, 2004). Hence, future studies should adopt a longitudinal design
and study the factors that impact exhibitors’ positive behavioral intention for an extended
period of time after the trade show. Doing so likely would be valuable to organizers
interested in ensuring exhibitors’ positive behavioral intention.
Second, this study addressed the three key determinants of exhibitors’ positive
behavioral intention: satisfaction with self-performance, satisfaction with organizers, and
satisfaction with visitors. The results showed that all three constructs contributed
significantly to exhibitors’ positive behavioral intention and together they explained a
good portion of the variance of exhibitors’ positive behavioral intention. However, there
are other factors that could influence exhibitors’ positive behavioral intention. For
example, previous studies have found that members of the local community,
attractiveness, and accessibility of the event venue could impact attendees’ participation
experience (Oppermann & Chon, 1997; Zhang, Leung, & Qu, 2007). Thus, future studies
should include these factors and examine their significant effect and relative strength on
exhibitors’ positive behavioral intention.
Third, the measurement instrument used in this study consisted of 46 items, which
might not be feasible for trade show organizers to use because exhibitors and visitors do
not like lengthy surveys. Future research should modify the model established in this
study and develop a short-version that is more amenable to the trade show environment.
Stepwise comparisons could be conducted between the short-version model and the full
model. Items could be dropped as long as there is no significant drop in goodness-of-fit
138
statistics. The goal is to achieve a balance between being parsimonious and having strong
explaining power. Depending on objectives, resources, and budgets, trade show
organizers could choose to conduct either a full-size evaluation on exhibitors’ positive
behavioral intention or a short-version.
In conclusion, using data from 594 exhibitors at 3 international trade shows, this
study found that it is essential to consider all three key stakeholders when studying
positive behavioral intention. Specifically, satisfaction with self-performance, satisfaction
with organizers, and satisfaction with visitors all positively affected exhibitors’ positive
behavioral intention, which extends literature on exhibitors’ positive behavioral intention
in that the model proposed in this study comprehensively measures exhibitors’
performance at a trade show and explains a large portion of exhibitors’ positive
behavioral intention. Trade show organizers could use the model proposed in this study to
measure and improve their exhibitors’ positive behavioral intention.
References
Allison, P. D. (1987). Estimation of linear models with incomplete data. In C. C. Clogg
(Ed.), Sociological methodology.
Anderson, J. C., & Gerbing, D. W. (1988). Structural equation modeling in practice: A
review and recommended two-step approach. Psychological Bulletin, 103(3), 411-
423.
139
American Business Media. (2013, May 24). B2B media and info industry revenues up
3.4% in 2012. Retrieved from http://www.marketingcharts.com/wp/print/b2b-
media-and-info-industry-revenues-up-3-4-in-2012-29788/
American Business Media. (2007, April 11). Business media shows strong growth in
2006. Retrieved from
http://www.abmassociation.com/abm/NewsBot.asp?MODE=VIEW&ID=494&SnID
=1907529661
Baker, D. A., & Crompton, J. L. (2000). Quality, satisfaction and behavioral intentions.
Annual of Tourism Research, 27(3), 785-804.
Bello, D. C. (1992). Industrial buyer behavior at trade shows: Implications for selling
effectiveness. Journal of Business Research, 25(1), 59-80.
Bello, D. C., & Lohtia, R. (1993). Improving trade show effectiveness by analyzing
attendees. Industrial Marketing Management, 22(4), 311-318.
Bentler, P. M. (1990). Comparative fit indexes in structural models. Psychological
Bulletin, 107(2), 238-246.
Bentler, P. M., & Bonett, D. G. (1980). Significance tests and goodness-of-fit in the
analysis of covariance structures. Psychological Bulletin, 88(3), 588-600.
Berne, C., & García-Uceda, M. (2008). Criteria involved in evaluation of trade shows to
visit. Industrial Marketing Management, 37(5), 565-579.
Blythe, J. (2002). Using trade fairs in key account management. Industrial Marketing
Management, 31(7), 627-635.
Borghini, S., Golfetto, F., & Rinallo, D. (2006). Ongoing search among industrial
buyers. Journal of Business Research, 59(10-11), 1151-1159.
140
Brady, M. K., & Cronin, J. J. (2001). Some new thoughts on conceptualizing perceived
service quality: A hierarchical approach. Journal of Marketing, 65(3), 34-49.
Brown, J. J., & Reingen, P. H. (1987). Social ties and word-of-mouth referral behavior.
Journal of Consumer Research, 14(3), 350-62.
Bruhn, M., & Hadwich, K. (2005). Managing the service quality of trade fairs. In M.
Kirchgeorg (Ed.), Trade show management: Planning, implementing and controlling
of trade shows, conventions and events (pp. 787-821). Gabler Verlag.
Caro, L. M., & Garcia, J. A. M. (2008). Developing a multidimensional and hierarchical
service quality model for the travel agency industry. Tourism Management, 29(4),
706–720.
Carpenter, M., Geletkanycz, M., & Sanders, G. (2004). Upper echelons research
revisited: Antecedents, elements, and consequences of top management team
composition. Journal of Management, 30(6), 749-778.
Dekimpe, M., François, P., Gopalakrishna, S., Lilien, G., & van den Bulte, C. (1997).
Generalizing about trade show effectiveness: A cross-national comparison. Journal
of Marketing, 61(4), 55-64.
Flavian, C., Martinez, E., & Polo, Y. (2001). Loyalty to grocery stores in the Spanish
market of the 1990s. Journal of Retailing and Consumer Services, 8(2), 85–93.
Freeman, R. (1984). Strategic management: A stakeholder’s approach. Boston, MA:
Pitman.
Friedman, S. (2009). Sponsorship: A Key to Powerful Marketing, Retrieved from:
http://www.newjournalarticles.org/Sponsorship_A_Key_to_Powerful_Marketing,112
57/
141
Fornell, C., & Larcker, D. F. (1981). Evaluating structural equation models with
unobservable variables and measurement error. Journal of Marketing Research,
18(1), 39-50.
Geletkanycz, M. A. & Black, S. S. (2001). Bound by the past? Experience-based effects
on commitment to the strategic status quo. Journal of Management, 27(1), 3–21.
Getz, D., O’Neil, M., & Carlsen, J. (2001). Service quality evaluation at events through
service mapping. Journal of Travel Research, 39(4), 380-390.
Godar, S., & O’Connor, P. (2001). Same time next year – Buyer trade show motives.
Industrial Marketing Management, 30(1), 77-86.
Gopalakrishna, S., & Lilien, G. (1995). A three-stage model of industrial trade show
performance. Marketing Science, 14(1), 22-42.
Gottlieb, U. R., Brown, M. R., & Drennan, J. (2011). The influence of service quality
and trade show effectiveness on post-show purchase intention. European Journal of
Marketing, 45(11/12), 1642-1659.
Grönroos, C. (1982). Strategic management and marketing in the service sector.
Helsingfors: Swedish School of Economies and Business Administration, Helsinki.
Hambrick, D. C. (2007). Upper echelons theory: An update. Academy of Management
Review, 32(2), 334-343.
Hansen, K. (2004). Measuring performance at trade shows: Scale development and
validation. Journal of Business Research, 57(1), 1-13.
Hansen, K. (1999). Trade show performance: A conceptual framework and its
implications for future research. Academy of Marketing Science Review, 8, 1–21.
142
Hu, L., & Bentler, P. M. (1998). Fit indices in covariance structure modeling: Sensitivity
to underparameterized model misspecification. Psychological Methods, 3(4), 424–
453.
Hu, L., & Bentler, P. M. (1995). Evaluating model fit. In R. Hoyle (Ed.), Structural
equation modeling: Concepts, issues and application (pp. 76–99). Thousand Oak,
CA: Sage Publications.
Hutchinson, D., Wellington, W. J., Saad, M., & Cox, P. (2011). Refining value-based
differentiation in business relationships: A study of the higher order relationship
building blocks that influence behavioural intentions. Industrial Marketing
Management, 40(3), 465-478.
Jin, X., & Weber, K. (2013). Developing and testing a model of exhibition brand
preference: The exhibitors’ perspective. Tourism Management, 38, 94-104.
Jin, X., Weber, K., & Bauer, T. (2012). Relationship quality between exhibitors and
organizers: A perspective from Mainland China’s exhibition industry. International
Journal of Hospitality Management, 31(4), 1222-1234.
Jung, M. (2005). Determinants of exhibition service quality as perceived by attendees.
Journal of Convention & Event Tourism, 7(3-4), 85-98.
Kang, J., & Schrier, T. (2011). The decision-making process of tradeshow exhibitors:
The effects of social value, company size, and prior experience on satisfaction and
behavioral intentions. Journal of Convention & Event Tourism, 12(2), 65-85.
Kerin, R., & Cron, W. (1987). Assessing trade show functions and performance: An
exploratory study. Journal of Marketing, 51(3), 87-94.
143
Kijewski, V., Yoon, E., & Young, G. (1993). How exhibitors select trade shows.
Industrial Marketing Management, 22(4), 287-298.
Kline, R. B. (1998). Principles and practice of structural equation modeling. New York:
The Guilford Press.
Kumar, A., & Grisaffe, D. B. (2004). Effects of extrinsic attributes on perceived quality,
customer value, and behavioral intentions in B2B settings: A comparison across
goods and service industries. Journal of Business-to-Business Marketing, 11(4), 43-
74.
Lee, J. & Beeler, C. (2009). An investigation of predictors of satisfaction and future
intention: Links to motivation, involvement, and service quality in a local festival.
Event Management, 13(1), 17-29.
Li, L-Y. (2007). Marketing resources and performance of exhibitor firms in trade shows:
A contingent resource perspective. Industrial Marketing Management, 36(3), 360-
370.
Mainardes, E. W., Alves, H., & Raposo, M. (2011). Stakeholder theory: Issues to
resolve. Management Decision, 49(2), 226-252.
Martínez, J. A., & Martínez, L. (2010). Some insights on conceptualizing and measuring
service quality. Journal of Retailing and Consumer Services, 17(1), 29-42.
Munuera, J., & Ruiz, S. (1999). Trade fairs as services: A look at visitors’ objectives in
Spain. Journal of Business Research, 44(1), 17-24.
Mulaik, S.A., James, L.R., Van Alstine, J., Bennet, N., Lind, S., & Stilwell, C.D. (1989),
Evaluation of goodness-of-fit indices for structural equation models. Psychological
Bulletin, 105 (3), 430-45.
144
Oppermann, M., & Chon, K. S. (1997). Convention participation decision-making
process. Annals of Tourism Research, 24(1), 178–191.
Parasuraman, A., Zeithaml, V. A., Berry, L. L. (1985). A conceptual model of service
quality and its implications for future research. Journal of Marketing, 49(4), 41–50.
Rosson, P. J., & Seringhaus, F. H. R. (1995). Visitor and exhibitor interaction at
industrial trade fairs. Journal of Business Research, 32(1), 81-90.
Sashi, M., & Perretty, J. (1992). Do trade shows provide value? Industrial Marketing
Management, 21(3), 249–255.
Seringhaus, F., & Rosson, P. (2004, October). An analysis model for performance
measurement of international trade fair exhibitors. Retrieved from
http://citt.management.dal.ca/Files/pdf’s/DP-198.pdf
Servert, D., Wang, Y., Chen, P. J., & Breiter, D. (2007). Examining the motivation,
perceived performance, and behavioral intentions of convention attendees: Evidence
from a regional conference. Tourism Management, 28(2), 399–408.
Steiger, J. H. (1990). Structural model evaluation and modification: An interval
estimation approach. Multivariate Behavioral Research, 25(2), 173–180.
Tucker, L. R., & Lewis, C. (1973). A reliability coefficient for maximum likelihood
factor analysis. Psychometrika, 38(1), 1–10.
West, S. G., Finch, J. F., & Curran, P. J. (1995). Structural equation models with non-
normal variables: Problems and remedies. Sage Publications, Inc.
Whitfield, J., & Webber, D. J. (2011). Which exhibition attributes create repeat
visitation? International Journal of Hospitality Management, 30(2), 439-447.
145
Yoon, Y., & M. Uysal (2005). An examination of the effects of motivation and
satisfaction on destination loyalty: A structural model. Tourism Management, 26(1),
45-56.
Zhang, H. Q., Leung, V., & Qu, H. (2007). A refined model of factors affecting
convention participation decision-making. Tourism Management, 28(4), 1123-1127.
146
Chapter 5 Conclusion
The overarching purpose of this study was to propose and examine the Visitor-
Exhibitor-Organizer (VEO) conceptual framework on trade show performance. In this
chapter I will review the key findings, discuss the theoretical and managerial implications
of these findings, address the limitations of the study, and point out directions for future
research.
Summary of Key Findings
The VEO Conceptual Framework
Building on stakeholder theory, the empirically supported VEO framework
extends previous research on trade show performance by incorporating all three key
stakeholders in the trade show industry (i.e. visitors, exhibitors, and organizers). The
results suggested that visitors’ and exhibitors’ overall satisfaction with a trade show
consists of three components: satisfaction with self-performance and satisfaction with the
other two key stakeholders, respectively. Specifically, a visitor’s satisfaction with trade
show organizers and exhibitors, along with his/her satisfaction with self-performance,
will positively affect his/her overall satisfaction with a trade show experience. Similarly,
an exhibitor’s satisfaction with trade show organizers and visitors, along with his/her
satisfaction with self-performance, will positively affect his/her overall satisfaction with a
trade show experience. I also found that the VEO framework explained a good portion of
147
variance in visitors’ and exhibitors’ overall satisfaction and positive behavioral intention,
which suggests that the three key stakeholders must be accounted for when evaluating
trade show performance.
Measurement Scale on Exhibitors’ Satisfaction
Prior to this study no researchers have developed and examined specific items to
measure exhibitors’ satisfaction with self-performance, visitors, and organizers
simultaneously in the trade show industry. Thus, a measurement instrument on
exhibitors’ satisfaction was proposed and validated through a pilot test, scale purification
and validation. The final instrument consisted of 46-items that represented 12 sub-
dimensions and 3 dimensions of exhibitors’ satisfaction. Reliability, unidimensionality,
content validity, construct validity, discriminant validity, and predictive validity of the
scale were tested and established using 594 responses from 3 trade shows in China. The
end-product, a 46-item measurement scale on exhibitors’ satisfaction, can be used by
organizers to (a) determine the factors that influence exhibitor’s trade show experience
and (b) market and manage their trade show accordingly.
Determinants of Exhibitors’ Positive Behavioral Intention
Using the 46-item measurement scale on exhibitors’ satisfaction to predict
positive behavioral intention, this study found that satisfaction with self-performance,
satisfaction with organizers, and satisfaction with visitors are significantly and positively
148
related to exhibitors’ positive behavioral intention. Satisfaction with organizers turned
out to be the dominant predictor with a standardized path coefficient of .442 (t-value =
6.161, p = .000) while satisfaction with self-performance and satisfaction with visitors
also positively affected exhibitors’ positive behavioral intention. In combination, these
three dimensions explained approximately 65% of the variance in exhibitors’ positive
behavioral intention.
To control for the effect of different trade shows, the 2013 China International
Games & Amusement Fair was used as the baseline and two dummy variables (i.e.,
app14 and game14) were created to control for the effects of the other two trade shows
(i.e., 2014 China Household Electrical Appliances Trade Fair or app14 and 2014 China
International Games & Amusement Exhibition or game14). Three additional control
variables were used in the study (i.e., job ranking, previous experience with the current
trade show, and previous experience with trade shows in general). The results showed
that previous experience with the current trade show significantly affected exhibitors’
positive behavioral intention, while the other four control variables (i.e., app 14, game 14,
job ranking, previous experience with trade shows in general) were not significant. The
non-significant path coefficients of app 14 and game 14 indicate that the effect of
different trade shows are negligible in the proposed model and the three path coefficients
under examination (i.e., H1, H2, and H3) are almost identical across the three trade
shows. This finding suggests that the proposed model works across a wide range of trade
shows.
149
Theoretical Implications
A major contribution of this study is that it introduces a new approach to
measuring satisfaction in the trade show industry. Previous research on trade shows has
focused on one specific stakeholder and ignored the interactions taking place with other
stakeholders (e.g., Berne & García-Uceda, 2008; Bruhn & Hadwich, 2005; Godar &
O’Connor, 2001; Jin, Weber, & Bauer, 2012; Reinhold, Reinhold, & Schmitz, 2010).
This past approach was problematic because it failed to capture the significant impacts of
all three key stakeholders. Stakeholder theory recognizes that successful performance of a
business is dependent, in part, on the external environment, which is made up of key
stakeholders (Freeman, 1984). One central tenet of stakeholder theory is that successful
strategies need to correspond to the integration of all stakeholder interests rather than the
maximization of one group’s position to the detriment of others (Freeman & McVea,
2001), and the performance of one stakeholder is not only dependent on but also impacts
the performance of other key stakeholders. The results of this study supported
stakeholder theory and indicated that all three dimensions (i.e., satisfaction with self-
performance, organizers, and visitors) had a significant positive effect on exhibitors’
overall satisfaction and positive behavioral intention. Thus, in the future it would be
myopic to focus on only one or two stakeholders when studying trade show performance
because the performance of the three key stakeholders in the trade show industry is
closely linked.
This study also extends previous research on trade show performance analysis.
Hansen (2004) pointed out that theoretical research on trade show performance has been
150
quite limited or nonexistent, as most studies have focused on observational indicators
such as actual sales at the show, number of leads, and attraction efficiency (e.g., Dekimpe
et al., 1997; Gopalakrishna & Lilien, 1995; Kerin & Cron, 1987). Furthermore, as
discussed in Chapter 1, most researchers claimed that their measures are indicators of
performance but failed to support those claims with clear definitions of specific
dimensions or to provide evidence of reliability and validity. This study filled the gap by
proposing a conceptual framework after a comprehensive literature review and
empirically examining the framework at multiple trade shows. The conceptual framework
of trade show performance as well as the reliable and valid scales developed in this study
demonstrated a strong connection between the theoretical and observational levels.
This study also focused on trade show exhibitors and developed and tested the
specific items that contribute to their overall satisfaction and positive behavioral
intention. Based on Hansen’s (2004) five-dimension framework, Brady and Cronin’s
(2001) hierarchical service quality model, and a measurement scale I developed on
satisfaction with visitors, this study started with 51 items representing 3 dimensions that
theoretically contribute to exhibitors’ overall satisfaction. After a pilot test, a main test,
scale purification, and scale validation, a reliable and valid instrument was established
with 17 items relating to satisfaction with organizers, 17 items representing satisfaction
with self-performance, and 12 items for satisfaction with visitors. The resulting
instrument is superior to existing instruments in that it comprehensively measures
exhibitors’ performance at a trade show and explains a large portion of exhibitors’ overall
satisfaction and positive behavioral intention. Specifically, the three dimensions
explained approximately 65% of the variance in exhibitors’ positive behavioral intention,
151
which is higher than the percentage of variance explained in previous studies on this
subject (e.g., Kang & Schrier, 2011). Furthermore, the instrument can provide specific
managerial implications because of the detailed items within the instrument.
Managerial Implications
The successful application of stakeholder theory in the trade show industry calls
for organizers to take a comprehensive approach when evaluating their performance as
well as the performance of their customers (i.e., exhibitors and visitors). Knowing this,
trade show organizers should use the exhibitor satisfaction scale created in this study
when evaluating their trade shows.
Satisfaction with self-performance, satisfaction with organizers, and satisfaction
with visitors contributed significantly to exhibitors’ positive behavioral intention, and are
not beyond organizers’ control. Several factors might cause one exhibitor to be satisfied
with the trade show organizer and the other not, such as motivation for attendance and
inconsistency in service delivery. In order to address these factors, trade show organizers
could start by acknowledging the three sub-dimensions of service quality (i.e., interaction
quality, environment quality, and outcome quality). Then, to improve upon the first sub-
dimension of service quality—exhibitors’ perception of interaction quality—they could
consistently reach out to exhibitors and address any problems that might occur in a timely
manner. Second, organizers could provide the appropriate ambience that exhibitors are
looking for in an effort to improve the second sub-dimension of service quality—
environment quality. And, third, organizers could enhance outcome quality (i.e., the third
152
sub-dimension of service quality) by facilitating follow-up activities that connect
exhibitors with visitors after the trade show and sending out marketing information about
the exhibitors to visitors on a regular basis. As for exhibitors’ self-performance,
organizers need to identify their major objectives and allocate their limited resources
accordingly. There are five major objectives of exhibitors for attending trade shows:
sales, information gathering, relationship building, image building, and motivation
(Hansen, 2004). Organizers need to know about the objectives of their exhibitors and
make sure those objectives get fulfilled during the trade show. Another aspect that
organizers could work on to improve exhibitors’ overall satisfaction is to enhance the
quality of visitors (Jin & Weber, 2013). The results of this study indicated that visitors’
job ranking, job function, purchase authority, and community quality all positively
affected exhibitors’ overall satisfaction and positive behavioral intention. Thus,
organizers should make every effort to attract a large number of high quality visitors with
decision making and purchasing power. They also should make sure that exhibitors have
enough opportunities to communicate with visitors prior to, during and after the trade
show.
Trade show organizers have the flexibility to customize the measurement
instrument tested in this study to fit their particular trade show. Since trade show
exhibitors are mostly executives with limited time to spare, organizers could ask their
exhibitors’ satisfaction level with the 12 sub-dimensions (i.e., sales, information
gathering, relationship building, image building, motivation, interaction, environment,
outcome, job level, job function, purchase authority, and communication) rather than the
full model with 46 items. If a particular sub-dimension turned out to be problematic, the
153
organizers could follow up with exhibitors with the specific items within that sub-
dimension.
Limitations and Direction for Future Research
The three key stakeholders in the trade show industry (i.e., visitors, exhibitors,
and organizers) were included in this study’s measure of trade show performance.
However, there are other stakeholders that might influence exhibitors’ satisfaction level
and positive behavioral intention. For example, an exhibitor’ perception of other
exhibitors might influence his or her perception of the trade show experience. One
objective for exhibitors to attend trade shows is to demonstrate their leading role in the
industry by exhibiting along with other high profile companies. Furthermore, an overall
high quality pool of exhibitors would attract more high quality visitors, which in turn
would improve exhibitors’ overall satisfaction. Thus, perception of fellow exhibitors
could be a potential predictor of exhibitors’ overall satisfaction and positive behavioral
intention.
Data on exhibitors’ “perception of their fellow exhibitors” were collected by
asking them to respond to the following five statements: 1) “the other exhibitors are well-
respected companies in the industry,” 2) “the other exhibitors are leading companies in
the industry,” 3) “the other exhibitors attract more visitors to the trade show,” 4) “most of
our competitors are exhibiting at the trade show,” and 5) “we learned something from our
fellow exhibitors.” This subscale turned out to be reliable with a Cronbach’s alpha of
.904. However, when added into the structural equation model with the other three
154
dimensions, the goodness-of-fit statistics of the model went from satisfactory to
unacceptable and the standardized path coefficients from “perception of fellow
exhibitors” to “overall satisfaction” was not significant. It is possible that the strong
effects of the other three dimensions suppressed the effect of “perception of fellow
exhibitors” (Hair, Black, Babin, & Anderson, 2009). A similar phenomenon could be
seen in a study conducted by Jin and Weber (2013) who found that the relationship
between destination attractiveness and exhibition brand preference was suppressed by the
strong effect of relationship quality. Another possibility is that exhibitors’ perception of
fellow exhibitors might not contribute to exhibitors’ positive behavioral intention at all.
Since there has been no previous research on interactions between exhibitors, a
qualitative study would be really helpful to identify the key factors that constitute
exhibitors’ perception of fellow exhibitors. For example, researchers could conduct semi-
structured interviews with trade show exhibitors by asking them to rate a list of
statements on this dimension and leave open-end comments on the validity of these
statements. Then a series of scale development procedures could be conducted to
establish the reliability and validity of the measurement instrument. Once the instrument
is established, researchers could apply the instrument at multiple trade shows and study
the effect of fellow exhibitors on exhibitors’ overall satisfaction and positive behavioral
intention.
Second, only positive behavioral intention rather than a combination of positive
behavioral intention and actual behavior were measured. Previous research has shown
that the strength of correlation between positive behavioral intention to actual behavior
ranges between .41 and .53 (O’Keefe, 2002). Hence, there may be other factors that could
155
potentially influence actual behavior and “intent” should be cautiously used in future
planning. The temporal stability of intention (Ajzen & Fishbein, 1980) and the degree to
which the behavior was planned (Sheeran, Orbell, & Trafimow, 1999) are known to
influence the conversion rate from intention to behavior. In the case of the trade show
industry, external factors such as budget cuts, time conflict, new management, and
changes in strategy might influence exhibitors’ decision to return during the one-year or
six-month gap between trade shows2. Hence, the discrepancy between positive
behavioral intention and actual behavior and the factors that contribute to the discrepancy
are worth investigating. Future studies should adopt a longitudinal design and study the
factors that impact exhibitors’ positive behavioral intention as well as actual behavior.
Since email follow-up surveys generally receive low response rate (Baruch, 1999),
researchers could utilize the face-to-face post-show evaluation organizers conduct after
each trade show to collect data on exhibitors’ satisfaction and positive behavioral
intention. Using the data of previous trade show as the baseline, researchers could use
time series analysis techniques to tell whether or not exhibitors are actually coming back
and the dimensions of satisfaction that contribute most to exhibitors’ actual behavior.
Third, there is a discrepancy in the research findings. In Chapter 2, self-
performance was the strongest predictor of exhibitors’ and visitors’ overall satisfaction
and positive behavioral intention. However, in Chapters 3 and 4, satisfaction with
organizers (i.e., service quality) was the strongest predictor of exhibitors’ satisfaction and
positive behavioral intention. Several factors might be contributing to this discrepancy.
2 I attempted to collect data on exhibitors’ actual behavior three months after the trade
show, but the endeavor was abandoned because of a very low response rate.
156
First, in Chapter 2 data from a semiconductor trade show held in the United States were
used. In Chapters 3 and 4 data from four trade shows in China were used. The difference
in culture and type of trade show might have impacted the relative strength of the three
dimensions of the VEO framework. Second, the use of different survey instruments may
explain the discrepancy in results. In Chapter 2, single-item constructs were employed in
the visitor model and two-item or three-item constructs were used in the exhibitor model.
Following a pilot test and scale purification and validation, a comprehensive
measurement scale with 46-items was adopted for the data collected and reported on in
Chapters 3 and 4. This variation in measurement instruments might contribute to the
difference in standardized path coefficients.
Fourth, the two control variables for the different trade shows were not-significant
in the proposed model on exhibitors’ positive behavioral intention, which suggests that
the effects of different trade shows are negligible and the three-dimension measurement
instrument should work across a wide range of trade shows. To fully establish the
invariance of the measurement instrument across trade shows in different industries,
multi-group analysis was conducted. Constraints were placed on a sequence of models to
examine equal structural weights across the three trade shows. Model 1 corresponds to
the baseline unconstrained model; Model 2 corresponds to equal factor loadings model;
Model 3 corresponds to equal factor loadings and equal measurement intercepts model;
and Model 4 corresponds to equal factor loadings, equal measurement intercepts, and
equal structural weights. A factor loading invariance would indicate that the loadings for
each factor are not significantly different from each other and a measurement invariance
would indicate that the model fit indices are not significant when factor loadings are
157
constrained to be equal across all subgroups. Similarly, structural weights invariance
would indicate that the standardized path coefficients are not significantly different from
each other (Byrne, 2004). Stepwise comparisons on chi-square differences in relation to
changes in degrees of the freedom of the unconstrained model could indicate where the
invariance is achieved.
Since structural equation multi-group analysis has been found to be highly
sensitive to sample size (Meade, Johnson, & Braddy, 2008), change in Tucker-Lewis
Index (TLI) rather than chi square test was used to examine the invariance (Casper,
Bocarro, Kanters, & Floyd, 2011). A TLI change less than or equal to 0.01 suggests that
invariance of an instrument should not be rejected (Byrne, 2008). Thus, if the p value of
the chi square test is lower than .05 but the TLI change is less than .01, there is evidence
for the invariance of the parameters between groups (Casper et al., 2011).
Table 1 lists the multi-group analysis results. All TLI changes are within the .01
cutoff value, which suggests that invariance was achieved at all three levels (i.e.,
measurement weights, measurement intercepts, and structural weights). To further
establish the invariance of the instrument, future studies should include more trade shows
in the sample. Previous research has indicated that type and location of events have a
significant effect on participants’ experience (Oppermann & Chon, 1997; Tkaczynski &
Rundle-Thiele, 2011). Thus, data should be collected from exhibitors attending trade
shows for other industries as well as trade shows in other geographical locations.
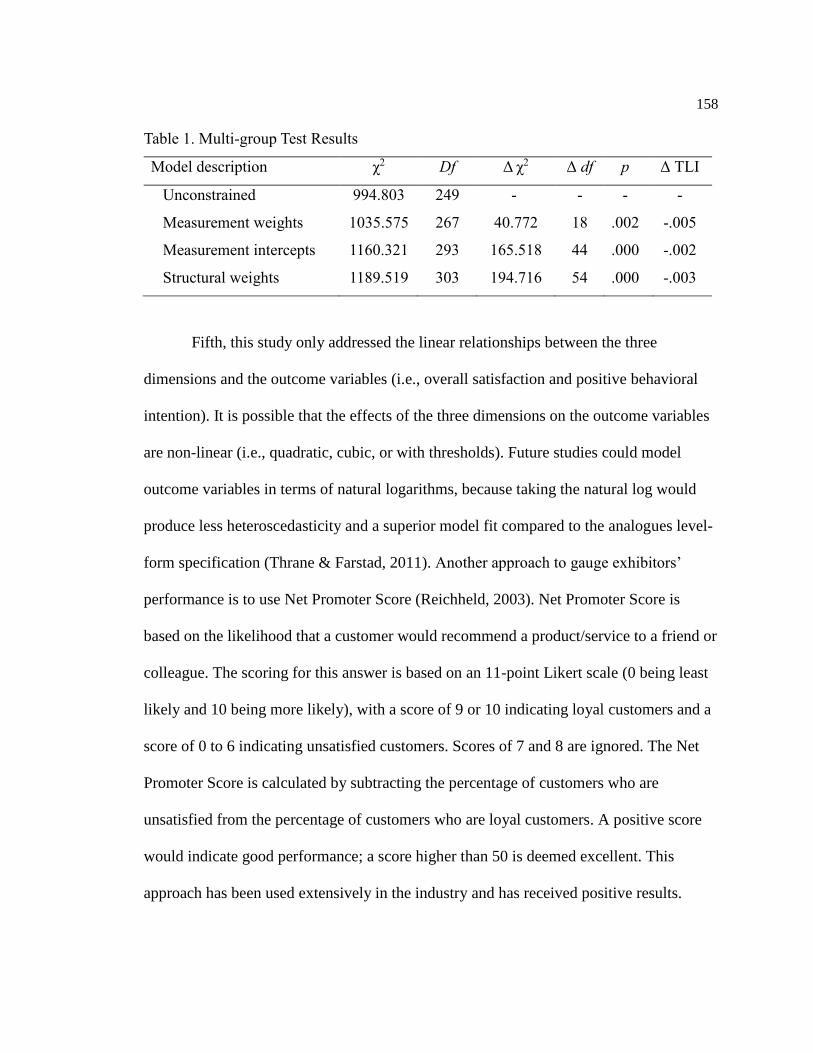
158
Table 1. Multi-group Test Results
Model description χ2 Df Δ χ2 Δ df p Δ TLI
Unconstrained 994.803 249 - - - -
Measurement weights 1035.575 267 40.772 18 .002 -.005
Measurement intercepts 1160.321 293 165.518 44 .000 -.002
Structural weights 1189.519 303 194.716 54 .000 -.003
Fifth, this study only addressed the linear relationships between the three
dimensions and the outcome variables (i.e., overall satisfaction and positive behavioral
intention). It is possible that the effects of the three dimensions on the outcome variables
are non-linear (i.e., quadratic, cubic, or with thresholds). Future studies could model
outcome variables in terms of natural logarithms, because taking the natural log would
produce less heteroscedasticity and a superior model fit compared to the analogues level-
form specification (Thrane & Farstad, 2011). Another approach to gauge exhibitors’
performance is to use Net Promoter Score (Reichheld, 2003). Net Promoter Score is
based on the likelihood that a customer would recommend a product/service to a friend or
colleague. The scoring for this answer is based on an 11-point Likert scale (0 being least
likely and 10 being more likely), with a score of 9 or 10 indicating loyal customers and a
score of 0 to 6 indicating unsatisfied customers. Scores of 7 and 8 are ignored. The Net
Promoter Score is calculated by subtracting the percentage of customers who are
unsatisfied from the percentage of customers who are loyal customers. A positive score
would indicate good performance; a score higher than 50 is deemed excellent. This
approach has been used extensively in the industry and has received positive results.
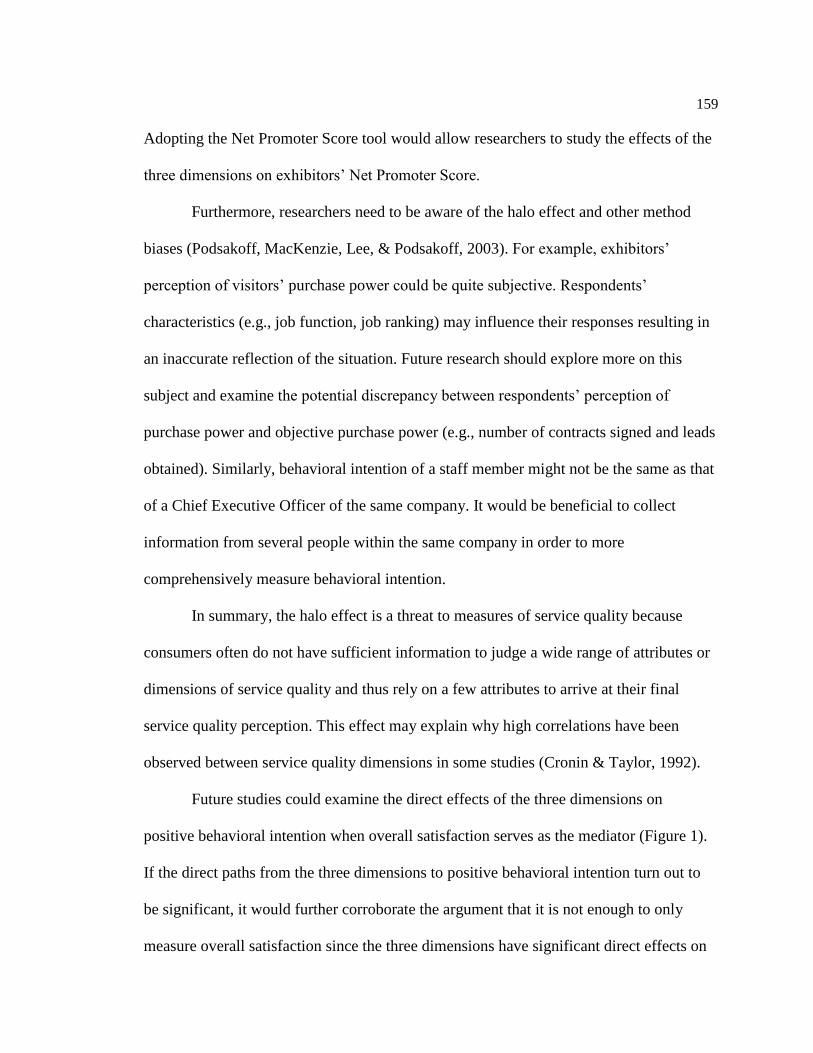
159
Adopting the Net Promoter Score tool would allow researchers to study the effects of the
three dimensions on exhibitors’ Net Promoter Score.
Furthermore, researchers need to be aware of the halo effect and other method
biases (Podsakoff, MacKenzie, Lee, & Podsakoff, 2003). For example, exhibitors’
perception of visitors’ purchase power could be quite subjective. Respondents’
characteristics (e.g., job function, job ranking) may influence their responses resulting in
an inaccurate reflection of the situation. Future research should explore more on this
subject and examine the potential discrepancy between respondents’ perception of
purchase power and objective purchase power (e.g., number of contracts signed and leads
obtained). Similarly, behavioral intention of a staff member might not be the same as that
of a Chief Executive Officer of the same company. It would be beneficial to collect
information from several people within the same company in order to more
comprehensively measure behavioral intention.
In summary, the halo effect is a threat to measures of service quality because
consumers often do not have sufficient information to judge a wide range of attributes or
dimensions of service quality and thus rely on a few attributes to arrive at their final
service quality perception. This effect may explain why high correlations have been
observed between service quality dimensions in some studies (Cronin & Taylor, 1992).
Future studies could examine the direct effects of the three dimensions on
positive behavioral intention when overall satisfaction serves as the mediator (Figure 1).
If the direct paths from the three dimensions to positive behavioral intention turn out to
be significant, it would further corroborate the argument that it is not enough to only
measure overall satisfaction since the three dimensions have significant direct effects on
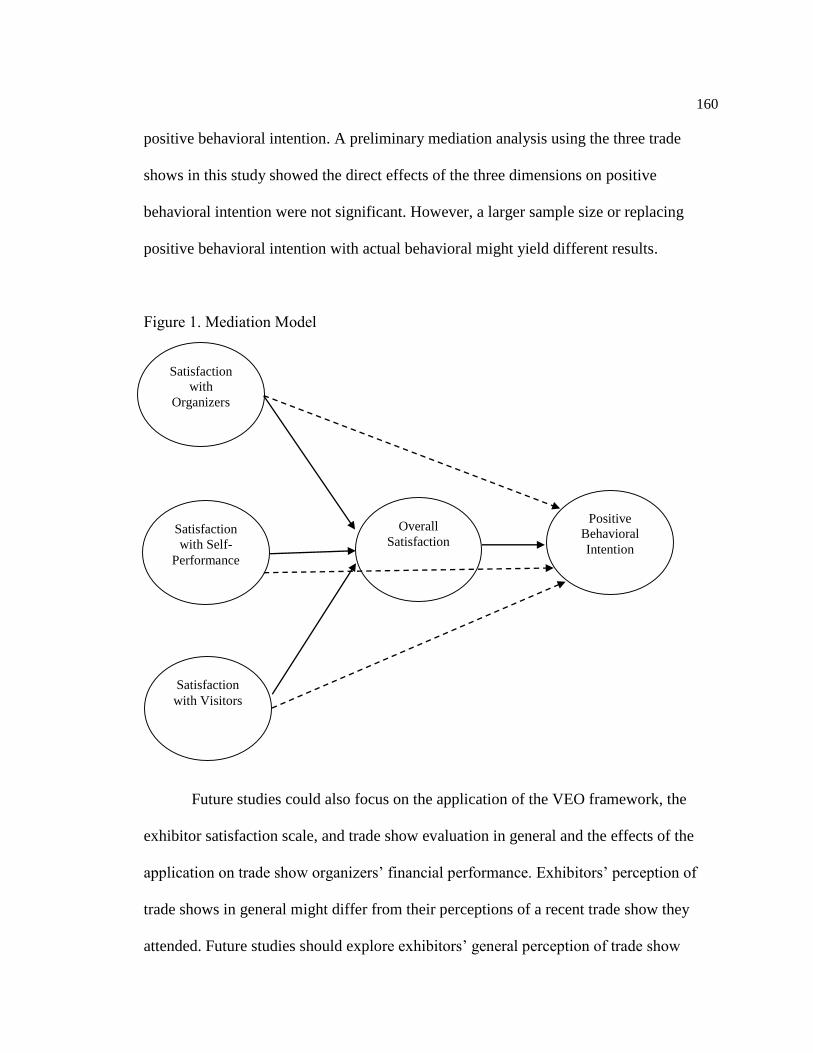
160
positive behavioral intention. A preliminary mediation analysis using the three trade
shows in this study showed the direct effects of the three dimensions on positive
behavioral intention were not significant. However, a larger sample size or replacing
positive behavioral intention with actual behavioral might yield different results.
Figure 1. Mediation Model
Future studies could also focus on the application of the VEO framework, the
exhibitor satisfaction scale, and trade show evaluation in general and the effects of the
application on trade show organizers’ financial performance. Exhibitors’ perception of
trade shows in general might differ from their perceptions of a recent trade show they
attended. Future studies should explore exhibitors’ general perception of trade show
Satisfaction
with
Organizers
Satisfaction
with Self-
Performance
Overall
Satisfaction
Positive
Behavioral
Intention
Satisfaction
with Visitors
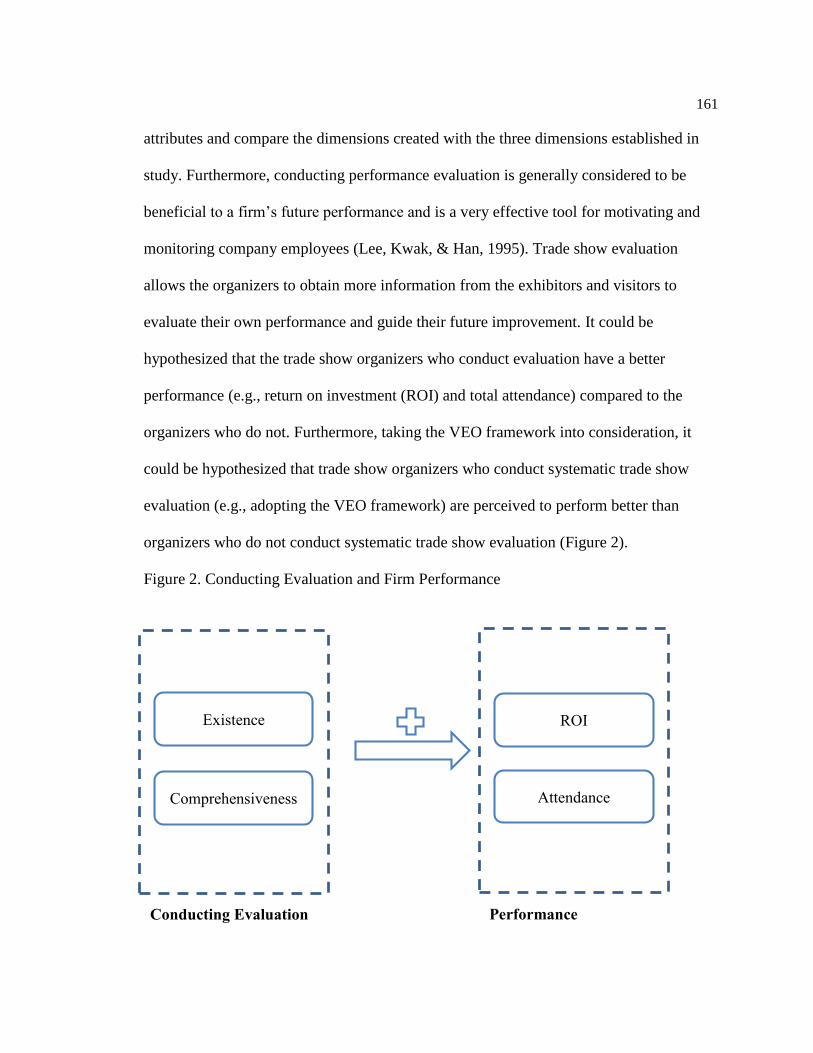
161
attributes and compare the dimensions created with the three dimensions established in
study. Furthermore, conducting performance evaluation is generally considered to be
beneficial to a firm’s future performance and is a very effective tool for motivating and
monitoring company employees (Lee, Kwak, & Han, 1995). Trade show evaluation
allows the organizers to obtain more information from the exhibitors and visitors to
evaluate their own performance and guide their future improvement. It could be
hypothesized that the trade show organizers who conduct evaluation have a better
performance (e.g., return on investment (ROI) and total attendance) compared to the
organizers who do not. Furthermore, taking the VEO framework into consideration, it
could be hypothesized that trade show organizers who conduct systematic trade show
evaluation (e.g., adopting the VEO framework) are perceived to perform better than
organizers who do not conduct systematic trade show evaluation (Figure 2).
Figure 2. Conducting Evaluation and Firm Performance
Existence
Comprehensiveness ROI
Attendance Conducting Evaluation
ROI
Attendance
Performance
162
References
Ajzen, I., & Fishbein, M. (1980). Understanding attitudes and predicting social behavior.
Englewood Cliffs, NJ: Prentice-Hall.
Baruch, Y. (1999). Response rate in academic studies: A comparative analysis. Human
Relations, 52(4), 421-438.
Berne, C., & García-Uceda, M. (2008). Criteria involved in evaluation of trade shows to
visit. Industrial Marketing Management, 37(5), 565-579.
Brady, M.K. & Cronin, J.J. (2001). Some new thoughts on conceptualizing perceived
service quality: A hierarchical approach. Journal of Marketing, 65(3), 34-49.
Bruhn, M., & Hadwich, K. (2005). Managing the service quality of trade fairs. In M.
Kirchgeorg (Ed.), Trade show management: Planning, implementing and
controlling of trade shows, conventions and events (pp. 787-821). Gabler Verlag.
Byrne, B. M. (2004). Testing for multigroup invariance using AMOS Graphics: A road
less traveled. Structural Equation Modeling, 11(2), 272-300.
Byrne, B. M. (2008). Structural equation modeling with Amos: Basic concepts,
applications and programming (2nd ed.). Hillsdale, NJ: Erlbaum.
Casper, J. M., Bocarro, J. N., Kanters, M. A., & Floyd, M. F. (2011). Measurement
properties of constraints to sport participation: A psychometric examination with
adolescents. Leisure Science, 33(2), 127-146.
Cronin, J. J., & Taylor, S. A. (1992). Measuring service quality: A reexamination and
extension. Journal of Marketing, 56(3), 55-68.
163
Freeman, R. (1984). Strategic management: A stakeholder’s approach. Boston, MA:
Pitman.
Freeman, R. & McVea, J. (2001). “A stakeholder approach to strategic management”, in
Hitt, M., Freeman, R. & Harrison, J. (Eds), The Blackwell Handbook of Strategic
Management. Oxford: Blackwell Business, 189-207.
Godar, S., & O’Connor, P. (2001). Same time next year – Buyer trade show motives.
Industrial Marketing Management, 30(1), 77-86.
Hair, J., Black, W. C., Babin, B. J., & Anderson, R. E. (2009). Multivariate data analysis
(7th ed.). Prentice-Hall.
Hansen, K. (2004). Measuring performance at trade shows: Scale development and
validation. Journal of Business Research, 57(1), 1-13.
Jin, X., & Weber, K. (2013). Developing and testing a model of exhibition brand
preference: The exhibitors’ perspective. Tourism Management, 38, 94-104.
Jin, X., Weber, K., & Bauer, T. (2012). Relationship quality between exhibitors and
organizers: A perspective from Mainland China’s exhibition industry.
International Journal of Hospitality Management, 31(4), 1222-1234.
Jung, M. (2005). Determinants of exhibition service quality as perceived by attendees.
Journal of Convention & Event Tourism, 7(3-4), 85-98.
Lee, J. & Beeler, C. (2009). An investigation of predictors of satisfaction and future
intention: Links to motivation, involvement, and service quality in a local festival.
Event Management, 13(1), 17-29.
164
Lee, H., Kwak, W., & Han, I. (1995). Developing a business performance evaluation
system: An analytic hierarchical model. The Engineering Economist, 40(4), 343-
357.
Meade, A. W., Johnson, E. C., & Braddy, P. W. (2008). Power and sensitivity of
alternative fit indices in tests of measurement invariance. Journal of Applied
Psychology, 93(3), 568–592.
O’Keefe, D.J. (2002). Persuasion: Theory and research. Beverly Hills, CA: Sage.
Oppermann, M., & Chon, K. S. (1997). Convention participation decision-making
process. Annals of Tourism Research, 24(1), 178–191.
Podsakoff, P. M., MacKenzie, S. B., Lee, J-Y., & Podsakoff, N. P. (2003). Common
method biases in behavioral research: A critical review of the literature and
recommended remedies. Journal of Applied Psychology, 88(5), 879-903.
Reichheld, F. F. (2003). The one number you need to grow. Harvard Business Review,
81(12), 33-44.
Reinhold, M., Reinhold, S., & Schmitz, C. (2010). Exhibitor satisfaction in business-to-
business trade shows: Understanding performance patterns from Vavra’s
Importance Grid perspective. In EMAC 2010. Brüssel: European Marketing
Academy.
Sheeran, P., Orbell, S., & Trafimow, D. (1999). Does the temporal stability of behavioral
intention moderate intention-behavior and past behavior-future behavior
relations? Personality and Social Psychology Bulletin, 25(6), 721-730.
Thrane, C., & Farstad, E. (2011). Domestic tourism expenditures: The non-linear effects
of length of stay and travel party size. Journal of Travel Research, 32(1), 46-52.
165
Tkaczynski, A., & Rundle-Thiele, S. R. (2011). Event segmentation: A review and
research agenda. Tourism Management, 32(2), 426-434.
Zhang, H., Leung, V., & Qu, H. (2007). A Refined Model of Factors Affecting
Convention Participation Decision Making. Tourism Management, 28(4), 1123-
1127.
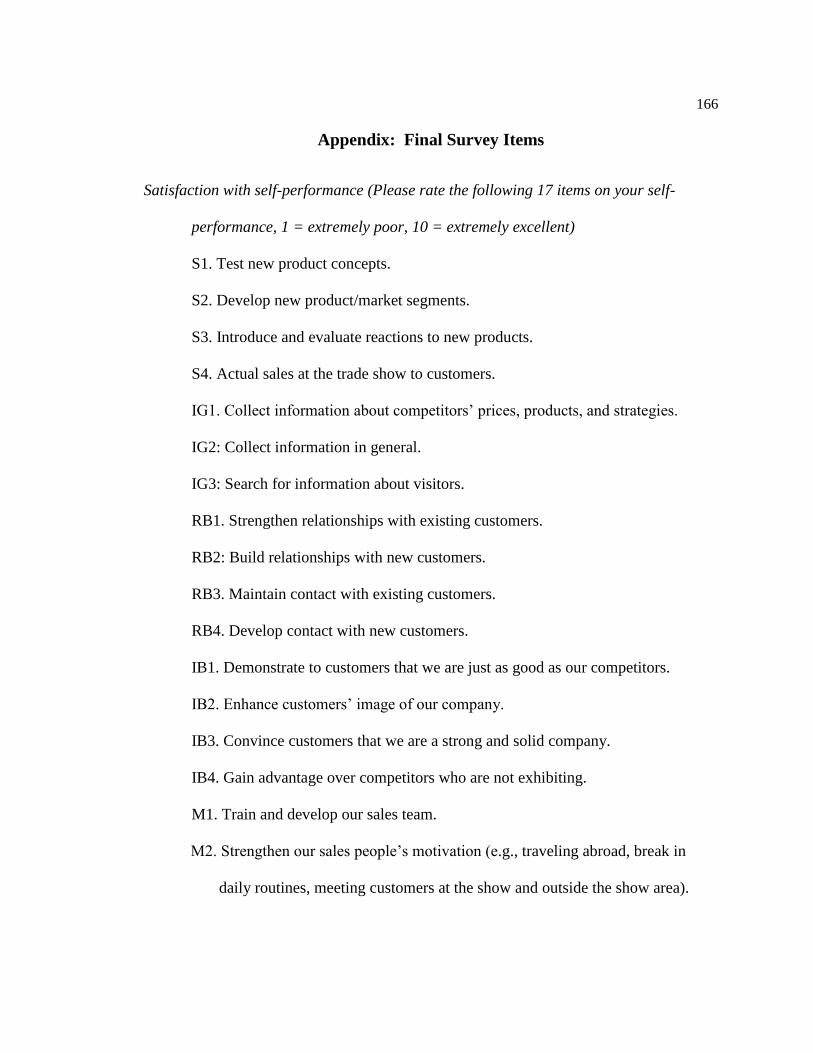
166
Appendix: Final Survey Items
Satisfaction with self-performance (Please rate the following 17 items on your self-
performance, 1 = extremely poor, 10 = extremely excellent)
S1. Test new product concepts.
S2. Develop new product/market segments.
S3. Introduce and evaluate reactions to new products.
S4. Actual sales at the trade show to customers.
IG1. Collect information about competitors’ prices, products, and strategies.
IG2: Collect information in general.
IG3: Search for information about visitors.
RB1. Strengthen relationships with existing customers.
RB2: Build relationships with new customers.
RB3. Maintain contact with existing customers.
RB4. Develop contact with new customers.
IB1. Demonstrate to customers that we are just as good as our competitors.
IB2. Enhance customers’ image of our company.
IB3. Convince customers that we are a strong and solid company.
IB4. Gain advantage over competitors who are not exhibiting.
M1. Train and develop our sales team.
M2. Strengthen our sales people’s motivation (e.g., traveling abroad, break in
daily routines, meeting customers at the show and outside the show area).
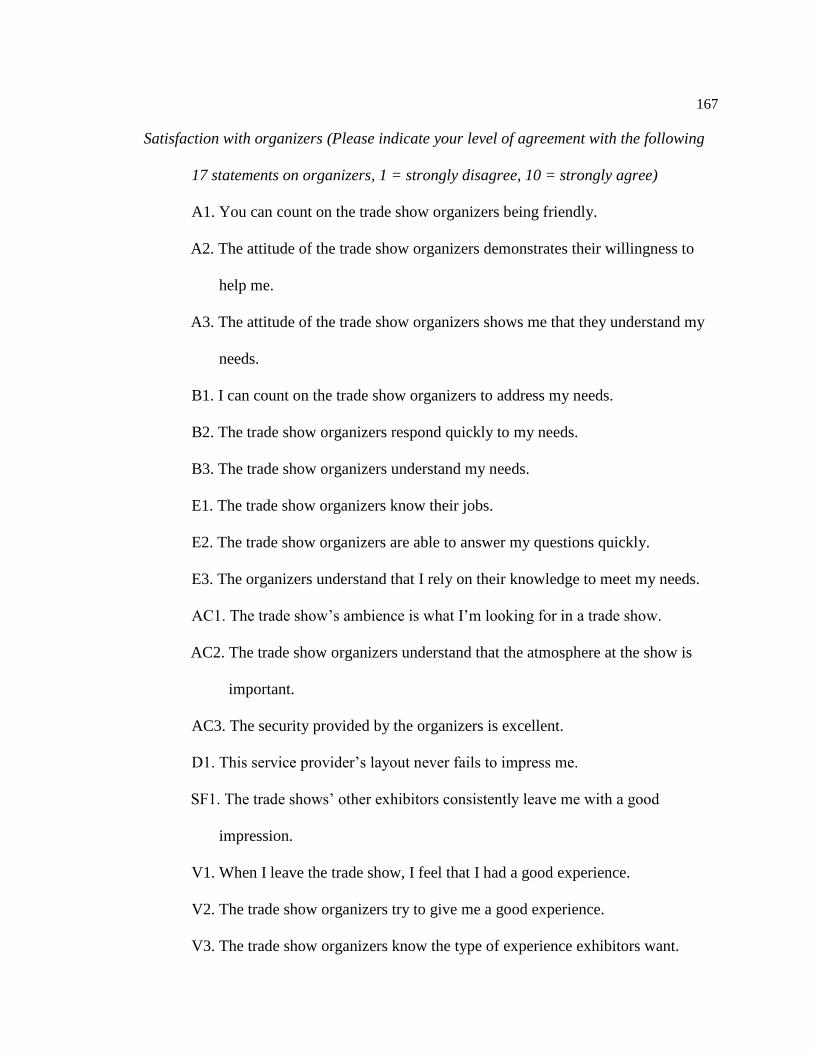
167
Satisfaction with organizers (Please indicate your level of agreement with the following
17 statements on organizers, 1 = strongly disagree, 10 = strongly agree)
A1. You can count on the trade show organizers being friendly.
A2. The attitude of the trade show organizers demonstrates their willingness to
help me.
A3. The attitude of the trade show organizers shows me that they understand my
needs.
B1. I can count on the trade show organizers to address my needs.
B2. The trade show organizers respond quickly to my needs.
B3. The trade show organizers understand my needs.
E1. The trade show organizers know their jobs.
E2. The trade show organizers are able to answer my questions quickly.
E3. The organizers understand that I rely on their knowledge to meet my needs.
AC1. The trade show’s ambience is what I’m looking for in a trade show.
AC2. The trade show organizers understand that the atmosphere at the show is
important.
AC3. The security provided by the organizers is excellent.
D1. This service provider’s layout never fails to impress me.
SF1. The trade shows’ other exhibitors consistently leave me with a good
impression.
V1. When I leave the trade show, I feel that I had a good experience.
V2. The trade show organizers try to give me a good experience.
V3. The trade show organizers know the type of experience exhibitors want.
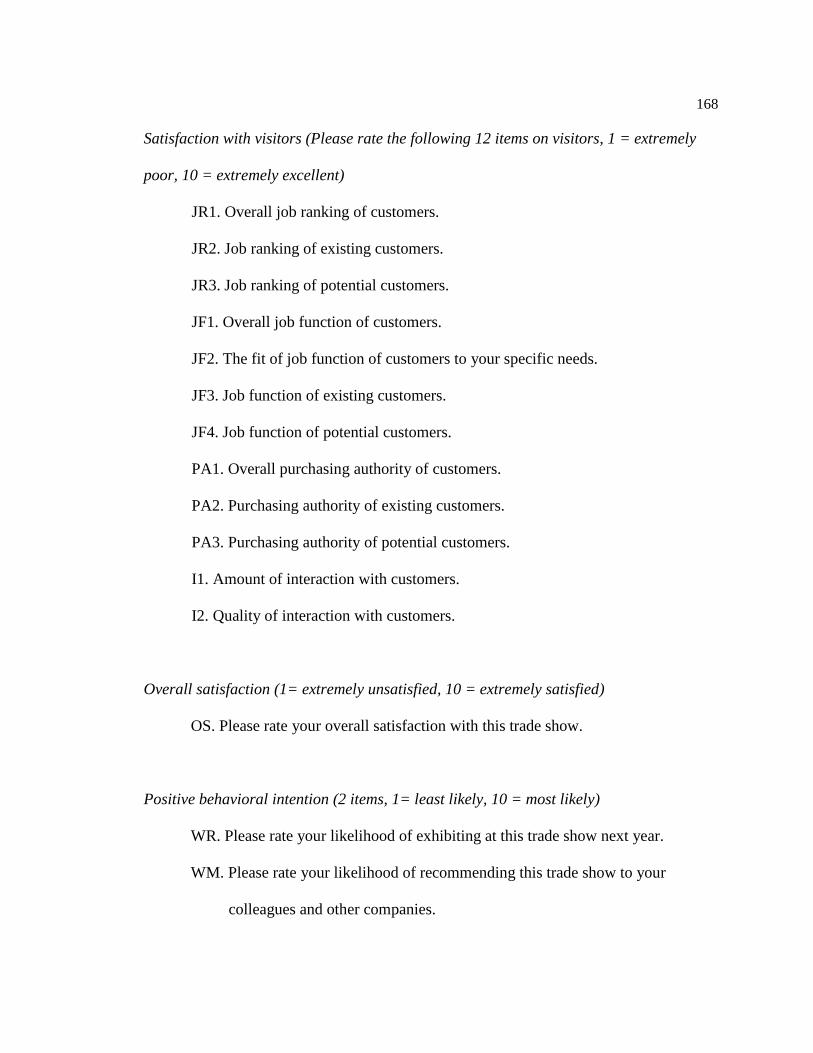
168
Satisfaction with visitors (Please rate the following 12 items on visitors, 1 = extremely
poor, 10 = extremely excellent)
JR1. Overall job ranking of customers.
JR2. Job ranking of existing customers.
JR3. Job ranking of potential customers.
JF1. Overall job function of customers.
JF2. The fit of job function of customers to your specific needs.
JF3. Job function of existing customers.
JF4. Job function of potential customers.
PA1. Overall purchasing authority of customers.
PA2. Purchasing authority of existing customers.
PA3. Purchasing authority of potential customers.
I1. Amount of interaction with customers.
I2. Quality of interaction with customers.
Overall satisfaction (1= extremely unsatisfied, 10 = extremely satisfied)
OS. Please rate your overall satisfaction with this trade show.
Positive behavioral intention (2 items, 1= least likely, 10 = most likely)
WR. Please rate your likelihood of exhibiting at this trade show next year.
WM. Please rate your likelihood of recommending this trade show to your
colleagues and other companies.
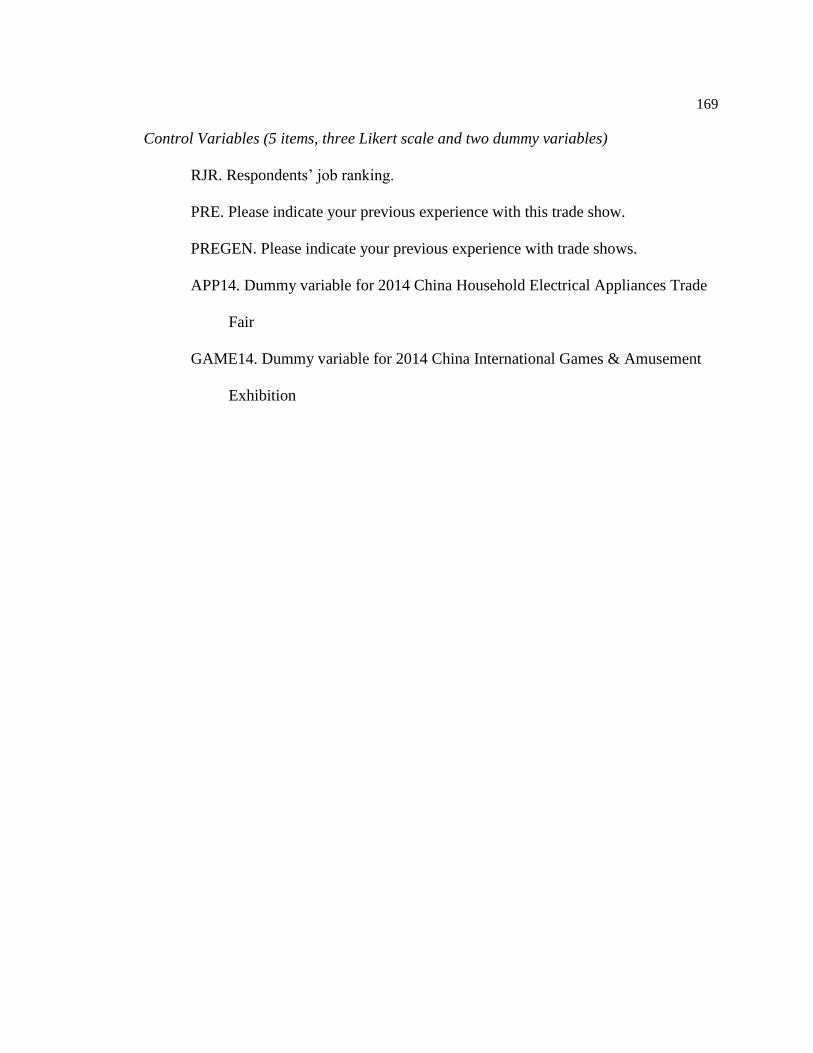
169
Control Variables (5 items, three Likert scale and two dummy variables)
RJR. Respondents’ job ranking.
PRE. Please indicate your previous experience with this trade show.
PREGEN. Please indicate your previous experience with trade shows.
APP14. Dummy variable for 2014 China Household Electrical Appliances Trade
Fair
GAME14. Dummy variable for 2014 China International Games & Amusement
Exhibition
170
VITA
Yeqiang Lin
EDUCATION
The Pennsylvania State University
Ph.D. in Recreation, Park, and Tourism Management, August 2014
California State University, Chico M.A. in Recreation, Hospitality and Parks Management, May 2010
Beijing International Studies University
B.A. in Tourism Management, June 2008
PUBLICATIONS
Chang, P., Wray, L., & Lin, Y. (2014). Social relationships, leisure activity, and health in
Older Adults. Health Psychology, 33(6), 516-523.
Lin, Y., Kerstetter, D. Nawijn, J., & Mitas, O. (2014). Changes in emotions and their
interactions with personality in a vacation context. Tourism Management, 40,
416-424.
Lin, Y. (2013). A critical review of social impacts of mega-events. International Journal
of Sport and Society, 3(3), 57-64.
Nawijn, J., Mitas, O., Lin, Y., & Kerstetter, D. (2013). How do we feel on vacation? A
closer look at how emotions change over the course of a trip. Journal of Travel
Research, 52(2), 265-274.
Lin, Y. (2011). An exploratory study of organizer-oriented post-show evaluation. Peking
University Cultural Industries Review, 3, 276-303.
SELECTED PROFESSIONAL PRESENTATIONS
Qiu, Y., Lin, Y., & Mowen, A. Constraints to leisure-time physical activity across
different stages of participation: A study of Chinese women. Paper presented at
the Northeastern Recreation Research Symposium, Cooperstown, NY, April 2014.
Lin, Y. A critical review of social impacts of mega-events. Virtual presentation at the
Sport and Society Conference, Cambridge, UK, July 2012.
Lin, Y. Kerstetter, D., Nawijn, J., & Mitas, O. Tourists' emotions: A longitudinal study.
Paper presented at the Travel and Tourism Research Association Annual
Conference, Virginia Beach, Virginia, June 2012.
Lin, Y. An exploratory study of organizer-oriented post-show evaluation. Paper
presented at the International Doctoral Workshop on Cultural Industries, Beijing,
China, July 2010.
TEACHING EXPERIENCE
Program Evaluation and Research in Recreation Services, Penn State University