Embed Size (px)
Citation preview
A Threat-Vulnerability Based Risk Analysis Model for Cyber Physical
System Security
Lehlogonolo Ledwaba1, 2
1 Meraka Institute, Council for Scientific and
Industrial Research, Pretoria, 0184, South Africa
H.S. Venter2
2 Department of Computer Science, University of
Pretoria, Pretoria, 0083, South Africa
Abstract
The ability to network machinery and devices that
are otherwise isolated is highly attractive to industry.
This has led to growth in the use of cyber-physical
systems (CPSs) with existing infrastructure. However,
coupling physical and cyber processes leaves CPSs
vulnerable to security attacks. A threat-vulnerability
based risk model is developed through a detailed
analysis of CPS security attack structures and threats.
The Stuxnet malware attack is used to test the viability
of the proposed model. An analysis of the Natanz
system shows that, with an actual case security-risk
score at Mitigation level 5, the infested facilities barely
avoided a situation worse than the one which occurred.
The paper concludes with a discussion on the need for
risk analysis as part of CPS security and highlights the
future work of modelling and comparing existing
security solutions using the proposed model so to
identify the sectors where CPS security is still lacking.
1. Introduction
In recent years, the advent of the Internet of Things
has seen industrial applications moving from wired
networking interfaces towards wireless and hybrid
networking solutions. One such example is a cyber-
physical system (CPS) which uses a combination of
sensors, actuators, communication networks and cyber
processing to facilitate learning, decision-making and
self-actuation in multiple domains. CPSs tightly
integrate cyber and physical processes; introducing
new security challenges and vulnerabilities. With the
increasing prevalence of cyber-crime, the protection of
industrial and infrastructural networks is of an
increasingly growing priority.
The development of efficient CPS security
solutions is made difficult by the complexities and
challenges unique to these networks. One example of
this is the limited computing resources available to
CPS devices. Security solutions need to be able to
account for the tight constraints and work efficiently
and effectively without the complete depletion of
available resources. It is therefore necessary to
thoroughly investigate CPS architecture, the
application domains in which a CPS may be utilised
and the security challenges that need to be addressed in
order to facilitate the development of specialised
security solutions.
CPSs have security challenges different to those
found in traditional IT systems. Attempts at mapping
solutions from other sectors of networking such as
sensor networks have been made with various degrees
of success; however, as the solutions were not
originally intended for CPSs, they often fail to meet all
the security needs required by the system [23]. To this
end, an analysis of the security holes occurring within
CPSs is needed in order to identify in which areas a
CPS is affected by a security attack and the extent of
potential damage that may occur in the event of a
successful attack
The main problem faced is in understanding the
detailed operation interactions of the physical and
cyber processes within a CPS and how they contribute
to introducing security vulnerabilities. This
understanding is necessary in order to develop
successful security solutions that are able to provide
maximum system security with minimum overhead.
CPS security frameworks and architectures need to be
to incorporate a variety of needs at the design level
such as the precision required by the computing
applications in a CPS for interfacing with the
uncertainty and noise generated in a physical
environment. For the context of this research, noise is
defined as the random variation that may be present in
measured values owing to interferences from the
physical environment and the inherent manufacturing
differences between components and devices. The
occurrence of this variation leads to a percentage of
error that is associated with the accuracy of each
measurement. This error is defined as uncertainty.
6021
Proceedings of the 50th Hawaii International Conference on System Sciences | 2017
URI: http://hdl.handle.net/10125/41890ISBN: 978-0-9981331-0-2CC-BY-NC-ND
The remainder of the paper is organised as follows:
Section 2 provides a detailed background on CPSs.
Section 3 proposes a risk model based upon the threats
and attack model identified in Section 2. Section 4
gives an implementation test of the model and the
results thereof. Section 5 discusses the need for risk
analysis as a necessary part of CPS security and
identifies the contributions made towards CPS security
by the proposed model. Section 6 concludes the paper
and identifies the additional testing of the model’s
viability that shall be conducted as the model is
improved upon as part of continuing work.
2. Background
Cyber-physical systems (CPSs) are a networked
collection of “actuators, sensors, control processing
units and communication devices” [4] designed to
interface with physical and cyber processes to form
part of a larger, distributed system [4], [19]. The
operations in a CPS are aimed at monitoring the
behaviours of the physical environment in order to
achieve certain goals, such as effective resource
allocation or early warning signalling, with actuation
being based upon the results of computation processes
performed at the cyber core [23]. The cyber core of a
CPS consists of “computational availability that
monitors, coordinates and controls the physical
system” [2] and is found within the cyber domain.
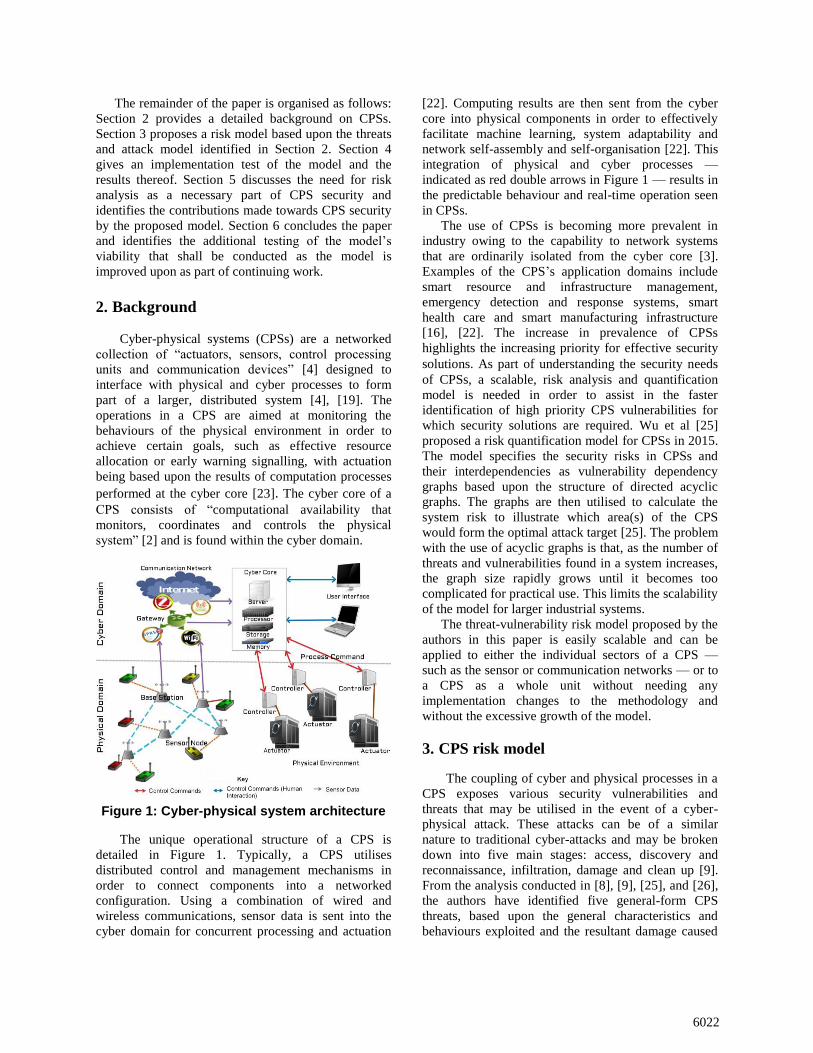
Figure 1: Cyber-physical system architecture
The unique operational structure of a CPS is
detailed in Figure 1. Typically, a CPS utilises
distributed control and management mechanisms in
order to connect components into a networked
configuration. Using a combination of wired and
wireless communications, sensor data is sent into the
cyber domain for concurrent processing and actuation
[22]. Computing results are then sent from the cyber
core into physical components in order to effectively
facilitate machine learning, system adaptability and
network self-assembly and self-organisation [22]. This
integration of physical and cyber processes —
indicated as red double arrows in Figure 1 — results in
the predictable behaviour and real-time operation seen
in CPSs.
The use of CPSs is becoming more prevalent in
industry owing to the capability to network systems
that are ordinarily isolated from the cyber core [3].
Examples of the CPS’s application domains include
smart resource and infrastructure management,
emergency detection and response systems, smart
health care and smart manufacturing infrastructure
[16], [22]. The increase in prevalence of CPSs
highlights the increasing priority for effective security
solutions. As part of understanding the security needs
of CPSs, a scalable, risk analysis and quantification
model is needed in order to assist in the faster
identification of high priority CPS vulnerabilities for
which security solutions are required. Wu et al [25]
proposed a risk quantification model for CPSs in 2015.
The model specifies the security risks in CPSs and
their interdependencies as vulnerability dependency
graphs based upon the structure of directed acyclic
graphs. The graphs are then utilised to calculate the
system risk to illustrate which area(s) of the CPS
would form the optimal attack target [25]. The problem
with the use of acyclic graphs is that, as the number of
threats and vulnerabilities found in a system increases,
the graph size rapidly grows until it becomes too
complicated for practical use. This limits the scalability
of the model for larger industrial systems.
The threat-vulnerability risk model proposed by the
authors in this paper is easily scalable and can be
applied to either the individual sectors of a CPS —
such as the sensor or communication networks — or to
a CPS as a whole unit without needing any
implementation changes to the methodology and
without the excessive growth of the model.
3. CPS risk model
The coupling of cyber and physical processes in a
CPS exposes various security vulnerabilities and
threats that may be utilised in the event of a cyber-
physical attack. These attacks can be of a similar
nature to traditional cyber-attacks and may be broken
down into five main stages: access, discovery and
reconnaissance, infiltration, damage and clean up [9].
From the analysis conducted in [8], [9], [25], and [26],
the authors have identified five general-form CPS
threats, based upon the general characteristics and
behaviours exploited and the resultant damage caused
6022
to the system, as the foundation upon which the
proposed model has been developed. These identified
security threats are categorised as system behaviour
alteration, denial of service, deception, network
alteration and eavesdropping. The threats are seen to
occur in the physical, communication and cyber
components of the system and are categorised based
upon the range of attacks with which the system may
be faced along with the results thereof in the event of a
successful attack.
In order to facilitate future, efficient development
of critical CPS security solutions, the proposed model
aims to provide a uniform methodology with which to
identify the threats and vulnerabilities that need to be
addressed urgently in addition to providing a
quantitative scale against which one can compare the
effectiveness of the developed solutions.
3.1. Risk analysis variables
As part of conducting a thorough risk analysis on a
CPS, a variety of system characteristics are considered
towards the calculation of the impact a threat-
vulnerability risk will have, overall, on the CPS. These
characteristics were identified in accordance to the
anatomy of a cyber-physical security attack and the
security threats previously identified. The variables are
chosen as the characteristics most often used by
attackers in order to efficiently compromise a CPS.
The risk impact (RI) of a security threat or
vulnerability is defined as the resultant damage to a
CPS owing to the successful exploitation of a security
threat or vulnerability. For a CPS threat/vulnerability,
the risk impact is calculated with the consideration of
the following factors:
EP: the entry point score. This score gives an
overview of the degree of openness of the CPS.
AP: the physical access score. This score quantifies
the time needed for infiltration using entry points
leading into the physical domain of the CPS or
through physical intrusions by humans into the
system.
AC: the cyber access score. This score quantifies
the time needed for infiltration using the entry
points leading into the cyber domain of the CPS.
CF: the consequence factor associated with the
resultant damage caused during and after a
successful attack. Calculation of the consequence
factor is based upon the damage caused to the
system, to the environment and to human life.
The variables used in the calculation of the
consequence factor (CF) are weighted in order to
provide a translation of the severity of the damage
considered.
System damage (DS) considers results such
as the mechanical damage done to the
compromised component and other system
components within the affected sector of the
CPS as a result of a successful attack and the
operational delay that may occur in the
system.
Environmental damage (DE) considers the
damage that may occur to the surrounding
ecosystems owing to unintended emissions
from the facility utilising the CPS.
Damage caused to human life (DH)
considers the potential for injury or the loss
of life as a result of the compromised CPS
and is given the most weight. This variable
considers the damage that could be done to
operational personnel, system end users and
bystanders.
PSR: the potential for complete system recovery
following a successful attack. This score is in line
with the degree of clean up done by the attackers
and the degree of clean up needed for the system
to resume uninhibited operation.
3.2. Risk scoring
For the purposes of the proposed model, the risk
scoring is primarily based upon the overall cost to the
company utilising CPSs in the event of a successful
attack. The cost may be calculated in terms of loss of
operational time, time spent on the recovery of data,
loss of data, sensed or stored, during system downtime
and monetary costs. These costs could be accrued in
the form of personnel pay-outs, clean-up operation
costs, the cost of abandoning facilities in cases of
irrecoverable damage or the cost of replacements and
repairs to damaged physical systems.
The scales allocated for the model variables have
been chosen for easier interpretation and can be
changed to more appropriate scales in individual cases
of risk analysis. However, it is important to observe the
weights allocated to each variable to ensure that the
total is split correctly amongst the variables. In the
proposed risk model, the risk impact score is calculated
as a total out of 100. This total is split between the four
main variables EP, AP, AC and CF. CF, as the variable
with the most weight amongst the four variables, has a
total score double to that of the other three variables
and is calculated as a score out of 40. CF is given
double the weight of the entry and access variables as
it is an indicator of the physical damage that can occur
to the CPS; the most important of which is the damage
that may occur to employees and bystanders.
6023
The remainder of the risk impact total is split
evenly between EP, AP and AC with a score out of 20
for each.
3.2.1. The entry points (EP) score. The EP score is
determined by the total number of unsecured,
potentially exploitable entry points into the CPS. Some
examples of exploitable entry points are given below
[11], [18]:
Number of devices that have been infected.
Number of development backdoors and holes in
the network perimeter.
Number of unsecured/forgotten infrastructure e.g.
modems connected to physical machines, dial-up
access to remote terminal units (RTUs), field
equipment modems.
Number of accessible connection hijacking points
within network.
Number of compromised, outsourced firmware,
software and equipment.
Number of ‘trusted’ ports of the system e.g. USB
ports, Ethernet cards, battery monitors.
The score for the entry point variable is determined
using proportional scoring. The minimum and
maximum values are mapped along the scale of 0 to 20
where 0 is indicative of a completely secured system
with no exploitable entry points and 20 is indicative of
a completely open, unsecured system where all entry
points are exploitable gateways into the system. A
scale of 20 was chosen as a result of the division of the
final risk score — given on a scale of 0 to 100 —
amongst its four variables. The authors note however
that any scale may be utilised if applied uniformly
across all the risk model variables and with the
necessary adjustments being made to the maximum
values for the PSR and risk impact variables.
In order to calculate the EP score, two additional
metrics are required:
MAXE: This is the total number of entry points
into the CPS both secured and unsecured. This
number is dependent on the size of the CPS under
analysis.
UNSECE: This is the total number of entry points
into the CPS that are unsecured.
Using the proportion of UNSECE to MAXE, the EP
score, as a result out of 20, can be calculated by:
EP = 𝑈𝑁𝑆𝐸𝐶𝐸
𝑀𝐴𝑋𝐸 × 20
The use of proportional scoring aids in illustrating
how close or far the system is from being completely
open to exploitation. A score closer to the mapped
minimum is indicative of a more closed, secure system
while a score closer to the mapped maximum is
indicative of a more accessible, vulnerable system.
Proportional scoring for the entry point count is
also used in an attempt to try and generalise the
differences between CPSs or within various sectors of
a CPS, resulting in a wider range of applicability for
the model. This is needed because the number of entry
points may differ from system to system or the number
may differ from sector to sector. Some systems may
have a smaller number of system entry points while
some may have a larger number of entry points as a
result of the sizes of the systems. Proportional scoring
allocates a score based on the proportion of the
unsecured count against the relative maximum;
allowing for the same degree of urgency to be
conveyed by the EP score, regardless of the scale of the
system.
3.2.2. The access (AP and AC) scores. The scores for
the AP and AC variables are determined from the entry
points identified for the calculation of EP. For these
variables, the entry points are further divided into the
relevant systems — the physical or cyber systems —
that they primarily affect when exploited.
For the unsecure access points, the average time-to-
compromise (TTC) would need to be determined.
Multiplication of the average TTC by the number of
identified access points would make up the
intermediary scores of TTCP and TTCC.
TTC is defined as the estimated time taken by an
attacker of a particular skillset to successfully infiltrate
a targeted system [17]. For the purposes of the AP and
AC scores, the TTC should be estimated for an attacker
of average skillset with access to standard tools and
hardware however; the facility exists for the score to be
determined for a more skilled attacker with access to
more sophisticated tools.
A variety of techniques may be used in order to
determine the TTC. Estimation techniques have been
proposed by LeMay et al. [14], Leversage and Byres
[15], and McQueen et al. [17]. These techniques may
be used to determine the TTC of the access points. The
TTC can also be determined as part of system testing
by the testing engineers of the CPS.
As with the determination of the EP score,
proportional scoring, on a scale of 0 to 20, is used to
determine the scores for AP and AC. For both variables,
zero time taken for a successful exploitation is mapped
to 20 while the maximum time taken for a successful
exploitation is mapped to 0. The value for the
maximum time is determined as the average time taken
to brute force entry into the system.
In order to determine AP and AC, the following
metrics are utilised:
6024
NP: the number of unsecured, physical system entry
points. This number is a subset of the number of
entry points identified as part of UNSECE. NC: the number of unsecured, cyber system entry
points. This number is also a subset of the number
of entry point identified as part of UNSECE.
TTCPi: The average TTC for a physical system
entry point.
TTCCj: The average TTC for a cyber system entry
point.
TTCP: TTC𝑃𝑖 × 𝑁𝑃
TTCC: TTCCi × 𝑁𝐶
MAXPi: The average brute force entry time for
physical domain entry points.
MAXCi: The average brute force entry time for
cyber domain entry points.
MAXP: MAXPi × 𝑁𝑃
MAXC: MAXCi × 𝑁𝐶
The scores for AP and AC are calculated as follows:
AP = 20 − ( 𝑇𝑇𝐶𝑃
𝑀𝐴𝑋𝑃 × 20)
AC = 20 − (𝑇𝑇𝐶𝐶
𝑀𝐴𝑋𝐶 × 20)
In the case of the two variables defined above,
proportional scoring gives a quantification of the ease
with which an unsecured entry point can be
compromised. Scores closer to twenty are indicative of
entry points that are quickly compromised while scores
closer to zero are indicative of entry points that are
harder to compromise. One may find there are
unsecured entry points that could, relatively, take
longer to compromise in order to gain entry into the
system as opposed to other entry points. The priority in
securing these entry points could then be lower than
the priority for the entry points that are more easily
compromised and thus more likely to be exploited.
3.2.3. The consequence factor (CF). The
consequence factor is made up of three variables:
Damage to human life (DH), Environmental Damage
(DE) and System Damage (DS), which contribute to a
total score of 40. DH is given the largest weight and
constitutes 50% of the CF total. It is allocated along a
scale of 0 to 20. DE is given the second-highest weight
and constitutes 30% of the CF. It allocated a score
along a scale of 0 to 12, where a score of 0 reflects no
environmental damage as a result of the security failure
and a score of 12 reflects irreversible, irrecoverable
environmental damage. DS is given the lowest weight
and thus constitutes 20% of the CF.
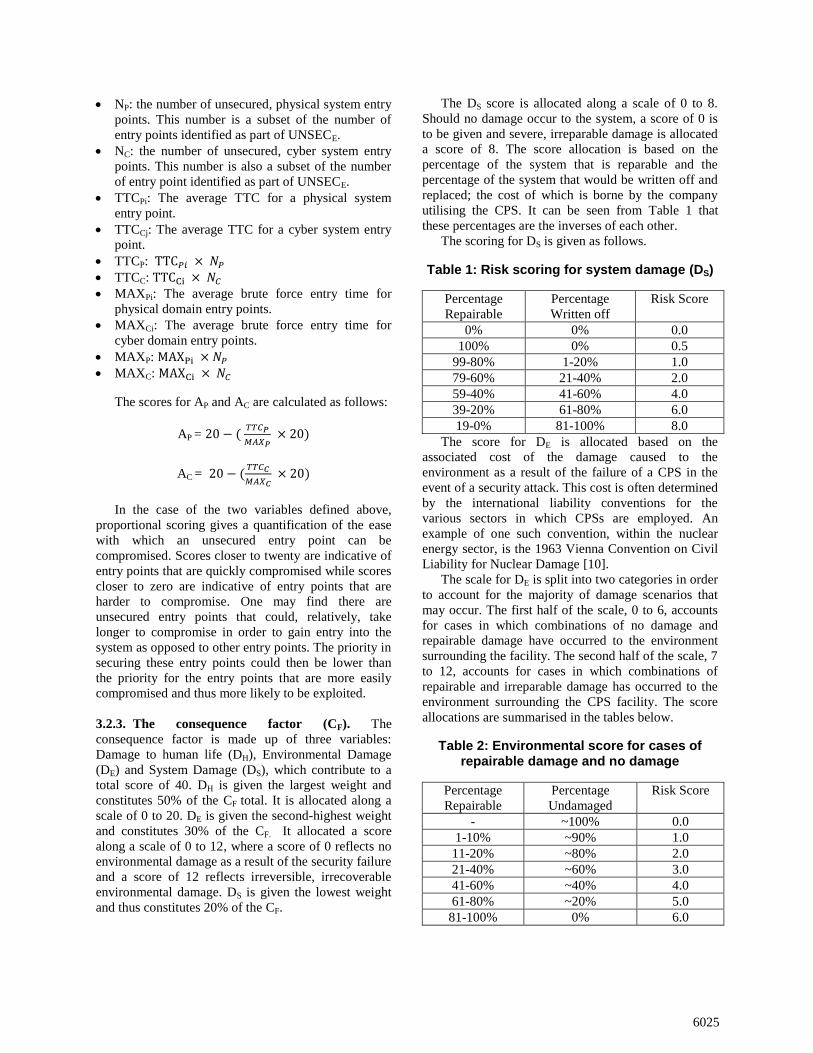
The DS score is allocated along a scale of 0 to 8.
Should no damage occur to the system, a score of 0 is
to be given and severe, irreparable damage is allocated
a score of 8. The score allocation is based on the
percentage of the system that is reparable and the
percentage of the system that would be written off and
replaced; the cost of which is borne by the company
utilising the CPS. It can be seen from Table 1 that
these percentages are the inverses of each other.
The scoring for DS is given as follows.
Table 1: Risk scoring for system damage (DS)
Percentage
Repairable
Percentage
Written off
Risk Score
0% 0% 0.0
100% 0% 0.5
99-80% 1-20% 1.0
79-60% 21-40% 2.0
59-40% 41-60% 4.0
39-20% 61-80% 6.0
19-0% 81-100% 8.0
The score for DE is allocated based on the
associated cost of the damage caused to the
environment as a result of the failure of a CPS in the
event of a security attack. This cost is often determined
by the international liability conventions for the
various sectors in which CPSs are employed. An
example of one such convention, within the nuclear
energy sector, is the 1963 Vienna Convention on Civil
Liability for Nuclear Damage [10].
The scale for DE is split into two categories in order
to account for the majority of damage scenarios that
may occur. The first half of the scale, 0 to 6, accounts
for cases in which combinations of no damage and
repairable damage have occurred to the environment
surrounding the facility. The second half of the scale, 7
to 12, accounts for cases in which combinations of
repairable and irreparable damage has occurred to the
environment surrounding the CPS facility. The score
allocations are summarised in the tables below.
Table 2: Environmental score for cases of repairable damage and no damage
Percentage
Repairable
Percentage
Undamaged
Risk Score
- ~100% 0.0
1-10% ~90% 1.0
11-20% ~80% 2.0
21-40% ~60% 3.0
41-60% ~40% 4.0
61-80% ~20% 5.0
81-100% 0% 6.0
6025
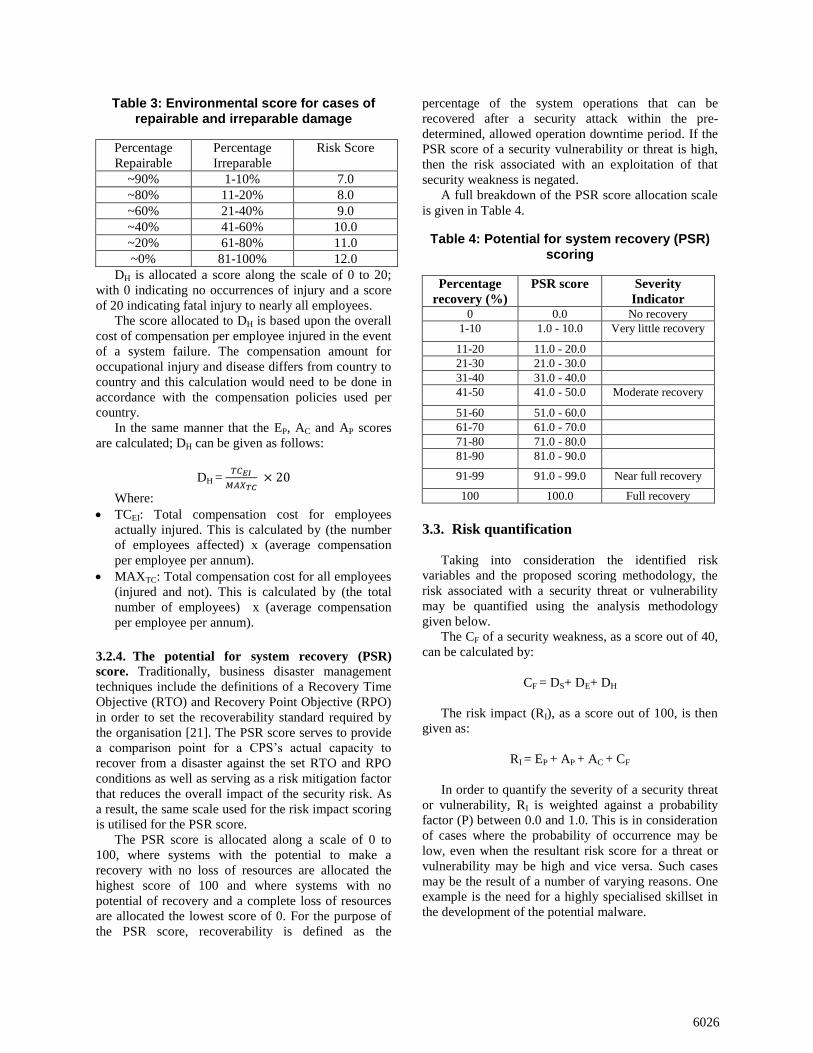
Table 3: Environmental score for cases of repairable and irreparable damage
Percentage
Repairable
Percentage
Irreparable
Risk Score
~90% 1-10% 7.0
~80% 11-20% 8.0
~60% 21-40% 9.0
~40% 41-60% 10.0
~20% 61-80% 11.0
~0% 81-100% 12.0
DH is allocated a score along the scale of 0 to 20;
with 0 indicating no occurrences of injury and a score
of 20 indicating fatal injury to nearly all employees.
The score allocated to DH is based upon the overall
cost of compensation per employee injured in the event
of a system failure. The compensation amount for
occupational injury and disease differs from country to
country and this calculation would need to be done in
accordance with the compensation policies used per
country.
In the same manner that the EP, AC and AP scores
are calculated; DH can be given as follows:
DH = 𝑇𝐶𝐸𝐼
𝑀𝐴𝑋𝑇𝐶 × 20
Where:
TCEI: Total compensation cost for employees
actually injured. This is calculated by (the number
of employees affected) x (average compensation
per employee per annum).
MAXTC: Total compensation cost for all employees
(injured and not). This is calculated by (the total
number of employees) x (average compensation
per employee per annum).
3.2.4. The potential for system recovery (PSR)
score. Traditionally, business disaster management
techniques include the definitions of a Recovery Time
Objective (RTO) and Recovery Point Objective (RPO)
in order to set the recoverability standard required by
the organisation [21]. The PSR score serves to provide
a comparison point for a CPS’s actual capacity to
recover from a disaster against the set RTO and RPO
conditions as well as serving as a risk mitigation factor
that reduces the overall impact of the security risk. As
a result, the same scale used for the risk impact scoring
is utilised for the PSR score.
The PSR score is allocated along a scale of 0 to
100, where systems with the potential to make a
recovery with no loss of resources are allocated the
highest score of 100 and where systems with no
potential of recovery and a complete loss of resources
are allocated the lowest score of 0. For the purpose of
the PSR score, recoverability is defined as the
percentage of the system operations that can be
recovered after a security attack within the pre-
determined, allowed operation downtime period. If the
PSR score of a security vulnerability or threat is high,
then the risk associated with an exploitation of that
security weakness is negated.
A full breakdown of the PSR score allocation scale
is given in Table 4.
Table 4: Potential for system recovery (PSR) scoring
Percentage
recovery (%)
PSR score Severity
Indicator 0 0.0 No recovery
1-10 1.0 - 10.0 Very little recovery
11-20 11.0 - 20.0
21-30 21.0 - 30.0
31-40 31.0 - 40.0
41-50 41.0 - 50.0 Moderate recovery
51-60 51.0 - 60.0
61-70 61.0 - 70.0
71-80 71.0 - 80.0
81-90 81.0 - 90.0
91-99 91.0 - 99.0 Near full recovery
100 100.0 Full recovery
3.3. Risk quantification
Taking into consideration the identified risk
variables and the proposed scoring methodology, the
risk associated with a security threat or vulnerability
may be quantified using the analysis methodology
given below.
The CF of a security weakness, as a score out of 40,
can be calculated by:
CF = DS+ DE+ DH
The risk impact (RI), as a score out of 100, is then
given as:
RI = EP + AP + AC + CF
In order to quantify the severity of a security threat
or vulnerability, RI is weighted against a probability
factor (P) between 0.0 and 1.0. This is in consideration
of cases where the probability of occurrence may be
low, even when the resultant risk score for a threat or
vulnerability may be high and vice versa. Such cases
may be the result of a number of varying reasons. One
example is the need for a highly specialised skillset in
the development of the potential malware.
6026
Allocation of the probability score needs to
consider the environmental trends in the Information
Security sector and the frequency and success rate of
attacks on CPSs. An organisation’s attack desirability
also needs to be taken into close consideration. Some
sectors in industry are more desirable to attackers, such
as government-run facilities, and could have a higher
probability of a security attack occurring.
The security risk score (SRS) for a CPS security
threat or vulnerability can then be defined as:
SRS = P x [RI - PSR]
In weighting the combined risk-recovery score
against a probability score, a facility to associate
urgency for the need of a successful security solution
to a security threat/vulnerability is given. A top down
approach may then be utilised, resulting in the faster
development of solutions able to secure the most
critical sectors in a CPS.
3.4. Interpreting the risk score
The calculated risk score can be given as either a
positive (+) or negative (-) number. A positive score is
indicative of a risk that has not been mitigated by the
system’s recoverability potential. In this case, the risk
impact is greater than the system recoverability score
and is interpreted against the Security Risk levels. A
negative score is indicative of risk that has been
mitigated by the system’s recoverability potential. This
is a case where the system recoverability score is
greater than the risk associated with the vulnerability
or threat. These scores are interpreted against the Risk
Mitigation levels.
In order to determine the priority scales associated
with the security risk and the risk mitigation, five CPS
security attack cases are considered. The worst case
scenario, (RI= 100), is a case in which all the variables
are given the maximum scores possible for their
associated scales. The best case scenario, (RI=0), is a
case in which all the variables are given the minimum
scores possible for their associated scales. The middle
case scenario, (RI= 50), is a case in which all the
variables are all set to the middle of their associated
scales. The lower, (RI= 25), and upper, (RI= 75),
quarter cases have their variable scores set along 25%
and 75% of their scales, respectively.
By varying the PSR score in increasing intervals of
10% and the probability in increasing intervals of 0.25,
the resultant scores were analysed and grouped
together to form five priority and mitigation levels. The
resultant priority scale is proposed with the levels of
severity and mitigation being indicated in descending
order:
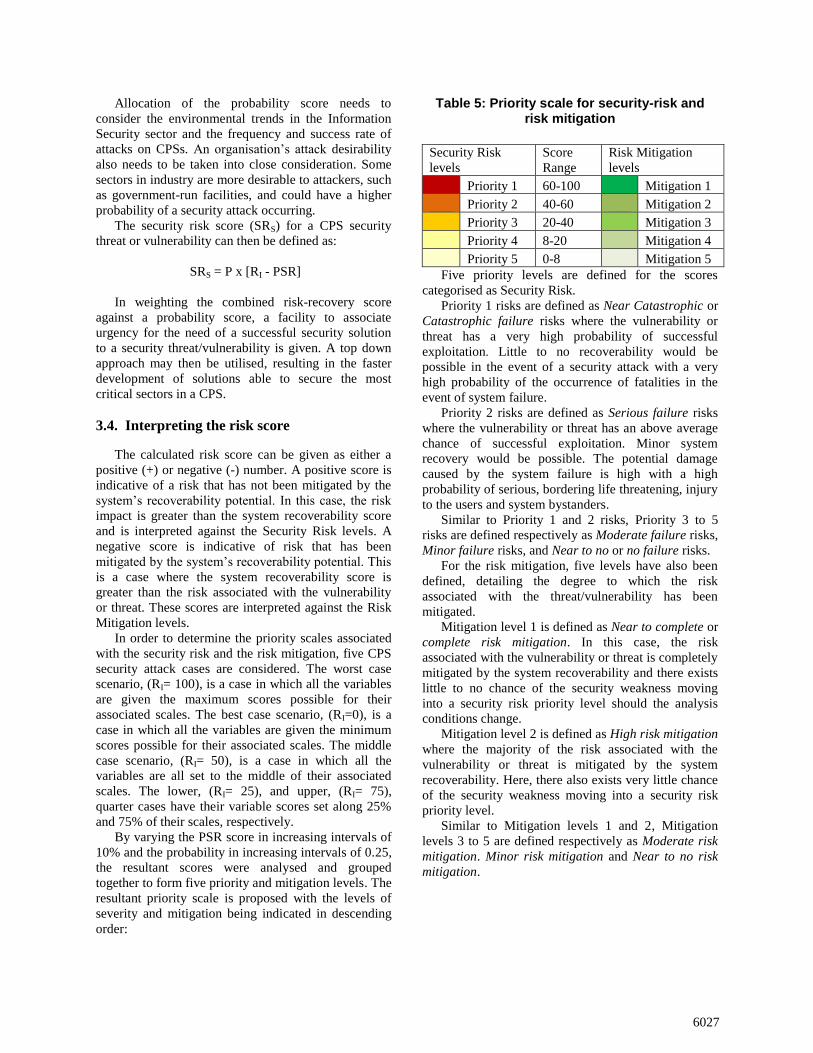
Table 5: Priority scale for security-risk and risk mitigation
Security Risk
levels
Score
Range
Risk Mitigation
levels
Priority 1 60-100 Mitigation 1
Priority 2 40-60 Mitigation 2
Priority 3 20-40 Mitigation 3
Priority 4 8-20 Mitigation 4
Priority 5 0-8 Mitigation 5
Five priority levels are defined for the scores
categorised as Security Risk.
Priority 1 risks are defined as Near Catastrophic or
Catastrophic failure risks where the vulnerability or
threat has a very high probability of successful
exploitation. Little to no recoverability would be
possible in the event of a security attack with a very
high probability of the occurrence of fatalities in the
event of system failure.
Priority 2 risks are defined as Serious failure risks
where the vulnerability or threat has an above average
chance of successful exploitation. Minor system
recovery would be possible. The potential damage
caused by the system failure is high with a high
probability of serious, bordering life threatening, injury
to the users and system bystanders.
Similar to Priority 1 and 2 risks, Priority 3 to 5
risks are defined respectively as Moderate failure risks,
Minor failure risks, and Near to no or no failure risks.
For the risk mitigation, five levels have also been
defined, detailing the degree to which the risk
associated with the threat/vulnerability has been
mitigated.
Mitigation level 1 is defined as Near to complete or
complete risk mitigation. In this case, the risk
associated with the vulnerability or threat is completely
mitigated by the system recoverability and there exists
little to no chance of the security weakness moving
into a security risk priority level should the analysis
conditions change.
Mitigation level 2 is defined as High risk mitigation
where the majority of the risk associated with the
vulnerability or threat is mitigated by the system
recoverability. Here, there also exists very little chance
of the security weakness moving into a security risk
priority level.
Similar to Mitigation levels 1 and 2, Mitigation
levels 3 to 5 are defined respectively as Moderate risk
mitigation. Minor risk mitigation and Near to no risk
mitigation.
6027
4. Model testing
In order to test the effectiveness of the developed
risk model, a case study analysis of the well-known
CPS attack called the Stuxnet worm has been
conducted in order to try and assess the risk associated
with the vulnerabilities exploited.
Discovered in 2010, the Stuxnet worm targeted the
control systems at an Iranian uranium refinery, Natanz
[5]. Infiltration of the worm into the network occurred
through the unprotected USB drives on controller PCs
and infestation was propagated to other PCs through
other unprotected network devices which supported
USB drives, such as printers and scanners [6]. The
Stuxnet worm was developed to target the
programmable logic controllers (PLCs) utilised within
the refinery. PLCs are specialised computing devices
with sensor capability that controls “automated
physical processes” [5]. In the case of the Iranian
nuclear facilities, the PLCs were responsible for
controlling the rotational speed of the centrifuges [6].
The results of various forensic investigations
reported the following on the effects of Stuxnet:
A total of approximately 100,000 total hosts were
infected by Stuxnet, 58.31% of which were situated
in Iran [7].
Approximately 12,000 initial infections could be
traced back to five Iranian organisations [7].
The shortest time between compile and infection
time was 12 hours, the longest time was 28 days
and the average time was 19 days [7].
Of the 9,000 centrifuges deployed at the Natanz
facility, about 1,000 of the centrifuges were
decommissioned. The proximity of the
decommission date to the discovery of the Stuxnet
worm has led to the conclusion that the centrifuges
were damaged as a result of Stuxnet, though it was
not officially confirmed [1].
Owing to a shortage of raw material, Iran only had
the facility to build 12,000 - 15,000 centrifuges.
With the loss of 1,000 centrifuges to routine
operational breakdowns, the additional loss of
1,000 to Stuxnet was significant [1].
Recovery from the effects of Stuxnet took the
Natanz facility approximately 6 months to
accomplish [24].
With consideration of the vulnerabilities and threats
exploited by the Stuxnet worm and the reported effects
of the worm, a risk analysis of the infected CPS can be
conducted through the application of the developed
risk model.
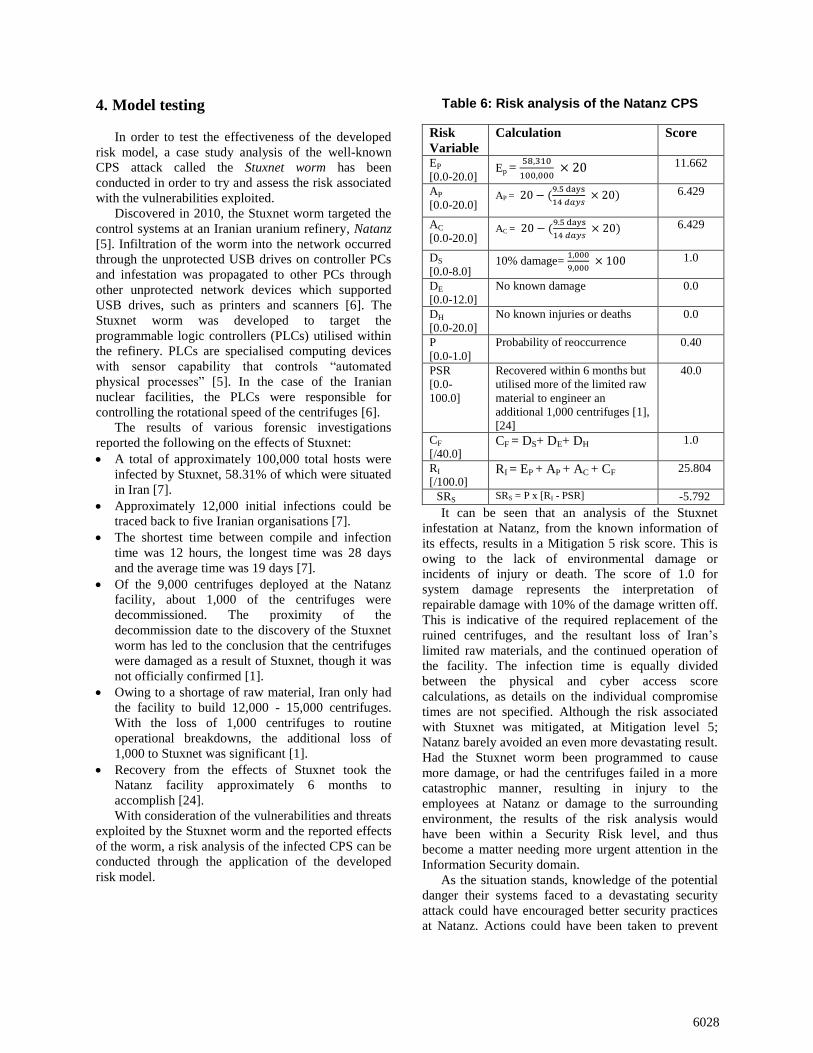
Table 6: Risk analysis of the Natanz CPS
Risk
Variable
Calculation Score
EP
[0.0-20.0] Ep =
58,310
100,000 × 20 11.662
AP
[0.0-20.0] AP = 20 − (
9.5 days
14 𝑑𝑎𝑦𝑠 × 20) 6.429
AC
[0.0-20.0] AC = 20 − (
9.5 days
14 𝑑𝑎𝑦𝑠 × 20) 6.429
DS
[0.0-8.0] 10% damage=
1,000
9,000 × 100 1.0
DE
[0.0-12.0]
No known damage 0.0
DH
[0.0-20.0]
No known injuries or deaths 0.0
P
[0.0-1.0]
Probability of reoccurrence 0.40
PSR
[0.0-
100.0]
Recovered within 6 months but
utilised more of the limited raw
material to engineer an
additional 1,000 centrifuges [1],
[24]
40.0
CF
[/40.0] CF = DS+ DE+ DH 1.0
RI
[/100.0] RI = EP + AP + AC + CF 25.804
SRS SRS = P x [RI - PSR] -5.792
It can be seen that an analysis of the Stuxnet
infestation at Natanz, from the known information of
its effects, results in a Mitigation 5 risk score. This is
owing to the lack of environmental damage or
incidents of injury or death. The score of 1.0 for
system damage represents the interpretation of
repairable damage with 10% of the damage written off.
This is indicative of the required replacement of the
ruined centrifuges, and the resultant loss of Iran’s
limited raw materials, and the continued operation of
the facility. The infection time is equally divided
between the physical and cyber access score
calculations, as details on the individual compromise
times are not specified. Although the risk associated
with Stuxnet was mitigated, at Mitigation level 5;
Natanz barely avoided an even more devastating result.
Had the Stuxnet worm been programmed to cause
more damage, or had the centrifuges failed in a more
catastrophic manner, resulting in injury to the
employees at Natanz or damage to the surrounding
environment, the results of the risk analysis would
have been within a Security Risk level, and thus
become a matter needing more urgent attention in the
Information Security domain.
As the situation stands, knowledge of the potential
danger their systems faced to a devastating security
attack could have encouraged better security practices
at Natanz. Actions could have been taken to prevent
6028
the leakage of sensitive, facility layout and
configuration information through the widely televised
walkthrough tours, as analysed in [13], and best
practice policies could have been implemented
regarding the connection personal external devices
such as USB sticks. In addition, awareness of the
system’s vulnerability to a security attack could have
resulted in the earlier detection of the worm as a
possible cause to the repeated damage to the
centrifuges; reducing the overall effectiveness of the
cyber-physical attack.
5. Discussion
Methods for risk quantification in CPS security are
still a growing research area however, they are
important as they provide the mechanism to identify
the areas of high vulnerability, and consequently high
risk, in a CPS in addition to assisting one in identifying
the order in which solutions for CPS security need to
be developed. In terms of the wider information
security domain, risk analysis techniques and models
aid in illustrating the need for digital forensic readiness
strategies in an environment where, as the application
of technology in everyday business operations
continues to grow, so too does the threat of a major
security breach.
The proposed model provides an overview of the
system security that can be utilised during initial
system design or when conducting risk evaluations.
This allows the owners of the CPSs the opportunity to
conduct thorough risk planning and decide which risks
can be absorbed by the system, which risks can be
mitigated or which risks can be outsourced to be
handled by a third party. The proposed risk model also
gives allowance for the development of forensic
readiness and system recovery strategies for the
eventuality of an attack. The results of this are better,
more secure network designs. The simplicity of the
model means that it can be integrated as part of
scheduled CPS maintenance practices. This allows for
the continuous monitoring of the state of the CPS’s
security, especially in cases were alterations are made
to the system structure. The result is CPSs that are
constantly secured from security attacks and are given
allowance for the early detection of any changes to the
security state. This could result in the quicker
application of defensive measures on the system
network and prevent damaging security attacks prior to
their occurrence.
Apart from applications in CPSs, the proposed
model can also be adjusted for use in the wider
information security domain as part of the development
of readiness strategies. Calculations involving the
physical domain of a CPS can be interpreted as
applying to the physical domain of an IT organisation –
allowing analysists to take into consideration the risks
associated with damage as a consequence of forced
entry into the organisation or cyber-attacks as a result
of insider informants and perpetrators. The calculations
surrounding damage to human life can be adjusted to
consider the costs of employee retrenchment packages
in the event of job losses as a result of a major security
breach, to give one example.
More importantly, in proposing a simple and
scalable risk analysis model, the authors aim to address
two of the four major “security apocalypse horsemen”
[20] namely security risk quantification and bridging
the gap between security and business risk in addition
to encouraging risk-driven specification in future CPS
security solutions. Risk-driven specification is
especially important in safety or mission critical CPSs
as this allows developers to identify the states and
conditions that must not be allowed to occur as a result
of a security failure in addition to allowing for the
increased survivability and resilience of CPSs, making
them less attractive targets to malicious attackers [12].
The major problem facing the proposed model is
one of subjectivity. The nature of risk analysis is that
an element of subjectivity is always retained. Risk
analysis is highly dependent on the bias of the person
conducting the analysis and results could vary between
analyses. While the model attempts to limit instances
of subject bias through the use of independently,
quantifiable metrics, it is still subjective to bias in the
determination of the damage caused by system failure,
the recovery potential of the system and the probability
of the system coming under attack through the use of
the identified threat or vulnerability.
6. Conclusion
It can be seen that in order for the development of
successful CPS security solutions to occur, an
understanding of the impact of a security failure is
needed. Risk assessment models designed specifically
for CPS security, such as the models proposed in this
paper and in [25], are being developed with the focus
on the threats and vulnerabilities that occur owing to
the joining of cyber and physical processes. The
proposed model is able to quantify the impact that a
security failure could have on a system, adjust for
recoverability in the event of a security failure and
quantify the urgency needed for the development of
solutions which address high risk threats and
vulnerabilities. This allows for the easier identification
of areas where CPS security solutions may be lacking.
As part of further work, a detailed analysis of
additional CPSs shall be conducted in order to further
verify the model’s viability. An analysis of the current
6029
state of CPS security using the proposed model shall
also be conducted in order to objectively compare the
effectiveness of previously proposed solutions for
securing CPSs and to identify areas where solution
development has been lacking, so to begin work in
developing a lightweight security framework for CPSs.
References
[1] David Albright, Paul Brannan, and Christina Walrond,
"Stuxnet Malware and Natanz: Update of ISIS December 22, 2010 Report," Washington, 2011.
[2] PJ Antsaklis et al., "Control of Cyberphysical Systems
using Passivity and Dissipativity Based Methods,"
European Journal of Control, vol. 19, no. 5, pp. 379-388,
2013.
[3] Radhakisan Baheti and Helen Gill, "Cyber-Physical
Systems," The Impact of Control Technology, vol. 12, pp. 161-166, 2011.
[4] Alvaro A Cardenas et al., "Challenges for Securing Cyber
Physical Systems," in Workshop on Future Directions in
Cyber-Physical Systems Security, 2009, pp. 5-11.
[5] T.M Chen and S Abu-Nimeh, "Lessons from Stuxnet," Computer, vol. 44, no. 4, pp. 91-93, 2011.
[6] S Collins and S McCombie, "Stuxnet: The Emergence of a
New Cyber Weapon and Its Implications," Journal of
Policing, Intelligence and Counter Terrorism, vol. 7, no. 1, pp. 80-91, 2012.
[7] Nicolas Falliere, Liam O Murchu, and Eric Chien,
"W32.Stuxnet Dossier Version 1.4," Cupertino, California, 2011.
[8] Y Gao et al., "Analysis of Security Threats and
Vulnerabilities for Cyber-physical Systems," in 3rd
International Conference on Computer Science and Network Technology, Dalin, China, 2013.
[9] Dieter Gollmann and Marina Krotofil, "Cyber-Physical
Systems Security- An Experimental Approach," Hamburg University of Technology, Presentation.
[10] International Atomic Energy Agency. (2016) Vienna
Convention on Civil Liability for Nuclear Damage.
[Online].
https://www.iaea.org/publications/documents/conventions/vienna-convention-on-civil-liability-for-nuclear-damage
[11] Stamatis Karnouskos. (2014, April) ERCIM News 97:
Security in the Era of Cyber-Physical Systems of Systems.
[Online]. http://ercim-
news.ercim.eu/en97/special/security-in-the-era-of-cyber-
physical-systems-of-systems
[12] Stan Kurkovsky, Software Engineering: Critical Systems
Specification, Unknown, CS530 Lecture Slides- Central Connecticut State University.
[13] Ralph Langner, "To Kill a Centrifuge," The Langner Group, Hamburg, Technical Analysis 2013.
[14] Elizabeth LeMay et al., "Adversary-Driven State-Based
System Security Evaluation," in MetriSec2010, Bolzano-Bozen, Italy, September 15, 2010.
[15] David John Leversage and Eric James Byres, "Estimating
a System's Mean Time-to-Compromise," IEEE Security & Privacy, vol. 6, no. 1, pp. 52-60, 2008.
[16] Tianbo Lu, Jinyang Zhao, Lingling Zhao, Yang Li, and
Xiaoyan Zhang, "Towards a Framework for Assuring
Cyber Physical System Security," International Journal of
Security and its Applications, vol. 9, no. 3, pp. 25-40, 2015.
[17] Miles A McQueen, Wayne F Boyer, Mark A Flynn, and
George A. Beitel, "Time-to-Compromise Model for Cyber
Risk Reduction Estimation," in First Workshop on Quality
of Protection, Quality of Protection: Security Measurements and Metrics.: Springer, 2005.
[18] Yilin Mo et al., "Cyber–Physical Security of a Smart Grid
Infrastructure," Proceedings of the IEEE, vol. 100, no. 1,
pp. 195 - 209, 2011.
[19] Ragunathan Rajkumar, Insup Lee, Lui Sha, and John
Stankovic, "Cyber-Physical Systems: The Next
Computing Revolution," Proceedings of the 47th Design Automation Conference, pp. 731-736, 2010.
[20] Rockwell Automation. (2015, March) Process Solutions
Summit. [Online].
https://www.rockwellautomation.com/resources/download
s/rockwellautomation/pdf/events/process-summit/CT522_Securing_Industrial_Networks.pdf
[21] Susan Snedaker, "Chapter 4: Business Impact Analysis,"
in Business Continuity and Disaster Recovery Planning
for IT Professionals. Waltham, MA: Syngress, a division
of Elsevier, 2007, pp. 218-225.
[22] Unknown, "An Introduction to Cyber-Physical Systems," University of Oslo, 30 Aug 2011.
[23] Eric Ke Wang et al., "Security Issues and Challenges for
Cyber Physical Systems," in 2010 IEEE/ACM
International Conference on Green Computing and
Commincations & 2010 IEEE/ACM International
Conference on Cyber, Physical and Social Computing, 2010, pp. 733-738.
[24] Joby Warrick. (2011, February) Iran's Natanz nuclear
facility recovered quickly from Stuxnet cyberattack.
[Online]. www.washingtonpost.com/wp-
dyn/content/article/2011/02/15/AR2011021505395.html?s
id=ST2011021404206
[25] W Wu, R Kang, and Z Li, "Risk Assessment Method for
Cybersecurity of Cyber-Physical Systems Based on Inter-
Dependency of Vulnerabilities," in 2015 IEEE
International Conference on Industrial Engineering and
Engineering Management (IEEM), Singapore, 2015.
[26] F Xie et al., "Security Analysis on Cyper-Physical System
Using Attack Tree," in 2013 Ninth International
Conference on Intelligent Information Hiding and Multimedia Signal Processing, Beijing, 2013.
6030