Embed Size (px)
Citation preview

A thesis submitted to the Department of Environmental Sciences and Policy of
Central European University in part fulfilment of the
Degree of Master of Science
Detecting urban sprawl in the Middle Nile Delta region to assess the
effects on Egypt’s agriculture
Shushant VASISTH
June, 2018
Budapest
CE
UeT
DC
olle
ctio
n

ii
Erasmus Mundus Masters Course in
Environmental Sciences, Policy and
Management
MESPOM
This thesis is submitted in fulfilment of the Master of Science degree awarded as a result of successful completion of the Erasmus Mundus Masters course in Environmental Sciences, Policy and Management (MESPOM) jointly operated by the University of the Aegean (Greece), Central European University (Hungary), Lund University (Sweden) and the University of Manchester (United Kingdom).
CE
UeT
DC
olle
ctio
n

iii
Notes on copyright and the ownership of intellectual property rights:
(1) Copyright in text of this thesis rests with the Author. Copies (by any process) either in full,
or of extracts, may be made only in accordance with instructions given by the Author and lodged in the Central European University Library. Details may be obtained from the Librarian. This page must form part of any such copies made. Further copies (by any process) of copies made in accordance with such instructions may not be made without the permission (in writing) of the Author.
(2) The ownership of any intellectual property rights which may be described in this thesis is
vested in the Central European University, subject to any prior agreement to the contrary, and may not be made available for use by third parties without the written permission of the University, which will prescribe the terms and conditions of any such agreement.
(3) For bibliographic and reference purposes this thesis should be referred to as:
Vasisth, S.2018. Detecting urban sprawl in the Middle Nile Delta region to assess the effects on Egypt’s agriculture. Master of Science thesis, Central European University, Budapest.
Further information on the conditions under which disclosures and exploitation may take place is available from the Head of the Department of Environmental Sciences and Policy, Central European University.
CE
UeT
DC
olle
ctio
n

iv
Author’s Declaration
No portion of the work referred to in this thesis has been submitted in support of an application
for another degree or qualification of this or any other university or other institute of learning.
Shushant VASISTH
CE
UeT
DC
olle
ctio
n
v
CENTRAL EUROPEAN UNIVERSITY
ABSTRACT OF THESIS submitted by:
Shushant Vasisth
for the degree of Master of Science and entitled: Detecting urban sprawl in the Middle Nile Delta region to assess the effects on Egypt’s agriculture.
Month and Year of submission: June, 2018.
Urban growth is a growing threat along with climate change affecting Nile Delta Region of Egypt. Assessing the impacts of urbanisation to understand the causal factors is very important to be able to combat this problem. For this research, LANDSAT 5 TM for 1997 and 8 OLI TIRS satellite images 2017 were used to study the change in land use/land cover in the study area of Al-Gharbiya and Menoufia governorate in Middle Nile Delta Region. Hybrid or Combined classification method was used to assess the growth of urbanisation in the study area. Random Stratified sampling and Kappa statistics was used for accuracy assessment. The accuracy assessment result for the multi-temporal classification was found to be 89% and 84% for the year 1997 and 2017 respectively. Classification showed increase in the agriculture areas by 6.10% while urban areas increased by 21.19 % during the same period. Decrease in surface water and barren areas recorded was by 25.70% and 63.52% respectively. This thesis identified various factors contributing to the rapid urban growth in the Nile Delta region affecting its arable lands. This thesis makes four key recommendations for researchers and policy makers of Egypt to tackle the growing problem to combat future crisis situation.
Keywords: Remote Sensing, GIS, Urban Sprawl, Nile Delta, Al-Gharbiya, Menoufia.
CE
UeT
DC
olle
ctio
n

vi
Acknowledgments
Working on this thesis has been an extensive learning experience for me. I am grateful for this
opportunity and would hereby like to thank some of the people who made this possible.
I would like to start by expressing my profound gratitude to my teacher and supervisor Viktor
Lagutov, for his ideas and constructive criticism which helped to elaborate my research topic. His
classes in the first and second semester helped me to deepen my research interest in the field of
GIS and remote sensing, providing me with feedbacks.
I would like to thank Lakhwinder Singh for his online course on udemy portal on land use
classification which helped in conducting the classification analysis.
Furthermore, I am thankful to all my friends from MESP and MESPOM for supporting me
throughout the course.
Finally, I would like to thank my family and Jevita for their endless support throughout my study
period.
CE
UeT
DC
olle
ctio
n
vii
Table of Contents
1. Introduction .................................................................................................................................... 1
1.1 Background ............................................................................................................................. 1
1.2 Research Questions and Aim ............................................................................................... 3
1.3 Thesis Outline......................................................................................................................... 4
2. Literature Review ............................................................................................................................ 6
2.1 Agriculture in Egypt – Why is it important? ...................................................................... 6
2.2 Food Security .......................................................................................................................... 9
2.3 Urbanisation and its impacts .............................................................................................. 11
2.4 Land-Use/Land-Cover Change and its analysis .............................................................. 12
2.5 Application of Geospatial Technologies for studying and assessing environment .... 14
2.5.1 Remote Sensing – The technology and its use ............................................................ 15
2.5.2 GIS and Image processing .............................................................................................. 20
3. Methodology ................................................................................................................................. 23
3.1 Research Design ................................................................................................................... 23
3.2 Study Area ............................................................................................................................. 24
3.3 Data Collection ..................................................................................................................... 25
3.3.1 Satellite Data ..................................................................................................................... 25
3.3.2 Literature Review ............................................................................................................. 27
3.4 Data Analysis Methods........................................................................................................ 28
3.4.1 Image preparation, processing, classification and accuracy assessment .................. 28
CE
UeT
DC
olle
ctio
n
viii
3.4.2 Literature analysis ............................................................................................................. 31
4. Results and Analysis ..................................................................................................................... 32
4.1 Analysis of the Land Use/Land Cover change (RQ1) ................................................... 32
5. Discussion ..................................................................................................................................... 40
5.1 Cause of urbanisation and its implication on Egypt’s agriculture ................................. 40
6. Conclusion ..................................................................................................................................... 43
7. References ..................................................................................................................................... 45
CE
UeT
DC
olle
ctio
n
ix
List of Tables
Table 1 Sensors and bands in Landsat Satellites (Source -USGS 2018) ....................................... 19
Table 2 Research Design (Prepared by Author) .............................................................................. 23
Table 3 Demographic details of study area (Source: CAPMAS 2015) .......................................... 25
Table 4 Satellite images for carrying out research work .................................................................. 25
Table 5 Characteristics of Landsat images used ............................................................................... 26
Table 6 Statistics of Accuracy Assessment (Source -Author) ........................................................ 33
Table 7 LU/LC Statistics of the Study Area (Calculations by Author) ........................................ 36
Table 8 Changes in LU/LC of Study Area, 1997-2017 (Source -Author) ................................... 37
CE
UeT
DC
olle
ctio
n

x
List of Figures
Figure 1 Distribution of gross domestic product (GDP) across economic sectors of Egypt (2006
- 2016) (Source - World Bank 2018) ........................................................................................................ 7
Figure 2 Role of Agriculture in Egyptian Economy (Source - World Bank 2018) .......................... 7
Figure 3 Import and Export of main food commodity groups in Egypt (1990-2013) (Source: Food
Balance Sheets - Knoema.Com 2018) ...................................................................................................... 8
Figure 4 Rapid growth of population in past 100 years. (Source: Worldometers 2018) ................. 9
Figure 5 People under food poverty in 2017 (Source: FAO 2015) .................................................. 11
Figure 6 Process of Remote Sensing (Source: Samarakoon) ............................................................ 16
Figure 7 Electromagnetic Spectrum (Satellite Imaging Corp 2018) ................................................. 17
Figure 8 Spatial Resolution (Source: Satellite Imaging Corp 2018).................................................. 18
Figure 9 Different pixel resolution of the same image (Source: Liang et al. 2012) ....................... 18
Figure 10 Steps of unsupervised classification (Source: GIS Geography 2014) ............................ 21
Figure 11 Steps of supervised classification (Source: GIS Geography 2014) ................................. 22
Figure 12 Study Area - Gharbia and Menoufia Governorates .......................................................... 24
Figure 13 Concept of stacking (composite) layers (Source: (ArcGIS Desktop 2018) ................... 28
Figure 14 Clipping the study area using ArcGIS ................................................................................. 29
Figure 15 Hybrid or combined classification (combination of both unsupervised and supervised
classification methods) applied for change detection study ............................................................... 30
Figure 16 Classification Process Followed ........................................................................................... 31
Figure 17 Land Use classification map of 1997 (Prepared by Author)............................................ 34
Figure 18 Land Use classification map of 2017 (Prepared by Author)............................................ 35
Figure 19 Land Cover Change in study area (1997-2017) (Calculations by Author) ..................... 36
CE
UeT
DC
olle
ctio
n

xi
Figure 20 Proportion of each land class in 1997 based on LU Classification (Calculations by
Author) ....................................................................................................................................................... 37
Figure 21 Proportion of each class in 2017 based on LU Classification (Calculations by Author)
..................................................................................................................................................................... 37
Figure 22 Change in Land Use Patterns (between 1997-2017) (Calculations by Author) ............ 38
Figure 23 Decrease in cultivated area in Middle Nile Delta Region (Image Source - Zaghloul et
al. 2011) ...................................................................................................................................................... 41
CE
UeT
DC
olle
ctio
n

xii
List of Abbreviations
FAO – Food and Agriculture Organisation
GIS – Geographic Information System
LU/LC – Land Use/Land Cover
MSS - Multispectral Scanner System
NASA – National Aeronautics and Space Administration
OLI - Operational Land Imager
RBV - Return Beam Vidicon
RS – Remote Sensing
TIRS – Thermal Infrared Sensor
TM – Thematic Mapper
USGS – United States Geological Survey
WFP – World Food Programme
CE
UeT
DC
olle
ctio
n

1
1. Introduction
1.1 Background
At present times, with rapid increase in population need of basic amenities such as food and
shelter are also increasing. With human intervention in every sphere of natural resources, there is
an imbalance in usage of land and its management resulting in rapid land use-landcover changes
(Lambin et al. 1999). As a result of increasing population, intensification of agriculture to counter
huge demand has become a necessity for developing modern society. These changes occurring at
such accelerating rates exceeds the adaptive capacity of soil as well as human societies, especially
in arid and semi-arid regions, where ecosystem is sensitive and fragile in nature (Hall et al. 1979).
Changing land-use patterns as a result of human’s socio-economic activities induces change in land
cover resulting in ecological imbalance disrupting ecosystems which affects the biosphere as a
whole (Riebsame et al. 1994).
Land Use/land cover change in arid and semi-arid regions has extensive consequences. Arid and
semi-arid regions are generally categorised as sensitive and fragile regions due to variability in the
carrying capacity of these lands with respect to space and time (Verstraete et al. 1991). The human
exploitation of its renewable resources such as soil, water etc. exceeds the natural rate of
replenishment of these regions which results in degradation of its ecosystem (Verstraete et al.
1991). Therefore, for having sustainable development in the arid and semi-arid regions, there is a
vital requirement of continuous monitoring and evaluation of the resource base to understand its
evolution.
Egypt is one such country situated in the arid and semi-arid regions of the world which is spread
across an area of one million sq. km in the north of the African continent. Out of this one million
sq. km, more than 96% of the total land area in Egypt is desert (Alfiky et al. 2012). The rest 3.4%
of the total land area (34,000 sq. km) is situated near the Nile river and its delta where most of the
CE
UeT
DC
olle
ctio
n

2
cultivation of Egypt takes place (Alfiky et al. 2012). River Nile adds an interesting feature to Egypt
and acts as its lifeline as it provides 97% of all the water available in Egypt (Abdel-Shafy et al.
2002). River Nile branches out as two main distributaries namely the Rosetta (Rashid on the west)
and the Damietta (Dumyat on the east) (Hereher 2010)from the north of Cairo spreading out as
V-shaped fan towards the north of Egypt finally ending up in the Mediterranean Sea. The Nile
delta was formed by the sediments from the Nile river which got accumulated during the flood
seasons (Hereher 2010).
Nile delta formed due to accumulation of nutrient rich sediments is fertile in nature and most of
the Egypt’s agriculture takes place in this region (Alfiky et al. 2012). Due to this unique geographic
feature of Egypt, more than 95% of Egypt’s 93 million people (as per 2017) resides in the Nile
Delta region (Alfiky et al. 2012;CAPMAS 2018). There is a rapid rise in the population of Egypt,
which is mostly concentrated on the Nile delta region. This has resulted in an increasing imbalance
in the ratio of population to agricultural land. The per capita area of arable land (hectares per
person) is decreasing constantly from 0.09 ha/person in 1961 to 0.06 ha/person in 1990 further
reducing to 0.029 ha/person in 2014 (World Bank 2015). As a result, there is widening of the gap
between the potential capacity of agricultural production of Egypt and the estimated growth of
population. This imbalance has also resulted in environmental degradation of the finite arable land
available to the Egyptians in Nile Delta due to urban sprawl which may lead to desertification in
future(Power 2014).
This has various consequences, one of the major being decrease in agricultural production of
Egypt due to change in land-use from agricultural to urban areas. Heavily dependent on River Nile
and its Delta for Egypt’s food production, rapid growth of population in this region has resulted
in decrease in agricultural areas and increase in urban areas in Nile delta region. As per the Global
Food Policy Report, 2015 published by the International Food Policy Research Institute, the
CE
UeT
DC
olle
ctio
n

3
average annual growth of agricultural output percentage of Egypt decreased from 4.5% in 1991 to
1.9% in 2012 due to decrease in Total Factor Productivity from 2.1% in 1991 to 1.9% in 2012.
This has resulted in formulating and adopting various food subsidies and policies by the Egyptian
Government aiming to expand cultivation area, intensification of agriculture in present cultivated
areas for maximising food production. Also, several plans have been taken up by the Egyptian
government since past years, to reduce the population density in the Nile Delta region to curb the
land-use change by distributing the population horizontally on the edges of Nile Delta region and
the desert areas of Egypt (A. Shalaby et al. 2007).
1.2 Research Questions and Aim
To understand the growing problem of urbanisation in Nile Delta region, it is very essential to
analyse land-use/land-cover change. This will help us in understanding the rate of urbanisation.
Assessing and detecting these changes are very vital for better planning of growing urban areas so
as to not hamper the limited available agricultural land of Egypt. This study will aim to studies will
help in formulating efficient policies by the Egyptian Government to combat this urgent need of
growing food insecurity.
The thesis aims to answer the following research questions:
1. What is the rate of change of agricultural areas to urban settlements in Menoufia and Gharbia
governorate of the middle Nile Delta region (due to change of land-use patterns in last 20
years since 1997?
• Literature review on land-use/land-cover changes in Nile Delta region
• Determine the LU/LC changes in the area in past 20 years.
2. What are the factors of urbanisation on the Nile Delta region and its effects on the
agriculture system (food security) of Egypt?
• Literature review about the major factors leading to urbanisation in Egypt
CE
UeT
DC
olle
ctio
n

4
• Literature review about the effects of urbanisation on the agriculture system (food
production and security) of Egypt
There has been lots of ongoing research on the land-use and land cover change across the world
to understand its impact on climate change and greenhouse gas emissions. Nile Delta region of
Egypt is one such area of interest for conducting similar research studies due to its unique
geographic features and its importance for the people of Egypt. This thesis aims to understand the
implication of land-use/land-cover change due to urbanisation on the middle Nile Delta Region
and its effects on the agricultural system of Egypt at present with purview on the future
1.3 Thesis Outline
The thesis consists of 6 main chapters.
Chapter 1 gives a background to the nature of the problem addressed in this research and the
specific problem(s) aimed to be addressed. As per the identified the gaps in knowledge outlined,
specific research questions are presented.
Chapter 2 the researcher conducted a systematic literature review to introduce to the basic
topics of research along with further understanding of the topic of research.
Chapter 3 outlines the methodologies used to conduct the land use/land cover analysis for
creating land use maps along the method used for literature review and further analysis and
discussions
Chapter 4 presents the results and main findings of the land use/landcover analysis done to
answer RQ1.
Chapter 5 present the discussion of the comprehensive literature review conducted and
answer RQ2 and assist in answering RQ1.
CE
UeT
DC
olle
ctio
n

5
Chapter 6 presents the main conclusions of the research analysis, explaining the contribution
of the research work to the literature/knowledge. Further, it provides recommendations
directed to the other researchers and decision makers.
CE
UeT
DC
olle
ctio
n

6
2. Literature Review
2.1 Agriculture in Egypt – Why is it important?
Agriculture is generally considered as an important aspect of development which contributes to the
growth of an economy as it provides food as well as employment. Various research studies in fact states
that agriculture is considered the primary sector as a source of income for economic growth (Ravallion et
al. 2007) (Loayza et al.). Poverty alleviation and reduction of inequality in a society is directly linked to
growth in agriculture and is proportional to each other as it brings large gains to the poor and generates
positive externalities(Ravallion et al. 2007) (Ravallion 2005).
Agriculture can be considered as one of the most important part of the ancient Egyptian civilisation
which can be tracked back to as long as 12000 years along the River Nile(Janick 2016). Egyptian civilisation
were the pioneers in designing key agricultural tools such as the hoe, the plow etc. and also introduced
irrigation concepts such as systematic irrigation and hydraulic engineering for combating irregular levels
of River Nile (Janick 2016). Their contribution to agricultural technology is of immense importance. Many
historians believes Egyptians mastered the art of agriculture in the dry and arid region, laying down the
foundation stones of a successful Egyptian civilisation (Janick 2016).
Regardless of decline in relative importance of agriculture production in Egyptian Economy in terms of
contribution to the GDP and employment, in still plays a vital role in feeding the population while
providing income to the rural population(Tellioglu et al. 2017). Figure 3 shows the major sectors
contributing to Egyptian GDP (2006-2016), where agriculture clearly shows a downtrend.
CE
UeT
DC
olle
ctio
n

7
Figure 1 Distribution of gross domestic product (GDP) across economic sectors of Egypt (2006 - 2016) (Source - World
Bank 2018)
Contribution of agriculture to the GDP of Egyptian Economy was 11.7% in 2017(World Bank 2018).
Egypt’s agricultural system is labour demanding and it employs 24.83% of the total labour force of Egypt
during 2017. Even though the agricultural system of Egypt is labour intensive, the labour’s efficiency
increased by just around 1 percent which is calculated as agriculture value added per labour in constant
2010 US dollars (Tellioglu et al. 2017). Figure 4 below shows the role of agriculture in economy of Egypt.
Figure 2 Role of Agriculture in Egyptian Economy (Source - World Bank 2018)
14.07 14.07 13.22 13.63 13.99 14.52 11.11 10.97 11.06 11.15 11.93
38.43 36.76 37.91 37.55 37.53 37.63 38.68 38.8 38.91 36.23 32.89
47.5 49.17 48.86 48.82 48.48 47.85 50.22 50.24 50.04 52.61 55.18
2 0 0 6 2 0 0 7 2 0 0 8 2 0 0 9 2 0 1 0 2 0 1 1 2 0 1 2 2 0 1 3 2 0 1 4 2 0 1 5 2 0 1 6
In P
erce
nta
ge
Year
Agriculture Industry Services
0
10
20
30
40
1991-1995 1996-2000 2001-2005 2006-2010 2011-2016
In P
erce
nta
ge
Employment in agriculture (% of total employment) Agriculture, value added (% of GDP)
Agricultural raw materials exports (% of merchandise exports) Agricultural raw materials imports (% of merchandise imports)
CE
UeT
DC
olle
ctio
n

8
The Egyptian agricultural system transformed from being exported oriented in ancient times to import
oriented in recent times, due to decreasing export and increasing import. Egypt also known as the “wheat
basket” of the world is the largest wheat importer across the globe. Other than fruits and starchy roots
(Figure. 3), Egypt consumes more than its produces and as a result its net import exceeds 50% of its
total food consumption (WFP and CAPMAS 2013) (Tellioglu et al. 2017). This resulted in the rise of
agricultural trade deficit in last two decades growing to $10.8 Billion in 2014 from $2.3 Billion in 1994
(Tellioglu et al. 2017).
Figure 3 Import and Export of main food commodity groups in Egypt (1990-2013) (Source: Food Balance Sheets -
Knoema.Com 2018)
Also, due to Egypt’s unique geographic feature, agriculture mostly takes place near the valley of River
Nile and its delta and most of the Egyptian population (nearly 95%) resides in and around River Nile Delta
(Alfiky et al. 2012). With rapid increase in urban population in recent years(Worldometers 2018), this may
also pose another threat to Egypt’s food production, since urbanisation usually takes place on agricultural
0
5000
10000
15000
20000
19
90
19
92
19
94
19
96
19
98
20
00
20
02
20
04
20
06
20
08
20
10
20
12
10
00
TO
NN
ES
Import of Cereals
Export of Cereals
0
100
200
300
400
500
600
700
19
90
19
92
19
94
19
96
19
98
20
00
20
02
20
04
20
06
20
08
20
10
20
12
10
00
TO
NN
ES
Import of Pulses
Export of Pulses
0
200
400
600
800
1000
10
00
TO
NN
ES
Import of Starchy Roots
Export of Starchy Roots
0
500
1000
1500
2000
19
90
19
92
19
94
19
96
19
98
20
00
20
02
20
04
20
06
20
08
20
10
20
12
10
00
TO
NN
ES
Import of Fruits
Export of Fruits
CE
UeT
DC
olle
ctio
n

9
lands which will result in decrease in food production. This is a growing concern for Egypt and its
economy since there is descending trend in production of cereals and pulses far lower than their level of
consumption (Tellioglu et al. 2017) in addition to its vulnerability to fluctuation in rate of currency
exchange, global food price, change in climatic conditions etc.
2.2 Food Security
Food is a basic necessity for human’s survival on planet earth. Food security is an uphill challenge faced
by the world due to rapid growth of global population. In last one hundred years, the global population
has increased by nearly 5 times; from 1.6 billion in 1900 it has reached 7.6 billion in 2018 as per recent
estimates of United Nations (Worldometers 2018) as can be seen in Figure 1 below. As of 2018, 54.9%
of the total global population are residing in urban areas resulting in expansion of urban areas across the
globe(Worldometers 2018). With the present growth rate of nearly 1.1%, we will have to feed a population
nearly 9 billion by the year 2050, estimating an increase in food demand by 60% compared to present day
(Breene 2016) . Hence, United Nations in 2015 has set ‘Zero Hunger’ as its second goal out of the
seventeen Sustainable Development Goals to achieve the growing demand of food across the globe aiming
to eradicate food poverty and hunger by achieving food security, improved nutrition and promoting
sustainable agriculture by 2030.
Figure 4 Rapid growth of population in past 100 years. (Source: Worldometers 2018)
0
1
2
3
4
5
6
7
8
1900 1930 1950 1960 1974 1980 1987 1999 2011 2018
Population growth (in billions) in past 100 years
CE
UeT
DC
olle
ctio
n

10
In the 1970’s the world faced one of the most severe food crisis from 1972-75 which resulted in death
of nearly 2 million people mostly in Africa and Asia (Gerlach 2015). The roots of this food crisis were
characterised by a major El Nino event, followed by high demand of food from Soviet Union later leading
to energy crisis and economic crisis (Gerlach 2015). United Nations responded to the crisis by organising
the first World Food Conference in Rome, 1974 where the term ‘food security’ first evolved. ‘stable food
supply to assure international access’ (Gross et al. 2000) was set as the major priority to achieve food
security in this conference for developing international policies to combat the world food crisis and hunger
(Gerlach 2015). The World Food Conference, 1974 mainly emphasised on three main agendas all related
to food supply (UNSPECIFIED 1974). The key agendas were to set up an international funding to
enhance production; creating reserve stocks of food produce and increase in food aid; and establishing an
institutional framework among the members for smooth implementation of all mandates
(UNSPECIFIED 1974). In the 1980’s, the green revolution across the globe resulted in growth of food
production which enhanced the food availability. However, this didn’t eradicate food crisis and famines.
Thus, FAO and World Bank further expanded the concept of food security encompassing both “physical
and economic access to food supplies”(Gross et al. 2000). Focus was shifted from food supply to access
to food supplies at all times for all the people (FAO 2003). Later at World Food Summit (WFS), 1996
defined food security as a multi-dimensional concept which was widely accepted considers four important
dimensions such as food availability, accessibility, usability and stability. The definition approved by the
World Food Summit 1996 remains the most accepted definitions till date (Simon 2012). In 2001, the state
of food insecurity, refined the definition of WFS, 1996 by including term ‘social’ in the WFS definition
which is as follows “Food security, at the individual, household, national, regional and global levels [is
achieved] when all people, at all times, have physical, social and economic access to sufficient, safe and
nutritious food to meet their dietary needs and food preferences for an active and healthy life”.
Food poverty and hunger remain a significant threat to a growing economy; where and when the
individuals become a part of the consequential chain of demands and need to gather food for nourishment
and ultimately a healthy life. Inefficiency to acquire food will lead to hunger and further affecting the vital
CE
UeT
DC
olle
ctio
n

11
organs of the body and further affecting the vital organs of the body and immune system. Under the
chronic malnourished state, individuals are incapable of obtaining sustenance, and this will constrain the
welfare and growth of the economy. (United Nations 2015). With nearly 815 million people at such state
across the globe (WFP 2017), sustainable development remains a distant dream because without human
development, it is not possible to achieve other sustainable development goals such as gender equality,
education, health etc. This remains a grave concern for many countries especially in Asia and Africa which
faces huge food poverty issues. As per FAO, 2015 data, we can see in Figure below that nearly 90% of
the people suffering from food insecurity in the world are from Asia and Africa.
.
Figure 5 People under food poverty in 2017 (Source: FAO 2015)
In this research work, the aspect of food availability in terms of food production is being mainly
considered to understand the aspect of food production and its importance for having food security.
2.3 Urbanisation and its impacts
Increase of people living in the cities and town can be derived as urbanisation. This concept evolved
during the industrial revolution resulting in growth of industries and jobs in various sectors(The Open
University 2016). The global trend of urbanisation has been ever increasing since its inception. Growth of
0
100
200
300
400
500
600
Africa Asia Latin America andCaribbean
Oceania Developed Regions
People under food poverty (in million) in 2015
Africa Asia Latin America and Caribbean Oceania Developed Regions
CE
UeT
DC
olle
ctio
n

12
job opportunities due to industrialisation resulted in migration of people from rural to urban areas.
Urbanisation resulted in increase in urban population finally overtaking rural population in the year 2008
(Urbanisation 2015). Urbanisation is now a common sight in developing countries across Asia and Africa.
Areas in the cities where deprived and poor people resides are given many names such as slums, barrios,
shantytowns etc (Urbanisation 2015).
Urbanisation is becoming a global phenomenon in 21st century. Urbanisation also has various effects
which impacts everyone in negative ways. Deprived area suffers from poor and unhygienic living
conditions with no proper access to daily basic needs such as water, sanitation etc. This results in pollution
in various forms affecting the environment like waste pollution, air pollution and water pollution. (The
Open University 2016). Spread of urbanisation results in urban sprawl covering areas near a growing city
with people migrating and staying in this city fringes making it more compact. This results in loss of
vegetation and pollution of natural resources at site having various environmental disadvantages(Guida‐
Johnson et al.).
2.4 Land-Use/Land-Cover Change and its analysis
Land cover can be defined as physical characteristics covering the surface of the earth such as grassland,
woodland, water barren land etc (OECD 2005a). Land Use can be defined as the usage of land by humans
for carrying out their socio-economic activities such as agricultural, industrial, residential, urban rural etc
(OECD 2005b). Though land cover and land use are different in terms of definition, they are interlinked
and affects one another, hence often used together as one term. Also, change in either may not be the
consequence of the other (Riebsame et al. 1994). Change in landcover usually takes place due to two forces
at play - nature and humans and not necessarily indicate land degradation (Riebsame et al. 1994).
Growth of population results in growth of basic needs such as habitat, food consumption and other
livelihood activities, acting as the driving force of creating demand for land resource. This generates
changes in the land cover over the earth surface cause by land use change due to the growth of population
(De Rosa et al. 2016). Due to population growth, human and economic development activities took place
CE
UeT
DC
olle
ctio
n

13
which resulted in industrialisation followed by green revolution driving land cover changes in massive scale
such as deforestation, desertification, conversion of swamps into urban areas etc. across the globe resulting
in number of environmental degradation such as biodiversity loss, reduction in source of carbon storage,
conversion of swamps to urban lands etc (De Rosa et al. 2016). These land use change causes various
impact environmental and social impacts at large scale leading to increase in greenhouse gas emitting
activities resulting in climate change and global warming (Cooper et al. 2002).
Land Cover (LC) and Land Use (LU) are the two most basic elements to understand and characterise
various changes on the earth surface induced by nature and humans. Greenhouse gas emissions and land
use changes due to agriculture and urbanisation are considered the two major factors which results in
climate change (Cooper et al. 2002). Both the terms Land Use (LU) and Land Cover (LC) are often
interlinked and combined as one term by researchers to understand the effect of one over the other and
to interpret various impacts of Anthropocene activities on environmental modification across the globe
(Pelorosso et al. 2009). Topographical surveys and other conventional methods are used to check LULC
changes but its application is very limited and time consuming to cover larger surface. Hence, to monitor
land-cover of large surface area, remote sensing using satellite imagery is the only feasible and advanced
technology available to human kind at present times to assess and detect LULC changes over a period of
time (Stow et al. 2002). However, analysing LU/LC changes to assess environmental impacts had long
been neglected and undervalued by researchers (Lindeijer 2000)as an important tool to calculate and assess
various environmental anomalies caused by human activities and also carry out economic analysis and
assessment (Banse et al. 2008) (Hertel et al. 2009).
Researchers now uses LU/LC analysis methods for detection change in land use to analyse, assess and
understand - dynamics of forest cover and forest precipitation (Da Ponte et al. 2017); forest loss due to
urban expansion (Salghuna et al. 2018); urban growth (Jiang et al. 2007) and urban sprawl (El Garouani
et al. 2017), its impact on agriculture areas (A. A. Shalaby et al. 2012; A. Shalaby et al. 2015) etc. With
CE
UeT
DC
olle
ctio
n

14
improvement in satellite technology, LU/LC has become a tool that can be used for research purposes in
multi-disciplinary areas.
2.5 Application of Geospatial Technologies for studying and assessing environment
Geospatial technologies can be defined as the combination/set of all the technologies used to collect,
store and process geographic data to analyse and understand various features on the Earth Surface
(Dempsey 2014). These technologies of data acquisition of earth’s surface have evolved over the years.
The art of drawing map can be traced back to prehistoric times which further evolved as a subject in itself
called cartography and map making in the early 19th century. Later, after the invention of photography
during the 19th century, aerial photographs captured by cameras attached to hot-air balloons, pigeons etc
(American Association For the Advancement of Science 2008). After the invention of aeroplane in the
20th century use of aerial photography accelerated for making maps and collecting information during the
second world war(American Association For the Advancement of Science 2008). During the cold war in
the 1960’s, interpretation of photographs took a new turn after the launch of satellite and start of the
CORONA program (Baumann 2009). Arrival of modern computer systems in 1970’s, storage of satellite
images became possible, followed by development of software to process and analyse these images
digitally gave a new dimension to “the science and art of photographic interpretation” creating a new field
of study called geographic information system GIS (American Association For the Advancement of
Science 2008). GIS gave the special ability to store and compile various complex geospatial data
(information of a precise location on earth’s surface) into a set of thematic layer of maps making it easier
for humans to analyse these complex set of data in one platform and be able to communicate it to a large
audience in a simpler form (American Association For the Advancement of Science 2008). Growth of
geospatial technologies has seen its application in a varied sector such as - study of natural resources,
environmental monitoring and conservation, weather forecast, disaster management etc.
The common set of geospatial technologies used to study various earth’s features are as follows:
CE
UeT
DC
olle
ctio
n

15
a. Global Positioning System GPS: A satellite-based geo-positioning system used to determine
location of anything at a given time with the help of satellite signals received(Van der Spek et al.
2009).
b. Remote Sensing: It can be defined as the science of obtaining information about any object,
location or area without being in contact with them (through aircraft or satellites)(National Ocean
and Atmospheric Administration, USA 2018).
c. Geographic Information Systems GIS: Geography (location) and data (attributes) can be regarded
as the two key data types of this geospatial technology. One of the pioneer researcher in the field of
GIS, Prof. Dueker, defined GIS as follows - “A geographic information system is a special case of
information systems where the database consists of observations on spatially distributed features,
activities or events, which are definable in space as points, lines, or areas. A geographic information
system manipulates data about these points, lines, and areas to retrieve data for ad hoc queries and
analyses” (Kenneth Dueker, Portland State University, 1979).
Concept of GIS and Remote Sensing would be discussed further to have a broader understanding of its
concepts and its application for this thesis.
2.5.1 Remote Sensing – The technology and its use
Remote Sensing as defined above the science of acquiring information about any object(its shape, size,
location or area) without being in contact with them through aircraft (aerial photography) or satellites
(sensors)(National Ocean and Atmospheric Administration, USA 2018). This process comprises of
various steps and can be broken down into 7 simple steps (Samarakoon 2017) as shown in Figure 6 below.
CE
UeT
DC
olle
ctio
n

16
Figure 6 Process of Remote Sensing (Source: Samarakoon)
a. Illumination from the energy source provides the required electromagnetic energy to target the
object or area of interest.
b. Radiated energy for the energy source travels through the atmosphere (interacting with the
atmosphere) to the target. This process can take place more than once due to travelling of energy
from target to the sensor.
c. Both the energy and the target have its own properties. The energy travelling from the source through
the atmosphere interacts with the target based on their properties.
d. After interaction, the energy is emitted (scattered) back from the target. This emission has
electromagnetic radiation which needs to be collected and recorded with the help of sensors.
e. Recorded energy is transmitted (in electronic form) to a receiving and processing station. The
received data is than processed into an image form which can be either a hardcopy or in a digital
format.
f. The image is than analysed to extract information about the target for further interpretation.
g. The final component of the process of remote sensing is application of this information from the
data (image) for revealing new information and assisting in solving problems
CE
UeT
DC
olle
ctio
n

17
The data collected is used by researchers and scientists to monitor various processes on the earth’s
surface. The best part of this technology is the its ability to cover large area at a given point of time;
capacity of the sensors to collect images from the non-visible spectrum and transmission of these data’s
in a short period of time (Lloyd 2010).
The sensors used in the satellites are the most important component for carrying out the remote sensing
process. Each object on the surface of the earth transmits energy in varied nature (Liu et al. 2016). Sensors
acquire these energy variations as information of each objects in the form of electromagnetic spectrum (as
seen in Figure 7) helping them to create images of the objects on Earth’s Surface. Unlike human eyes,
sensors are capable of detecting energy variations beyond visible range of electromagnetic
spectrum.(Baumann 2010)
Figure 7 Electromagnetic Spectrum (Satellite Imaging Corp 2018)
There are four sensor characteristics which usually affects the quality satellite image depending on the
specification of the platform and the sensor namely - spatial Resolution, spectral characteristics, temporal
resolution and radiometric resolution (Liang et al. 2012). First three characteristics are the most relevant
with respect to our study and will be discussed further.
Spatial resolution describes the pixel size of a satellite image i.e. the measurement of the smallest feature
on the earth that can be determined by the sensor of the satellite. Higher spatial resolution represents
CE
UeT
DC
olle
ctio
n

18
better image quality because of the ability of sensor to visualise minute details of an object on the earth
surface (Figure 8) (Liang et al. 2012).
Figure 8 Spatial Resolution (Source: Satellite Imaging Corp 2018)
1m resolution 10m resolution
30m resolution
Figure 9 Different pixel resolution of the same image (Source: Liang et al. 2012)
Spectral resolution can be specified as the number and the width of spectral bands in a sensor used to
collect the radiance reflected from earth’s surface. Along with the number of bands, width of a band and
its position in the electromagnetic spectrum is also important to determine better quality of a satellite
image (Liang et al. 2012; Satellite Imaging Corp 2018). Combination of spectral bands results in several
colour composite images. These bands when combined in certain ways helps in identifying specific features
CE
UeT
DC
olle
ctio
n

19
from Earth’s surface like agriculture, forests, urban areas etc (Figure 9). This is one of the most important
factor to take into consideration for detecting change in earth’s features over a period of time (Turner et
al. 2007). Agriculture and vegetation monitoring is another aspect of using remote sensing techniques
where understanding the concept of spectral resolution is very important. Leaves from plants contains
chlorophyll and possess biochemical and biophysical attributes which are specific to each plant (Wang et
al. 2013). This property helps in determining reflectance of plants, as their spectral signatures differ from
each other. The spectral signatures of vegetations are clearly detected in the following spectrum regions –
visible, near-infrared and shortwave. (Wang et al. 2013).
Some of the common band combinations that can be applied to Landsat images and be displayed as red,
green, blue (RGB):
Temporal resolution is described as the measurement of number of times (frequency) a sensor revisits
the same area on surface of Earth. This depends on various factors such as the design of the sensor, its
orbit pattern, viewing angle and distance/altitude from Earth’s surface (Liang et al. 2012). This is another
important aspect used for carrying out time series land-use/land-cover classification. Most of the multi-
temporal/time-series LU/LC detection studies conducted are mostly derived from spectral-temporal
information (Zhai et al. 2018) due to the un-availability of data with better spatial resolution until recently.
Landsat was the first satellite program introduced by USGS for studying the surface of the Earth
launched its first satellite Landsat 1 in 1972 with two image sensors MSS and RBV(Baumann 2009). There
is an open access to the images from Landsat till date. Over the last 40 years, various sensors have been
added (refer to Table 1 below) in subsequent Landsat Satellite series with advancement in technologies
and need for various purposes.
Table 1 Sensors and bands in Landsat Satellites (Source -USGS 2018)
Sensors Satellite (s) Bands Resolutions
(meters)
Scene Size
Multispectral
Scanner (MSS) Landsat 1-3
Band 4-7 -
spectral
60
CE
UeT
DC
olle
ctio
n

20
Landsat 4-5
Band 1-4 -
spectral
60 170 km (north-
south) x 185 km
(east-west)
Thematic
Mapper (TM)
Landsat 4-5 Bands 1-5, and
7 - Spectral
Band 8 -
thermal
30
30
170 km (north-
south) x 183 km
(east-west)
Enhanced
Thematic
Mapper Plus
(ETM+)
Landsat 7 Bands 1-5, and
7 - Spectral
Band 8 -
panchromatic
30
15
170 km (north-
south) x 183 km
(east-west
Operational
Land Imager
(OLI) and
Thermal
Infrared Sensor
(TIRS)
Landsat 8 Bands 1 to 7
and 9 - spectral
Band 8 -
panchromatic
Band 10 and 11
- thermal
30
15
30
170 km (north-
south) x 183 km
(east-west
2.5.2 GIS and Image processing
GIS is a tool used for analysing and manipulating geographic data. Before the advent of GIS software,
analysing vector and raster data needed separate software. GIS made it became easier to process raster and
vector data on the same platform. Satellite images are usually taken from an altitude. Electromagnetic
spectrum while passing through the earth’s atmosphere, faces various hindrance and sometimes gets
scattered or absorbed. Further there are also other factors such as cloud cover, pollution etc. which might
affect the quality of the data collected. Hence, satellite images require corrections and restoration processes
for improving the quality of satellite data (Prudyus et al. 2015).
There are various methods used for interpreting satellite images which are categorised into two categories
pixel-based classification and object-based classification. Under pixel-based classification there are two
techniques – unsupervised and supervised image classification. The two methods under pixel-based
classification are mostly used for classifying satellite images as until recently high-resolution data were not
easily available (GIS Geography 2014)
CE
UeT
DC
olle
ctio
n

21
Unsupervised classification is the most basic technique for image classification. For performing this
classification, one doesn’t need to know the pixel size of the image or create any training samples. As a
first step, the software creates cluster based on the properties of pixels. These clusters are generated by
using clustering algorithm such as K-means and ISODATA. After the clusters are generated, each cluster
are identified into groups/classes as per the requirement of the user (GIS Geography 2014)
Figure 10 Steps of unsupervised classification (Source: GIS Geography 2014)
Supervised classification is the advanced version of unsupervised classification. Here, the analyst must
have prior information about the land cover classes of the study area for developing training samples. User
with prior information about the land-cover creates spectral signatures using polygon tool in the training
sets. Once the training samples are created, the software classifies the image based on the defined training
sets. Maximum likelihood and minimum-distance classification are the most commonly used algorithms
for carrying out supervised classifications (GIS Geography 2014).
Cluster generation
Assigning classes to
the clusters
CE
UeT
DC
olle
ctio
n

22
Figure 11 Steps of supervised classification (Source: GIS Geography 2014)
1
Create Training
Sets
2
Develop spectral
signatures
3
Classify image
CE
UeT
DC
olle
ctio
n
23
3. Methodology
3.1 Research Design
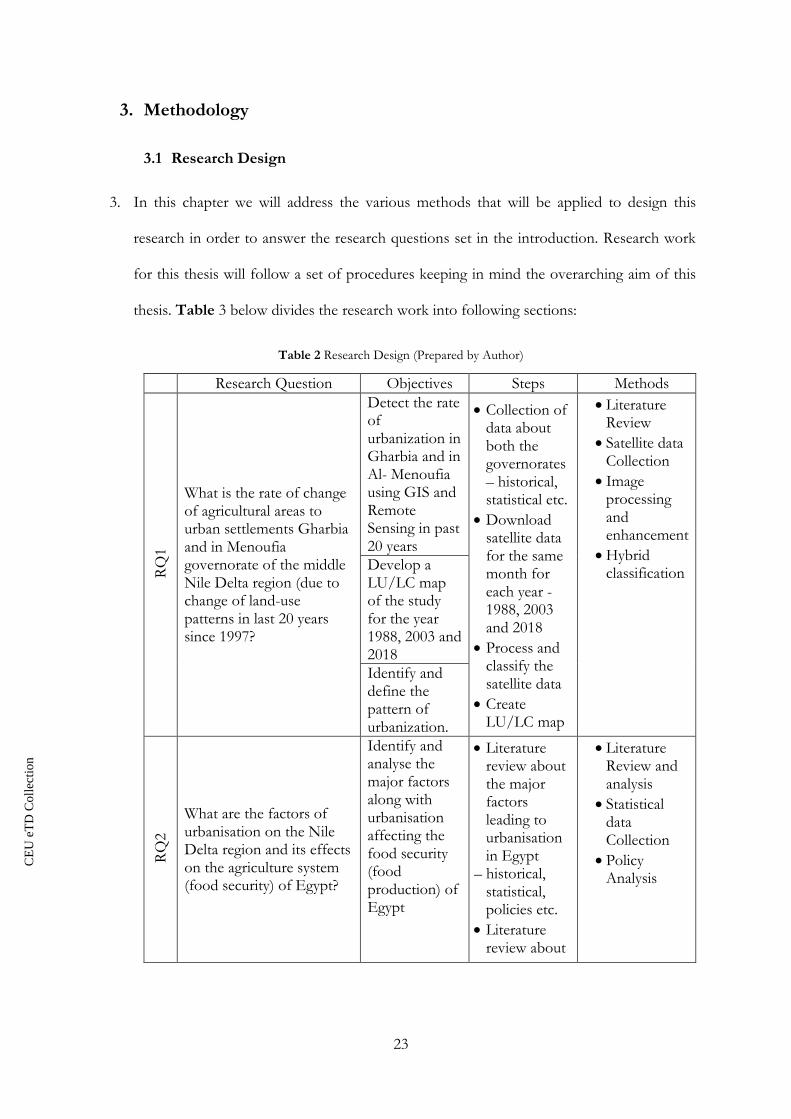
3. In this chapter we will address the various methods that will be applied to design this
research in order to answer the research questions set in the introduction. Research work
for this thesis will follow a set of procedures keeping in mind the overarching aim of this
thesis. Table 3 below divides the research work into following sections:
Table 2 Research Design (Prepared by Author)
Research Question Objectives Steps Methods
RQ
1
What is the rate of change of agricultural areas to urban settlements Gharbia and in Menoufia governorate of the middle Nile Delta region (due to change of land-use patterns in last 20 years since 1997?
Detect the rate of urbanization in Gharbia and in Al- Menoufia using GIS and Remote Sensing in past 20 years
• Collection of data about both the governorates – historical, statistical etc.
• Download satellite data for the same month for each year - 1988, 2003 and 2018
• Process and classify the satellite data
• Create LU/LC map
• Literature Review
• Satellite data Collection
• Image processing and enhancement
• Hybrid classification
Develop a LU/LC map of the study for the year 1988, 2003 and 2018
Identify and define the pattern of urbanization.
RQ
2
What are the factors of urbanisation on the Nile Delta region and its effects on the agriculture system (food security) of Egypt?
Identify and analyse the major factors along with urbanisation affecting the food security (food production) of Egypt
• Literature review about the major factors leading to urbanisation in Egypt
– historical, statistical, policies etc.
• Literature review about
• Literature Review and analysis
• Statistical data Collection
• Policy Analysis
CE
UeT
DC
olle
ctio
n

24
Understand the effects of urbanisation on the agricultural system of Egypt
the effects of urbanisation on agriculture system (food production and security) of Egypt
3.2 Study Area
To address RQ1, the study area is Gharbia and Menoufia - two adjacent governorates located in
the central part of the Nile Delta region towards the north of Egypt. Menoufia is located to the
south of Gharbia and to the north of Cairo and Gharbia is situated 90km north of Cairo. Rural
population dominates urban population in both Gharbia and Menoufia. Agriculture is the most
common activity in both the governorates due to its fertile land and proximity to River Nile.
Gharbia governorate is known for cotton cultivation and its textile industry, while Menoufia is
famous for production of maize, wheat and cotton along with vegetables like green beans and
potatoes which are largely exported(Gharbia Governorate 2018; Menoufia Governorate 2018).
Nile Delta region of Egypt the study area for RQ2.
Figure 12 Study Area - Gharbia and Menoufia Governorates
CE
UeT
DC
olle
ctio
n

25
Table 3 Demographic details of study area (Source: CAPMAS 2015)
Gharbia Governorate Menoufia Governorate
Area 1942 sq. km 2499.3 sq. km
Total Population (2015) 4751 865 3941 293
Urban Population (2015) 1427 235 812833
Rural Population (2015) 3324 630 3128 460
Population Density (2015) 2447 1577
3.3 Data Collection
3.3.1 Satellite Data
For carrying out this research work and answer RQ 1, various LANDSAT 5 and LANDSAT 8
satellite images were acquired from USGS Earth Explorer website (Table 4). From the literature
review conducted, it was evident that agriculture in Egypt takes place in three cropping seasons –
winter, summer and nilii (kharif s season) (Abdel Meguid 2017). Winter is the season where most
of the cereals are grown in Egypt and hence been considered for our study period(EI-Sherif 1997;
Harb et al. 2015). Satellite images (Table below) were chosen from the month of January.
Table 4 Satellite images for carrying out research work
Satellite - LANDSAT_5; ; Sensor – TM; Month – January; Year - 1997
LT05_L1TP_177038_19970102_20180209_01_T1 LT05_L1TP_177039_19970102_20180209_01_T1
CE
UeT
DC
olle
ctio
n

26
Satellite - LANDSAT_8; Sensor - OLI_TIRS; Month – January; Year - 2017
LC08_L1TP_177038_20170109_20170311_01_T1 LC08_L1TP_176039_20170102_20170312_01_T1
LC08_L1TP_177039_20170109_20170311_01_T1
Table 5 Characteristics of Landsat images used
Dates 1997/01/07 1997/01/02 2017/01/09 2017/01/02 2017/01/09
Satellite LANDSAT 5 LANDSAT 5 LANDSAT 8 LANDSAT 8 LANDSAT 8
Sensor ID TM TM OLI TIRS OLI TIRS OLI TIRS
Spatial resolution, m
30 30 30 30 30
Path number 177 177 177 176 177
Row number 038 039 038 039 039
Projection UTM UTM UTM UTM UTM
Datum WGS84 WGS84 WGS84 WGS84 WGS84
UTM Zone 36 36 36 36 36
CE
UeT
DC
olle
ctio
n

27
3.3.2 Literature Review
Literature review was conducted with the purpose of understanding what kind of research work
was already carried out about the effects of urbanisation on agriculture and food security of Egypt
and to identify the major factors affecting the food security (food production) of Egypt in order
to answer RQ1 and RQ2.
Literature review was carried out in the following way:
- The author searched for relevant academic literature in four databases (LUB Search –
Lund University’s database of academic literature, Ebsco, Science Direct, JSTOR).
Author also searched Google for relevant grey literature. All the literature that were
collected was in English as the author doesn’t understand Arabic.
- Keywords were used to find relevant literature about the topic.
• Land Use Change ‘and’ Nile Delta
• Egypt ‘and’ Food Security
• Nile Delta ‘and’ Food Security
• Urbanisation ‘and’ Nile Delta
• Urbanisation ‘and’ Nile Delta ‘and’ Food Security
• Urbanisation ‘and’ Agriculture ‘and’ Egypt
• Urbanisation ‘and’ Egypt ‘and’ Food Security
- After identification of relevant literature, they were reviewed and analysed as mentioned
in data analysis section.
CE
UeT
DC
olle
ctio
n

28
3.4 Data Analysis Methods
3.4.1 Image preparation, processing, classification and accuracy assessment
a. Satellite image preparation - For analysing and classifying a raw satellite image the basic step
that needs to be done is stacking up (composite) all the single band images of a satellite to
get the multi-spectral image which will be used for visual analysis (ArcGIS Desktop 2018).
Figure 13 Concept of stacking (composite) layers (Source: (ArcGIS Desktop 2018)
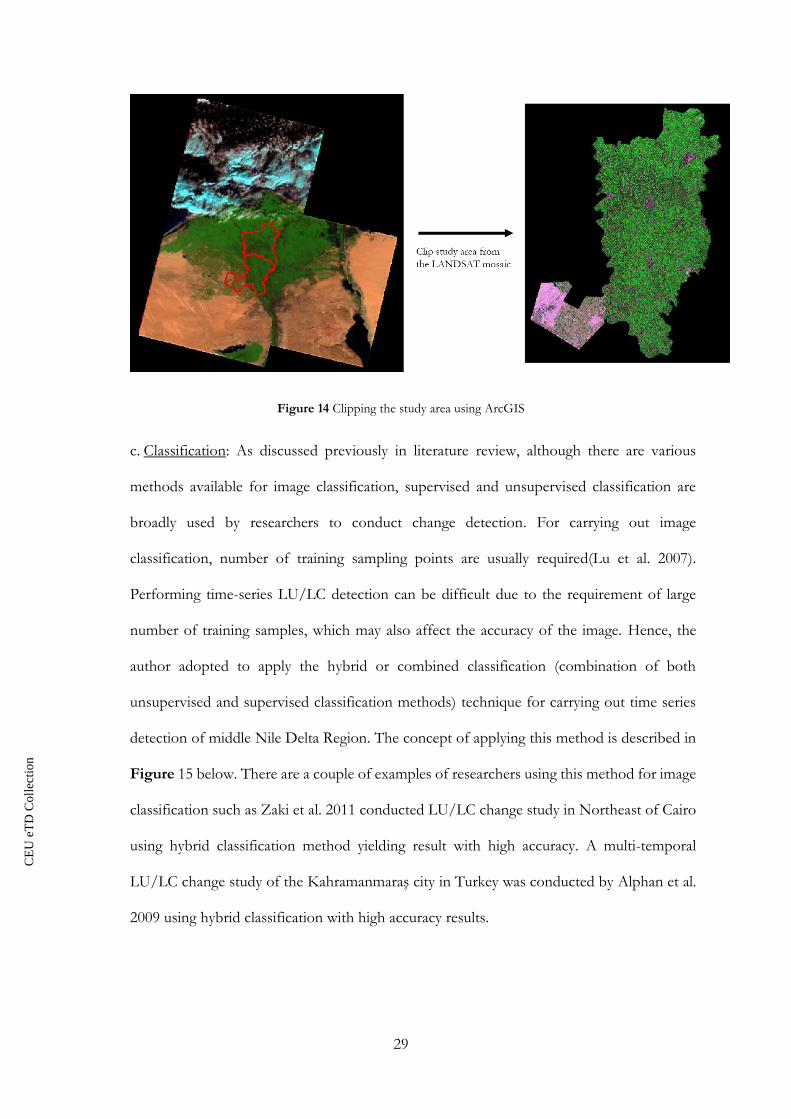
b. Mosaic: After stacking of all the single bands to get a multi-spectral image, the images
obtained were required to be merged (mosaiced) as the author used two tiles from 1997 and
three tiles form 2017 as seen in Table 4. Since the mosaiced tiles covers nearly the entire
Nile Delta region, the mosaiced image was clipped to the study region as shown in Figure
14 below.
CE
UeT
DC
olle
ctio
n
29
Figure 14 Clipping the study area using ArcGIS
c. Classification: As discussed previously in literature review, although there are various
methods available for image classification, supervised and unsupervised classification are
broadly used by researchers to conduct change detection. For carrying out image
classification, number of training sampling points are usually required(Lu et al. 2007).
Performing time-series LU/LC detection can be difficult due to the requirement of large
number of training samples, which may also affect the accuracy of the image. Hence, the
author adopted to apply the hybrid or combined classification (combination of both
unsupervised and supervised classification methods) technique for carrying out time series
detection of middle Nile Delta Region. The concept of applying this method is described in
Figure 15 below. There are a couple of examples of researchers using this method for image
classification such as Zaki et al. 2011 conducted LU/LC change study in Northeast of Cairo
using hybrid classification method yielding result with high accuracy. A multi-temporal
LU/LC change study of the Kahramanmaraş city in Turkey was conducted by Alphan et al.
2009 using hybrid classification with high accuracy results.
CE
UeT
DC
olle
ctio
n

30
Figure 15 Hybrid or combined classification (combination of both unsupervised and supervised classification
methods) applied for change detection study
d. Group of classes: After conducting literature review about detection of LU/LC classification
in Nile Delta region, following 4 classes - agriculture, urban, water and barren were finalised
to assess the LU/LC change detection in the study area considering a similar research
conducted by Hegazy et al. 2015 in the Nile Delta Region.
e. Accuracy Assessment: To check the accuracy of the classification done, method of stratified
random sampling was used. As suggested by (Congalton 1991), the thumb rule is to collect
a minimum of 50 samples for each land use class to assess accuracy. A total of 200 samples
were selected for each image classification. The simple formula used to calculate classification
accuracy is: (Number of Agreements/Total number of Reference Points) (Chuvieco et al.
2009). As per Chuvieco et al. 2009, following this formula might result in errors as few of
the number of agreements were obtained by chance. Hence, Chuvieco et al. 2009 suggested
performing of Kappa statistics analysis for removing any effects from random factors and
assess the actual agreement.
Image of the Study Area
Clustering of Study area using K-means
Supervised training of the clusters into
classes
Labelling of classes
Accuracy Assessment using random stratified
sampling
CE
UeT
DC
olle
ctio
n

31
The complete process to be followed to carry out land-use classification can be described in a
flow chart below.
Figure 16 Classification Process Followed
3.4.2 Literature analysis
After completion of collection of relevant literature, the author read all the articles and research
papers taking notes from each of them for the thesis. Each literature was analysed for its contents
to create themes/topics and code them to various factors affecting food security of Egypt.
CE
UeT
DC
olle
ctio
n

32
4. Results and Analysis
This chapter interprets the results obtained from the analysis of maps using geospatial
technologies to answer along with relevant literature as mentioned in the methodology to answer
RQ1. For rese
4.1 Analysis of the Land Use/Land Cover change (RQ1)
The main aim of carrying LU/LC change analysis was to understand the impact of urbanisation
on the study area. Aim of this analysis was to understand if the land use change of the study area
during (1997-2017) has affected the food security of Egypt, especially in the rate of change
agricultural lands into urban areas. The study area, as mentioned in the chapter 3, habitats mostly
rural population which indulges mostly in agricultural activities. Decrease in agricultural might
affect their livelihood and the food productivity of the region. The other main goal of this RQ was
to create a LU/LC thematic map which would be used as the foundation for future research in the
study area. The maps below (Figure 17-18) are obtained as a result of the classification of the
satellite images to detect the the Land Use/Land Cover in the study region.
Accuracy is an important aspect of every research studies conducted for better usage of its
information in further studies and decision-making processes. Analysis without a quantitative
statement of its accuracy is often not accepted by researchers. Anderson et al. 1976 suggested that
accuracy in between 85-90% is usually the standard accuracy for conducting a LU/LC study. The
land use/land cover classification done through the methods mentioned in chapter 3 yielded an
accuracy of 89.00% for 1997 and 84.00% for 2017 (Table 6). Due to expansion in urban areas as
well as agricultural lands in the study area in 2017 compared to 1997, there was often confusion in
the spectral signatures of pixels between classes of agricultural areas, urban areas, and barren land.
This resulted in lower accuracy of 2017 land use classification compared to 1997.
CE
UeT
DC
olle
ctio
n

33
Table 6 Statistics of Accuracy Assessment (Source -Author)
Year Accuracy Totals
1997 Kappa (K^) Statistics 0.8533
1997 Classification Accuracy 89.00%
2017 Kappa (K^) Statistics 0.7867
2017 Classification Accuracy 84.00%
a. Change in agricultural areas: In the study area, the area for cultivation increased in the last to
decades with addition of new agricultural lands through land reclamation in the desert fringes
of Nile Delta. The observed change in agricultural area, in the last two decades was 6.10%
adding nearly 252.77 sq.km of agricultural lands (Table 7, Figure 19). The agricultural cover
in the study region increased from 2071.15 sq.km in 1997 to 2197.59 sq.km in 2017 (Table.
b. Urbanisation: Urban areas play a vital role in the study area because of the dependency of
the major population on agriculture for their livelihood. Sizes of the cities and urban areas
increased by 21.19% from 1192.56 sq.km in 1997 to 1445.33 sq.km in 2017 (Table 7, Figure
19). This may pose future threat to the rural population of the region
c. Surface Water: Water from the River Nile passes by the city on both the sides. However,
surface water within the region showed a decreasing trend by 25.70% (Table 8, Figure 22).
This can also be due to the increase in water stress on the region with increase in population
and urban growth followed by land reclamation in the desert fringes of the study area.
d. Barren Lands: The most positive trend analysed by the study was the decrease in the area of
barren lands by 63.52% (Table 8, Figure 22) which is mostly due to the various land
reclamation projects that can be seen towards the south-west region on the study area. Most
of the reclaimed areas might still needs further development for being suitable to cultivate.
CE
UeT
DC
olle
ctio
n

34
Figure 17 Land Use classification map of 1997 (Prepared by Author)
CE
UeT
DC
olle
ctio
n

35
Figure 18 Land Use classification map of 2017 (Prepared by Author)
Observed land cover changes in the study region in area (sq.km) and percentage is shown in
Table 7 and Figure 19 showcasing yearly averages of change of each class. Figure 20 and 21
explains the proportion of each land class during the study period. Table 8 along with Figure 22
explains the change in the land use patterns of the study area in past 20 years from 1997-2017. The
data obtained is explained using Tables and graphs for better interpretation of the results to the
reader.
CE
UeT
DC
olle
ctio
n

36
Table 7 LU/LC Statistics of the Study Area (Calculations by Author)
Units 1997 2017
Agriculture
Area in sq.km 2071.15 2197.59
% of Total Land 49.69206 52.73369
Urban
Area in sq.km 1192.56 1445.33
% of Total Land 28.61249 34.68235
Water
Area in sq.km 514.47 382.232
% of Total Land 12.34342 9.172095
Barren
Area in sq.km 389.79 142.184
% of Total Land 9.352035 3.411868
Figure 19 Land Cover Change in study area (1997-2017) (Calculations by Author)
0
500
1000
1500
2000
2500
Agriculture Urban Water Barren
Sq.K
m
Land Cover Change in the study area from 1997-2017
1997 2017
CE
UeT
DC
olle
ctio
n

37
Figure 20 Proportion of each land class in 1997 based on LU Classification (Calculations by Author)
Figure 21 Proportion of each class in 2017 based on LU Classification (Calculations by Author)
Table 8 Changes in LU/LC of Study Area, 1997-2017 (Calculations by Author)
Units Change between
(1997-2017)
Agriculture Change in Sq.km 126.44
Agriculture50%
Urban29%
Water12%
Barren9%
Proportions of each class to the whole studied area in 1997
Agriculture Urban Water Barren
Agriculture53%
Urban35%
Water9%
Barren3%
Proportions of each class to the whole studied area in 2017
Agriculture Urban Water Barren
CE
UeT
DC
olle
ctio
n

38
% Change 6.10
Urban
Change in Sq.km 252.77
% Change 21.19
Water Change in Sq.km -132.238
% Change -25.70
Barren
Change in Sq.km -247.606
% Change -63.52
Figure 22 Change in Land Use Patterns (between 1997-2017) (Calculations by Author)
It was observed through the study of land use classification, that the pattern of urbanisation was
seen over agricultural lands rather than the area of desert fringes in the southwest region of the
study area. This is a vital point to note because the existing agricultural lands are a result of
sediment deposition by the Nile river since ancient times which made the Nile Delta fertile in
nature. Whereas, all the land reclamation is happening in desert fringes, which will require time to
be develop fertile nature. Hence, losing the fertile land to urbanisation can be non-renewable in
-300
-200
-100
0
100
200
300
Change in percentge Change in Area
Agriculture Urban Water Barren
CE
UeT
DC
olle
ctio
n

39
nature which might affect the pattern of agricultural production due to decrease in fertile land
cover.
CE
UeT
DC
olle
ctio
n

40
5. Discussion
Literature reivew about urbanisation and its effects on Egyptian agricultural resulted in various
topics which results in urbanisation and affects the food security of Egypt. However, since the
topic of urbanisation isvast and inter-disciplinary in nature, the themes for discussion were
narrowed down to the major factors of urbanisation affecting agriculture in Egypt, relating to RQ1
and RQ2 which will be discussed below.
5.1 Cause of urbanisation and its implication on Egypt’s agriculture
Egypt’s population growing at a rate of 2-3%, has resulted in becoming the most populous
country in the MENA region. Egypt’s population has grown by four times since 1952 from 21.2
million (Julia Zinkina et al. 2013) to 93 million in 2018 (CAPMAS 2018). Egypt’s went through
trends of modernisation due to diversification of the Egypt’s economy through industrialisation
in the 19th century (Julia Zinkina et al. 2013). Economic development and growth in population
are natural contributors of urbanisation(A. A. Shalaby et al. 2012). For Egypt the beginning of
industrialisation was cotton production, due to it important role in British Industrial revolution.
Fertile Nile delta was suitable for cotton farming, making Egypt the supplier of cotton to British
textile industry. This resulted in change in agriculture practices in Egypt from small scale farming
to large scale farming, resulting in growth of capitalist system. This resulted in migrations of rural
workforce to urban areas in large number during the 1970’s (Bent 2015;CPAS 2018).
Egypt faces high population density owing to its unique geographic feature of Nile Delta which
occupies just 4% of Egypt’s total area, while accommodating 96% of its population. This results
in a decreasing trend of land availability per capita, 0.029 ha/person in 2014, which is one of the
lowest in the world. (World Bank 2015). Moreover, nearly 40% of Egypt’s industries are located
in the Nile. This creates a straining effect on the limited available resource land and water
(Zaghloul et al. 2011).
CE
UeT
DC
olle
ctio
n

41
Overpopulation followed by transition of national economy to industrial economy resulted in
urbanisation and desertification. As a result, there is a decreasing trend in cultivated areas in the
Middle Nile Delta region comprising a major agriculture zone of Egypt (Figure) (Zaghloul et al.
2011).
Figure 23 Decrease in cultivated area in Middle Nile Delta Region (Image Source - Zaghloul et al. 2011)
There is also an increase in informal urbanization which exceeds the reported area of loss of
agricultural land which is further affected by rise in the sea-level, leading to a loss of nearly 10
percent of the fertile area in the valley and the Nile delta region(Redeker et al. 2014). It is estimated
with present growth of population and urban expansion rates, by the year 2100, urban
encroachment may result in land use change between 12,500 to 25,000 sq.km in the Nile Delta
region(Redeker et al. 2014). Furthermore, if the urban growth follows the trend of urbanisation of
last two decades, it is estimated that the entire fertile area of Nile delta will be lost in less than 120
years (Redeker et al. 2014). Also, as per the UN Convention to Combat Desertification, Egypt is
suffering from high rates of desertification, losing 34 hectares of land on a daily basis, which is the
highest in the world. The impact of urbanisation is estimated to be 5 times more than the impact
of climate change on the Nile delta region.(Redeker et al. 2014).
Egyptian Government has tried to undertake various measures to combat this growing problem
such as (building Law 119/08) under the General Organization of Physical Planning (GOPP) at
CE
UeT
DC
olle
ctio
n

42
the Ministry of Housing and UN Habitat; the “desert green” project of land reclamation from
desert areas since the late 1990’s (Werr 2015;Redeker et al. 2014). All such initiatives have failed to
deliver on its objectives while costing huge amount of public money due to lack of institutional
capacities and experts, reliable budget and weaker project planning and implementation strategies
(Redeker et al. 2014). Experts consider desert land-reclamation as highly vulnerable process with
deep environmental problems and high probability of failure (Attwa et al. 2017) followed by huge
cost requirement.
A report by Cairoobserver, stated various loopholes in government policies resulting in
disastrous output of urban encroachment in Nile Delta region. There are various factors leading
to urban growth encroaching arable lands which are intertwined with each other. Lack of
governance, followed by gap in implementation of national policies and housing policies, improper
laws for land ownership and zoning are some of them. Raise of taxes on farming and lifting up of
famers subsides followed by increase in policies to import wheat at nominal rates has resulted in
degradation of the agricultural economy and production. Cost of modern farming equipment and
supplies has increased also making it less accessible to the farmers (Cairobserver 2015). As a
consequence, there has been a decreasing trend of agricultural employment followed by lower
contribution of agriculture to countries GDP (refer to figure 3 and 4).
Wheat import polices and dependence on imported wheat has also been considered as one of
the biggest contributors to urban encroachment. Value of arable lands are hence, decreasing for
carrying out agricultural activities, making farmers even poorer. However, these arable lands are
far more valuable if converted to urban areas due to high demand of built-up areas, increasing its
worth ten times more. This is mainly caused by increase in population leading to high demand of
land for building habitation (Cairobserver 2012).
CE
UeT
DC
olle
ctio
n

43
6. Conclusion
The aim of this research work was to assess the growth of urban areas in middle Nile Delta
region of Egypt and its potential impacts with the purpose to add to the knowledge gap about
urban growth in this region of Nile Delta, due to lack of research literature and importance of this
region to Egypt from agriculture perspective. To achieve the research objective of this thesis two
research questions were developed RQ1 - What is the rate of change of agricultural areas to
urban settlements Gharbia and in Menoufia governorate of the middle Nile Delta region
due to change of land-use patterns in last 20 years since 1997? RQ2 - What are the factors
of urbanisation on the Nile Delta region and its effects on the agriculture system (food
security) of Egypt?
To address the first research question, a land use/land cover classification map was developed
with the help of geospatial technologies for a period of 20 years from 1997 to 2017. From the
study it was evident that there was a decrease in agricultural areas and surface water due to
increasing urban areas in the study region. This established the impacts of urban encroachment in
the study region.
To address the second research question, a comprehensive literature review was carried out to
understand the major factors leading to encroachment of arable lands to be converted to urban
areas in the Nile delta region. The major factors were discussed in chapter 5.
Egypt, located in the semi-arid region, depends on river Nile to fulfil all its needs. Moreover,
95% of the total population of Egypt resides in the Nile Delta and its valley making it the lifeline
of Egypt. Human activities resulting in various impacts might affect Egypt’s source of water posing
as a huge risk for country’s development. Based on the results from this research work following
recommendation measures might help in tackling the growing problem.
CE
UeT
DC
olle
ctio
n

44
1. There is a vital requirement to be less dependent on importing wheat and other cereals, rather
being more self-sufficient. There are two advantages in following this recommendation – a)
increase in the value of arable lands for carrying out agriculture with better economic outputs
from the produce; b) Less vulnerability to the fluctuating global food prices and rate of
currency exchange, resulting in minimisation of fiscal deficit as result of less dependency on
food import and being more self-sufficient.
2. Need to design implementable and sustainable urban models based on population density for
being able to accommodate maximum number of people in a lesser amount of land area
catering the need of Egypt’s high population density helping to save more arable land to feed
the masses.
3. There is an urgent need to work for strong socioeconomic development, followed by
education and capacity building. This will create expert human resources with better skills and
expertise to tackle the ongoing problem of improper planning and implementation of project
and policies along with climate change demands.
4. Practice of urban agriculture and rooftop farming adding to the urban greenery, followed by
creation of jobs and increase in food production, leading to minimisation of intensive
agriculture practices creating less pollution.
CE
UeT
DC
olle
ctio
n

45
7. References
American Association For the Advancement of Science. 2008. What Are Geospatial
Technologies? AAAS - The World’s Largest General Scientific Society.
https://www.aaas.org/content/what-are-geospatial-technologies. Accessed May 25, 2018
Abdel Meguid, M. 2017. Key Features of the Egypt’s Water and Agricultural Resources. In .
Berlin, Heidelberg: Springer Berlin Heidelberg. doi:10.1007/698_2017_41.
Abdel-Shafy, H.I., and Aly, R.O. 2002. Water Issue in Egypt: Resources, Pollution and
Protection Endeavors, 15.
Alfiky, A., Kaule, G., and Salheen, M. 2012. Agricultural Fragmentation of the Nile Delta; A
Modeling Approach to Measuring Agricultural Land Deterioration in Egyptian Nile Delta.
Procedia Environmental Sciences 14: 79–97. doi:10.1016/j.proenv.2012.03.009.
Alphan, H., Doygun, H., and Unlukaplan, Y.I. 2009. Post-Classification Comparison of Land
Cover Using Multitemporal Landsat and ASTER Imagery: The Case of Kahramanmaraş,
Turkey. Environmental Monitoring and Assessment 151 (1–4): 327–36. doi:10.1007/s10661-
008-0274-x.
ANDERSON, J.R., HARDY, E.E., ROACH, J.T., and WITMER, R.E. 1976. A Land Use And
Land Cover Classification System For Use With Remote Sensor Data, 41.
ArcGIS Desktop. 2018. Composite Bands—Data Management Toolbox | ArcGIS Desktop.
http://pro.arcgis.com/en/pro-app/tool-reference/data-management/composite-bands.htm.
Attwa, M., and El-Shinawi, A. 2017. An Integrative Approach for Preliminary Environmental
Engineering Investigations amidst Reclaiming Desert-Land: A Case Study at East Nile Delta,
Egypt. Environmental Earth Sciences 76 (8): 304. doi:10.1007/s12665-017-6627-4.
Banse, M., van Meijl, H., Tabeau, A., and Woltjer, G. 2008. Will EU Biofuel Policies Affect
Global Agricultural Markets? European Review of Agricultural Economics 35 (2): 117–41.
doi:10.1093/erae/jbn023.
Baumann, P.R. 2009. History of Remote Sensing, Satellite Imagery.
https://www.oneonta.edu/faculty/baumanpr/geosat2/RS%20History%20II/RS-History-
Part-2.html. Accessed May 25, 2018
———. 2010. Introduction to Remote Sensing. Geo/SAT 2.
http://www.oneonta.edu/faculty/baumanpr/geosat2/RS-Introduction/RS-
Introduction.html. Accessed May 25, 2018
Bent, P.H. 2015. Agrarian Change and Industrialization in Egypt, 1800-1950. Colloque
International Recherche & Regulation, 12.
Breene, K. 2016. Food Security and Why It Matters. World Economic Forum.
https://www.weforum.org/agenda/2016/01/food-security-and-why-it-matters/.
CE
UeT
DC
olle
ctio
n

46
Cairobserver. 2012. Bread and Urbanism. http://cairobserver.com/post/15197946860/bread-
and-urbanism#.WxR4a0iFO00. Accessed May 25, 2018
Cairobserver. 2015. Urban Encroachment on Egypt’s Agricultural Land.
http://cairobserver.com/post/123585440769/urban-encroachment-on-egypts-agricultural-
land. Accessed May 25, 2018
CAPMAS. 2015. Egypt in Figures.
http://www.msrintranet.capmas.gov.eg/pdf/EgyptinFigures2015/EgyptinFigures/Tables/P
DF/1-%20%D8%A7%D9%84%D8%B3%D9%83%D8%A7%D9%86/pop.pdf. Accessed
May 25, 2018
CAPMAS. 2018. Population Clock. http://www.capmas.gov.eg/HomePage.aspx.
Chuvieco, E., and Huete, A. 2009. Fundamentals of Satellite Remote Sensing. Boca Raton: CRC
Press.
Congalton, R.G. 1991. A Review of Assessing the Accuracy of Classifications of Remotely
Sensed Data. Remote Sensing of Environment 37 (1): 35–46. doi:10.1016/0034-
4257(91)90048-B.
Cooper, R.N., Houghton, J.T., McCarthy, J.J., and Metz, B. 2002. Climate Change 2001: The
Scientific Basis. Foreign Affairs 81 (1): 208. doi:10.2307/20033020.
CPAS. 2018. Urbanization In Egypt since 19th Century - an Historical Review..
http://www.cpas-
egypt.com/pdf/FisalAbdelMaksoud/MS.c/003%20%20Urbanization%20In%20Egypt.pdf.
Accessed May 25, 2018
Da Ponte, E., Mack, B., Wohlfart, C., Rodas, O., Fleckenstein, M., Oppelt, N., Dech, S., and
Kuenzer, C. 2017. Assessing Forest Cover Dynamics and Forest Perception in the Atlantic
Forest of Paraguay, Combining Remote Sensing and Household Level Data. Forests 8 (10):
389. doi:10.3390/f8100389.
De Rosa, M., Knudsen, M.T., and Hermansen, J.E. 2016. A Comparison of Land Use Change
Models: Challenges and Future Developments. Journal of Cleaner Production 113 (February):
183–93. doi:10.1016/j.jclepro.2015.11.097.
Dempsey, C. 2014. What Is the Difference Between GIS and Geospatial? GIS Lounge.
https://www.gislounge.com/difference-gis-geospatial/. Accessed May 25, 2018
EI-Sherif, M. 1997. Plant Nematode Problems and Their Control in the Near East Region. FAO
Plant Production and Protection. http://www.fao.org/docrep/v9978e/v9978e0e.htm.
Accessed May 25, 2018
El Garouani, A., Mulla, D.J., El Garouani, S., and Knight, J. 2017. Analysis of Urban Growth
and Sprawl from Remote Sensing Data: Case of Fez, Morocco. International Journal of
Sustainable Built Environment 6 (1): 160–69. doi:10.1016/j.ijsbe.2017.02.003.
FAO. 2003. Trade Reforms and Food Security - Conceptualizing the Linkages. FAO.
http://www.fao.org/docrep/005/y4671e/y4671e00.htm#Contents. Accessed May 25, 2018
CE
UeT
DC
olle
ctio
n

47
FAO 2015. FAO The State of Food Insecurity in the World 2015. http://www.fao.org/3/a-
i4646e.pdf? Accessed May 25, 2018
Food Balance Sheets - Knoema.Com. 2018. Knoema. Accessed May 29.
https://knoema.com//FAOFBS2017/food-balance-sheets?action=download. Accessed May
25, 2018
Gerlach, C. 2015. Famine Responses in the World Food Crisis 1972–5 and the World Food
Conference of 1974. European Review of History: Revue Européenne d’histoire 22 (6): 929–
39. doi:10.1080/13507486.2015.1048191.
Gharbia Governorate. 2018. Wikipedia.
https://en.wikipedia.org/w/index.php?title=Gharbia_Governorate&oldid=841798734.
Accessed May 25, 2018
GIS Geography. 2014. Image Classification Techniques in Remote Sensing. GIS Geography.
https://gisgeography.com/image-classification-techniques-remote-sensing/. Accessed May
25, 2018
Gross, R., Schoeneberger, H., Pfeifer, H., and Preuss, H.-J.A. 2000. The Four Dimensions of
Food and Nutri- Tion Security:Definitions and Concepts, 17.
Guida‐Johnson, B., Faggi, A.M., and Zuleta, G.A. Effects of Urban Sprawl on Riparian
Vegetation: Is Compact or Dispersed Urbanization Better for Biodiversity? River Research
and Applications 33 (6): 959–69. doi:10.1002/rra.3138.
Hall, A.E., Cannell, G.H., and Lawton, H.W. 1979. Agriculture in Semi-Arid Environments.
Ecological Studies 34. Berlin, Heidleberg, New York: Springer.
https://link.springer.com/chapter/10.1007%2F978-3-642-67328-3_3. Accessed May 25,
2018
Harb, O.M., Abd El-Hay, G.H., Hager, M.A., and Abou El-Enin, M.M. 2015. Studies on
Conservation Agriculture in Egypt. Annals of Agricultural Sciences 60 (1): 105–12.
doi:10.1016/j.aoas.2015.04.004.
Hegazy, I.R., and Kaloop, M.R. 2015. Monitoring Urban Growth and Land Use Change
Detection with GIS and Remote Sensing Techniques in Daqahlia Governorate Egypt.
International Journal of Sustainable Built Environment 4 (1): 117–24.
doi:10.1016/j.ijsbe.2015.02.005.
Hereher, M.E. 2010. Vulnerability of the Nile Delta to Sea Level Rise: An Assessment Using
Remote Sensing. Geomatics, Natural Hazards and Risk 1 (4): 315–21.
doi:10.1080/19475705.2010.516912.
Hertel, T.W., Lee, H.-L., Rose, S., and Sohngen, B. 2009. Modelling Land Use Related
Greenhouse Gas Sources and Sinks and Their Mitigation Potential. In Economic Analysis of
Land Use in Global Climate Change Policy, 123–53. doi:10.4324/9780203882962.
CE
UeT
DC
olle
ctio
n

48
Janick, J. 2016. Origins of Agriculture in Egypt. In Encyclopaedia of the History of Science,
Technology, and Medicine in Non-Western Cultures, edited by Helaine Selin, 3460–78.
Dordrecht: Springer Netherlands. doi:10.1007/978-94-007-7747-7_10237.
Jiang, F., Liu, S., Yuan, H., and Zhang, Q. 2007. Measuring Urban Sprawl in Beijing with Geo-
Spatial Indices. Journal of Geographical Sciences 17 (4): 469–78. doi:10.1007/s11442-007-
0469-z.
Julia Zinkina, and Andrey Korotayev. 2013. Urbanization Dynamics in Egypt: Factors, Trends,
Perspectives. Arab Studies Quarterly 35 (1): 20. doi:10.13169/arabstudquar.35.1.0020.
Lambin, E.F., Baulies, X., Bockstael, N., Fischer, G., Krug, T., Leemans, R., Moran, E.F., et al.
1999. Land-Use and Land-Cover Change (LUCC) Implementation Strategy. 10. Sweden and
Germany: International Geosphere-Biosphere Programme and the International Human
Dimensions Programme on Global Environmental Change.
Liang, S., Li, X., and Wang, J., eds. 2012. A Systematic View of Remote Sensing. In Advanced
Remote Sensing, 1–31. Elsevier. doi:10.1016/B978-0-12-385954-9.00001-0.
Lindeijer, E. 2000. Review of Land Use Impact Methodologies. Journal of Cleaner Production 8
(4): 273–81. doi:10.1016/S0959-6526(00)00024-X.
Liu, J.G., and Mason, P.J. 2016. Image Processing and GIS for Remote Sensing: Techniques and
Applications. Chichester, UK: John Wiley & Sons, Ltd. doi:10.1002/9781118724194.
Lloyd, C.D. 2010. Local Models for Spatial Analysis. 2nd ed. CRC Press.
Loayza, N., and Raddatz, C. THE COMPOSITION OF GROWTH MATTERS FOR
POVERTY ALLEVIATION. The World Bank, 32.
Lu, D., and Weng, Q. 2007. A Survey of Image Classification Methods and Techniques for
Improving Classification Performance. International Journal of Remote Sensing. 28 (5): 823–
870.
Menoufia Governorate. 2018. Wikipedia.
https://en.wikipedia.org/w/index.php?title=Monufia_Governorate&oldid=838941551.
National Ocean and Atmospheric Administration, USA. 2018. What Is Remote Sensing?
https://oceanservice.noaa.gov/facts/remotesensing.html. Accessed May 25, 2018
OECD. 2005a. Land Cover. Glossary of Statistical Terms.
https://stats.oecd.org/glossary/detail.asp?ID=6489. Accessed May 25, 2018
OECD. 2005b. Land Use. Glossary of Statistical Terms.
https://stats.oecd.org/glossary/detail.asp?ID=6493. Accessed May 25, 2018
Pelorosso, R., Leone, A., and Boccia, L. 2009. Land Cover and Land Use Change in the Italian
Central Apennines: A Comparison of Assessment Methods. Applied Geography 29 (1): 35–
48. doi:10.1016/j.apgeog.2008.07.003.
Power, L. 2014. Death on the Nile: Egypt’s Burgeoning Food and Water Security Crisis. Strategic
Analysis Paper. http://futuredirections.org.au/wp-
CE
UeT
DC
olle
ctio
n

49
content/uploads/2014/07/Death_on_the_Nile_-_Egypts_Food__Water_Security.pdf.
Accessed May 25, 2018
Prudyus, I., Tkachenko, V., Kondratov, P., Fabirovskyy, S., Lazko, L., and Hryvachevskyi, A.
2015. FACTORS AFFECTING THE QUALITY OF FORMATION AND RESOLUTION
OF IMAGES IN REMOTE SENSING SYSTEMS 5: 6.
Ravallion, M. 2005. Inequality Is Bad for the Poor. World Bank, 50.
Ravallion, M., and Chen, S. 2007. China’s (Uneven) Progress against Poverty. Journal of
Development Economics 82 (1): 1–42. doi:10.1016/j.jdeveco.2005.07.003.
Redeker, C., and Kantoush, S.A. 2014. The Nile Delta: Urbanizing on Diminishing Resources.
Built Environment 40 (2): 201–12. doi:10.2148/benv.40.2.201.
Riebsame, W.E., Meyer, W.B., and Turner, B.L. 1994. Modeling Land Use and Cover as Part of
Global Environmental Change. Climatic Change 28 (1): 45–64. doi:10.1007/BF01094100.
Salghuna, N.N., Rama Chandra Prasad, P., and Asha Kumari, J. 2018. Assessing the Impact of
Land Use and Land Cover Changes on the Remnant Patches of Kondapalli Reserve Forest of
the Eastern Ghats, Andhra Pradesh, India. The Egyptian Journal of Remote Sensing and
Space Science, February. doi:10.1016/j.ejrs.2018.01.005.
Samarakoon, L. 2017. Introduction to Remote Sensing.
http://www.isprs.org/caravan/documents/Lao_Basic_RS.pdf. Accessed May 25, 2018
Satellite Imaging Corp. 2018. Characterization of Satellite Remote Sensing Systems. Remote
Sensing. https://www.satimagingcorp.com/services/resources/characterization-of-satellite-
remote-sensing-systems/. Accessed May 25, 2018
Shalaby, A., and Moghanm, F.S. 2015. Assessment of Urban Sprawl on Agricultural Soil of
Northern Nile Delta of Egypt Using RS and GIS. Chinese Geographical Science 25 (3): 274–
82. doi:10.1007/s11769-015-0748-z.
Shalaby, A., and Tateishi, R. 2007. Remote Sensing and GIS for Mapping and Monitoring Land
Cover and Land-Use Changes in the Northwestern Coastal Zone of Egypt. Applied
Geography 27 (1): 28–41. doi:10.1016/j.apgeog.2006.09.004.
Shalaby, A.A., Ali, R.R., and Gad, A. 2012. Urban Sprawl Impact Assessment on the Agricultural
Land in Egypt Using Remote Sensing and GIS: A Case Study, Qalubiya Governorate. Journal
of Land Use Science 7 (3): 261–73. doi:10.1080/1747423X.2011.562928.
Simon, G.-A. 2012. History of Food Security, 28.
Stow, D.A., and Chen, D.M. 2002. Sensitivity of Multitemporal NOAA AVHRR Data of an
Urbanizing Region to Land-Use/Land-Cover Changes and Misregistration. Remote Sensing
of Environment 80 (2): 297–307. doi:10.1016/S0034-4257(01)00311-X.
Tellioglu, I., and Konandreas, P. 2017. Agricultural Policies, Trade and Sustainable Development
in Egypt. International Centre for Trade and Sustainable Development (ICTSD) and Rome:
United Nations Food and Agriculture Organization (FAO)., 60.
CE
UeT
DC
olle
ctio
n

50
The Open University. 2016. Urbanisation - Trends, Causes and Effects: View as Single Page.
http://www.open.edu/openlearncreate/mod/oucontent/view.php?id=79940&printable=1.
Accessed May 25, 2018
Turner, B.L., Lambin, E.F., and Reenberg, A. 2007. The Emergence of Land Change Science for
Global Environmental Change and Sustainability. Proceedings of the National Academy of
Sciences 104 (52): 20666–71. doi:10.1073/pnas.0704119104. Accessed May 25, 2018
United Nations. 2015. SDG 2 Zero Hunger - Why It Matters? United Nations.
https://www.un.org/sustainabledevelopment/wp-content/uploads/2016/08/2_Why-it-
Matters_ZeroHunger_2p.pdf. Accessed May 25, 2018
UNSPECIFIED. 1974. World Food Conference, Rome, 5 to 16 November 1974.
Communication from the Commission to the Council. SEC (74) 4955 Final, 9 December
1974. Communication. Rome: EU Commission. http://aei.pitt.edu/id/eprint/15701.
Urbanisation. 2015. 21st Century Challenges. https://21stcenturychallenges.org/urbanisation-2/.
USGS. 2018. What Are the Band Designations for the Landsat Satellites? | Landsat Missions..
https://landsat.usgs.gov/what-are-band-designations-landsat-satellites. Accessed May 25,
2018
Van der Spek, S., Van Schaick, J., De Bois, P., and De Haan, R. 2009. Sensing Human Activity:
GPS Tracking. Sensors 9 (4): 3033–55. doi:10.3390/s90403033.
Verstraete, M.M., and Pinty, B. 1991. The Potential Contribution of Satellite Remote Sensing to
the Understanding of Arid Lands Processes. Vegetatio 91 (1/2,).
http://www.jstor.org/stable/20038713. Accessed May 25, 2018
Wang, G., and Weng, Q. 2013. Remote Sensing of Natural Resources. Remote Sensing
Applications Series. https://www.crcpress.com/Remote-Sensing-of-Natural-
Resources/Wang-Weng/p/book/9781466556928. Accessed May 25, 2018
Werr, P. 2015. Egypt’s Land Reclamation Plan Should Heed History Lesson. The National.
https://www.thenational.ae/business/egypt-s-land-reclamation-plan-should-heed-history-
lesson-1.90770. Accessed May 25, 2018
WFP. 2017. World Hunger Again On The Rise, Driven By Conflict And Climate Change, New
UN Report Says. News. 815 Million People Now Hungry – Millions of Children at Risk from
Malnutrition. https://www.wfp.org/news/news-release/world-hunger-again-rise-driven-
conflict-and-climate-change-new-un-report-says. Accessed May 25, 2018
WFP and CAPMAS. 2013. The Status of Poverty & Food Security in Egypt - Analysis and Policy
Recommendations.Pdf.
World Bank. 2015. Arable Land (Hectares per Person). World Bank Data.
https://data.worldbank.org/indicator/AG.LND.ARBL.HA.PC?locations=EG. Accessed
May 25, 2018
———. 2018. World Bank Open Data | Data. https://data.worldbank.org/. Accessed May 25,
2018
CE
UeT
DC
olle
ctio
n
51
Worldometers. 2018. World Population. http://www.worldometers.info/world-population/.
Zaghloul, S.S., and Elwan, H. 2011. Water Quality Deterioration of Middle Nile Delta Due to
Urbanizations Expansion, Egypt. Fifteenth International Water Technology Conference
IWTC-15 2011. http://iwtc.info/wp-content/uploads/2011/07/G40.pdf. Accessed May 25,
2018
Zhai, Y., Qu, Z., and Hao, L. 2018. Land Cover Classification Using Integrated Spectral,
Temporal, and Spatial Features Derived from Remotely Sensed Images. Remote Sensing 10
(3): 383. doi:10.3390/rs10030383.
GIS Software Used
ERDAS Imagine 2018 (trial version for 30 days)
ArcGIS 10.2
GIS Data Sources
The U.S. Geological Survey the Earth Explorer. https://earthexplorer.usgs.gov/ Accessed March
05, 2018
CE
UeT
DC
olle
ctio
n


![THESIS TITLE A THESIS SUBMITTED TO THE MIDDLE EAST ...ii.metu.edu.tr/system/files/documents/thesis... · [SAMPLE 1] Approval of the thesis: THESIS TITLE Submitted by STUDENT NAME](https://img.pdfslide.us/doc/110x75/6019035f39977162fc4f0b03/thesis-title-a-thesis-submitted-to-the-middle-east-iimetuedutrsystemfilesdocumentsthesis.jpg)


![Judy Lewis Masters Thesis Submitted[1]](https://img.pdfslide.us/doc/110x75/577cc7761a28aba711a10230/judy-lewis-masters-thesis-submitted1.jpg)