Embed Size (px)
Citation preview

A TESTBED FOR QOS-BASED DATA ANALYTIC SERVICE SELECTION IN THE
CLOUD
by
Md Shahinur Rahman
B.Sc. in Computer Science, Khulna University of Engineering and Technology, Khulna,
Bangladesh, 2003
A thesis
presented to Ryerson University
in partial fulfillment of the
requirements for the degree of
Master of Science
in the program of
Computer Science
Toronto, Ontario, Canada, 2015
©Md Shahinur Rahman 2015

ii
AUTHOR'S DECLARATION
I hereby declare that I am the sole author of this thesis. This is a true copy of the thesis, including
any required final revisions, as accepted by my examiners.
I authorize Ryerson University to lend this thesis to other institutions or individuals for the
purpose of scholarly research.
I further authorize Ryerson University to reproduce this thesis by photocopying or by other
means, in total or in part, at the request of other institutions or individuals for the purpose of
scholarly research.
I understand that my thesis may be made electronically available to the public.

iii
A TESTBED FOR QOS-BASED DATA ANALYTIC SERVICE SELECTION IN THE
CLOUD
Md Shahinur Rahman
Master of Science, Computer Science, 2015
Ryerson University
ABSTRACT
With the emergence of Big Data and Cloud Computing, more and more data analytic software
services have become available through a Cloud platform. Compared to the traditional service
selection problem, selecting this type of services has additional challenges, which requires new
selection models being proposed. It is the purpose of this work to “create a testbed” to benefit the
research community in this area so that different selection models with consideration of different
performance-influencing factors such as algorithms implemented, datasets to be processed,
hosting infrastructure, can be tested and compared. We created a cloud-based platform for
publishing and invoking analytic services as well as monitoring service performance during
invocation. We implemented various data mining algorithms from different packages as example
analytic services and hosted them on different infrastructure services. We also ran these services
on some real datasets to collect a sample dataset of their Quality of Service (QoS) values.

iv
ACKNOWLEDGEMENTS
I would like to express my sincere appreciation to my supervisor Dr. Cherie Ding for her
valuable support and guidance in helping me to go through all the complexity in my work. Her
valuable suggestions and guidance have greatly enhanced my knowledge and skills in research
and have significantly contributed to the completion of this thesis.
I am very grateful to Dr. Alex Ferworn, Dr. Ali Miri and Dr. Andriy Miranskyy for
taking time to review my thesis and provide their feedbacks.
In addition, I would like to thank all of my friends specially S.M. Rana and Md. Mizanur
Rahman who have reviewed my thesis and have given me valuable comments which enabled me
to improve my thesis.
Also, I would like to acknowledge the support of the Computer Science Department of
Ryerson University and my fellow students.
Finally, I would like to express my deep appreciations to my family and relatives who
have motivated and supported me during these years of study.
v
TABLE OF CONTENTS
AUTHOR'S DECLARATION ...................................................................................................................... ii
ACKNOWLEDGEMENTS ......................................................................................................................... iv
LIST OF TABLES ...................................................................................................................................... vii
LIST OF FIGURES ................................................................................................................................... viii
LIST OF ACRONYMS ............................................................................................................................... ix
CHAPTER 1 ................................................................................................................................................. 1
INTRODUCTION ........................................................................................................................................ 1
1.1 Background ......................................................................................................................................... 1
1.2 Problem Statement .............................................................................................................................. 4
1.3 Objectives ........................................................................................................................................... 6
1.4 Proposed Approach ............................................................................................................................. 6
1.5 Organization of the Thesis .................................................................................................................. 7
CHAPTER 2 ................................................................................................................................................. 9
LITERATURE REVIEW ............................................................................................................................. 9
2.1 Introduction ......................................................................................................................................... 9
2.2 QoS Based Web Service Selection ..................................................................................................... 9
2.3 Cloud Service Selection .................................................................................................................... 10
2.4 Cloud Marketplace ............................................................................................................................ 12
2.5 Cloud Broker ..................................................................................................................................... 14
2.6 Data Mining Services and Data Analytic Services ........................................................................... 16
2.7 Discussion ......................................................................................................................................... 17
METHODOLOGY ..................................................................................................................................... 18
3.1 Introduction ....................................................................................................................................... 18
3.2 System Design .................................................................................................................................. 18
3.2.1. System Architecture .................................................................................................................. 18
3.2.2 UML Sequence Diagrams for Administrator and Regular User Tasks ...................................... 21
3.2.3 USE Case Scenarios ................................................................................................................... 22
3.3 Data Analytic Software Services ...................................................................................................... 24
3.4 RESTful Web Services ..................................................................................................................... 24
3.5 QoS Properties .................................................................................................................................. 28

vi
3.6 Summary ........................................................................................................................................... 28
CHAPTER 4 ............................................................................................................................................... 30
EXPERIMENTS ......................................................................................................................................... 30
4.1 Implementation of the testbed platform ............................................................................................ 30
4.1.1 Programming Environment ........................................................................................................ 30
4.1.2 Class Diagram ............................................................................................................................ 31
4.1.3 User Interfaces ........................................................................................................................... 33
4.2 Proof of Concept Prototype............................................................................................................... 39
4.2.1 Data Mining Packages ............................................................................................................... 40
4.2.2 IaaS Services .............................................................................................................................. 43
4.3 QoS Data Collection ......................................................................................................................... 46
4.4 Summary ........................................................................................................................................... 58
CHAPTER 5 ............................................................................................................................................... 59
CONCLUSION AND FUTURE WORK ................................................................................................... 59
5.1 Conclusion ........................................................................................................................................ 59
5.2 Future Works .................................................................................................................................... 60
REFERENCES ........................................................................................................................................... 61

vii
LIST OF TABLES
Table 4.1: Hardware configuration ..............................................................................................31
Table 4.2: Software service parameters........................................................................................37
Table 4.3: List of Implemented Weka Algorithms.......................................................................41
Table 4.4: List of Implemented R algorithms...............................................................................42
Table 4.5: List of Implemented Apache Commons Mathematics machine learning algorithms..43
Table 4.6: Amazon EC2 IaaS configuration..................................................................................44
Table 4.7: Windows Azure IaaS configuration..............................................................................45
Table 4.8: List of datasets.............................................................................................................46
Table 4.9: QoS values for one dataset (Balance Scale), one IaaS (Azure-1) and all services.......49
Table 4.10: QoS values for one dataset (Lung Cancer), one IaaS (Azure-1) and all services.......50
Table 4.11: Average QoS values on one IaaS (Azure-1) for all dataset........................................51
Table 4.12: Average QoS values of one SaaS (Weka FarthestFirst Clustering) for all dataset.....52
Table 4.13: Average QoS values for one dataset (Lung Cancer) on all IaaS................................53
Table 4.14: Average QoS values of one SaaS (Weka SimpleKMeans Clustering) on all IaaS.....54
Table 4.15: Average QoS values of all SaaS for one dataset (Lung Cancer)................................55
Table 4.16: Average QoS values of all SaaS on one IaaS (Azure-1)............................................57

viii
LIST OF FIGURES
Figure 1.1: Basic service-oriented architecture..................................................................2
Figure 1.2: Cloud Computing Stack...................................................................................3
Figure 3.1: System architecture........................................................................................19
Figure 3.2: UML sequence diagram for service invocation..............................................21
Figure 3.3: UML sequence diagram for administrator tasks............................................22
Figure 3.4: Use Case Diagram..........................................................................................23
Figure 3.5: Simple RESTful web service request and response.......................................26
Figure 3.6: Simple SOAP-based web service request and response.................................27
Figure 4.1: Class diagram of our implementation............................................................32
Figure 4.2: File upload UI................................................................................................33
Figure 4.3: Cloud server setup UI....................................................................................34
Figure 4.4: Web service publish or registration UI..........................................................35
Figure 4.5: Web service invocation.................................................................................36
Figure 4.6: Service invocation result...............................................................................38
Figure 4.7: Collected QoS values....................................................................................38

ix
LIST OF ACRONYMS
AHP: Analytic Hierarchical Process
AMI: Amazon Machine Image
API: Application Programming Interface
AWS: Amazon Web Services
EC2: Elastic Compute Cloud
HTML: HyperText Markup Language
IaaS: Infrastructure as a Service
JSON: JavaScript Object Notation
MVC: Model View Controller
OASIS: Organization for the Advancement of Structured Information Standards
PaaS: Platform as a Service
QoS: Quality of Service
REST: Representational State Transfer
SOA: Service-Oriented Architecture
SOAP: Simple Object Access Protocol
SaaS: Software as a Service
URI: Uniform Resource Identifier

x
URL: Uniform Resource Locator
WSDL: Web Service Description Language
XML: Extensible Markup Language
WEKA: Waikato Environment for Knowledge Analysis

1
CHAPTER 1
INTRODUCTION
1.1 Background
According to Wikipedia [1], service refers to “a set of related software functionalities that
can be reused for different purposes, together with the policies that should control its usage”. In
another definition according to OASIS [2], service is “a mechanism to enable access to one or
more capabilities, where the access is provided using a prescribed interface and is exercised
consistent with constraints and policies which are specified in the service description”.
Service-Oriented Architecture is a kind of software architecture that contains a collection
of services where these services communicate with each other. Sometimes this communication
could be simple, such as simple data passing, and sometimes it could involve two or more
services communicating with each other to do some activity.
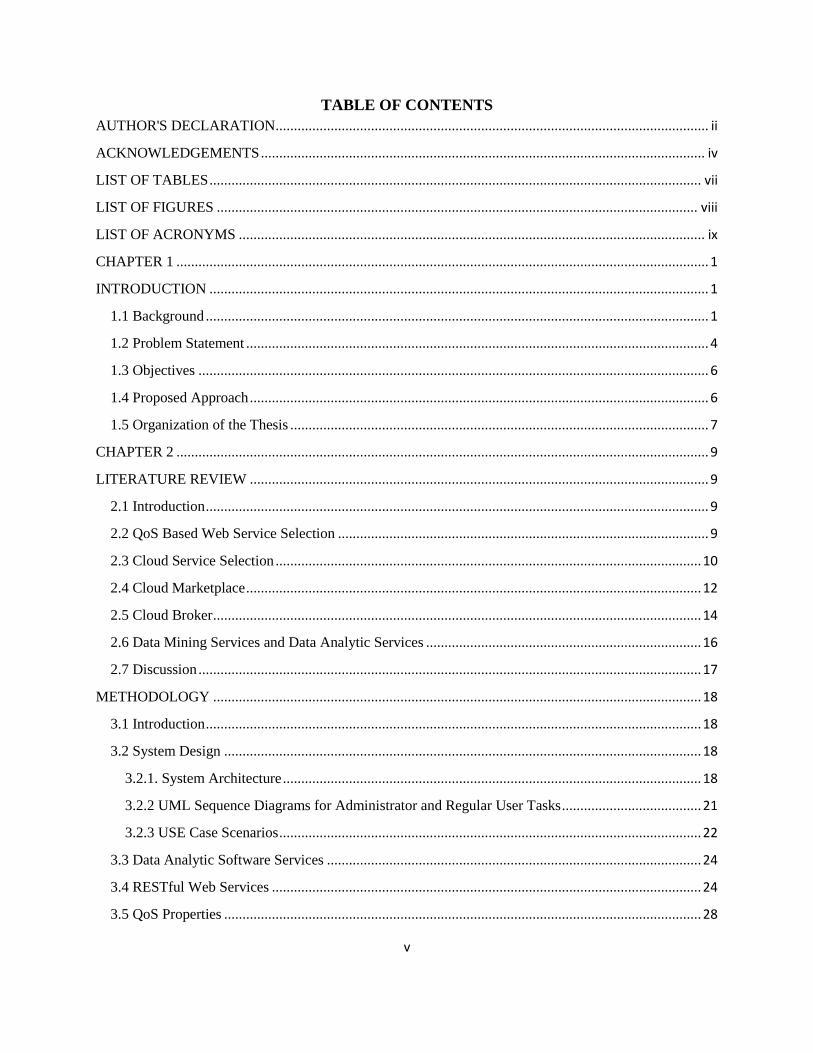
Figure 1.1 illustrates the basic service-oriented architecture. Service providers publish
their developed services in a service registry. Service registry is a repository for all published
web services. Service consumer looks for the service in the service registry and then invokes the
service. The communication happens in such a way that both service provider and service
consumer can understand. The actual communication depends on the implementation of the web
service. Two popular communication technologies called Simple Object Access Protocol
(SOAP) and Representational State Transfer (REST) are used to communicate between two
services.
2
Figure 1.1: Basic service-oriented architecture
In every business, organizations need to invest time and budget to scale up their IT
infrastructure such as hardware, software and services. With on premise IT infrastructure, scaling
process can be slow and organizations are frequently unable to achieve optimal utilizations of IT
infrastructure. Cloud computing consists of highly optimized virtualized data centers. They
provide various software, hardware and information resources on demand. In another definition,
Cloud computing is a distributed computing model where different kinds of resources are
available in an on-demand pay-as-you-go model [3]. Organizations can simply connect to the
cloud over the internet and use the available resources whatever and whenever they need. Cloud
computing consists of three main service models including IaaS (Infrastructure as a Service),
PaaS (Platform as a Service and SaaS (Software as a Service) as shown in Figure 1.2.

3
Figure 1.2: Cloud Computing Stack
IaaS is to rent cloud infrastructure from Cloud service providers such as server, storage
and networking in an on-demand basis. As companies always want to invest optimal budget for
their business, IaaS can be a solution for them because customers do not need to pay for
hardware cost as they lease shared resources. As cloud infrastructure scales resources on-
demand, it is a great opportunity for the company to implement the workload balance. PaaS is
the platform containing a set of tools designed to make coding and deploying the applications
easier. Cloud-based applications or software services (SaaS) run on far-away computers in the
cloud that are connected to users' computers via Internet, usually via a web browser. The SaaS
providers can also provide API to access their application and data for the developers to use in
their own application for creating composite applications. It is pay-as-you-go, so that users don't
have to invest a lot in purchasing software packages. The major architecture of SaaS is based on
multi-tenant model. A single version of the application is installed for all customers considering
single configuration with this model. Horizontal scaling is implemented on multiple machines to
support scalability. Vertical scaling can resize the cloud server with no change of the code.

4
The purpose of cloud computing is to make available resources for the cloud users, where
they can access rented cloud infrastructure and software applications from anywhere and
anytime. The focus of this research work is on software services hosted in the cloud
environment, and we specially pay attention to data analytic software services.
As the number of analytic software services with similar functionality is increasing in the
Cloud, service selection becomes a very important issue of Cloud computing, because it directly
impacts the user experience in the Cloud. It is difficult for the customer to decide which services
to use to meet their requirements among the vast number of services in the cloud. QoS (Quality
of Service) - parameters (e.g., response time, throughput, availability, reliability, latency) play an
important role in the service selection process. Sometimes users can select services based on
their functionality (e.g., a clustering service), not considering their QoS values, but in most other
cases functional requirements are not enough and QoS requirements should also be considered.
In this work, for non-functional requirements, we mainly concentrate on the QoS-based selection
of data analytic software services.
1.2 Problem Statement
In the last few years, researches were focused on service selection using different
technologies including vector and matrix based approach [4] [5] [6], constraint programming or
integer programming approach [7], multi-criteria decision making approach [8], semantic
approach [9], etc.
When more services are moving to the cloud, there are also research works on cloud-
based service selection. Some focus on software service selection [10] [11], and others focus on
infrastructure service selection [12]. With the emergence of Big Data, analytic-as-a-service has
attracted some research attention [13] [14] [15]. Researchers have started to implement analytic

5
software such as data mining algorithms as services and hosted them in the cloud. When more
and more this type of analytic services are hosted in the cloud, it would become a challenge for
users to find the right service to process their data.
Although there are many QoS-based service selection models (either web services or
cloud services) that have been proposed, to the best of our knowledge, there are very few
benchmark datasets available for researchers to compare the results of their models. QWS dataset
[16] is one of the most popular ones. WS-Dream [17] is another one which has been used in
several papers. Both of them are providing data of web services. Most of the research works for
cloud-based service selection either use web service QoS data or simulation data to do the
experiment. No real cloud-based end-to-end QoS data has been collected for the research
purposes in the past.
When selecting data analytic services in the cloud, there are a few unique challenges: 1)
the QoS values of services could be affected by the dataset to be processed, for example, the
latency on a big dataset could be longer than the one on a small dataset, the accuracy of a service
could be low when there is noise in the data; 2) in a cloud environment, a software service could
be hosted on different infrastructure services, and thus the end-to-end QoS values could be
affected by both software service implementations as well as infrastructure service
configurations; 3) the service selection should be based on the end-to-end QoS values, and thus
there should be a monitoring service offered by the system to collect these end-to-end QoS
values instead of depending on published values from individual providers. Because of these
challenges, to facilitate the research on cloud-based analytic service selection, it is important to
set up a broker-like testbed framework in the cloud environment. This testbed framework can be
used to publish services and software services will be hosted on different infrastructure services.
6
The hosted services can be invoked with end-to-end QoS values being monitored, and both
dataset properties and QoS values from different services can be collected.
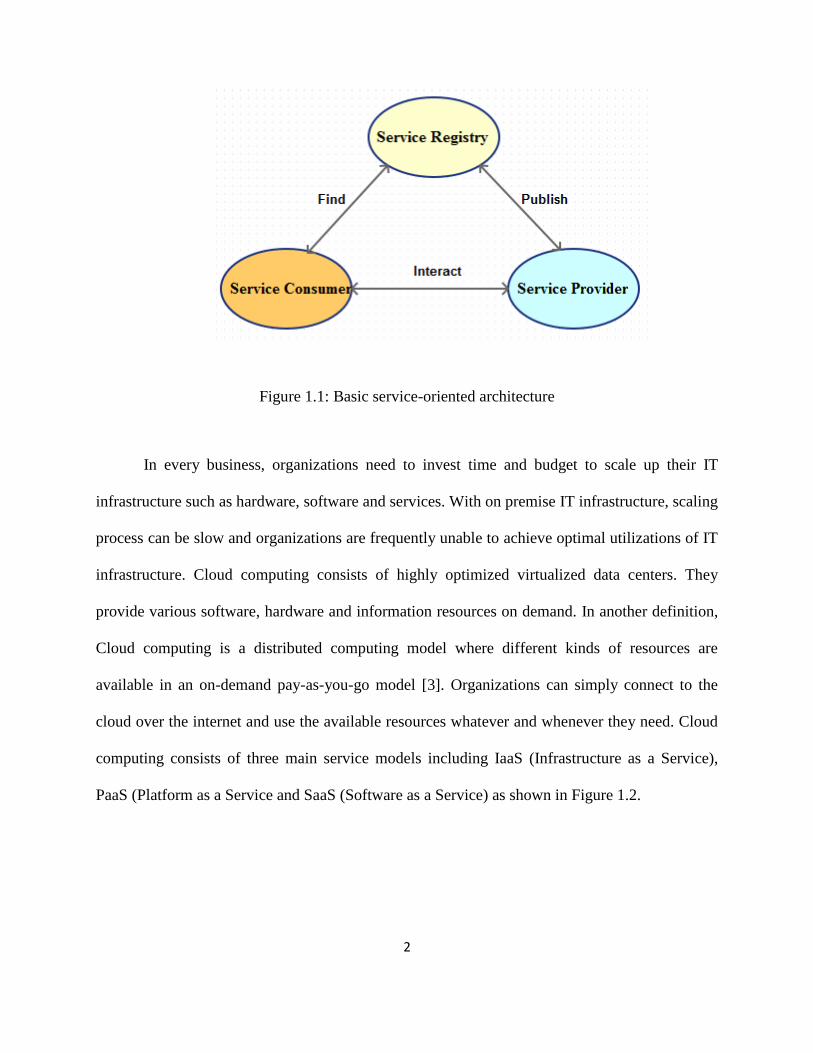
Because of these unique challenges for cloud-based data analytic service selection, and
considering that there is no proper benchmark dataset available for the research in this area, it is
the purpose of this thesis work to propose and implement a cloud-based testbed. Using it we can
collect end-to-end QoS values considering the effects from software services, infrastructure
services as well as the input datasets. With the collected QoS dataset, researchers can evaluate
and compare the performances of their selection algorithms.
1.3 Objectives
There are two major objectives of the work. First, we want to design a cloud-based
framework to build testbed for collecting end-to-end QoS values of data analytic services.
Second, we want to implement a proof of concept prototype system. In this system, data mining
services are created as representative analytic services, infrastructure services with different
configurations and in different locations are selected from two different providers (Amazon EC2
and Windows Azure). A client tool is developed to communicate with our data mining services
hosted on different infrastructure services, invocation requests of applying these services on
some real datasets are sent and end-to-end QoS values are collected from a monitoring engine.
1.4 Proposed Approach
The proposed framework is similar to a cloud marketplace, in which different providers
can publish their services and users can select different services. However because our focus is
on collecting QoS data, we are not going to implement a full cloud marketplace with all the
required functionalities. We choose 3 major components to be included in our framework: 1)

7
publishing component for providers to publish their services, 2) invoking and monitoring
component for users to invoke a service and for the system to record the end-to-end QoS values,
and 3) simulation component to run a batch invocation job so that all the selected services will be
invoked one by one on a given dataset and all the QoS data are collected.
In our proof-of-concept prototype, we chose three package providers for the data mining
algorithms to be developed for our software services. We chose open source data mining
packages from WEKA [18], R [19] and Apache Commons Math Machine Learning [20]. We
developed 22 software services using 3 categories of data mining algorithms including
Clustering, Classifier, and Association rule mining. For the service implementation, we used the
RESTful web service framework to develop the software service. We hosted our developed
software services in two different cloud infrastructures including Amazon EC2 and Windows
Azure instances in different locations with different configurations. For the invocation of our
services, we developed a client application which allows users to upload their own files, invoke
data mining services to process data, and get the QoS values recorded. The collected QoS values
are stored into a repository and these QoS values could serve as benchmark data for other
researchers to compare their selection models or algorithms.
1.5 Organization of the Thesis
The rest of the thesis is organized as follows:
Chapter 2 reviews and analyzes the existing research work in the field of web service
selection, cloud service selection, and cloud marketplace and brokers. It also reviews the existing
research efforts that are closely related to our work such as QoS-based service selection, data
analytic services, data mining as a service, etc.

8
Chapter 3 gives the details of our proposed methodology, including the architecture
model, functions of different components and the system workflow. We also discuss about the
RESTful web service framework for building our software services and how to set up
infrastructure services from different cloud service providers to host the software services.
Chapter 3 also talks about different QoS properties that we have considered in this thesis work.
Chapter 4 explains how we implement the proposed testbed framework, shows some key
interfaces of our system, describes the details of our proof-of-concept prototype implementation,
including data mining software services and infrastructure services and their configurations,
discusses the QoS data collection process, and, finally, reports the statistical information of a
collected sample dataset, which showcases the impact of dataset, infrastructure configuration and
location, as well as software service algorithms on the QoS values of services.
Finally, in Chapter 5, we conclude our thesis with a summary of results and analysis. We
also talk about what could be the possible future enhancement of our work.

9
CHAPTER 2
LITERATURE REVIEW
2.1 Introduction
As our ultimate goal is to provide a platform for the study on QoS-based service selection
problem in the cloud environment for other researchers, we would like to discuss first some
existing works on QoS-based service selection. After that, we would like to review papers on
cloud marketplaces, cloud brokers, cloud service selection and data analytic services.
2.2 QoS Based Web Service Selection
Since many software services with similar functionalities are published by various
providers, it is a big concern for the end-users to choose software services that best meet their
requirements. The non-functional attributes of any software services such as response time,
latency, availability, reliability, and throughput, can play an important role for the service
selection process. Different types of service selection approaches are introduced in various
papers.
In [21], Mixed Integer Programming (MIP) is used for solving the problem of service
selection and match-making for linear constraints, while Constraint Programming (CP) is used
for non-linear constraints. The experiment shows that MIP performs better than CP while
considering linear constraints. So the match-making procedure can be completed using CP or
MIP depending upon whether it is non-linear constraints or linear constraints.
In [22], the user preferences are defined using utility functions, a probabilistic trust model
is used to get quality distributions of providers, and then the services which could maximize the
expected utility values are selected.
10
In [23], the QoS manager acts as an agent for service providers and clients to do
publishing and finding web service operations. QoSDB has been used to store the details of QoS
of a web service and QoS values such as response time, throughput, reliability, availability and
cost are optimized and the ranked values are stored in QoSDB. To find the best web services, the
user has to specify the functional details of the service and its QoS values which are required to
find the list of web services from the repository.
Analytic Hierarchical Process (AHP) is a popular Multi-Criteria Decision Making
(MCDM) technique that solves problems by modeling QoS characteristics in the form of a
hierarchy [24]. For the hierarchy, the multiple criteria are divided into sub-criteria and could be
further divided and thus establishing different levels of criteria. The relative ranking of the
various options is calculated based on the priorities associated with the criteria and their sub
criteria within each level and finally the overall rank of each alternative can be determined.
As we focus on QoS-based attributes, there are a few commonly used QoS attributes [5]
[16] for assessing the performance of a service. Reliability indicates how many error messages
have been generated compared to the total number of messages. Latency is considered as the
time taken for the request to be processed. Response Time is the time it takes to send a service
request and receive the response. Throughput represents the maximum number of invocations
that can be managed in a certain time period. Availability is defined as the percentage of time the
service and server are available.
2.3 Cloud Service Selection
In the service computing paradigm, web services are referring to software services hosted
and provisioned by software providers through the Internet. In the cloud computing paradigm,
there are many types of cloud services. Besides software services, there are also infrastructure

11
services, platform services, database services, storage services, etc. With a variety of services,
the research on cloud service selection has some new challenges. Most of the research work
nowadays is focused on either software services or infrastructure services, and various
methodologies have been used. A fuzzy simple weighting system has been proposed in [25] to
normalize and aggregate two types of attributes of a cloud service. They consider subjective
assessment from cloud consumers and objective performance assessment from a trusted third
party. Then they apply fuzzy weighting system on the subjective and objective information for
normalization and aggregation, so that some specific performance aspects of a cloud service can
be considered accordingly for potential cloud users.
MSSOptimiser (Multi-tenant SaaS Optimiser) approach has been introduced in [7], where
functional specification and QoS requirements could be input of the proposed model. Integer
Programming could be used to determine the optimal services. For large-scale scenarios, SaaS
optimization problem is expensive, but MSSOptimiser provides greedy heuristic to provide an
optimal solution efficiently.
In [26] [27], a hybrid fuzzy framework for cloud service selection has been proposed
using three approaches: 1) fuzzy ontology based approach for functional matching; 2) fuzzy
AHP for weighting; and 3) fuzzy TOPSIS approach for service ranking. Bi-partite graph has
been used to find functional matching results. In their model, they focus on customer's fuzzy
perception of QoS. To deliver more certain information into the ranking algorithm, they convert
linguistic terms of customer's perception into precise numbers.
To solve the problem of cloud service selection based on multiple criteria, a rigorous
mathematical model has been used but their approach is only effective to select amongst service
offerings that are similar in specification but different in performance.

12
In [28], the proposed methodology considers QoS parameters as the decisive factors for
selecting appropriate cloud service. The model called Service selection for Data-centric cloud
application (SSADCA) based on normalization mechanism is capable of accommodating any
number of QoS parameters. The user is also able to accommodate any order of preferences of the
QoS parameters.
AHP based methodology is used in [29]. The proposed methodology is two-fold: 1)
consumer-centered service selection considering user's preference in multiple context (single
user and multiple users); 2) making reasonable cloud service selection based on Cloud Service
Decision-Making (CSDM). The proposed method is capable of automatically selecting cloud
infrastructures. They consider a couple of criteria for their selection algorithm including
deployment cost, location of cloud infrastructures, application clients, related applications, and
communication among application components. They also introduced stepwise application
placement algorithm for addressing scalability issue when the number of data centers and
applications is large.
One of the main challenges for SaaS providers is to select best IaaS providers. To achieve
this goal, SaaS provider needs to map user's requirements in QoS specification into the IaaS
layer [30]. The work in [30] develops a set of mapping rules and a new way to calculate QoS
values in a cloud environment using AHP method. QoS weights for service selection and ranking
process are generated using AHP method based on QoS specification model.
2.4 Cloud Marketplace
Cloud marketplace is online storefront that is managed by cloud service providers or third
parties. In a cloud marketplace, SaaS providers publish their software services and customers
may subscribe to that software. Cloud service providers provide facilities to their subscribers to

13
use their already built-in cloud applications and approved applications from the third party. This
approval of third party applications not only gives opportunity to the customers to use more
applications, but also fills up the gaps for demanding more applications by their subscribers.
In [31], the market negotiation is the main focus of the paper, but they also attempt to
define all important entities of the proposed marketplace such as sellers, buyers, intermediaries,
etc. Market negotiation is the main functionality of the proposed marketplace that happens
between the sellers and buyers who subscribe in the marketplace. The automation of the
negotiation mechanism, inclusion of multiple attributes, and being a short term commitment are
some of the characteristics.
The pricing model for IaaS resources is the main objective of the proposed model in [32].
The model is supposed to bring both a long term pricing contract for the benefit of IaaS
providers and a pricing scheme that is based on users’ actual jobs. Some other features of the
proposed model are: 1) economic benefits, 2) ability to provide a broader view of the user’s
usage of cloud resources, and 3) better predictability compared to the traditional pricing models
adopted by current cloud providers.
In [33], the main idea of the proposed marketplace system is to create interfaces for all
cloud parties (e.g. users and service providers) to interact for business functions, and make the
work flow easy to implement. The proposed architecture isolates the interface component from
the core system logics. As a result, the marketplace could easily and quickly engage in the
service provisioning process. It is designed to be flexible and used for all service functionalities,
and by any providers and private developers. The structure of the proposed marketplace basically
represents each entity as a logic block and each communication link as an interface (API).
The problem of service selection in a cloud marketplace is addressed in [34]. Cloud

14
marketplace should be able to support service composition, spanning different cloud layers and
providing tools for providers to use existing products. The proposed solution takes into
consideration the different layers of cloud entities along with the service business aspect
specifically the service pricing. In their design view, the marketplace plays the role of a broker
between the different service providers and their consumers. In their concept of multiple cloud
layers, the business aspect and pricing are the main criteria for service selection mechanism.
The VMware vision of cloud marketplace has been discussed in [35]. They emphasized
that marketplace should be open especially for general purposes, to all vendors and developers to
submit their offers. The deployment procedure must be easy in the cloud environment. The paper
focuses on IaaS providers and it deals with different types of consumers in a way that it helps
them avoid much of expenses in acquiring actual resources.
In [36], a new model for cloud marketplace has been proposed where IaaS providers can
work collaboratively to provision services. Finding relationships between providers who can
form a single combined service offer and end users are the main goal of this paper. This strategy
has different advantages such as the service cost can be reduced for the customer, the negotiation
time is reduced and conflicts between services’ requirements are minimized while maintaining
QoS requirements for customers.
2.5 Cloud Broker
A cloud broker is simply a third-party individual or organization that acts as an
intermediary between customers and sellers of the service in a cloud environment. Cloud broker
works with customers to help them understand work processes, budgeting, data management
systems and saves purchase time by providing information to customers. There are three types of
cloud brokers [37] including cloud aggregators, cloud enablers and cloud agents. A Cloud

15
aggregator provides the customer information about Application Programming Interface and
User interface complexity. A Cloud agent is a software application that helps to distribute the
works among different cloud service providers. A Cloud enabler must provide the customer
some additional services such as encryption, transfer of customer data to the cloud and help them
understand the data lifecycle management.
In [38], a brokerage-based architecture is proposed, where cloud broker is responsible for
service selection. They design a unique indexing technique for managing the information of a
large number of cloud service providers and develop an efficient algorithm that ranks potential
service providers and aggregates them if necessary.
A cloud broker service called STRATOS is proposed in [39], which is an initial version
of a broker service layer. This initial step could be used for cross-cloud resource provisioning.
The broker service also facilitates application topology construction and runtime modification,
based on deployer's objectives. They also emphasize the importance of mechanisms to compare
and normalize offerings from multiple providers.
The self-adaptation and self-management techniques can improve service-oriented
systems because they can tackle the complexity of a complex system and their environments by
themselves. In [40], the authors designed a broker system called MOSES (MOdel-based SELF-
adaptation of SOA systems) which provides runtime QoS-driven adaptation of SOA applications.
They developed two versions of MOSES. In version 1, they got some issues including network
overhead and storage access problems etc. In version 2, they used OpenESB (Open Source
Enterprise Service Bus) that replaced Tomcat with Glassfish and also maintained the same
functionalities of MOSES 1 including standard way for communication and easy integration of
new components.

16
2.6 Data Mining Services and Data Analytic Services
Data mining and data analytic services have attracted more and more attention from
different sectors including academia, industry, and government. There is no proper benchmark
tool for data analytic services to collect end-to-end QoS values in the cloud. In [41], the authors
introduced cloud-based big data mining and analysis service platform by integrating R in their
model. In the proposed architecture, there are four layers: infrastructure layer, virtualization
layer, dataset processing layer and services layer. Apache CloudStack was installed, configured
and deployed to construct virtual machine clusters to manage infrastructure resources. In data
processing layer, R language runtime environment and RHadoop environment were setup. There
are four aspects to be considered in services layer including computing mode selection, cloud
services, data mining workflow and user interface. They applied K-Means algorithm as service
in their model.
In [42], a comprehensive and collaborative workspace for data professionals and analysts
as cloud-based data mining platform, called DMaaS (Data Mining as a Service) is proposed.
Their data processing engine is based on Hadoop and they deployed their services considering
some of the data mining algorithms from Apache Commons Math Machine Learning [20]. The
end-users can access their services from their own browsers easily.
Analytics as a Service refers to the provision of analytics software and operations through
Web-delivered technologies. Data Analytics as a Service (DAaaS) is an extensible analytical
platform in cloud environment where various tools for data analytics are available and can be
configured by the user to process and analyze huge quantities of data. Many of data analytics
services are based on Machine Learning concepts. The DAaaS platform has the ability to support
the complete lifecycle of its analytics capabilities. There are some challenges of analytics

17
services in the cloud such as information lifecycle management, security of the data, privacy,
real-time analysis and data volume. In [47], the authors introduced an AaaS tool that can be used
to accomplish the extraction and organization of terms and topics from unstructured data sources
including NoSQL, flat and PDF files. They proposed, designed and implemented the framework.
A collaborative big data analytics platform for big data as a service was proposed in [48].
This paper described big data analytics platform to manage big data and developed analytics
algorithms and services which could collaborate with data owners, data scientists and service
developers on the web.
2.7 Discussion
Since our objective in this work is to provide end-to-end QoS values of a service in the
cloud and these QoS values could be used for service selection algorithm, in this chapter, we first
reviewed papers about QoS based service selection. We created some data mining services as
representative data analytic services and hosted them in different cloud infrastructure. Thus we
also reviewed papers on data analytic services, data mining and cloud marketplace. For data
analytic services, QoS values are depending on dataset features and they are different for
different datasets. However, based on our review, most of cloud marketplaces and brokers focus
on different techniques including indexing techniques, AHP method and QoS weights for service
selection, etc., and none of them tried to collect the end-to-end QoS values which are essential
for service selection. From the above discussion, we see there is no proper benchmarking tools
for collecting end-to-end QoS values and these QoS values are important factors for service
selection.

18
CHAPTER 3
METHODOLOGY
3.1 Introduction
In this thesis work, we want to create a framework, in which new analytic services can be
published with related information saved in a repository, users can search and invoke services,
and the QoS values of these invoked services can be monitored and recorded. Since we focus on
data analytic services, QoS data is associated with not only the service but also the dataset being
processed. As a proof of concept, we have applied this framework to create a testbed, in which
we have selected a few types of algorithms (i.e. clustering, classification, association rule
mining), each type with a few different algorithms implemented, from different data mining
software packages (i.e. Weka, R, Apache Commons Math Machine Learning), and we have
implemented all of them as software services using RESTful web service framework, hosted and
delivered them through different cloud infrastructure services (i.e. Windows Azure, Amazon
EC2) with different configurations, and finally invoked them with different datasets and recorded
their QoS values. The generated QoS data collection can be used for research works on QoS-
based analytic service selection.
3.2 System Design
3.2.1. System Architecture
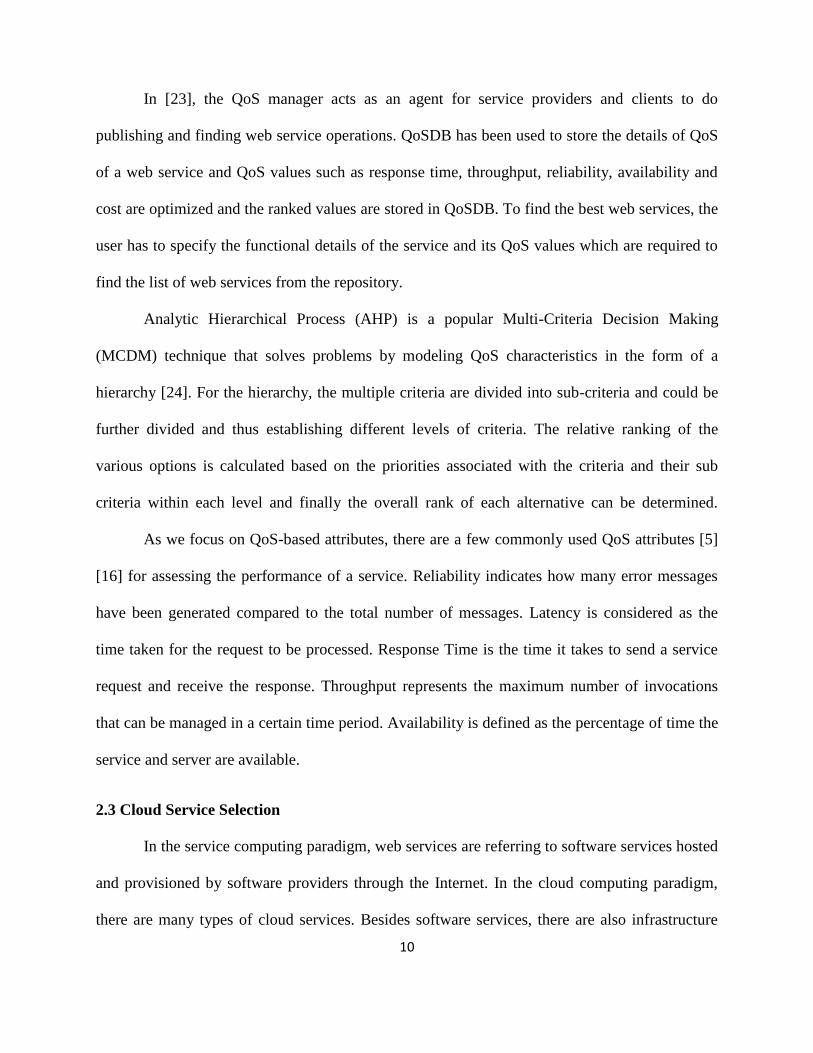
Figure 3.1 shows the architecture model of our system including different components.
19
Figure 3.1: System architecture
There are 4 main components including File Manager, Publishing, Invoking and
Monitoring. In our model, we have two types of users including administrators and end users.
The end user is only able to upload dataset and invoke software services on the dataset. The
admin user is able to do whatever end user can do and on top of that, admin user can publish
software service, introduce new cloud servers, add new software services and create new users.
File Manager Component is responsible for handling user's file uploading and associating
the uploaded file with the corresponding cloud server. When the end users upload their own
dataset, they need to choose their desired cloud server to upload to. File Manager Component has
a software service, responsible for uploading the file to the corresponding cloud server. Dataset
repository keeps track of the uploaded file for that user when invoking software services. If the

20
dataset is uploaded successfully, it will be stored in Dataset Repository to be used for service
invocation.
Publishing component implements two main tasks i.e. Service Lookup and Service
Registry. All of our software services are published in Service Registry. There is an internal
communication between Service Lookup and Service Registry to avoid duplicate service
publishing. Admin and providers can publish software services and end users will invoke these
software services. Whenever a new software service is going to be published, Service Lookup
will check whether it is already published on that cloud server. The name of the software service
must be unique but provider or admin can publish same software service in different names.
When any new software service is published in Service Registry, service invocation URL
(Uniform Resource Locator) will be automatically generated. After a software service is
published, it will be stored into Service Repository.
The main task of invoking component is the invoking of the software service. Before
invoking software services, end users need to choose a data-set populating from the File
Manager Component, and a cloud server and a software service populating from the Publishing
Component. After the invocation, this component will return the control to the monitoring
component.
After invoking a software service, our model will monitor and record values of QoS
properties such as Latency, Availability, Reliability, Response Time and Throughput. These QoS
values will be stored into QoS Repository and will be displayed in a browser to the end user.
Later on, researchers can use this recorded QoS values for service selection.

21
3.2.2 UML Sequence Diagrams for Administrator and Regular User Tasks
Figure 3.2 shows the UML sequence diagram of the service invocation process in our
model for a regular user.
According to the diagram, an end user first needs to upload the dataset to the cloud
server. After uploading the dataset, the end user chooses a cloud server, a software service and
the parameters associated with the software service as indicated in Service Invocation Filter.
After the software service is invoked, the monitored QoS values are saved and they could also be
Figure 3.2: UML sequence diagram for service invocation

22
displayed to the end user. Software service publishing, cloud server setup and user creation are
not included in this diagram. These three options are controlled by admin or provider.
Figure 3.3 shows the UML sequence diagram for administrator tasks.
Figure 3.3: UML sequence diagram for administrator tasks
According to the above figure, there are some tasks that are not available for end user.
Introducing new service, setting up cloud servers, creating new users and service publications
can only be done by admin user. Besides these tasks, admin can also do tasks of regular users
such as the one shown in figure 3.2.
3.2.3 USE Case Scenarios
Figure 3.4 shows all the use cases of our system.

23
Figure 3.4: Use Case Diagram
There are two types of users in our model, i.e. administrator users or providers whose job
is to configure the cloud server, publish the software service and create new users, and end users
who can invoke the published services using their own datasets. According to our model, before
invoking software services by end users, admin user needs to create new services, setup the
cloud server and publish the software services. The users can login into the system via Logging
in use case and dataset is uploaded by Dataset uploading use case. Before a software service is
invoked, users need to select services in Service selection case and applying extra parameters to

24
the data done in Filtering case. After selecting cloud server from Cloud server setting case, users
can invoke service and the QoS value of the invocation is displayed in QoS monitoring case.
3.3 Data Analytic Software Services
With today’s technology, more and more data are being collected. The value of the big
data is not on its sheer volume. Instead, it lies on the user behavior or the hidden patterns we can
learn from the data. Because of this reason, companies start to look for data mining or machine
learning software to analyze the data they have saved. Many cloud providers (e.g., Amazon,
Microsoft, IBM, Google) start to offer analytic software as services to their users. With all these
analytic services from different providers being published and delivered in the cloud, how to
select them becomes a challenge. Same as web service selection, QoS values of the services
become deciding criteria to differentiate between different services. There are many factors that
affect QoS values of analytic services. Similar to traditional web services, providers and their
specific implementations would have impact on QoS values. On top of them, the dataset the
service is going to work on, as well as the algorithm used, also have a significant impact on the
QoS values, and these factors can often ignored in the current research work. In our framework,
we will choose analytic services from different providers, from different categories (e.g.
clustering, classification, association rule mining), and implementing different algorithms (e.g. k-
means, DBScan, hierarchical algorithm for clustering services), in order to study their impact on
QoS values of the services.
3.4 RESTful Web Services
According to W3C definition [43], web service is “a software system designed to support
interoperable machine-to-machine interaction over a network”. REST [44] stands for

25
Representational State Transfer. It is an architectural style for designing the system that enables
clients and servers sending request and response respectively and this architectural style is
approved by W3C Technical Architecture Group (TAG). REST treats everything as a resource,
each resource follows the standard HTTP format and each resource has own its own name and
address namely URI (Unified Resource Identifier). Each resource can have more than one
representation such as HTML (HyperText Markup Language), XML (Extensible Markup
Language), JSON (JavaScript Object Notation) and each representation moves over the network
using HTTP protocol. RESTful web service is a great alternative to SOAP and WSDL based web
service because RESTful service provides a couple of benefits to organizations such as easy
integration, less memory consumption, security enablement, different output formats, better
performance, scalability and support of the JSON format which is faster for parsing data. REST
is being introduced in a large number of companies such as Yahoo, Facebook, Amazon, Flickr,
del.ici.ous, Ebay as well as many enterprise organizations who have depreciated their existing
SOAP based web services. As REST uses standard HTTP, it is much easier to use. Creating web
service, client application, documentation and formatting the output in different formats are easy
in REST. RESTful services communicate over HTTP using HTTP methods such as GET, POST,
PUT, DELETE, etc.
Figure 3.5 shows a simple RESTful web service request and response procedure in our
system. In this figure, service consumer is just sending a simple URL request to the web service
which is hosted somewhere and service provider is returning response based on the request with
output including the latency information.

26
Figure 3.5: Simple RESTful web service request and response
Figure 3.6 shows how to invoke a simple SOAP based web service. From this figure,
service consumer is sending a request which is in XML format and service provider is also
sending response in xml format.

27
Figure 3.6: Simple SOAP-based web service request and response
These two figures show the difference between RESTful web services and SOAP based
web services. Generally speaking, SOAP uses a standard communication protocol which is a
specification of XML-based message exchange, whereas RESTful web service uses standard
interface such as HTTP for data transmission. Compared to SOAP-based services, RESTful web
services are very simple to design and implement, easy to invoke, are less memory consuming,
and are completely stateless. RESTful services also provide a good caching infrastructure over
HTTP Get method which can improve the performance. Considering the above benefits, we use
RESTful web service in our work.

28
3.5 QoS Properties
As our main objective is data analytic service selection in the cloud environment based
on end-to-end QoS values, we need to identify QoS parameters which play an important role on
service selection [16]. A service can have many non-functional properties such as:
Response Time: Response time is the time taken to send a request and receive a
response. The unit of measurement is milliseconds (ms).
Availability: Availability is the possibility that the system is up and can be invoked
by users successfully. The method of calculation is the number of successful
invocations / the total number of invocations and its unit is %.
Throughput: Throughput can be measured in two ways. One way is to measure it by
calculating the volume of data which is invoked at a given period of time. The other
method is to measure the total number of invocations for a given period of time. The
unit of measurement is invokes/sec.
Reliability: Reliability measures the probability of a service to able to produce the
correct result for a given period of time. It is measured by the ratio of the number of
error messages to the total number of messages. The unit of measurement is %.
Latency: Latency is measured by time taken for a server to process a given request.
The unit of measurement is milliseconds (ms).
In our work, we are considering these 5 QoS properties.
3.6 Summary
In this chapter we have discussed the general methodology and technologies that we used
in our work. We described the high level architecture of our system explaining our four main

29
components including Publishing, Invoking, Monitoring and File Manager. In our work, we only
consider RESTful web services. We consider services from different providers, belonging to
different categories and implementing different algorithms. We host our services in different
cloud infrastructure platforms in different locations and with different configurations so that we
can collect different end-to-end QoS values and investigate the impact of these different factors
on the QoS values. These collected QoS values will benefit other researchers to study their QoS-
based service selection approaches.

30
CHAPTER 4
EXPERIMENTS
In this chapter, we will discuss about our implementation environment, proof of concept
details, IaaS Configuration, our used datasets and QoS data collection. At the end, we will also
analyze our collected QoS data.
4.1 Implementation of the testbed platform
In this work, we mainly wanted to create a testbed platform. In this platform, multiple
IaaS and SaaS services can be published, and a user can choose the SaaS he/she would like to
use and the IaaS he/she would like to host the SaaS, afterwards, the user can invoke the service
to process the uploaded data file, and the result will be returned, and more importantly, all the
QoS values for an invocation are recorded in a repository. The collected QoS values could be
used for service selection research. In this section, we will talk about how we implemented the
proposed testbed platform including the environment, the class diagram of our implementation
and the major user interface screens.
4.1.1 Programming Environment
In this work, we chose Java for our system implementation. We have used Java SE
(Standard Edition) Development Kit 7 and a couple of software development tools and libraries
including Eclipse IDE (Integrated Development Environment) indigo, Struts2 Framework, Ant
build tool, MySQL database, Apache Tomcat 7.0.35, RESTful web services, Jersey framework,
Weka Explorer, R studio, Weka libraries, R programming libraries and Apache machine learning
libraries etc. We chose Struts2 framework for the following reasons: 1) it follows MVC (Model

31
View Controller) design patterns; 2) it communicates with the data layer; 3) it renders
presentation layer etc.
Table 4.1 shows the hardware configuration used for the implementation environment
and also used for running our experiment.
Table 4.1: Hardware configuration
Hardware Configuration
Manufacturer Dell
Processor Intel(R) Core (TM) i7-3632QM CPU @ 2.20 GHz
RAM 8 GB
Operating System Windows 7 Ultimate (Service Pack 1)
System Type 64-bit
4.1.2 Class Diagram
Figure 4.1 shows the class diagram of our implementation. According to our model, we
have three types of repositories, Dataset repository for storing datasets, Service repository and
QoS repository for storing the collected QoS values.
According to our system design, Service and Cloud server are our base classes and they
are used throughout the whole program. We can publish multiple services under one cloud server
and that's why there is one-to-many relationship between the service and the cloud server class.
Users will upload their own datasets using FileUpload class which is dependent on the cloud
server class because this dependency will allow users to upload datasets to the desired cloud
server. Dataset is uploaded to the cloud server by web service called UpdateSoftwareService. For
publishing software services into the repository, ServiceRegistry class is used and this class is
dependent on Service and CloudServer class. ServiceInvokation class is the main class to invoke

32
software services hosted on the cloud server, from client web application. Based on the selection
of cloud server and software services from the available lists, ServiceInvoke class will invoke
Clustering/Classifier/Association software services. After invoking, service invocation results
will be recorded and saved in the repository for the future usage.
Figure 4.1: Class diagram of our implementation

33
4.1.3 User Interfaces
In this section, we will show some of our major implemented user interfaces. These
interfaces could illustrate the typical system workflows and user tasks. Figure 4.2 shows the
interface for a user to upload datasets.
Figure 4.2: File upload UI
Figure 4.3 shows one of our major UIs called Cloud server setup. Using this interface,
admin can set up a number of cloud servers in the system. According to the figure, cloud server
name is simply the name of the server and this name must be unique. IP is the IP address of the
cloud server, for example 127.0.0.1 and Tomcat port is the port of the installed Tomcat on the
cloud server. The default Apache Tomcat port is 8080, but it can be changed anytime. Upload
Base Directory is a physical location in the cloud server where dataset will be stored, for
example “C:/cloudupload/”. Upload Directory is another location inside Upload Base Directory,

34
for example amazon, dataset, etc. which is just a naming convention to make difference between
one directory to another. R Installed Path is the location of the installation directory of R studio,
for example “C:/program files/R/R-3.0.3/bin/Rscript.exe”. This path is the most important path
which is needed to invoke the R software services. This location is needed to execute the R script
inside the Java code.
Figure 4.3: Cloud server setup UI
Figure 4.4 shows the interface for software service publication or registration into our
system. Using this UI, admin or provider can publish their software services in the cloud. In the
figure, title is the identifier or name of the service and it must be unique in the system.
Description is not a mandatory field. Based on the selection of the cloud server and the service
from the drop down list, system will generate invocation URL of the service, for example, if the
context path of the service is “/emclustering/rest/emclustering” and IP of the cloud server is

35
52.10.109.251 and apache tomcat server port is 8080, the generated URL for the service would
be “http:// 52.10.109.251:8080/emclustering/rest/emclustering”.
Figure 4.4: Web service publish or registration UI
Figure 4.5 shows the service invocation user interface. All the uploaded datasets, all the
cloud servers and available published services are loaded into the drop down list for user to
select a service to invoke.

36
Figure 4.5: Web service invocation
In the above figure, there are a couple of parameters that users need to set their values.
No of clusters means how many clusters user wants to form on his/her dataset. Repulsion
parameter is used only for Weka CLOPE clustering algorithm and the default value is 2.6. The
dataset for Weka CLOPE clustering should be nominal type, otherwise service invocation could
fail. Users also need to set the repulsion parameter value very carefully because the parameter
value affects directly the success of the service invocation. Acuity and Cutoff are the two
parameters used for Weka Cobweb clustering. The default value of these two parameters are 1.0
and 0.0028. The success and failure of Weka Cobweb clustering service depend on the parameter
values. Weka Cobweb clustering service supports both nominal and non-nominal values. Epsilon
and Minpoints are two double type parameters used for Weka DBSCAN/Optics clustering and

37
Apache DBSCAN clustering algorithms. The default values of these two parameters are 0.9 and
6 respectively. MaxCluster and MinCluster are Weka XMeans clustering parameters. The default
values of MaxCluster and MinCluster are 4 and 2 respectively. MaxIteration parameter is used
for Apache KMeansPlusPlus clustering which means how many times the system will iterate on
the dataset to get the expected output. For invocation of apache clustering service, users can
decide whether to use the header information on the dataset. If they use header information, they
need to set YES of Column Header parameter. If Column header is set to YES, service will
ignore that line to apply the clustering algorithm on the dataset. All these parameters have default
values. If users are not familiar with the algorithm, they can always use the default values. If they
have some knowledge about the algorithm, they can set their own values good for their datasets.
Table 4.2 shows a list of parameters that users can pass before invoking services and the
corresponding services which require them.
Table 4.2: Software service parameters
Parameter Name Applicable Services
No of cluster
Weka EM/FarthestFirst/Hierarchical/SimpleKMeans/sIB Clustering, Apache
KMeansPlusPlus Clustering, R Hierarchical/ SimpleKMeans Clustering
Repulsion Weka CLOPE Clustering
e
Acuity, Cutoff Weka Cobweb Clustering
Epsilon, Minpoints Weka DBSCAN/OPTICS Clustering, Apache DBSCAN Clustering
Max(Min)Cluster Weka XMeans Clustering
Max Iteration Apache KMeansPlusPlus Clustering
No of columns Apache KMeansPlusPlus/DBSCAN Clustering
Column Header Apache KMeansPlusPlus/DBSCAN Clustering
38
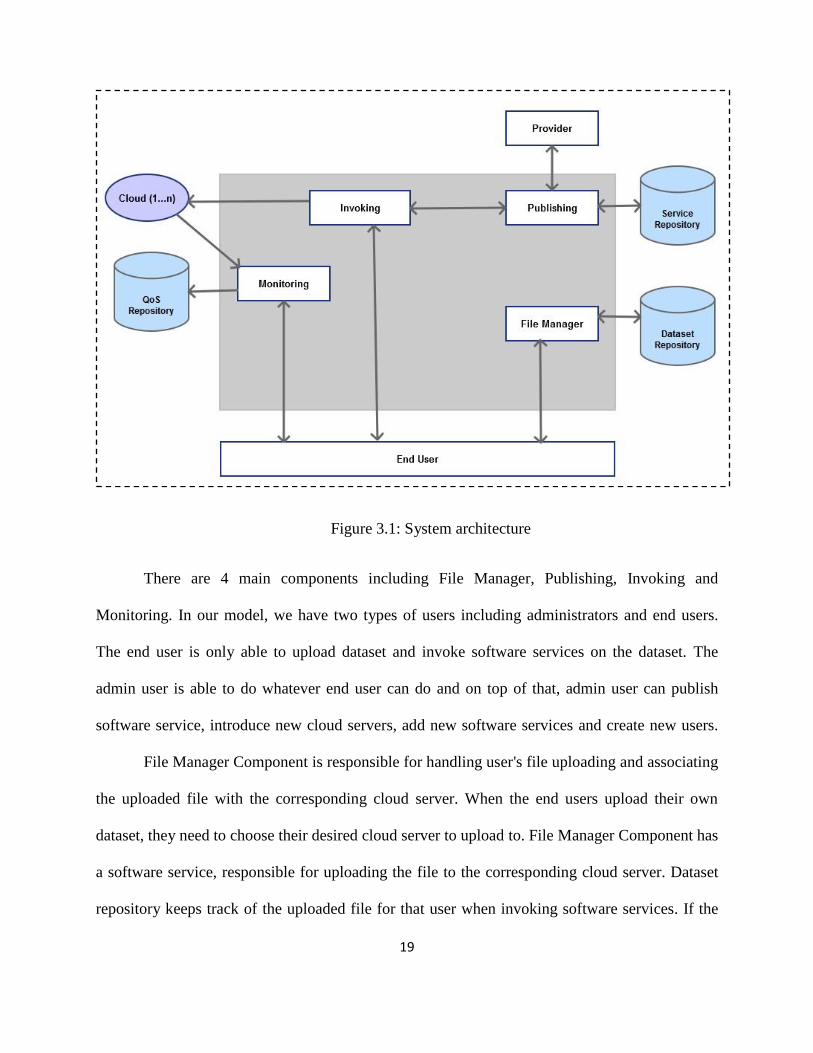
Figure 4.6 shows service invocation result using Weka SimpleKMeans clustering service.
It also shows the percentage of incorrectly clustered instances and the latency value in
milliseconds (ms).
Figure 4.6: Service invocation result
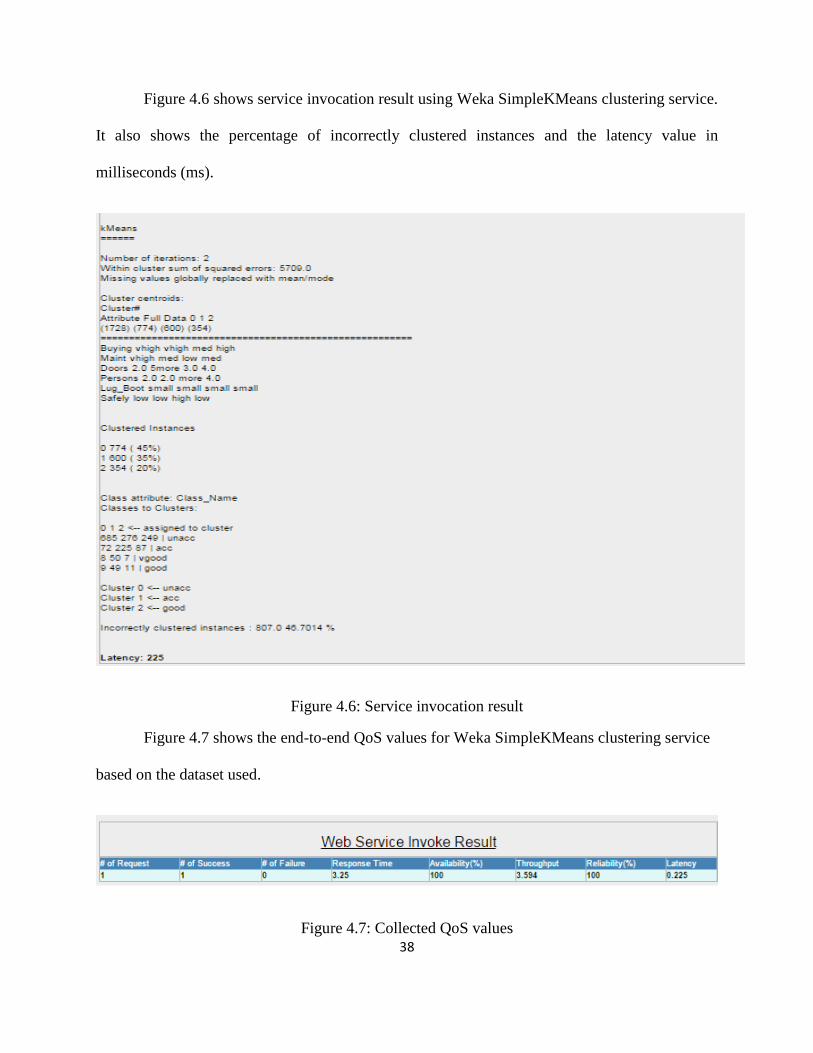
Figure 4.7 shows the end-to-end QoS values for Weka SimpleKMeans clustering service
based on the dataset used.
Figure 4.7: Collected QoS values

39
Latency is measured as the time taken for the cloud server to process a given request and
it is 0.225 seconds. Response time is calculated as the ping time to the server plus the latency.
Reliability is the percentage of the success request. For this one request, the invocation is success
and Reliability is 100%. As the system and the service are running properly and invocation has
been done successfully, Availability is also 100%. Throughput has been calculated based on the
output size of the service. The output size in byte divided by 1024, gives the output size in
kilobyte. This output size in kilobyte is multiplied by 8, which gives the output in kilobit. Then it
is divided by total time taken for the successful request, which gives the Throughput value. The
calculation steps are shown below,
Output size in byte = 903
Output size in Kilobyte = 903/1024
= 0.8818359375
Output size in kilobit = 0.8818359375*8
= 7.0546875
Total time for successful request in seconds = Response Time + Latency
= 3.188+0.168 = 3.356
Throughput = 7.0546875 / 3.356 = 2.10211189
4.2 Proof of Concept Prototype
The implemented platform is supposed to be generic, and can be used to include any
number and type of services. In this work, we implemented a proof of concept prototype to
showcase the value of the testbed platform and demonstrate how it is used to host data mining
services in particular.

40
4.2.1 Data Mining Packages
Data mining is the procedure of analyzing large quantities of data from different aspects
and summarizing that data into useful format which is used further for the business purposes.
Data mining techniques are used by different types of companies from medium sized to large
sized companies to analyze their data and to take suitable decisions for their business growth.
Data mining package or software is one kind of tool for analyzing the data. This tool allows users
to analyze their data from different dimensions, categorize it and finally summarize it in a human
readable format. Among many data mining algorithms, three categories of algorithms are most
popular including Clustering, Classification and Association rule mining. Classifiers are used to
allocate data to predetermined groups. Clustering is used to group data according to customer
preferences or logical relationships. Association is used to mine data to identify associations
between different items. Among various packages, we chose three for our work which are
Weka, R and Apache Commons Math Machine Learning. The idea is that different packages
represent different software providers, and in this way, we could have data mining services
implementing the same algorithm coming from different providers.
Weka (Waikato Environment for Knowledge Analysis) is a popular data mining package,
which is written in Java. Weka is a free software package under GNU General Public License.
Weka contains a collection of visualization tools and algorithms for data analysis including
graphical user interfaces to access the functionalities. Weka provides several standard data
mining algorithms such as Preprocessing, Classification, Clustering, Association rule mining,
Regression and Feature selection. Weka has the support of database access using Java Database
Connectivity. This feature supports to process data returned by a database query. The main user
interface of Weka is called Explorer. Users can use Explorer to run different data mining

41
algorithms. In this work, instead of using this interface, we will use the Weka API to implement
the services.
Table 4.3 shows a list of Weka algorithms that we chose to implement our services.
Table 4.3: List of Implemented Weka Algorithms
SL Algorithm Name Type
1 Expectation Maximization (EM)
(
Clustering
2 Hierarchical Clustering
3 Filtered Clustering
4 FarthestFirst Clustering
5 CLOPE Clustering
6 SimpleKMeans Clustering
7 Cobweb Clustering
8 sIB Clustering
9 DBSCAN Clustering
10 XMeans Clustering
11 BFTree Classifier
12 AdaBoostM1 Classifier
13 LMT Classifier
14 REPTree Classifier
15 RandomTree Classifier
16 RandomForest Classifier
17 Apriori Association
18 Tertius Association
R [41] is an open source programming language and software environment for statistical
calculation and data analysis. R has many interfaces to communicate with the code which is

42
written in other programming language such as C, C++, Fortran, Java and Python. S is a
statistical programming language and R is an implementation of S programming language. The R
language is widely used by statisticians and data miners for statistical software development. R
implements a wide range of statistical and graphical techniques including clustering,
classification for statistics data analysis. As we used Java programming language for developing
the web services and R is a different programming language, we need an intermediate interpreter
that will communicate with R compiler and execute the R script within Java. For this purpose we
chose RCaller as an intermediate interpreter.
Table 4.4 shows the list of our implemented R algorithms. We mainly focus on clustering
algorithms here from R package.
Table 4.4: List of Implemented R algorithms
SL Algorithm Name Type
1 Hierarchical
(
Clustering
2 KMeans Clustering
Apache Commons Math Machine Learning is a project of Apache Software Foundation
and its purpose is to provide reusable open source software. Apache Commons Mathematics has
implemented some machine learning algorithms which are open source and written in Java.
Apache Software Foundation has implemented four clustering algorithms which are KMean++,
Fuzzy-KMeans, DBSCAN and Multi-KMeans++.
Table 4.5 shows the list of Apache Commons Mathematics machine learning algorithms
used to develop services. Here we only consider clustering algorithm.

43
Table 4.5: List of implemented Apache Commons Mathematics machine learning algorithms
SL Algorithm Name Type
1 KMeans++
(
Clustering
2 DBSCAN Clustering
So in this prototype implementation, we have 3 software providers – Weka, R, and
Apache Commons Math Machine Learning. There are 3 types of data mining services –
clustering, classification, and association rule mining. Weka services cover all three types,
Apache services only cover clustering services and R services also only cover clustering
services. Although a few clustering algorithms have been implemented in both R and Apache,
here we only choose two from each which we can find corresponding implementations in Weka.
In this way, we could test the impact of different factors (provider, functionality, algorithms) of
SaaS services on the QoS values.
4.2.2 IaaS Services
Since we need to have multiple IaaS services from multiple providers, in this work we
chose Amazon EC2 and Windows Azure cloud infrastructure to host our developed software
services. Then for services from each provider, we also want to have different configurations and
different hosting locations, so that we could have a variety of IaaS services. Amazon EC2, which
is also known as Amazon Elastic Compute Cloud, provides resizable computing capacity in the
Amazon Web Services (AWS) cloud. Amazon EC2 offers a wide range of instance types that
vary based on combinations of CPU power, amount of memory, storage size and network
capacity. Amazon provides pre-configured instances, which is known as Amazon Machine
Images (AMIs) that include operating systems such as Windows or Linux. The AMIs may

44
include a wide range of preinstalled software packages. Amazon EC2 provides various types of
instances based on the workload from "micro" instances for small jobs to high performance "x-
large" instances for data warehousing tasks. The users can also mix different types of instances
based on the amount of memory they need. Amazon EC2 Spot Instances allow users to bid on
spare instances to be used whenever user's bid price exceeds the current spot price. Amazon EC2
Reserved Instances provide customers a good discount which could be up to 75%. Amazon EC2
Dedicated Instances is another instance type which is based on pay-as-you-go pricing model and
there is no long-term commitment.
For our work, we chose the Amazon EC2 Dedicated Instances to host our developed web
services in Windows platform. There are a number of options in this type and we chose the micro
type for our thesis.
Table 4.6 shows our chosen Amazon EC2 IaaS configuration to host our developed
software services.
Table 4.6: Amazon EC2 IaaS configuration
SL Name OS & Bit Processor RAM Location
1 Amazon-1 Windows Server 2012 R2 (64 bit)
(
Intel(R) @ 2.5 GHz 1 GB Tokyo
2 Amazon-2 Windows Server 2012 R2 (64 bit) Intel(R) @ 2.5 GHz 1 GB US (Oregon)
3 Amazon-3 Windows Server 2003 R2 (32 bit) Intel (R) @ 2.5 GHz 4 GB US (Oregon)
Windows Azure is a Microsoft implemented cloud computing platform. Windows Azure
was renamed to Microsoft Azure on April, 2014 [45]. Windows Azure uses Fabric layer, which
is a cluster hosted in Microsoft data center that manages computing resources. The two important
features of Windows Azure are scaling and reliability which are controlled by Microsoft Azure

45
Fabric Controller in such a way that services and environments do not crash if any of the services
goes down. A feature called Automated Service Management supports application upgrading
without compromising performance. Windows Azure provides a number of services such as data
management, media services, networking, virtual network, virtual machine, integration among
applications, high density website hosting, and access control service, etc. Windows Azure
supports a variety of Microsoft and third-party protocols, programming languages and platforms
including XML, REST, SOAP, Eclipse, Ruby, PHP, Python, etc.
As Amazon-1 and Amazon-2 instances are under free tier account, we cannot chose more
RAM for the instances. But as Amazon-3 is a paid instance, we selected 4 GB RAM. We could
not select same type of IaaS from Amazon and Azure because of their different infrastructure
configuration. For example Windows Azure has core options but Amazon does not have that. As
a free user, we can select maximum 1 GB RAM from Amazon but 4 GB RAM from Windows
Azure.
Table 4.7 shows our chosen Windows Azure IaaS configuration for hosting our
developed software services. All Azure instances are under one month free subscription and we
have to select at least 4 cores. This is how Windows Azure are configured.
Table 4.7: Windows Azure IaaS configuration
SL Name OS & Bit Processor RAM Location
1 Azure-1 Windows Server 2008 R2 (64 bit)
(
7 core 14GB Japan West
2 Azure-2 Windows Server 2008 R2 (64 bit)
7 core 14GB North Europe
3 Azure-3 Windows Server 2008 R2 (64 bit) 4 core 7GB Central US
4 Azure-4 Windows Server 2012 R2 (64 bit) 4 core 14GB Central US
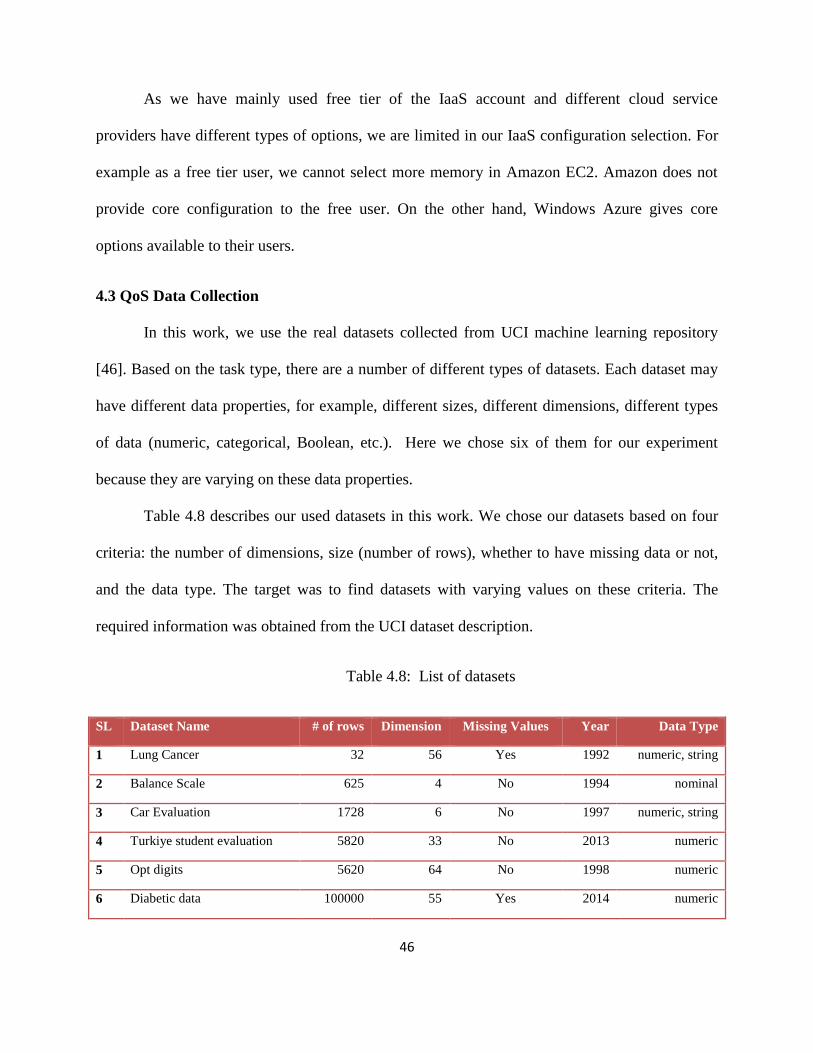
46
As we have mainly used free tier of the IaaS account and different cloud service
providers have different types of options, we are limited in our IaaS configuration selection. For
example as a free tier user, we cannot select more memory in Amazon EC2. Amazon does not
provide core configuration to the free user. On the other hand, Windows Azure gives core
options available to their users.
4.3 QoS Data Collection
In this work, we use the real datasets collected from UCI machine learning repository
[46]. Based on the task type, there are a number of different types of datasets. Each dataset may
have different data properties, for example, different sizes, different dimensions, different types
of data (numeric, categorical, Boolean, etc.). Here we chose six of them for our experiment
because they are varying on these data properties.
Table 4.8 describes our used datasets in this work. We chose our datasets based on four
criteria: the number of dimensions, size (number of rows), whether to have missing data or not,
and the data type. The target was to find datasets with varying values on these criteria. The
required information was obtained from the UCI dataset description.
Table 4.8: List of datasets
SL Dataset Name # of rows Dimension Missing Values Year Data Type
1 Lung Cancer
(
32 56 Yes 1992 numeric, string
2 Balance Scale
625 4 No 1994 nominal
3 Car Evaluation 1728 6 No 1997 numeric, string
4 Turkiye student evaluation 5820 33 No 2013 numeric
5 Opt digits 5620 64 No 1998 numeric
6 Diabetic data 100000 55 Yes 2014 numeric

47
We developed a client web application for our experiment. Its functions include setting
up the cloud server, publishing software services, uploading user's datasets, invoking software
services and monitoring software services' QoS values. For experiment, we hosted our developed
software services into different cloud infrastructure services from either Windows Azure or
Amazon EC2. Then we hosted client web application in our local system. We used default
parameter values for classifier and association rule mining services. We used some default
parameter values for clustering algorithm and we also implemented some parameters into the
client web application where users can send his/her chosen parameter values before invoking
software services.
In our experiment, we set a threshold value for time-out. If the client web application
does not receive any response from a service within five minutes, that invocation will be timed
out. We sent ten requests to invoke a services for all IaaS and datasets from the client
application. Users can send more than ten requests. First of all, an end-user needs to upload
his/her own dataset to the desired cloud server. To invoke a service, the end-user needs to select
cloud server, software service and dataset from the drop down list. Then user also needs to tell
the system how many requests he/she wants to send to the server to invoke the service. After
that, user can enter available parameter values or use default values. The parameter values could
affect whether we could get proper result from that service. If wrong parameter values are
provided, some QoS values can be affected or sometimes service invocation could fail.
We show some of the collected QoS values below. In these tables, status 0 means a
successful invocation and status -1 means a failed invocation. When status is -1, the other

48
columns have empty cells. For all the software services, we have availability 100% and therefore
this value is not included in the tables.
Table 4.9 shows QoS values of all implemented software services hosted on the same
IaaS service (Azure-1) running for the same dataset (i.e. Balance scale dataset). From this table,
we can see that among all clustering services, Weka Hierarchical Clustering, Weka DBSCAN
Clustering, Apache KMeansPlusPlus Clustering, Apache DBSCAN Clustering, R Hierarchical
Clustering and R KMeans Clustering failed to process the dataset. The reason of failure for
Weka DBSCAN clustering is selection of the wrong parameter values for Epsilon and Minpoints.
If these two values are not provided properly, algorithm will fail to process the file. As Balance
scale dataset contains string data, the other listed services failed to process the file because they
only support numeric values. Weka Apriori Associator and Weka Tertius Associator failed
because they only support nominal data type. We could also see that although the services are
applied on the same dataset and hosted on same IaaS instance, the collected QoS values vary
between different SaaS services.
Table 4.10 shows QoS values of all implemented software services hosted on the same
IaaS service (Azure-1) running for another dataset (i.e. Lung Cancer).

49
Table 4.9: QoS values for one dataset (Balance Scale), one IaaS (Azure-1) and all services
Service Name Status Response Time (s) Throughput Reliability Latency(s)
Weka EM Clustering 0 4.133 1.451 100% 0.272
Weka Hierarchical Clustering -1
Weka Filtered Clustering 0 3.644 2.534 100% 0.019
Weka CLOPE Clustering 0 4.111 4.177 100% 0.136
Weka FarthestFirst Clustering 0 3.791 0.857 100% 0.036
Weka SimpleKMeans Clustering 0 3.845 1.805 100% 0.061
Weka Cobweb Clustering 0 4.111 4.017 100% 0.136
Weka sIB Clustering 0 4.449 1.864 100% 0.537
Weka XMeans Clustering 0 4.244 1.460 100% 0.041
Weka DBSCAN Clustering -1
Apache KMeansPlusPlus Clustering -1
Apache DBSCAN Clustering -1
R Hierarchical Clustering -1
R KMeans Clustering -1
Weka BFTree Classifier 0 3.999 1.844 100% 0.097
Weka AdaBoostM1 Classifier 0 3.917 1.910 100% 0.038
Weka REPTree Classifier 0 3.962 1.895 100% 0.025
Weka LMT Classifier 0 5.385 1.085 100% 1.575
Weka RandomTree Classifier 0 3.810 1.975 100% 0.016
Weka RandomForest Classifier 0 4.095 1.828 100% 0.038
Weka Apriori Associator -1
Weka Tertius Associator -1

50
Table 4.10: QoS values for one dataset (Lung Cancer), one IaaS (Azure-1) and all services
Service Name Status Response Time (s) Throughput Reliability Latency(s)
Weka EM Clustering 0 3.907 9.168 100% 0.042
Weka Hierarchical Clustering 0 3.866 1.902 100% 0.003
Weka Filtered Clustering 0 3.869 9.095 100% 0.008
Weka CLOPE Clustering 0 4.869 0.839 100% 0.295
Weka FarthestFirst Clustering 0 3.873 2.077 100% 0.003
Weka SimpleKMeans Clustering 0 3.542 8.150 100% 0.005
Weka Cobweb Clustering 0 4.132 0.706 100% 0.051
Weka sIB Clustering -1
Weka XMeans Clustering 0 3.918 4.675 100% 0.109
Weka DBSCAN Clustering -1
Apache KMeansPlusPlus
Clustering
0 3.803 4.210 100% 0.006
Apache DBSCAN Clustering 0 3.923 0.075 100% 0.02
R Hierarchical Clustering 0 4.102 12.533 100% 0.328
R KMeans Clustering 0 3.909 9.345 100% 0.19
Weka BFTree Classifier 0 3.617 1.825 100% 0.003
Weka AdaBoostM1 Classifier 0 3.942 1.673 100% 0.008
Weka REPTree Classifier 0 3.984 1.658 100% 0
Weka LMT Classifier 0 4.063 1.605 100% 0.055
Weka RandomTree Classifier 0 3.819 1.730 100% 0
Weka RandomForest Classifier 0 3.596 1.836 100% 0.003
Weka Apriori Associator -1
Weka Tertius Associator -1

51
From this table, we can see that among all clustering services, Weka sIB Clustering,
Weka DBSCAN Clustering, Weka Apriori Association and Weka Tertius Association failed to
process the dataset. The reason of failure for Weka DBSCAN clustering is selection of the wrong
parameter values for Epsilon and Minpoints. Weka Apriori Associator and Weka Tertius
Associator failed because Lung Cancer dataset contains numeric data but these two associators
only support nominal data type. Comparing Table 4.9 and Table 4.10, we can see we have higher
success rate in Table 4.10, which means successful invocation depends on dataset, data types and
parameter values also.
Table 4.11 shows the average QoS values on one IaaS (Azure-1) for all datasets. The
QoS values are averaged on all SaaS services.
Table 4.11: Average QoS values on one IaaS (Azure-1) for all datasets
Dataset Name Latency (Sec) Reliability Response Time(Sec) Throughput
Lung Cancer 0.054 81.81% 3.929 4.061
Balance Scale 0.168 63.64% 4.106 1.886
Car Evaluation 1.952 54.54% 6.819 1.771
Opt digits 10.318 68.18% 11.882 4.236
Turkiye student evaluation 6.332 68.18% 8.819 2.837
Diabetic data 24.354 31.81% 13.329 0.180
From the above table, we can observe the average reliability of the services on Diabetic
dataset is less than that on other datasets because diabetic dataset has a lot of missing data and
noise. We can also see that the reliability on Lung cancer dataset is more than that on other
dataset because this dataset is small and clean. We could see that Lung Cancer dataset has the

52
smallest latency because it is the smallest based on its size and dimension, and Diabetic dataset
has the largest latency because it is the biggest dataset among all. The response time is also
affected by the dataset size and dimension. But it is affected more heavily by the network
transmission time, which explains why the response time is much bigger than the latency. There
is no clear pattern on throughput because throughput is not only decided by the service
processing time, the network transmission time, but also decided by the size of the output which
varies a lot among different software services. We observe the similar patterns for other IaaS
services, and thus we are not showing their values here.
Table 4.12 shows the average QoS values of one SaaS (Weka FarthestFirst Clustering)
for all datasets. The QoS values are averaged on all IaaS services.
Table 4.12: Average QoS values of one SaaS (Weka FarthestFirst Clustering) for all datasets
Dataset Name Latency (Sec) Reliability Response Time(Sec) Throughput
Lung Cancer 0.053 100% 3.625 2.218
Balance Scale 0.054 100% 3.612 0.903
Car Evaluation 0.089 100% 3.736 1.033
Opt digits 3.079 100% 9.466 1.818
Turkiye student evaluation 6.830 100% 16.674 1.081
Diabetic data 2.093 100% 5.638 1.164
From the above table, we can see the Reliability of Weka FarthestFirst Clustering service
for all datasets is 100%. Interestingly, this service works very fast for Diabetic dataset. Although
it is the biggest dataset, its latency is lower than two other smaller datasets. The latency for
Turkiye student evaluation dataset is slower than those for other datasets.
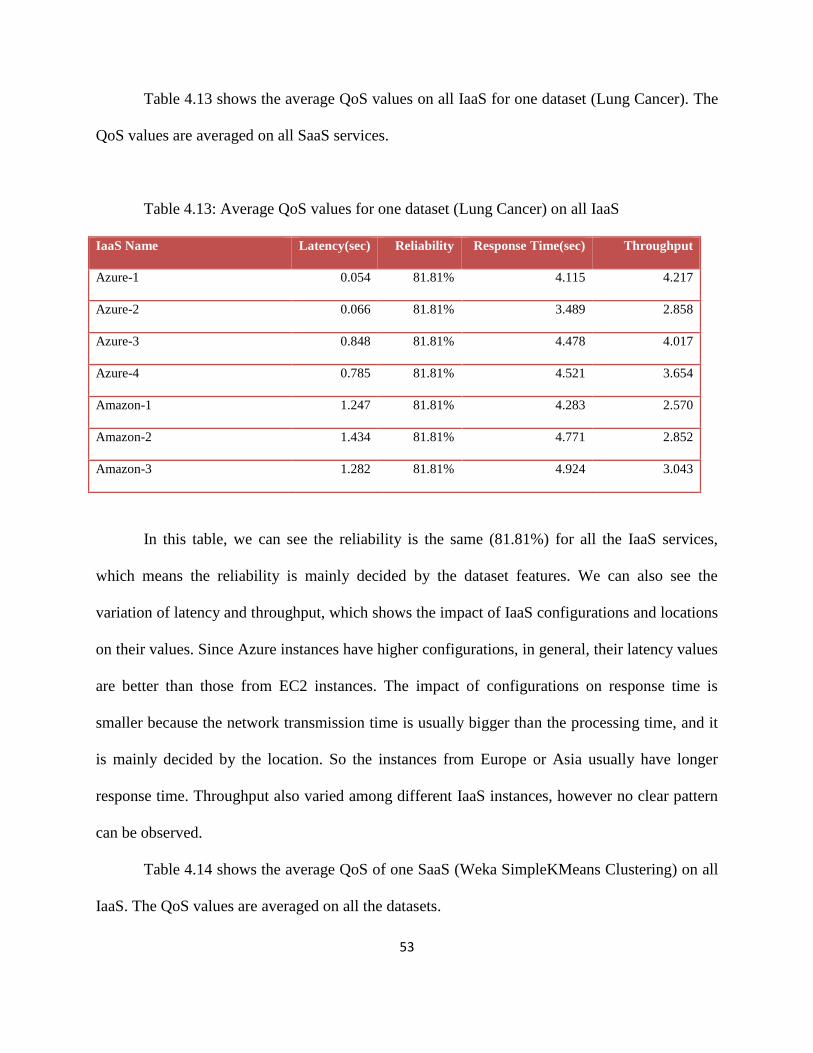
53
Table 4.13 shows the average QoS values on all IaaS for one dataset (Lung Cancer). The
QoS values are averaged on all SaaS services.
Table 4.13: Average QoS values for one dataset (Lung Cancer) on all IaaS
IaaS Name Latency(sec) Reliability Response Time(sec) Throughput
Azure-1 0.054 81.81% 4.115 4.217
Azure-2 0.066 81.81% 3.489 2.858
Azure-3 0.848 81.81% 4.478 4.017
Azure-4 0.785 81.81% 4.521 3.654
Amazon-1 1.247 81.81% 4.283 2.570
Amazon-2 1.434 81.81% 4.771 2.852
Amazon-3 1.282 81.81% 4.924 3.043
In this table, we can see the reliability is the same (81.81%) for all the IaaS services,
which means the reliability is mainly decided by the dataset features. We can also see the
variation of latency and throughput, which shows the impact of IaaS configurations and locations
on their values. Since Azure instances have higher configurations, in general, their latency values
are better than those from EC2 instances. The impact of configurations on response time is
smaller because the network transmission time is usually bigger than the processing time, and it
is mainly decided by the location. So the instances from Europe or Asia usually have longer
response time. Throughput also varied among different IaaS instances, however no clear pattern
can be observed.
Table 4.14 shows the average QoS of one SaaS (Weka SimpleKMeans Clustering) on all
IaaS. The QoS values are averaged on all the datasets.

54
Table 4.14: Average QoS values of one SaaS (Weka SimpleKMeans Clustering) on all IaaS
IaaS Name Latency(sec) Reliability Response Time(sec) Throughput
Azure-1 13.165 100% 17.067 3.680
Azure-2 10.145 100% 13.563 4.339
Azure-3 19.023 100% 22.105 3.696
Azure-4 19.107 100% 21.818 3.996
Amazon-1 0.199 83.33% 3.359 5.335
Amazon-2 0.308 83.33% 3.745 4.724
Amazon-3 0.247 83.33% 3.359 5.294
From this table, we observed that the Latency and Response time of Amazon IaaS are
lower than that of Azure IaaS. We have one big size dataset called Diabetic which was invoked
successfully in Azure IaaS but failed in Amazon IaaS due to time-out. Invocation for Azure
succeeded because of its good configuration but it took long time to finish the invocation. On the
other hand, Amazon IaaS timed out to process Diabetic dataset due to its low configuration. The
way we calculated the latency is to remove the failed cases. So with exclusion of this dataset,
Amazon IaaS gives better latency values. However, this failure also affects the reliability. The
Amazon IaaS has lower reliability than Azure IaaS.
Table 4.15 shows the average QoS values of all SaaS for one dataset (Lung Cancer). The
QoS values are averaged on all IaaS instances. For the fail cases, their columns have empty
values.
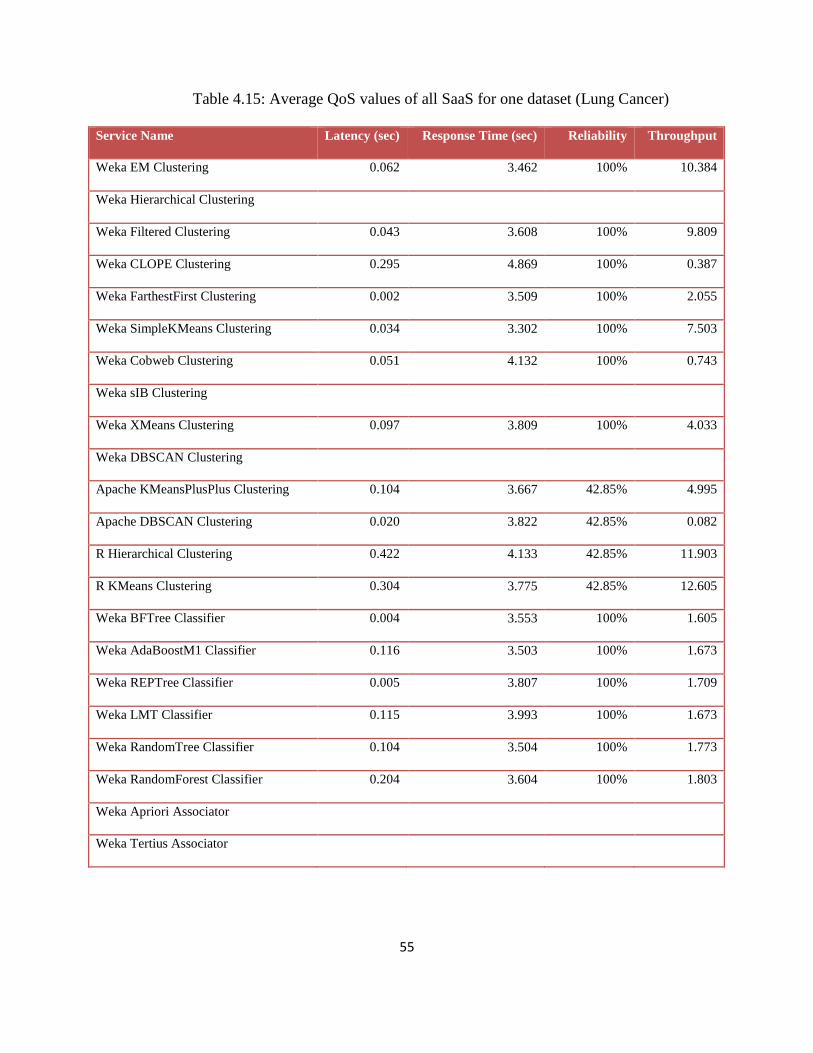
55
Table 4.15: Average QoS values of all SaaS for one dataset (Lung Cancer)
Service Name Latency (sec) Response Time (sec) Reliability Throughput
Weka EM Clustering 0.062 3.462 100% 10.384
Weka Hierarchical Clustering
Weka Filtered Clustering 0.043 3.608 100% 9.809
Weka CLOPE Clustering 0.295 4.869 100% 0.387
Weka FarthestFirst Clustering 0.002 3.509 100% 2.055
Weka SimpleKMeans Clustering 0.034 3.302 100% 7.503
Weka Cobweb Clustering 0.051 4.132 100% 0.743
Weka sIB Clustering
Weka XMeans Clustering 0.097 3.809 100% 4.033
Weka DBSCAN Clustering
Apache KMeansPlusPlus Clustering 0.104 3.667 42.85% 4.995
Apache DBSCAN Clustering 0.020 3.822 42.85% 0.082
R Hierarchical Clustering 0.422 4.133 42.85% 11.903
R KMeans Clustering 0.304 3.775 42.85% 12.605
Weka BFTree Classifier 0.004 3.553 100% 1.605
Weka AdaBoostM1 Classifier 0.116 3.503 100% 1.673
Weka REPTree Classifier 0.005 3.807 100% 1.709
Weka LMT Classifier 0.115 3.993 100% 1.673
Weka RandomTree Classifier 0.104 3.504 100% 1.773
Weka RandomForest Classifier 0.204 3.604 100% 1.803
Weka Apriori Associator
Weka Tertius Associator

56
From this table, we can see that among all the clustering services, Weka FarthestFirst is
the fastest one and thus has the smallest latency. Among all the classifier services, Weka
REPTree Classifier has the smallest latency. Weka Apriori and Tertius Associator failed because
Lung Cancer dataset is not nominal data type. Throughput value varies among different services.
Since we consider failure invocations for the Reliability, we see different Reliability values such
as 100%, 42.85%, etc.
Table 4.16 shows the average QoS values of all SaaS on one IaaS (Azure-1). The QoS
values are averaged on all datasets.
From this table, we can see that the Reliability values vary when we average QoS values
on datasets. Weka DBSCAN clustering services failed for all the datasets. Weka Apriori
Associator and Weka Tertius Associator have less reliability than any other software services. A
few services have 100% reliability, which means they work properly for all the datasets. We can
also see the variation of latency, response time and throughput. We ran our simulation in
different timeframe, for example, pick hour and off-pick hour and we also chose different cloud
server locations. Sometimes we set wrong parameters for clustering services. Sometimes we
observed the network problem to communicate with the cloud server from the client application.
These influential factors make the difference of the QoS values and these differences affect
throughput directly because throughput value depends on service output, response time and
latency.

57
Table 4.16: Average QoS values of all SaaS on one IaaS (Azure-1)
Service Name Latency (sec) Response Time (sec) Reliability Throughput
Weka EM Clustering 2.235 7.535 83.33% 3.235
Weka Hierarchical Clustering 0.173 3.706 16.67% 1.643
Weka Filtered Clustering 0.251 3.9829 83.33% 5.458
Weka CLOPE Clustering 0.295 4.8698 16.67% 0.839
Weka FarthestFirst Clustering 0.445 3.697 100% 1.493
Weka SimpleKMeans Clustering 3.165 8.067 100% 3.680
Weka Cobweb Clustering 0.093 4.112 33.33% 2.361
Weka sIB Clustering 0.537 4.449 16.67% 1.864
Weka XMeans Clustering 0.182 4.292 66.67% 4.366
Weka DBSCAN Clustering
Apache KMeansPlusPlus Clustering 0.076 4.428 50% 4.179
Apache DBSCAN Clustering 0.082 4.274 50% 0.073
R Hierarchical Clustering 0.333 4.046 50% 12.595
R KMeans Clustering 0.172 3.436 50% 11.955
Weka BFTree Classifier 0.762 4.590 83.33% 1.768
Weka AdaBoostM1 Classifier 0.436 3.103 100% 1.893
Weka REPTree Classifier 0.215 3.507 100% 1.819
Weka LMT Classifier 0.302 3.052 83.33% 2.073
Weka RandomTree Classifier 0.294 4.014 100% 2.001
Weka RandomForest Classifier 0.324 4.101 100% 1.903
Weka Apriori Associator 0.057 3.831 16.67% 1.873
Weka Tertius Associator 7.336 11.061 16.67% 0.548

58
4.4 Summary
In this chapter, we explained our implementation details, our programming environment,
our user interfaces, data mining packages, and infrastructure configurations. We selected three
algorithm providers, two cloud service providers and six UCI datasets. We chose our datasets
based on different data properties such as dimension, size, missing values, data types (numeric
data, string data and combined data etc.).
From our collected QoS values, we could see some services failed to process the file. The
reason of failure could lie on dataset, algorithm implemented and parameters that users send to
the service. We see some services such as Weka DBSCAN, Weka CLOPE, and Weka OPTICES
clustering services are directly affected by the parameter values. R clustering and Apache
clustering services are affected by the data type because these two provider's algorithms support
only numeric datasets. Some services only support nominal data type, such as Weka CLOPE
clustering service. Sometimes we see QoS values vary a lot due to the network communication
from client system to the cloud server.

59
CHAPTER 5
CONCLUSION AND FUTURE WORK
5.1 Conclusion
QoS-based service selection in the cloud environment could be a big challenge now-a-
days, especially for data analytic services. In the cloud environment, different users follow
different strategies for data analytic service selection. QoS properties such as availability,
latency, response time, reliability and throughput are some influential factors for selecting these
services. The values of these properties for data analytic services could vary for different
datasets, and they also depend on how they are implemented and where and how they are hosted.
Although various approaches have been studied and proposed, there is no proper benchmarking
tool that will record the end-to-end QoS values for these software services when they are running
on different datasets and hosted in different infrastructure servers.
Our contributions are listed below:
We designed and implemented a cloud-based framework to build a testbed that
could be used for collecting end-to-end QoS values from data analytic services.
These QoS values are helpful for comparing different selection algorithm
proposed by different researchers.
We implemented a proof of concept prototype system where we chose data
mining algorithms from different providers to develop data analytic services as
representative services. We found that provider, functionality and implemented
algorithm are some SaaS related factors that impact QoS values. We hosted our

60
developed data analytic services in different cloud infrastructure services with
different configurations in different locations. We found that provider, location
and configuration are some IaaS related factors that impact QoS values.
5.2 Future Works
QoS based service selection is expanding and growing day by day in different sectors
including research community, government organization and private industries. There are a few
directions we would like to work on in the future.
Firstly, we could expand our current system to a fully functioning cloud marketplace with
more functionalities.
Secondly, in this work, we only consider five QoS properties, and in the future we could
include more QoS properties.
Thirdly, right now we only support RESTful services, and in the future we have plan to
include the support to SOAP based services as well because they are still used in many
organizations.
We plan to introduce other services that are not based on REST.
Lastly, we could try more SaaS services, IaaS instances and more datasets to collect a
bigger sized QoS dataset to share with the research community.
61
REFERENCES
[1] Service (systems architecture). Available at: http://en.wikipedia.org/wiki/service(systems
architecture), last accessed on August 2015.
[2] OASIS SOA Reference Model. Available at: https://www.oasis-open.org/committees/tc
home.php?wg_abbrev=soa-rm, last accessed on August 2015.
[3] R. Buyya, C. S. Yeo, S. Venugopal, J. Broberg, and I. Brandic, “Cloud computing and
emerging IT platforms: vision, hype, and reality for delivering computing as the 5th utility”,
2009 Future Generation Computer Systems, pp. 599-616.
[4] J. Yan and J. Piao, "Towards QoS-based web services discovery," 2009 Service-Oriented
Computing ICSOC 2008 Workshops, pp. 200-210.
[5] E. Al-Masri and Q. H. Mahmoud, "QoS-based Discovery and Ranking of Web
Services", 2007 16th International Conference on Computer Communications and Networks
(ICCCN), pp. 529-534.
[6] Y. Liu, A. H. Ngu and L. Z. Zeng, "QoS Computation and Policing in Dynamic Web
Service Selection", 2004 13th International World Wide Web Conference, pp. 66-73.
[7] Q. He, J. Han, Y. Yang, J. Grundy and H. Jin, "QoS-driven service selection for multi-
tenant SaaS", 2012 IEEE Fifth International Conference on Cloud Computing, pp. 566-573.

62
[8] D. Skoutas, D. Sacharidis, A. Simitsis, V. Kantere and T. Sellis, "Top-k dominant web
services under multi-criteria matching," 2009 12th International Conference on Extending
Database Technology: Advances in Database Technology, pp. 898-909.
[9] Q.MA, H. WANG, Y. LI, G. XIE and F. LIU , "A Semantic QoS-aware Discovery
Framework for Web Services", 2008 IEEE International Conference on Web Services, pp. 129-
136.
[10] R. Madaleno and R. Neto Marinheiro, "Identification and ranking of relevant criteria for
the selection of Software as a Service", 2013 8th Iberian Conference on Information Systems and
Technologies (CISTI), pp. 1-6.
[11] Y. M. Afify, I. F. Moawad, N. L. Badr and M.F. Tolba, "A Semantic-based Software-as-
a-Service (SaaS) Discovery and Selection System", 2013 8th International Conference on
Computer Engineering & Systems (ICCES), pp. 57-63.
[12] S. Le, H. Dong, H. F.K, H. O.K, J. Ma and Y. Zhang, "Multicriteria Decision Making
with Fuzziness and Criteria Interdependence in Cloud Service Selection", 2014 IEEE
International Conference on Fuzzy Systems (FUZZ-IEEE), pp. 1929-1936.
[13] R. K. Lomotey and R. Deters, "Analytics-as-a-Service (AaaS) Tool for Unstructured Data
Mining", 2014 IEEE International Conference on Cloud Engineering, pp. 319- 324.
[14] F. Zulkernine, M. Bauer and A.Aboulnaga, "Towards Cloud-based Analytics-as-a-
Service (CLAaaS) for Big Data Analytics in the Cloud", 2013 IEEE International Congress on
Big Data, pp. 62-69.
[15] IBM Research “Analytics-as-a-Service Platform”. Available at: http://researcher.ibm.com

63
/researcher/view_project.php?id=3992, last accessed on August 2015.
[16] The QWS Dataset. Available at: http://www.uoguelph.ca/~qmahmoud/qws/, last accessed
on August 2015.
[17] WS-Dream Dataset. Available at: http://www.wsdream.net/dataset.html, last accessed on
August 2015.
[18] The WEKA toolkit, University of Waikato. Available at: http://www.cs.waikato.ac.nz/ml/
weka/, last accessed on August 2015.
[19] The R Project for Statistical Computing. Available at: http://www.r-project.org/, last
accessed on August 2015.
[20] Apache Commons Math Machine Learning. Available at: http://commons.apache.org/
proper/commons-math/userguide/ml.html, last accessed on August 2015.
[21] K. Kritikos and D. Plexousakis, “Mixed-Integer Programming for QoS-based Web
Service Matchmaking”, 2009 IEEE Transactions on Services Computing, pp. 122-139.
[22] C.W. Hang and M.P. Singh, “From Quality to Utility: Adaptive Service Selection
Framework”, 2010 International Conference on Service Oriented Computing, pp. 456-470.
[23] R.J.R. Raj and T. Sasipraba, "Web service selection based on QoS Constraints", 2010
Trends in Information Sciences & Computing (TISC), pp. 156-162.
[24] V. X. Tran, H. Tsuji and R. Masuda, "A new QoS ontology and its QoS-based ranking
algorithm for Web services," 2009 Simulation Modelling Practice and Theory, pp. 1378-1398.

64
[25] L. Qu, Y. Wang and O. M.A, "Cloud Service Selection Based on the Aggregation of User
Feedback and Quantitative Performance Assessment", 2013 IEEE International Conference on
Services Computing (SCC), pp. 152-159.
[26] L. Sun, H. Dong, F.K. Hussain, O.K. Hussain, J. Ma and Y. Zhang, "A Hybrid Fuzzy
Framework for Cloud Service Selection", 2014 IEEE International Conference on Web Services,
pp. 313-320.
[27] M. Tajvidi, R. Ranjan, J. Kolodziej and L. Wang, "Fuzzy cloud service selection
framework", 2014 IEEE 3rd International Conference on Cloud Networking (CloudNet), pp.
443-448.
[28] A.Kr Mandal, S. Changder and A. Sarkar, " Selection of Services for Data-Centric Cloud
Applications: A QoS Based Approach", 2013 Second International Conference on Advanced
Computing, Networking and Security, pp. 102-107.
[29] M. Sun, T. Zang, X. Xu and R. Wang, "Consumer-Centered Cloud Services Selection
Using AHP", 2013 International Conference on Service Science, pp. 1 - 6.
[30] R. Karim, C. Ding and A. Miri , "An End-To-End QoS Mapping Approach for Cloud
Service Selection", 2013 IEEE Ninth World Congress on Services, pp. 341-348.
[31] H. Li and J. Jeng, "CCMarketplace: A Marketplace Model for a Hybrid Cloud", 2010
Conference of the Center for Advanced Studies on Collaborative Research, pp. 174-183.
[32] T. Heninger, A. Singh, V. Singh, T. Wies and D. Zufferey, "A Marketplace for Cloud
Resources", 2010 International Conference of Embedded Systems, pp. 1-7.

65
[33] S. Chang, "Application Marketplace as a Service - A Reference Architecture for
Application Marketplace Service", 2010 International Conference on Cloud and Internet
Computing (3PGCIC), pp.186-192.
[34] A. Menychtas, A. Gatzioura and T. Varvarigou, “A Business Resolution Engine for
Cloud Marketplaces”, 2011 Third IEEE International Conference on Coud Computing
Technology and Science, pp. 462-46.
[35] O. Krieger, P. McGachey and A. Kanevsky, "Enabling a Marketplace of Clouds:
VMware’s vCloud Director", 2010 Operating Systems Review, pp. 103-114.
[36] S. Song, M. M. Hassan and E. Huh, "A Novel Cloud Market Infrastructure for Trading
Service", 2009 International Conference on Computational Science and Its Applications, pp. 44-
50.
[37] Cloud Broker. Available at: http://searchcloudprovider.techtarget.com/definition/cloud-
broker, last accessed on August 2015.
[38] S. Sundareswaran, A. Squicciarini, and D. Lin, "A Brokerage-Based Approach for Cloud
Service Selection", Cloud Computing (CLOUD), 2012 IEEE 5th International Conference,
pp.558-565.
[39] P.Pawluk, B. Simmons, M. Smit, M. Litoiu and S.Mankovski, "Introducing STRATOS:
A Cloud Broker Service", 2012 IEEE Fifth International Conference on Cloud Computing, pp.
891-898.
[40] V. Cardellini and S.Iannucci, "Designing a Broker for QoS-driven Runtime Adaptation of
SOA Applications", 2010 IEEE International Conference on Web Services, pp. 504-511.

66
[41] F. Ye, Z.Wang, F. Zhou, Y.Wang and Y. Zhou, "Cloud-Based Big Data Mining &
Analyzing Services Platform Integrating R", 2013 International Conference on Advanced Cloud
and Big Data (CBD), pp.147-151.
[42] T.Chen, J. Chen and B. Zhou, "A System for Parallel Data Mining Service on Cloud",
2012 Second International Conference on Cloud and Green Computing (CGC), pp. 329-330.
[43] Web service. Available at: http://www.w3.org/TR/2004/NOTE-ws-gloss-20040211/
#webservice, last accessed on August 2015.
[44] Roy T. Fielding and Richard N. Taylor, "Principled Design of the Modern Web
Architecture", 2000 22nd international conference on Software engineering, pp.407-416.
[45] Microsoft Azure. Available at: http://blogs.microsoft.com/blog/2010/02/01/windows-
azure-general-availability/, last accessed on August 2015.
[46] UCI Machine Learning Repository. Available at: https://archive.ics.uci.edu/ml/
datasets.html, last accessed on August 2015.
[47] Richard K. Lomotey and R. Deters, "Analytics-as-a-Service (AaaS) Tool for
Unstructured Data Mining", 2014 IEEE International conference on Cloud Engineering, pp. 319-
324.
[48] K. Park, M. C. Nguyen and H.Won, "Web-based Collaborative Big Data Analytics on
Big Data as a Service platform", 2014 IEEE International conference on Big Data, pp. 564-567.


![Model-based Software Tools for Conguring and Customizing ...schmidt/PDF/QA_GPCE04.pdf · an experimentation testbed for the ACE [22], TAO [9], and CIAO [1] QoS-enabled middleware](https://img.pdfslide.us/doc/110x75/6055c9aa89da2b11ec0bd819/model-based-software-tools-for-conguring-and-customizing-schmidtpdfqagpce04pdf.jpg)