Embed Size (px)
Citation preview

BMO EXCHANGE TRADED FUNDS
Alfred Lee, cfa, dms
Vice President & Investment StrategistBMO ETFs & Global Structured InvestmentsBMO Asset Management [email protected]
In this issue:
A Test of Fortitude & Discipline: 2011 in Review ..........................1
Asset Allocation Themes ...........2
Equity Themes ...........................2
Fixed Income and Credit Themes ............................3
Commodity Themes ...................4
Receive our Monthly Strategy Report and BMO ETF: Trade Opportunity emails automatically.
See inside for details.
All pricesor returns as of market close on December 20, 2011 unless otherwise indicated.
A Test of Fortitude & Discipline: 2011 in Review
Monthly Strategy Report December 2011
Just when you thought financial markets couldn’t get any more extreme, they suddenly prove otherwise. Such was the theme over the course of 2011, a year where market volatility caused constant changes in sentiment and significantly frustrated many investors. Global equities fell 6.5% on the year, as indicated by the MSCI World Index (Total Return), which should actually be viewed as a positive given the macro-economic backdrop. As the year progressed, the market was hit with an increasing number of negative headlines including: the unfortunate Japanese earthquake/tsunami; the downgrade of U.S. Treasuries by Standard & Poor’s; deteriorating sovereign debt issues in Europe; and growing concerns of a hard landing in China. As a result, most of the gains experienced in broad market equity indices during the first quarter of the year rapidly reversed course as sentiment became increasingly bearish from these news items during the last six months of the year. Moreover, since August, both realized and implied volatility have remained elevated, providing a serious test of discipline for investors.
We started the year with a more bullish tone as markets continued to enjoy the effects of “QE2” (the second instalment of quantitative easing by the U.S. Federal Reserve). However, as the year progressed and market sentiment soured, our Global Inter-Market Model showed developing trends in defensive-oriented assets. Consequently, and also considering the worsening macro-economic data, we
issued a report on August 15, titled “Navigating Market Volatility” where we recommended a more defensive-oriented portfolio strategy. Given the rapidly changing market environment, our recommendations in 2011 were significantly more tactical than the previous year. Below, we highlight some of the recommended themes throughout the year.
Jan-2
011
Feb-
2011
Mar-20
11
Apr-2
011
May-2
011
June-2
011
July-2
011
Aug-
2011
Sep-
2011
Oct-2
011
Nov-2
011
Dec-2
011
-150
-100
-50
0
50
100 Bloomberg Fear/Greed Indicator (MSCI World)
Source: BMO Asset Management Inc., Bloomberg
Sentiment shifts were vicious after "Dark-Cross"
Sentiment Shifts in Global Equities Were Rapid in the Second Half of Year
Jan-2
011
Feb-
2011
Mar-20
11
Apr-2
011
May-2
011
June-2
011
July-2
011
Aug-
2011
Sep-
2011
Oct-2
011
Nov-2
011
Dec-2
011
1000
1050
1100
1150
1200
1250
1300
1350
1400
1450
"Dark Cross" was a bearish indicator
50-Day Moving Average
200-Day Moving Average
MSCI World Index
BMO EXCHANGE TRADED FUNDS 2Monthly Strategy Report December 2011
Asset Allocation Themes:1) “Overweight Equities Relative to Bonds:” This asset allocation decision fared extremely well during the first quarter with the S&P/TSX Composite Index to DEX Universe ratio expanding until April 8, as Canadian equities outperformed bonds. Though we remained optimistic on equities through June, as the summer progressed, both macro-economic data and technical indicators suggested a greater emphasis to fixed income. We therefore recommended an overweighting in bonds in our previously mentioned August 15 report. That tactical shift to fixed income has served us well as our BMO Aggregate Bond Index ETF (ZAG) has gained 3.5% on a total return basis since that report, while the S&P/TSX Composite Index returned -6.7% on a total return basis from the same period. That tactical shift led to a difference of 10.2% in performance.
2) “Be Prepared for Sudden Upside Volatility:” At the beginning of the year and a theme highlighted throughout 2011 was to prepare for constant shocks in volatility or what we noted as “volatility-squared,” as markets were becoming more behaviourally driven and increasingly reactive to negative headlines. A greater emphasis on cross-asset class diversification rather than simply diversification within an asset class was suggested as a means of mitigating some of these volatility shocks.
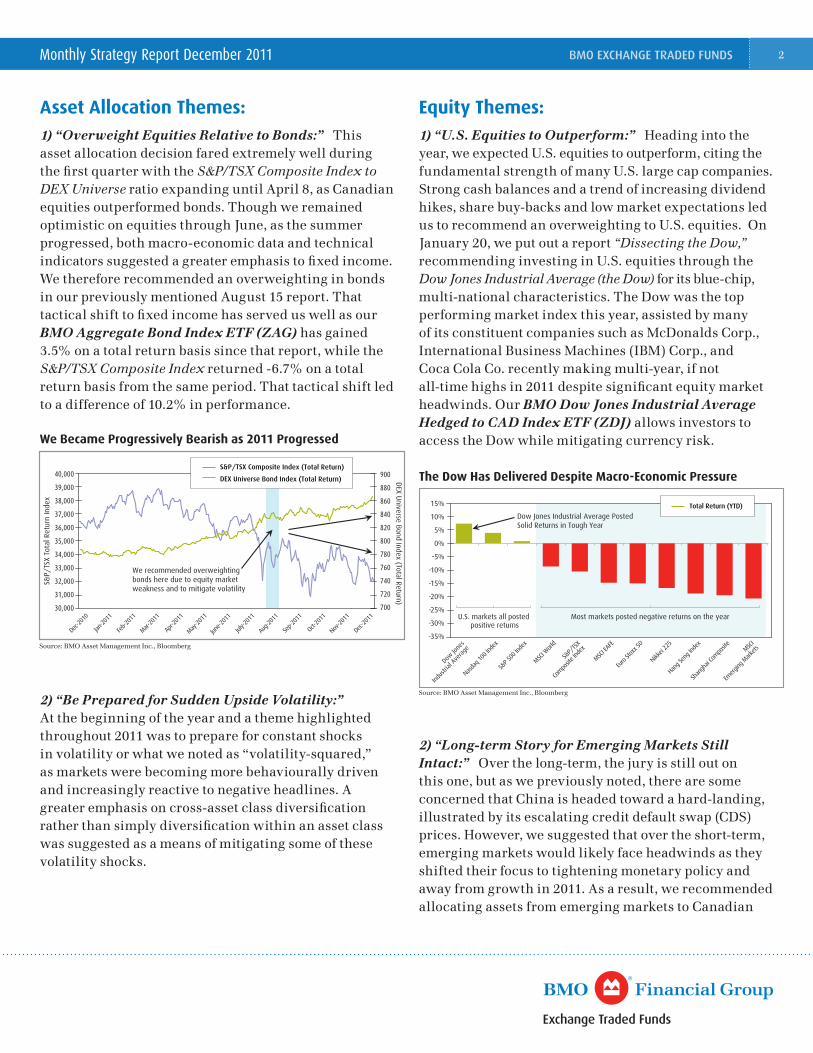
Equity Themes:1) “U.S. Equities to Outperform:” Heading into the year, we expected U.S. equities to outperform, citing the fundamental strength of many U.S. large cap companies. Strong cash balances and a trend of increasing dividend hikes, share buy-backs and low market expectations led us to recommend an overweighting to U.S. equities. On January 20, we put out a report “Dissecting the Dow,” recommending investing in U.S. equities through the Dow Jones Industrial Average (the Dow) for its blue-chip, multi-national characteristics. The Dow was the top performing market index this year, assisted by many of its constituent companies such as McDonalds Corp., International Business Machines (IBM) Corp., and Coca Cola Co. recently making multi-year, if not all-time highs in 2011 despite significant equity market headwinds. Our BMO Dow Jones Industrial Average Hedged to CAD Index ETF (ZDJ) allows investors to access the Dow while mitigating currency risk.
2) “Long-term Story for Emerging Markets Still Intact:” Over the long-term, the jury is still out on this one, but as we previously noted, there are some concerned that China is headed toward a hard-landing, illustrated by its escalating credit default swap (CDS) prices. However, we suggested that over the short-term, emerging markets would likely face headwinds as they shifted their focus to tightening monetary policy and away from growth in 2011. As a result, we recommended allocating assets from emerging markets to Canadian
We Became Progressively Bearish as 2011 Progressed
Source: BMO Asset Management Inc., Bloomberg
Jan-2
011
Feb-
2011
Mar-20
11
Apr-2
011
May-2
011
June-2
011
July-2
011
Aug-
2011
Sep-
2011
Oct-2
011
Nov-2
011
Dec-2
011
Dec-2
010
S&P/
TSX
Tota
l Ret
urn
Inde
x
DEX U
niverse Bond Index (Total Return)
30,000
31,000
32,000
33,000
34,000
35,000
36,000
37,000
38,000
39,000
40,000
700
720
740
760
780
800
820
840
860
880
900S&P/TSX Composite Index (Total Return)
DEX Universe Bond Index (Total Return)
We recommended overweighting bonds here due to equity market weakness and to mitigate volatility
The Dow Has Delivered Despite Macro-Economic Pressure
Source: BMO Asset Management Inc., Bloomberg
Dow Jo
nes
Indus
trial
Aver
age
Nasda
q 100
Inde
x
Euro
Stoxx
50
Nikkei
225
S&P 5
00 In
dex
MSCI W
orld
S&P/
TSX
Com
posit
e Ind
ex
MSCI E
AFE
Hang
Seng
Inde
xMSC
I
Emerg
ing M
arkets
Shan
ghai
Com
posit
e-35%
-30%
-25%
-20%
-15%
-10%
-5%
0%
5%
10%
15% Total Return (YTD)
Dow Jones Industrial Average PostedSolid Returns in Tough Year
Most markets posted negative returns on the yearU.S. markets all posted positive returns

BMO EXCHANGE TRADED FUNDS 3Monthly Strategy Report December 2011
and particularly U.S. equities last January, which proved to be the correct call. Over the year, our BMO Dow Jones Industrial Average Hedged to Cad Index ETF (ZDJ) and our BMO Dow Jones Canada Titans 60 Index ETF (ZCN) outperformed our BMO Emerging Markets Equity Index ETF (ZEM) by 22.5% and 4.3% respectively on a total return basis.
3) Canadian Banks Continue to Look for Acquisitions:” A number of Canadian banks continued to acquire businesses in 2011, targeting asset managers to the retail brokerage units of foreign institutions. We anticipated this to be a good long-term business move but with the possibility that the stock prices of Canadian banks over the short-term would be depressed. On February 11, we issued a report “Banking Income,” recommending our BMO Covered Call Banks ETF (ZWB) as a way to enhance yield while maintaining exposure to the sub-sector that would likely face short-term headwinds.
4) “Increase Dividends to Negate Volatility:” As equity markets became increasingly volatile, investors gravitated toward dividend paying stocks. In addition, with the U.S. Federal Reserve launching “Operation Twist1” in September and pledging low interest rates until 2013, investors were led to increase allocations to yield-oriented assets. The BMO Equal Weight REITs (ZRE) and BMO Equal Weight Utilities ETF (ZUT) delivered 12.6% and -0.8% year-to-date respectively on a total return basis, outperforming the -10.7% decline in the S&P/TSX Composite Index.
5) “Merger and Acquisition (M&A) Activity is Back:” At the onset of the new year, we believed rising M&A activity and slowly recovering U.S. housing market would lead U.S. banking stocks higher. This trade however did not work as many U.S. banks faced significant headwinds especially with the Fed flattening out the yield curve with ‘Operation Twist’ which impacts the profitability of the banks.
Fixed Income and Credit Themes:1) An Exposure to Non-Traditional Fixed Income: As we remain in a low interest rate environment, investors have had to look beyond government bonds to source higher yields. Non-traditional fixed income areas such as U.S. high yield bonds and emerging market debt have provided investors with higher yield. Although these areas offer more attractive yield, they are more volatile than Canadian federal and provincial fixed income and as such are more volatile. Given this, we have recommended exposure to these areas in moderation. Both of these areas in non-traditional fixed income can be accessed through our BMO U.S. High Yield U.S. Corporate Bond Hedged to CAD Index ETF (ZHY) and BMO Emerging Market Bond Hedged to CAD Index ETF (ZEF) respectively.
2) Low volatility fixed income: As mentioned, Bank of Canada bonds are yielding much lower rates than they have historically. However, we have recommended that investors maintain an allocation to government bonds, using them as a portfolio volatility mitigation tool. In addition, as non-traditional bonds at times react to macro-economic risk in the same way as equities, exposure to federal and provincial bonds would help offset some of that risk. Though we began the year preferring shorter-term federal bonds anticipating that the Bank of Canada would raise rates, as the year progressed, we extended our call on duration to mid-term federal bonds with a weakening economy even leading some economists to expect rate cuts in 2012.
Jan-2
011
Feb-
2011
Mar-20
11
Apr-2
011
May-2
011
June-2
011
July-2
011
Aug-
2011
Sep-
2011
Oct-2
011
Nov-2
011
Dec-2
010
Source: BMO Asset Management Inc., Bloomberg (All returns based on total returns)
Tota
l Ret
urns
Inde
xed
to 1
00
BMO Equal Weight Utilities ETF (ZUT)
S&P/TSX Composite Index (Total Return)
BMO Equal Weight REIT Index ETF (ZRE)
70
75
80
85
90
95
100
105
110
115
120
Higher Dividend Areas Such as Utilities and REITs Outperformed in 2011
BMO EXCHANGE TRADED FUNDS 4Monthly Strategy Report December 2011
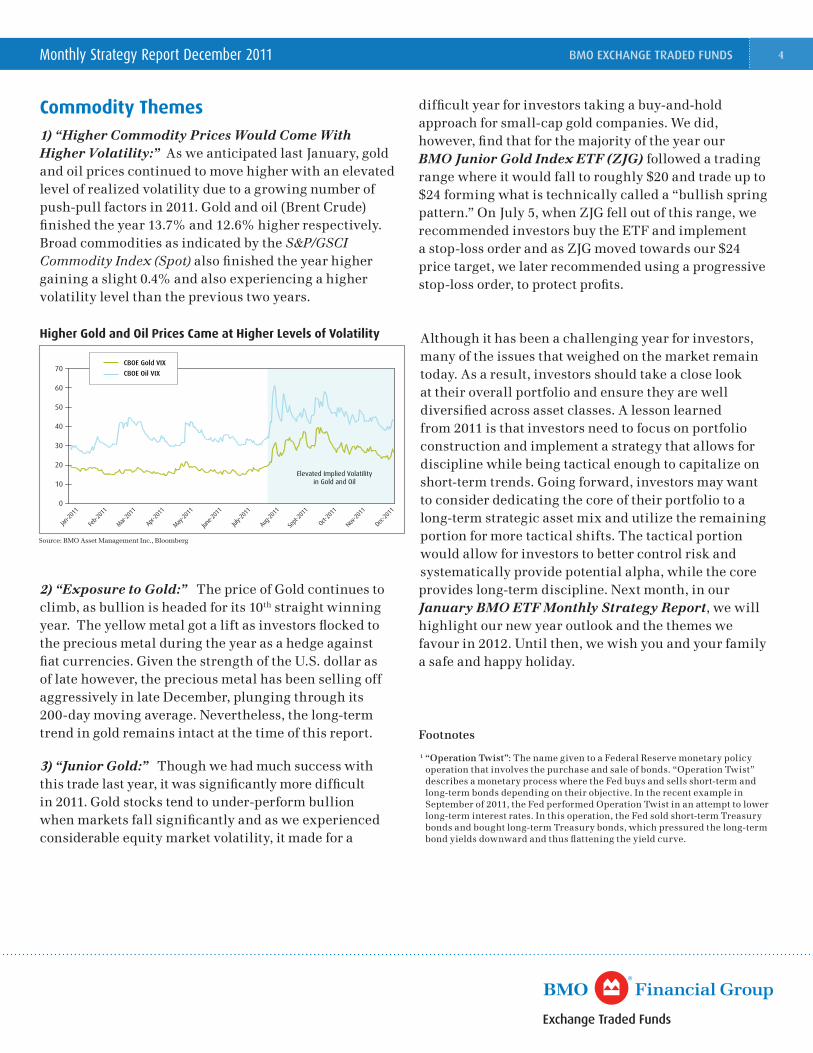
Commodity Themes1) “Higher Commodity Prices Would Come With Higher Volatility:” As we anticipated last January, gold and oil prices continued to move higher with an elevated level of realized volatility due to a growing number of push-pull factors in 2011. Gold and oil (Brent Crude) finished the year 13.7% and 12.6% higher respectively. Broad commodities as indicated by the S&P/GSCI Commodity Index (Spot) also finished the year higher gaining a slight 0.4% and also experiencing a higher volatility level than the previous two years.
2) “Exposure to Gold:” The price of Gold continues to climb, as bullion is headed for its 10th straight winning year. The yellow metal got a lift as investors flocked to the precious metal during the year as a hedge against fiat currencies. Given the strength of the U.S. dollar as of late however, the precious metal has been selling off aggressively in late December, plunging through its 200-day moving average. Nevertheless, the long-term trend in gold remains intact at the time of this report.
3) “Junior Gold:” Though we had much success with this trade last year, it was significantly more difficult in 2011. Gold stocks tend to under-perform bullion when markets fall significantly and as we experienced considerable equity market volatility, it made for a
difficult year for investors taking a buy-and-hold approach for small-cap gold companies. We did, however, find that for the majority of the year our BMO Junior Gold Index ETF (ZJG) followed a trading range where it would fall to roughly $20 and trade up to $24 forming what is technically called a “bullish spring pattern.” On July 5, when ZJG fell out of this range, we recommended investors buy the ETF and implement a stop-loss order and as ZJG moved towards our $24 price target, we later recommended using a progressive stop-loss order, to protect profits.
Although it has been a challenging year for investors, many of the issues that weighed on the market remain today. As a result, investors should take a close look at their overall portfolio and ensure they are well diversified across asset classes. A lesson learned from 2011 is that investors need to focus on portfolio construction and implement a strategy that allows for discipline while being tactical enough to capitalize on short-term trends. Going forward, investors may want to consider dedicating the core of their portfolio to a long-term strategic asset mix and utilize the remaining portion for more tactical shifts. The tactical portion would allow for investors to better control risk and systematically provide potential alpha, while the core provides long-term discipline. Next month, in our January BMO ETF Monthly Strategy Report, we will highlight our new year outlook and the themes we favour in 2012. Until then, we wish you and your family a safe and happy holiday.
Footnotes
1 “Operation Twist”: The name given to a Federal Reserve monetary policy operation that involves the purchase and sale of bonds. “Operation Twist” describes a monetary process where the Fed buys and sells short-term and long-term bonds depending on their objective. In the recent example in September of 2011, the Fed performed Operation Twist in an attempt to lower long-term interest rates. In this operation, the Fed sold short-term Treasury bonds and bought long-term Treasury bonds, which pressured the long-term bond yields downward and thus flattening the yield curve.
Higher Gold and Oil Prices Came at Higher Levels of Volatility
Jan-2
011
Feb-
2011
Mar-20
11
Apr-2
011
May-2
011
June-2
011
July-2
011
Aug-
2011
Sept-
2011
Oct-2
011
Nov-2
011
Dec-2
011
Source: BMO Asset Management Inc., Bloomberg
CBOE Gold VIX
CBOE Oil VIX
Elevated Implied Volatility in Gold and Oil
0
10
20
30
40
50
60
70

BMO EXCHANGE TRADED FUNDS 5Monthly Strategy Report December 2011
BMO ETFs are managed and administered by BMO Asset Management Inc., an investment fund manager and portfolio manager and separate legal entity from Bank of Montreal.
Commissions, management fees and expenses all may be associated with investments in exchange traded funds. The indicated rates of return are the historical annual compound total returns including changes in prices and reinvestment of all distributions and do not take into account commission charges or income taxes payable by any unitholder that would have reduced returns. Please read the prospectus before investing. The funds are not guaranteed, their value changes frequently and past performance may not be repeated.
“Dow Jones”, “Dow Jones Industrial Average”, “Dow Jones Canada Titans 60”, and “Titans” are service marks of Dow Jones & Company, Inc. and have been licensed for use for certain purposes. BMO ETFs based on Dow Jones’ indices are not sponsored, endorsed, sold or promoted by Dow Jones, and Dow Jones makes no representation regarding the advisability of trading in such ETFs.
Standard & Poor’s® and S&P® are registered trademarks of Standard & Poor’s Financial Services LLC (“S&P”) and “TSX” is a trademark of Toronto Stock Exchange. These trademarks have been licensed for use by BMO Asset Management Inc. BMO S&P/TSX Equal Weight Banks Index ETF, BMO S&P/TSX Equal Weight Oil & Gas Index ETF, and BMO S&P/TSX Equal Weight Global Base Metals Hedged to CAD Index ETF is not sponsored, endorsed, sold or promoted by S&P or Toronto Stock Exchange, and S&P and Toronto Stock Exchange make no representation, warranty or condition regarding the advisability of buying, selling or holding units/shares in the BMO S&P/TSX Equal Weight Banks Index ETF, BMO S&P/TSX Equal Weight Oil & Gas Index ETF, and BMO S&P/TSX Equal Weight Global Base Metals Hedged to CAD Index ETF.
® Registered trade-mark of Bank of Montreal.
12/11-1808
For more information on BMO ETFs, please visit our website bmo.com/etfs or contact your financial advisor.
To be added to the distribution list for our Monthly Strategy Report and Trade Opportunities Report, please visit our homepage at bmo.com/etfs to subscribe or email [email protected] with title: “Add to distribution list.”
ETF Name Ticker YTD Return 1-Yr Return Since Inception Inception Date
BMO Aggregate Bond Index ETF ZAG 7.07% 7.00% 6.62% January 19, 2010
BMO Dow Jones Industrial Average Hedged to CAD Index ETF
ZDJ 5.16% 10.26% 16.05% May 29, 2009
BMO Emerging Markets Equity Index ETF ZEM -13.90% -10.00% -0.52% October 20, 2009
BMO Dow Jones Canada Titans 60 Index ETF ZCN -8.75% -5.35% 5.99% May 29, 2009
BMO Equal Weight REITs Index ETF ZRE 11.21% 12.58% 19.57% May 19, 2010
BMO Equal Weight Utilities Index ETF ZUT 0.44% 2.50% 8.24% January 19, 2010
*Rates of return based on closing prices on TSX. Returns are as of November 30, 2011
Rates of Return


![IN DEX. []](https://img.pdfslide.us/doc/110x75/61851db3a8c3ca232b4bd3f7/in-dex-.jpg)