Embed Size (px)
Citation preview
Journal of Mechanical Design
1
Nasreddine El Dehaibi Mechanical Engineering, Stanford University, Stanford, CA 94305, e-mail: [email protected] Aiyanna Herrera Mechanical Engineering, Stanford University, Stanford, CA 94305, e-mail: [email protected] Disney Rattanakongkham Mechanical Engineering, Stanford University, Stanford, CA 94305, e-mail: [email protected] Erin F. MacDonald Assistant Professor, Mechanical Engineering, Stanford University, Stanford, CA 94305 e-mail: [email protected] ABSTRACT
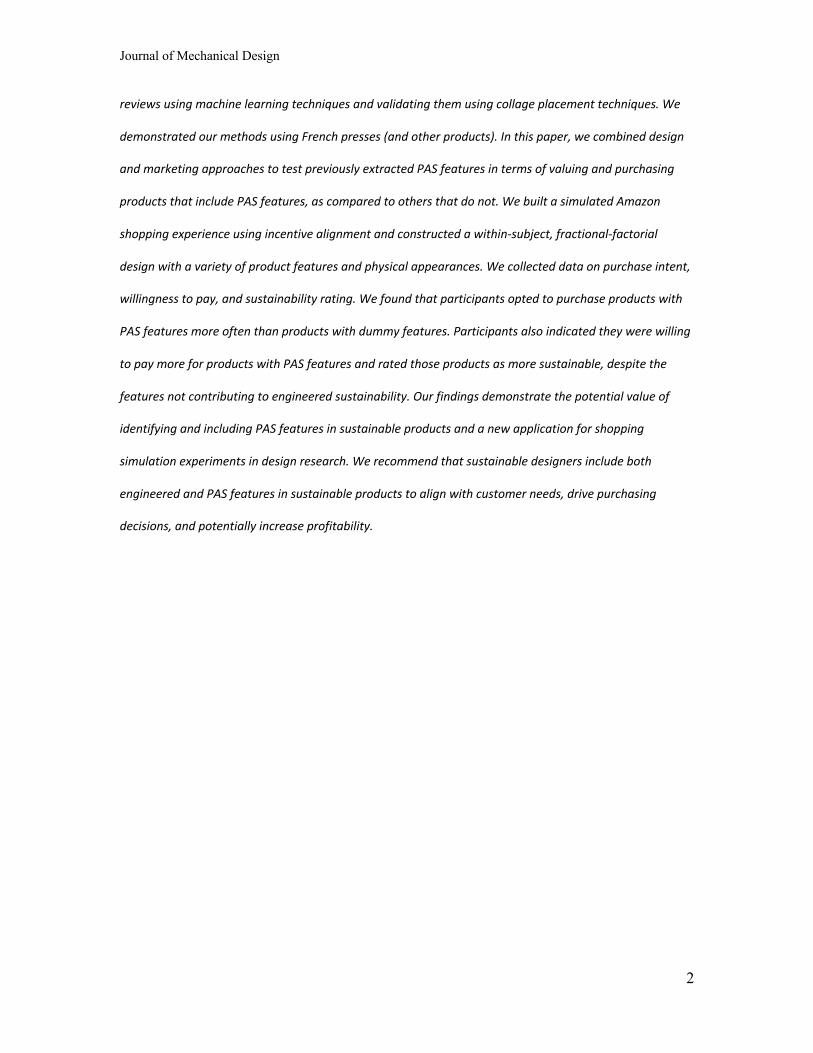
Designers are challenged to create sustainable products that succeed in the marketplace, often relying on
life cycle analyses to identify engineered sustainable features while neglecting perceived-as-sustainable
(PAS) features. PAS features may not contribute to engineered sustainability but are identified by
customers as sustainable. In previous papers we proposed methods for extracting PAS features from online
A Test for Product Design Features Perceived as Sustainable to Drive Online Purchasing
Decisions
Journal of Mechanical Design
2
reviews using machine learning techniques and validating them using collage placement techniques. We
demonstrated our methods using French presses (and other products). In this paper, we combined design
and marketing approaches to test previously extracted PAS features in terms of valuing and purchasing
products that include PAS features, as compared to others that do not. We built a simulated Amazon
shopping experience using incentive alignment and constructed a within-subject, fractional-factorial
design with a variety of product features and physical appearances. We collected data on purchase intent,
willingness to pay, and sustainability rating. We found that participants opted to purchase products with
PAS features more often than products with dummy features. Participants also indicated they were willing
to pay more for products with PAS features and rated those products as more sustainable, despite the
features not contributing to engineered sustainability. Our findings demonstrate the potential value of
identifying and including PAS features in sustainable products and a new application for shopping
simulation experiments in design research. We recommend that sustainable designers include both
engineered and PAS features in sustainable products to align with customer needs, drive purchasing
decisions, and potentially increase profitability.

Journal of Mechanical Design
3
1 INTRODUCTION
Research on customer purchase intent versus actual purchases has revealed
gaps, for examples see [1,2]. This is especially true for sustainable products, where
factors like social desirability bias can influence what customers share about their
intentions. In a paper towel survey for example, MacDonald et al. found that 87% of
participants stated they would not buy non-recycled paper, but also indicated they
bought from brands with non-recycled paper the last time they went shopping [3]. This
mismatch challenges designers to create successful sustainable products in a market
with an apparent growing demand from customers [4], but unfortunately a lack of
sustainability information and/or knowledge among customers.
To address this challenge, designers have created methods for identifying design
cues that can help customers form product perceptions and boost their intentions to
purchase sustainable products. MacDonald et al. demonstrated that customer
preferences are constructed, in-part, based on the context of the purchase decision and
are not necessarily innate in people. The authors provided participants with slightly
modified versions of discrete choice surveys for paper towels and found inconsistent
preferences between them [5]. She and MacDonald built on this by demonstrating how
visual design features termed “sustainability triggers” led participants to prioritize
hidden sustainability features in a realistic decision scenario for toaster prototypes [2].
For example, a sustainability trigger like an embossed leaf pattern correlated with a
prioritization of engineered sustainability features like energy usage in survey questions
on purchase intention. Seemingly superfluous features can therefore help customers

Journal of Mechanical Design
4
value engineered (real) sustainability information about a product that aligns with their
perceptions.
Designers typically focus on the hard facts of sustainability when designing
sustainable products. They use tools such as Life Cycle Analysis (LCA) to prioritize design
goals, such as energy usage and recyclability 1. Unfortunately, much of this hard work is
hidden within the final product, and unless customers know the right questions to ask,
think to ask these questions, and know where to find the relevant information, many
sustainable design efforts are never known to the customer. Much of what the
customer perceives as related to sustainability is what they can see on the surface of the
product.
In a previous paper, we proposed a method for designers to extract perceived-
as-sustainable (PAS) features from online reviews using a natural language processing
machine learning algorithm combined with human annotators [6]. While these features
may not contribute to engineered sustainability, meaning they do not decrease the life-
cycle impact of the product, the features aid in communicating the purpose of the
product to the customer. The inclusion of PAS features supports existing sustainable
design methods like LCAs in that designers can create sustainable products that meet
both engineered and perceived sustainability requirements.
As a case-study for our previously proposed method, we extracted salient PAS
features from French press online reviews that drove positive and negative sentiment.
We demonstrated that there is a gap between engineered and PAS features,
1 http://www.sustainableminds.com/

Journal of Mechanical Design
5
highlighting the importance of accounting for both in design. In a subsequent paper, we
used a novel collage approach to validate that users identified the PAS features as
sustainable despite these features not necessarily contributing to engineered
sustainability [7].
In this paper, we conduct a strong test of PAS features by investigating how they
can drive purchasing decisions for sustainable products in a simulated Amazon shopping
experience (Fig. 1). Our goal is to provide a validated method for designers to create
sustainable products that resonate with customers and drive purchasing decisions that
are based, in-part, on valuing sustainability. We test the French press features extracted
from our previous paper using a within-subject fractional factorial experiment design to
demonstrate how PAS features influence purchase decisions. The rest of the paper is
organized as follows: the background is presented in Section 2, followed by an overview
of the propositions and hypotheses in Section 3. In Section 4 we describe the methods,
in Section 5 we present the results, and in Section 6 we discuss the findings. Finally, we
conclude the paper in Section 7.
Extract PAS features from online reviews
Simulate Amazon Shopping Experience
Identify sustainable design
purchasing decision insights Test PAS features on a
collage
Previous Papers
Current Paper
Figure 1: Current paper builds off work from previous papers

Journal of Mechanical Design
6
2 BACKGROUND
There is an extensive body of research from design and marketing on
investigating customer choices and purchase decisions. Our work utilizes approaches
from both research areas to identify how PAS features may influence online purchasing
decisions. Common design approaches include conjoint and discrete choice analyses to
tease-out preference of product features presented in different combinations of
options. Designers can model and predict which product configurations are the most
valued by customers based on these preferences [8]. Marketing approaches typically
rely on historical data to model factors that influence purchase decisions. This section
provides an overview of customer preference modeling from design and marketing and
provides an overview of our previous papers that we build off for this paper.
2.1 Customer Preference Modeling in Design
This section presents an overview of recent customer preference modeling
research in design. Suryadi and Kim proposed an automated method to construct choice
sets using online product information and customer reviews [9]. The authors mined
Amazon product data for 84 laptops and 46,194 verified customer reviews. From the
data they clustered products using X-means on the attributes, clustered customers using
vector representation similarity of the reviews, and then constructed choice sets using a
multinomial logit model. Using KL divergence, the authors showed that the generated
choice sets have higher preference predictive ability compared to a baseline random
constructed choice set.

Journal of Mechanical Design
7
Goucher-Lambert et al. used functional magnetic resonance imaging (fMRI) to
investigate how customers make multi-attribute product decisions when considering
sustainability [10]. The authors recruited participants to complete a within-subject
conjoint analysis inside an fMRI. Participants were presented with two product options
at a time with information on their form, function, and price. In the control condition
participants were also shown the Poisson’s ratio while in the test condition participants
were shown information on the environmental impact. Using empirical fMRI results, the
authors found that participants prioritized function while deprioritizing visual
appearance when given environmental information about products. This work validated
findings of a previous conjoint analysis study [11].
Tovares et al. proposed a method for incorporating experiences into consumer
preference modeling [12]. The authors used virtual reality (VR) to provide participants
with the ability to interact with products before indicating their preferences. Two
within-subject experiments were conducted: one explored layout preference using a
truck cab dashboard and the other explored form preference using mugs. For each
experiment, participants completed a conjoint analysis with an experiential setup and a
non-experiential (standard) setup. In addition, for the mug experiment, participants
completed a “real” conjoint analysis where they interacted with real mugs before
indicating preferences. The authors found that the experiential conjoint analyses did not
provide better preference predictive capabilities than the visual conjoint analysis,
although the results from the experiential and real mug conjoint analyses were
statistically similar.

Journal of Mechanical Design
8
Maccioni et al. investigated preferences for sustainable products using a
combination of stated preferences and biological measurements [13]. The authors
recruited 43 participants to evaluate 20 baseline products and 20 eco-friendly products.
Participants wore eye-tracking equipment and a device that measures galvanic skin
response while evaluating products. The authors found that participants perceived eco-
friendly products as more innovative while they perceived the baseline products as
more functional and reliable. No significant results were found from biological
measurements.
2.2 Customer Preference Modeling in Marketing using Online Reviews
This section presents some relevant papers from marketing research that focus
on customer preference modeling using online reviews.
Chevalier and Mayzlin studied the impact of online reviews on sales using data
from Amazon and Barnes and Nobles [14]. For a sample of books, the authors compared
differences in the number of reviews and their ratings over three time points from both
websites and determined their relationship with relative sales rank. Using a linear
model, the authors found that positive reviews on one site correspond to higher sales
relative to the other site. Moreover, they found that the decrease in sales from a
negative review is greater than the increase in sales from a positive review.
Chen et al. disaggregated the impacts of online reviews and recommendations
on online sales rank [15]. The authors used digital cameras as a case-study and collected
information on number of reviews, ratings, recommended cameras in terms of purchase
percentage, and sales rank. Using a linear model, the authors found that a negative

Journal of Mechanical Design
9
review had a much greater impact on sales than a positive one. Moreover, they found
that positive recommendations (high purchase percentages, for example “86% of users
ultimately purchase this product.”) have a positive effect on sales while negative
recommendations (low purchase percentages) have no effect on sales.
Liu studied the impact of Yahoo movie reviews on Box Office revenues [16]. The
author found that reviews are most active during the prerelease of a movie and more
critical after the release. Moreover, using a linear model Liu found that the volume of
reviews around the time of release correlates with Box office revenues and not the
valence of the reviews. Dhar and Chang built on this by studying the impact of blog
posts and social networking sites on music sales [17]. The authors collected the volume
of blog posts for an album, the number of friends an artist has on Myspace (a social
media platform), and the number and ratings of online album reviews. The authors used
a linear model to study the impact of the data on music sales four weeks before and
after the album release. Data for 108 albums were collected. Album sales were
computed based on sales ranks from Amazon.com. The authors found a positive
correlation between the volume of blog posts with future album sales.
A limitation of the above approaches is that they do not study how specific
product features may be driving online sales. Our work utilizes approaches from design
and marketing to test PAS design features and provide actionable insights for designers
on driving purchasing decisions for sustainable products. An overview of our previous
work is included below to provide context on PAS design features.

Journal of Mechanical Design
10
2.3 Extracting and Testing Features Perceived as Sustainable from Online Reviews
We briefly summarize two previous papers here, as this paper builds off them.
The first paper developed a semi-automated approach to extract features perceived-as-
sustainable (PAS) from online reviews using crowdsourced annotations of online reviews
and a natural language processing algorithm [6]. As a case-study, we used French
presses and collected 1474 reviews to extract PAS features from. We recruited 900
annotators from Amazon Mechanical Turk (MTurk) to highlight phrases in reviews they
perceived as sustainable. Annotators were trained and assigned to one of three
sustainability pillars: social, environmental, and economic. Using a logistic classifier
model and for each sustainability pillar, we then extracted salient PAS features with
positive and negative sentiment based on the beta parameters of the model. Table 1
shows the positive salient features extracted. A subset of these features is selected for
this paper (see section 4.2.1).
Table 1: Positive features of French presses perceived as sustainable [6] Social Aspects Environmental Aspects Economic Aspects Easy to use Well made Easy to clean Love it Easy to use Great quality Nice gift Strong glass Want more than one Good for my family Easy to clean Reasonable price Perfect for two Solid design Works great Use with my spouse Will last Worth the price Take to work Stainless steel Good customer service Easy to clean No plastic Great value High quality Metal frame Best price Works great Sturdy Hard to beat
The features in Table 1 include a combination of visual and descriptive, and
tangible and intangible features. Notably, energy and water consumption were not
identified as salient environmental PAS features although they are important

Journal of Mechanical Design
11
engineered sustainability requirements for French presses. To investigate this further
we conducted a life-cycle analysis and found the use phase (where energy and water
consumption contribute) had one of the largest environmental impacts (Fig. 2). This gap
between engineered and PAS features highlights the importance for designers to
consider both in sustainable design.
Figure 2: Life Cycle Analysis of French Press
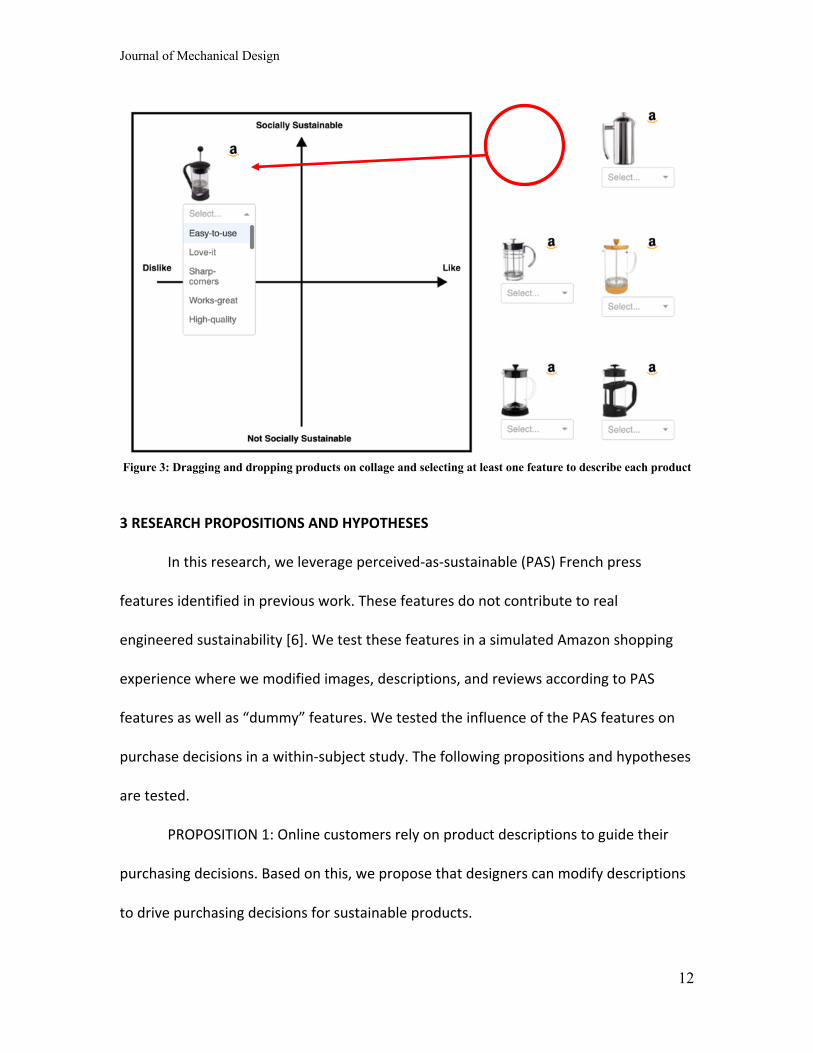
The second paper tested the extracted PAS features to determine if users
would identify them as sustainable and how the features might relate to users liking a
product [7]. We designed a novel collage approach where participants dragged and
dropped products on a set of two axes, sustainability and likeability, and selected
features from a dropdown menu. Figure 3 shows an example of a product being placed
on the collage with features to select from. The placement of products and features on
the collage validated that participants identified PAS features as sustainable and that
the collage is an effective tool for testing customer perceptions.
Journal of Mechanical Design
12
Figure 3: Dragging and dropping products on collage and selecting at least one feature to describe each product
3 RESEARCH PROPOSITIONS AND HYPOTHESES
In this research, we leverage perceived-as-sustainable (PAS) French press
features identified in previous work. These features do not contribute to real
engineered sustainability [6]. We test these features in a simulated Amazon shopping
experience where we modified images, descriptions, and reviews according to PAS
features as well as “dummy” features. We tested the influence of the PAS features on
purchase decisions in a within-subject study. The following propositions and hypotheses
are tested.
PROPOSITION 1: Online customers rely on product descriptions to guide their
purchasing decisions. Based on this, we propose that designers can modify descriptions
to drive purchasing decisions for sustainable products.

Journal of Mechanical Design
13
Hypothesis 1: Participants are more likely to opt to purchase a product when the
description is combined with features extracted from online reviews that are perceived-
as-sustainable versus dummy features.
PROPOSITION 2: Online customers rely on product descriptions to learn about
products. Based on this, we propose that designers can modify product descriptions so
that customers resonate more with sustainable products.
Hypothesis 2a: Participants will rate a product as more desirable when the
description is combined with perceived-as-sustainable features extracted versus dummy
features.
Hypothesis 2b: Participants will rate a product as more sustainable when the
description is combined with perceived-as-sustainable features versus dummy features.
4 METHOD
To test the hypotheses, we designed and conducted a simulated Amazon
shopping experience for 200 Amazon Mechanical Turk workers (referred to as
participants, see section 4.4 for more information). Participants browsed between
product options based on fractional factorial design and selected to “purchase” a
product as if they were making real purchase decisions. Participants also completed a
post-experiment-survey, in which they rated the products based on desirability and
sustainability. In the following sections we provide an overview of the experiment
design and the products and features used in the shopping simulation. The experiment
contained base and dummy features that we created for this experiment, and PAS
features extracted from a previous paper [6]. Then we discuss how we tested the

Journal of Mechanical Design
14
products and features in a simulated Amazon shopping experience. Finally, we provide
an overview of the post-survey and the participants in the experiment.
4.1 Experiment Design Overview
The experiment compared how participants made purchasing decisions when
given products with dummy features in a control condition versus products with PAS
features in a test condition (see Fig. 4). The stimuli included base products to create a
reference point between both conditions. We used a within-subject experiment design
to assess how PAS features can influence purchasing decisions.
Control Condition Test Condition
Figure 4: Within-subject experiment design
The experiment was conducted via a Qualtrics survey with instructions
about the activity, a test to make sure participants understood the task, and links to the
shopping simulations. The test questions asked participants to recall from the
instructions how many product options were included in each shopping simulation, the
type of product they were shopping for, and the number of shopping simulations they
were completing.
After passing the test, participants received links that led them to the control
and test condition shopping simulations. Participants always completed the control

Journal of Mechanical Design
15
condition first to limit the chance of social desirability bias influencing participants’
choices in the following condition. The goal was to provide the least advantage for PAS
features to rigorously test their ability to drive purchase decisions in the test conditions.
Each shopping simulation condition displayed four products to browse from. In the
control condition two base products and two products with dummy features were
displayed. In the test condition the same two base products, and two products with PAS
features were displayed. Participants had to spend a minimum of five minutes on each
simulation before they could proceed to the next one. To incentivize participants to
evaluate products carefully, we used incentive alignment as part of their reward (see
section 4.4).
Following the completion of the shopping simulation, participants received a
password to a Qualtrics post-survey. Participants entered which product they selected
for purchase and rated all products on a 5-point Likert scale based on their desirability
and based on their sustainability. As a proxy for desirability, the survey asked
participants to rate their willingness to purchase a product. Participants also selected
from a list the main driving factor in their shopping decisions online. Lastly, participants
entered demographic information before the completion of the survey.
4.2 Products
The experiment focused on French press coffee brewers, building off our findings
from previous papers [6,7], because they are popularly reviewed products, sold with
various aesthetic and practical design features. Additionally, the sustainability concerns
associated with French presses present an opportunity to study consumers’ perceptions

Journal of Mechanical Design
16
of sustainability, such as how quickly a glass exterior might break or how much energy
can be saved with a heat-insulated press. The experiment showed four presses that had
a variety of features in each condition to simulate a realistic shopping experience. In this
section we describe the features, images, descriptions, and reviews that we used in the
paper.
4.2.1 Product Features
The presses had three feature categories: base features, dummy features, and
PAS features (see Table 2). Each category had two levels that could be displayed. Note
that French presses had dummy features in the control condition, and PAS features in
the test condition, never both.
Table 2: Breakdown of product features Feature Category Feature Name Level 1 Level 2 Base Handle shape Circular Rectangular Base Spout Filter Easy-pour Base Lid Button Lift Dummy Hourglass timer Present Not present Dummy Ventilated lid Present Not present PAS Material Stainless Steel Plastic PAS Glass Strong glass Not present PAS Clean Easy to clean Not present PAS Quality High quality Not present PAS Gift Perfect gift Not present
All products shown included all three base features at one level, consisting of
core functional features of a French press, including a handle, spout, and lid. For the
handle, the varieties included either a circular or rectangular shape; for the spout, the
varieties included filtered or easy-pour; and for the lid these included a button or lift
mechanism. The purpose of these features was to provide a baseline to compare

Journal of Mechanical Design
17
purchasing decisions between the two experimental conditions. The base features pilot
tested as neutral and did not impact customer sentiment significantly, see section 4.3.2
for details.
Dummy features are intended to appeal to customers for their functionality but
are not strongly related to either engineered or perceived sustainability. These included
a built-in handle hourglass timer for proper brewing time, and a ventilated lid to help
steam escape. The dummy features were included in the control conditions only. The
goal of the dummy features was to challenge and assess the popularity of products with
PAS features. Pilot-testing aided in selecting dummy features that were on par with the
PAS features in terms of desirability (see section 4.3.2).
A previous paper developed a method to extract PAS features from online
reviews, demonstrating the method using French presses and identifying a gap between
engineered and PAS features (Table 1) [6]. We selected a subset of PAS features for this
experiment, shown in Table 2. We selected this subset because it includes both visual
and descriptive features and is representative of perceptions from the three
sustainability pillars: social, environmental, and economic.
For the material feature, products were made of plastic or stainless steel (with
steel being a PAS feature). For the remaining PAS features, the products either had or
did not have them, e.g.: strong glass, easy to clean, high quality, and perfect gift—all
PAS. The PAS features were included in only the test condition.

Journal of Mechanical Design
18
4.2.2 Fractional Factorial Experiment Design
With the available features in Table 2, we used a fractional factorial experiment
design to account for different combinations and created twelve different products—
each participant saw eight of these products. The features per product are shown in
Table 3. For each product we created images, descriptions, and reviews to include in the
Amazon shopping simulation as described below.
Table 3: Features per product
4.2.2.1 Product Images
We rendered images of the 12 products for this study using the computer-aided
design software Fusion 360 (Fig. 5). Products 1 and 2 include base features only and are
shown in every experiment condition. Products 3 and 4 have dummy features and are
only shown in the control condition. Products 5 to 12 have PAS features; we randomly
created five random pairs and assigned participants to a test condition with one of five
pairs. The other two products in the test condition were the base products.
Each French press was designed to closely resemble the others, as well as those
on the market. All products were shown on a white background from the same angle.
Additionally, each product had a close-up image of the handle and top.
Circular Rectangular Filter Easy-pour Button Lift1 C&T2 C&T3 C4 C5 T6 T7 T8 T9 T10 T11 T12 T
Perfectgift
Hourglass timer
Ventilated lid
French Press # Condition
Base Features Perceieved Sustainable Features Extra FeaturesLidSpoutHandle Stainless
steelStrong glass
Easy to clean
High quality construction

Journal of Mechanical Design
19
Pilot-testing ensured that the rendered product images were equally
aesthetically pleasing (see section 4.3.2), aiming to minimize the effect of other
potential variables on purchasing decisions. It is important to note that some features in
Table 2 cannot be shown visually, for example “easy to clean”. These features are
included in descriptions on the Amazon simulated product page.
Figure 5: Product image renderings
4.2.2.2 Product Descriptions
Each product had a corresponding description that outlined the product’s
features in a bulleted list. Descriptions were written with the goals of brevity,
maintaining Amazon’s organizational structure, and emphasizing the feature. Each
description ranged between 25 and 30 words, and the feature was described at the
beginning of each list item (see Fig. 8 in section 4.3.1 for an example).

Journal of Mechanical Design
20
Products were also titled using their features, a technique that is commonly used
on Amazon. For example, Product 1 was named “French press Coffee Maker with button
for lid removal, filtered spout, and circular grip handle.” These descriptions made the
product features noticeable. Pilot-testing ensured that the descriptions were equally
readable and understandable (see section 4.3.2).
4.2.2.3 Product Reviews
Each product was shown with five unique reviews: three 5-star reviews and two
3-star reviews. All products were rated as 4.2 stars overall. Having products with equally
positive reviews mitigated the influence of reviews on purchasing decisions.
Additionally, the reviews did not mention any of the features in the experiment and did
not mention sustainability. We created the review text as follows. First, we selected
initial candidate reviews from Amazon listings of French presses and then removed
specific details so that the reviews were applicable to any French press. Each review had
only two to three sentences total. Pilot-testing ensured that the five reviews for each
product were equally positive (see Section 4.3.2).
4.3 Amazon Shopping Experience
In this section we present the shopping experience flow as well as measures
taken to normalize web content between products.
4.3.1 Simulation Flow
Participants were able to freely click and browse between three types of pages:
the Product Search Page, the Product Pages, and the Checkout Page (Fig. 6). The

Journal of Mechanical Design
21
experience was a controlled simulation without distracting content, such as
advertisements and hyperlinks to other web pages on Amazon.com.
Figure 6: Simulated Amazon flow
The Product Search Page showcased four French presses on the participant’s
screen (Fig. 7). This page was intended to replicate the results of a consumer searching
“French presses” on Amazon.com. The products shown on this page depended on which
experiment condition the participants were taking (see section 4.2).

Journal of Mechanical Design
22
Figure 7: Product search page
From the Product Search Page, participants can click on the product’s image,
price, title, or reviews to access the Product Information Page (Fig. 8). This page
provides details on the product’s features, five reviews from past consumers, and three
images of the French press product. The participants can zoom in on the image for a
closer look at the French press product. All links to external pages were deactivated to
prevent the participant from navigating away from our survey. From the Product Page,
participants can click on the orange “Buy Now” button to access the Checkout Page or
go back to the Product Search Page to read about another product.

Journal of Mechanical Design
23
Figure 8: Product information page
The Checkout Page was intended to model the experience of officially purchasing
a product on Amazon.com (Fig. 9). All data entry queries were removed so that the user

Journal of Mechanical Design
24
did not enter any personal information to proceed with buying the French press of their
choice. Clicking the “Place your order” button ended the shopping experience.
Figure 9: Checkout page
4.3.2 Normalizing Web Content
We took careful steps to normalize web content between products and control
the influence of external variables on purchasing behavior. External variables include
brand, price, number of reviews, review ratings, review content, description content,
number of images, and image quality.
Prior to launching the full shopping simulation, we conducted a pilot study to
measure the equality of images, descriptions, and reviews between products used in the
study. The goal was to control variables so that only product features had a significant
difference between products. The pilot study asked participants to indicate their level of
agreement on a range of statements using a 5-point Likert scale. For the images, the
pilot study asked participants to rate how aesthetically pleasing the images are and their

Journal of Mechanical Design
25
level of quality. For the descriptions, the pilot study asked participants to rate how easy
they are to read and understand. For the reviews, the pilot study asked participants to
rate their clarity and sentiment. Participants rated images, descriptions, and reviews
separately. We modified product information and ran several rounds of the pilot study
to achieve no statistically significant differences in ratings between products across the
board.
Additional measures we took include controlling for branding and prices. To
prevent branding or previous knowledge of a brand from impacting purchasing
decisions, we removed brand names from the product titles, descriptions, and images.
Product prices had a $2 range between $27.98 and $29.99. We decided on this range so
that the different prices can portray a realistic shopping experience, but at the same
time have a negligible effect on purchase behavior.
4.4 Participants
We recruited a total of 200 participants from MTurk to complete the shopping
experience which took 25 minutes on average; participants were compensated $6 each
for their time. To create an incentive alignment, we also entered participants into a
lottery for a product of similar or less value to the product they chose for purchase in
the experiment. We opted to recruit from MTurk instead of in-person participants to
accommodate for COVID-19 restrictions and to quickly collect many responses.
Moreover, MTurk demographics are likely to match online users and therefore online
shopper demographics more closely [18].

Journal of Mechanical Design
26
To increase the quality of data collected, we screened for participants on MTurk
using features on the MTurk platform as well as screening questions in Qualtrics. We
required that participants should have a 97% prior approval rating and are based in the
United States; literature shows that respondents in the United States tend to deliver
better quality responses [19].
Out of the 200 participants that completed their task, we approved 162 based on
two requirements: (1) completing the activity in time (t) that is within 1 standard
deviation(s) of the average time to complete the activity (µ) or longer (i.e., t⩾µ-s) and
(2) correctly answering the check question, “What is the capital city of the United
States?” which we asked in the post-survey. We did not analyze results if they did not
meet one or both criteria. We used similar approval criteria in previous papers [6,7].
5 ANALYSIS AND RESULTS
This section is split into two parts: first, we present participant data and
demographics, and second, we present the shopping experience results that test the
hypotheses from section 3.
5.1 Demographics
The demographics of the 162 approved participants are summarized in Fig. 10.
Our participants were mostly young, white, educated, working full-time, about 60%
male, and making about an average US income. The demographics of our participants
are like those of the Amazon Mechanical Turk respondents in our previous paper [7] and
are in-line with demographic analyses of Amazon Mechanical Turk respondents from
literature [19]. While this demographic is not representative of the general US

Journal of Mechanical Design
27
population, it is closer to typical online users and is ideal for studying online purchasing
decisions [7].
Figure 11 shows the most important factor participants reported for making
purchases on Amazon. Reviews, brand, and price were the highest three factors,
followed by product description. In our shopping simulation, we normalized all factors
besides product description to isolate the influence of different product features on
purchasing decisions.
Figure 10: Participant demographics
0 0.5
No comment
18-24
25-34
35-44
45-54
Above 54
Age
0 0.5 1
No comment
Other
Native American
Asian
African American
White
Race
0 0.5 1
No comment
Female
Male
Gender
0 0.5 1
No comment< High school
High schoolSome college
AssociateBachelor's
Master'sProfessional
Doctorate
Education
0 0.5 1
No commentStudent
UnemployedHome-maker
Self-employedPart-timeFull-time
Retired
Employment
0 0.5 1
No comment
<$50K
$50K to $99K
$100K to $149K
$150K to $199K
>$200K
Income

Journal of Mechanical Design
28
Figure 11: Self-reported important factors for purchasing on Amazon by participants
5.2 Shopping Simulation
This section is split into three parts: first, we present the results on purchasing
decisions that test hypothesis 1 (products with PAS features are more likely to be
purchased than those with dummy features), second, we present the results on
desirability ratings that test hypothesis 2a (products with PAS features are rated as
more desirable than those with dummy features), and third, we present the results on
sustainability ratings that test hypothesis 2b (products with PAS features are rated as
more sustainable than those with dummy features).
5.2.1 Products Selected for Purchase
Figure 12 shows the raw counts of products selected for purchase in the control
and test conditions. More participants selected to purchase products with PAS features
in the test condition than products with dummy features in the control condition,
suggesting that products with PAS features can drive purchasing decisions.
0
0.1
0.2
0.3
0.4
0.5
Reviews Price Brand Productdescription
ShippingSpeed
Return Policy Aesthetics Other
Prop
ortio
n

Journal of Mechanical Design
29
Figure 12: Number of purchases for base, dummy, and PAS products
To determine the influence of the experiment conditions relative to the base
products, Fig. 13 shows the fraction of products selected for purchase with PAS features
in the test condition versus with dummy features in the control condition.
Approximately 80% of products selected in the test condition were products with PAS
features while 71% of products selected in the control condition where products with
dummy features (as opposed to only having base features), supporting hypothesis 1.
Figure 13: Fraction of products selected for purchase in the control condition versus the test condition
40
27
98
111
0
20
40
60
80
100
120
Control Test
Num
ber o
f "pu
rcha
ses"
0
0.2
0.4
0.6
0.8
1
Dummy Features(Control)
Sustainable Features(Test)
Frac
tion
of "P
urch
ases
"
Base products
Dummy features PAS features
Base products

Journal of Mechanical Design
30
We tested if the difference in the fraction of products selected for purchase
between the control and test conditions was statistically significant using a t-test, shown
in Table 4. The difference was significant at the 0.05 level, supporting hypothesis 1. The
findings therefore indicate that participants are more likely to select to purchase a
product when the description is combined with PAS features rather than dummy
features.
Table 4: Two sample t-test between control and test conditions for fraction of products selected to purchase *: significant at p = 0.05, **: significant at p = 0.01, ***: significant at p = 0.001
Dummy Features (Control)
Sustainable Features (Test)
Mean fraction of purchases 0.71 0.80 Variance 0.21 0.16 Observations 162 P(T<=t) one-tail 0.026*
t Critical one-tail 1.66
5.2.2 Desirability Ratings
As a proxy for desirability, the survey asked participants to rate their willingness
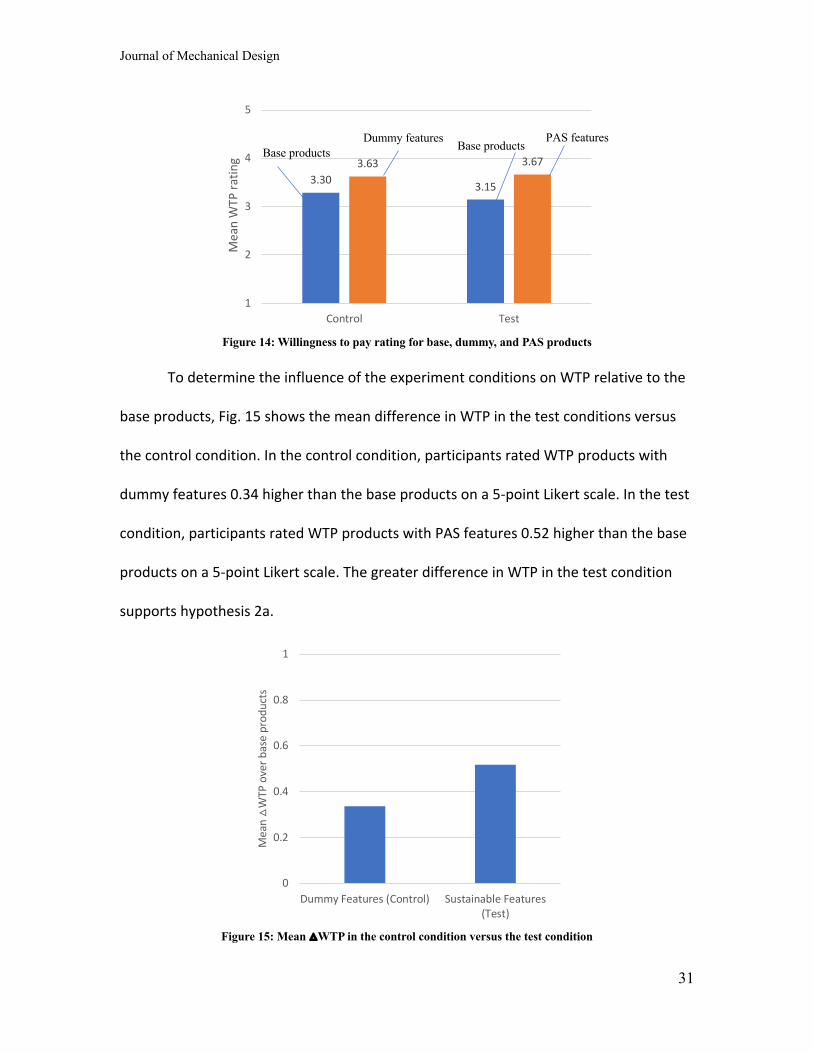
to purchase (WTP) products on a 5-point Likert scale. Figure 14 shows the mean
willingness to pay ratings for products in the control and test conditions. The WTP for
products with PAS features in the test condition is slightly higher than the WTP for
products with dummy features in the control condition.
Journal of Mechanical Design
31
Figure 14: Willingness to pay rating for base, dummy, and PAS products
To determine the influence of the experiment conditions on WTP relative to the
base products, Fig. 15 shows the mean difference in WTP in the test conditions versus
the control condition. In the control condition, participants rated WTP products with
dummy features 0.34 higher than the base products on a 5-point Likert scale. In the test
condition, participants rated WTP products with PAS features 0.52 higher than the base
products on a 5-point Likert scale. The greater difference in WTP in the test condition
supports hypothesis 2a.
Figure 15: Mean △WTP in the control condition versus the test condition
3.30 3.15
3.63 3.67
1
2
3
4
5
Control Test
Mea
n W
TP ra
ting
0
0.2
0.4
0.6
0.8
1
Dummy Features (Control) Sustainable Features(Test)
Mea
n △
WTP
ove
r bas
e pr
oduc
ts
Base products Dummy features PAS features
Base products

Journal of Mechanical Design
32
The t-test results for mean difference in WTP are included in Table 5, showing
that the difference between conditions is statistically significant at the 0.05 level. The
findings therefore indicate that participants rate products as more desirable when the
description is combined with PAS features versus dummy features.
Table 5: Two sample t-test between control and test conditions for mean △WTP *: significant at p = 0.05, **: significant at p = 0.01, ***: significant at p = 0.001
Dummy Features (Control) Sustainable Features (Test) Mean △WTP 0.34 0.52 Variance 1.95 2.23 Observations 324 P(T<=t) one-tail 0.039*
t Critical one-tail 1.65
5.2.3 Sustainability Ratings
The survey asked participants to rate products on their sustainability using a 5-
point Likert scale. Figure 16 shows the mean sustainability ratings for products in the
control and test conditions. On average, the sustainability rating for products with PAS
features in the test condition is higher than the sustainability rating for products with
dummy features in the control condition.
Figure 16: Sustainability rating for base, dummy, and PAS products
3.00 2.913.21
3.39
1
2
3
4
5
Control Test
Mea
n su
stai
nabi
lity
ratin
g
Base products Dummy features PAS features
Base products
Journal of Mechanical Design
33
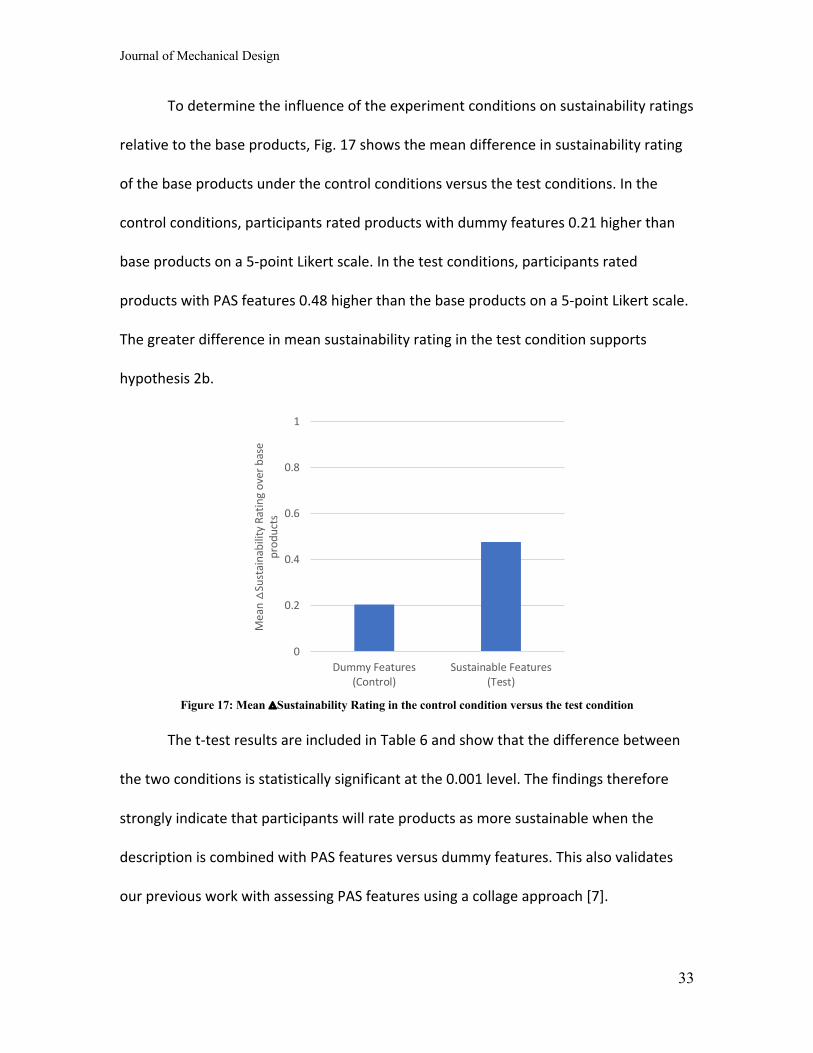
To determine the influence of the experiment conditions on sustainability ratings
relative to the base products, Fig. 17 shows the mean difference in sustainability rating
of the base products under the control conditions versus the test conditions. In the
control conditions, participants rated products with dummy features 0.21 higher than
base products on a 5-point Likert scale. In the test conditions, participants rated
products with PAS features 0.48 higher than the base products on a 5-point Likert scale.
The greater difference in mean sustainability rating in the test condition supports
hypothesis 2b.
Figure 17: Mean △Sustainability Rating in the control condition versus the test condition
The t-test results are included in Table 6 and show that the difference between
the two conditions is statistically significant at the 0.001 level. The findings therefore
strongly indicate that participants will rate products as more sustainable when the
description is combined with PAS features versus dummy features. This also validates
our previous work with assessing PAS features using a collage approach [7].
0
0.2
0.4
0.6
0.8
1
Dummy Features(Control)
Sustainable Features(Test)
Mea
n △
Sust
aina
bilit
y Ra
ting
over
bas
e pr
oduc
ts

Journal of Mechanical Design
34
Table 6: Two sample t-test between control and test conditions for mean △Sustainability Rating *: significant at p = 0.05, **: significant at p = 0.01, ***: significant at p = 0.001
Dummy Features (Control)
Sustainable Features (Test)
Mean △Sustainability Rating
0.21 0.48
Variance 0.87 1.58 Observations 324 P(T<=t) one-tail 0.001***
t Critical one-tail 1.65
6 DISCUSSION
The results provide actionable insights for designers on how to make sustainable
products more successful online. The experiment approximated purchase decisions
using a simulated shopping experience with incentive alignment and measured both
customer preferences and purchase decisions. In this section we discuss the value of
using PAS features in design as well as using simulated shopping experiences for
customer preference modeling.
First, the results showed that participants selected to purchase products with
PAS features more than they did with dummy features (Fig. 15 and Table 4). It is
important to note that PAS features may or may not contribute to engineered
sustainability [6]. We demonstrated that, despite the importance of LCAs to inform
engineered sustainability features, our proposed method to extract PAS features can
drive purchasing decisions for sustainable products.
Second, the results showed that participants are willing to pay more for products
with PAS product features compared with dummy features based on 5-point Likert scale
ratings (Fig. 15 and Table 5). The preferences that participants stated in the Likert
ratings matched with their purchase decisions in the simulated shopping experience,

Journal of Mechanical Design
35
indicating the value of using simulated shopping experiences in design to model
customer preferences. Moreover, the finding supports previous literature that
participants are willing to pay more for products they perceive as sustainable [4].
Third, the results showed that participants rated products with PAS features as
more sustainable compared with dummy features based on 5-point Likert scale ratings
(Fig. 17 and Table 6). It is important to note that none of the PAS, dummy, or base
features contribute to engineered sustainability. The finding supports our previous work
that PAS features resonate with participants as more sustainable [7], emphasizing. the
value of using PAS features to communicate product sustainability to customers.
The results in this paper demonstrate that designers should use PAS design
features in addition to engineering sustainable features to align sustainable products
with customer perceptions. In doing so, designers can create products that are both
engineered to be sustainable as well as successful in the marketplace. For example, an
LCA might indicate that choosing plastic is a more sustainable manufacturing option [6]
but adding some stainless-steel elements to a product might be worth the trade-off to
drive online sales. An LCA could determine if dropping plastic entirely in favor of metal
can actually be beneficial to the environment, due to the promotion of other “invisible”
design features, such as energy-savings or shipping.
With the knowledge that not all PAS features align with engineered sustainability
features, it is important to consider the implications for online shopping platforms like
Amazon. The responsibility of making informed purchase decisions ultimately lies on the
customer, but Amazon could use the findings in this work to facilitate and guide

Journal of Mechanical Design
36
informed purchase decisions. For example, Amazon could monitor PAS features
mentioned in online reviews using natural language processing techniques proposed
previously [6]. Moreover, Amazon could allow users to flag reviews that might be
spreading misinformation. Ideally, the findings of this work can enable both designers
and e-commerce platforms to build an informed customer base that can bridge the gap
between engineered and PAS features, and drive purchases for sustainable products.
There are important limitations to keep in mind with the findings in this paper.
First, while we carefully designed the simulated shopping experience to be as realistic as
possible, the activity did not involve real purchasing decisions. We included incentive
alignments to approximate real purchase decisions, but the results may differ in a real
shopping environment with real products. Second, the shopping simulation was a
controlled environment with variables kept constant except for the product features. In
reality, customers are exposed to varying types of images, descriptions, prices, and
reviews when shopping online. The interactions between these variables and how they
might influence purchase decisions were not studied in this work. Third, our experiment
used French press products as a case-study, building off our previous papers, but does
not study purchase decisions for different types of products. We recommend
conducting an additional study to investigate the generalizability of our findings, ideally
using real products and purchase decisions.
7 CONCLUSIONS AND FUTURE WORK
This paper shows that PAS features can help designers drive purchase decisions
for sustainable products. We created a simulated Amazon shopping experience to

Journal of Mechanical Design
37
control what is shown to participants and investigate purchase decisions. We studied
how PAS features can influence online purchase decisions compared to dummy features
in a within-subject fractional factorial experiment. We built on findings from our
previous work where we extracted salient PAS features from online product reviews of
French presses [6] and demonstrated that these features resonate with participants as
sustainable despite not contributing to engineered sustainability [7].
During each of the control and test conditions, participants selected a product to
purchase from four options: in the control condition we included two base products and
two products with dummy features, and in the test condition we included two base
products and two products with PAS features. We also asked participants to rate
products in terms of willingness to pay and sustainability. The results showed that more
participants selected to purchase products with PAS features in the test condition than
with dummy features in the control condition. Moreover, participants indicated that
they are willing to pay more for products with PAS features and rated them as more
sustainable too.
The findings indicate that designers should include both engineered sustainable
features (from tools like an LCA) and PAS features (from our proposed method) to drive
purchasing decisions for sustainable products. Moreover, the findings demonstrate the
value of conducting online shopping simulations in design research. Next steps for this
work include testing the findings in a real purchasing environment as well as testing how
the findings generalize with different products.

Journal of Mechanical Design
38
ACKNOWLEDGMENT
We would like to thank Qatar National Research Fund (QNRF) for supporting this
work. This work was funded by QNRF under the Qatar Research Leadership Program
(QRLP).

Journal of Mechanical Design
39
REFERENCES [1] Johnstone, M.-L., and Tan, L. P., 2015, “Exploring the Gap Between Consumers’
Green Rhetoric and Purchasing Behaviour,” J Bus Ethics, 132(2), pp. 311–328. [2] She, J., and MacDonald, E. F., 2017, “Exploring the Effects of a Product’s
Sustainability Triggers on Pro-Environmental Decision-Making,” Journal of Mechanical Design, 140(1), p. 011102.
[3] MacDonald, E. F., Gonzalez, R., and Papalambros, P. Y., 2009, “Preference
Inconsistency in Multidisciplinary Design Decision Making,” Journal of Mechanical Design, 131(3), p. 031009.
[4] McCaskill, A., 2015, “Consumer-Goods’ Brands That Demonstrate Commitment To
Sustainability Outperform Those That Don’t,” Nielsen [Online]. Available: https://www.nielsen.com/us/en/press-room/2015/consumer-goods-brands-that-demonstrate-commitment-to-sustainability-outperform.html.
[5] MacDonald, E. F., Gonzalez, R., and Papalambros, P., 2009, “The Construction of
Preferences for Crux and Sentinel Product Attributes,” Journal of Engineering Design, 20(6), pp. 609–626.
[6] El Dehaibi, N., Goodman, N. D., and MacDonald, E. F., 2019, “Extracting Customer
Perceptions of Product Sustainability From Online Reviews,” Journal of Mechanical Design, 141(12), p. 121103.
[7] El-Dehaibi, N., Liao, T., and MacDonald, E. F., 2021, “Validating Perceived
Sustainable Design Features Using a Novel Collage Approach,” ASME 2021 International Design Engineering Technical Conferences & Computers and Information in Engineering Conference/Design Automation Conference, Online, August 17 – 20.
[8] Green, P. E., and Rao, V. R., 1971, “Conjoint Measurement for Quantifying
Judgmental Data,” Journal of Marketing Research, 8(3), p. 355. [9] Suryadi, D., and Kim, H. M., 2019, “A Data-Driven Methodology to Construct
Customer Choice Sets Using Online Data and Customer Reviews,” Journal of Mechanical Design, 141(11), p. 111103.
[10] Goucher-Lambert, K., Moss, J., and Cagan, J., 2017, “Inside the Mind: Using
Neuroimaging to Understand Moral Product Preference Judgments Involving Sustainability,” Journal of Mechanical Design, 139(4), p. 041103.

Journal of Mechanical Design
40
[11] Goucher-Lambert, K., and Cagan, J., 2015, “The Impact of Sustainability on Consumer Preference Judgments of Product Attributes,” Journal of Mechanical Design, 137(8), p. 081401.
[12] Tovares, N., Boatwright, P., and Cagan, J., 2014, “Experiential Conjoint Analysis: An Experience-Based Method for Eliciting, Capturing, and Modeling Consumer Preference,” Journal of Mechanical Design, 136(10), p. 101404.
[13] Maccioni, L., Borgianni, Y., and Basso, D., 2019, “Value Perception of Green
Products: An Exploratory Study Combining Conscious Answers and Unconscious Behavioral Aspects,” Sustainability, 11(5), p. 1226.
[14] Chevalier, J. A., and Mayzlin, D., 2006, “The Effect of Word of Mouth on Sales:
Online Book Reviews,” Journal of Marketing Research, p. 10. [15] CHEN, Y., WANG, Q., and XIE, J., 2011, “Online Social Interactions: A Natural
Experiment on Word of Mouth Versus Observational Learning,” Journal of Marketing Research, 48(2), pp. 238–254.
[16] “Word of Mouth for Movies: Its Dynamics and Impact on Box Office Revenue,” p.
17. [17] Dhar, V., and Chang, E. A., 2009, “Does Chatter Matter? The Impact of User-
Generated Content on Music Sales,” Journal of Interactive Marketing, 23(4), pp. 300–307.
[18] Goodman, J. K., and Paolacci, G., 2017, “Crowdsourcing Consumer Research,”
Journal of Consumer Research, 44(1), pp. 196–210. [19] Paolacci, G., and Chandler, J., 2014, “Inside the Turk: Understanding Mechanical
Turk as a Participant Pool,” Current Directions in Psychological Science, 23(3), pp. 184–188.

Journal of Mechanical Design
41
Figure Captions List Figure 1: Current paper builds off work from previous papers .......................................... 5 Figure 2: Life Cycle Analysis of French Press ................................................................. 11
Figure 3: Dragging and dropping products on collage and selecting at least one feature to describe each product ........................................................................................................ 12 Figure 4: Within-subject experiment design ..................................................................... 14
Figure 5: Product image renderings .................................................................................. 19
Figure 6: Simulated Amazon flow .................................................................................... 21
Figure 7: Product search page ........................................................................................... 22
Figure 8: Product information page .................................................................................. 23
Figure 9: Checkout page ................................................................................................... 24
Figure 10: Participant demographics ................................................................................ 27
Figure 11: Self-reported important factors for purchasing on Amazon by participants ... 28
Figure 12: Number of purchases for base, dummy, and PAS products ............................ 29
Figure 13: Fraction of products selected for purchase in the control condition versus the test condition ..................................................................................................................... 29 Figure 14: Willingness to pay rating for base, dummy, and PAS products ...................... 31
Figure 15: Mean △WTP in the control condition versus the test condition ..................... 31
Figure 16: Sustainability rating for base, dummy, and PAS products .............................. 32
Figure 17: Mean △Sustainability Rating in the control condition versus the test condition........................................................................................................................................... 33

Journal of Mechanical Design
42
Table Captions List Table 1: Positive features of French presses perceived as sustainable [6] ....................... 10
Table 2: Breakdown of product features ........................................................................... 16
Table 3: Features per product ........................................................................................... 18
Table 4: Two sample t-test between control and test conditions for fraction of products selected to purchase .......................................................................................................... 30 Table 5: Two sample t-test between control and test conditions for mean △WTP .......... 32
Table 6: Two sample t-test between control and test conditions for mean △Sustainability Rating ................................................................................................................................ 34