Embed Size (px)
Citation preview
Supplementary Figure 1. (a) TEM image of Ni@C, displaying well-dispersed Ni in the
graphitized carbon nanospheres after carbonization. (b) Size distribution image of Ni@C
nanospheres. The size of Ni@C is around 10 nm.
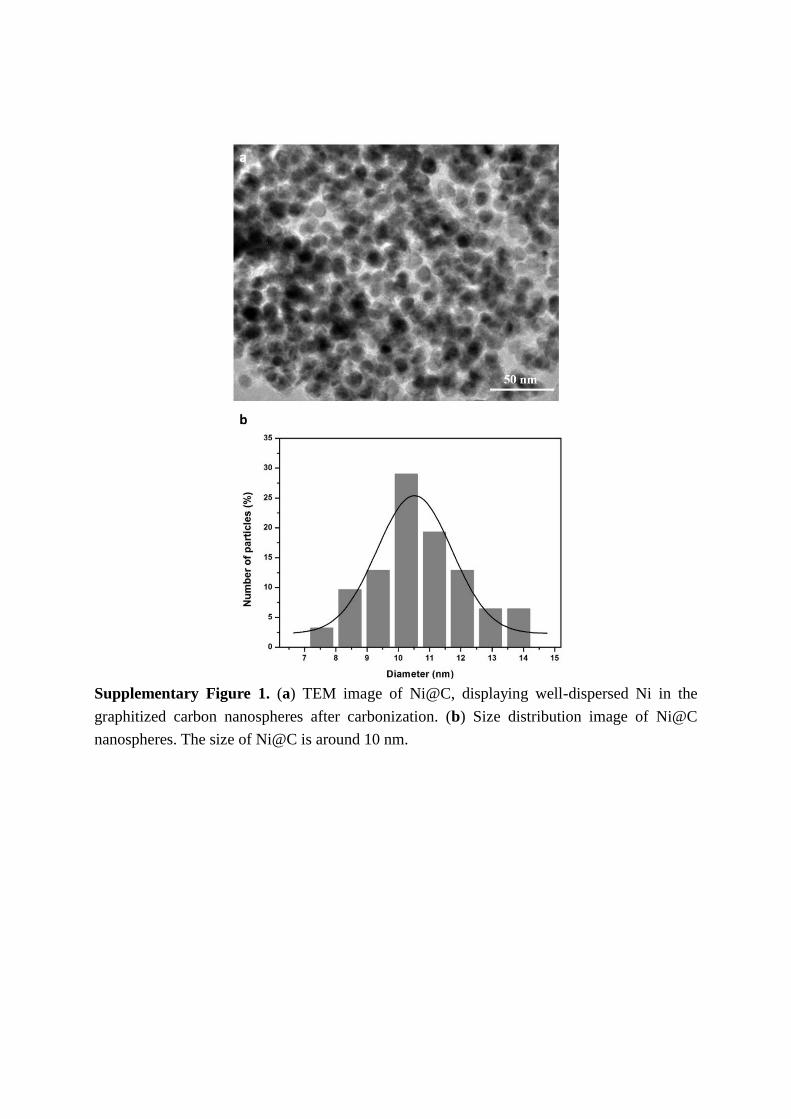
Supplementary Figure 2. A typical series of "zoom-in" STEM images of different regions of
A-Ni-C. (a, c) BF STEM images and (b, d) corresponding HAADF STEM images of the
same area prove abundance of atomically dispersed Ni species.
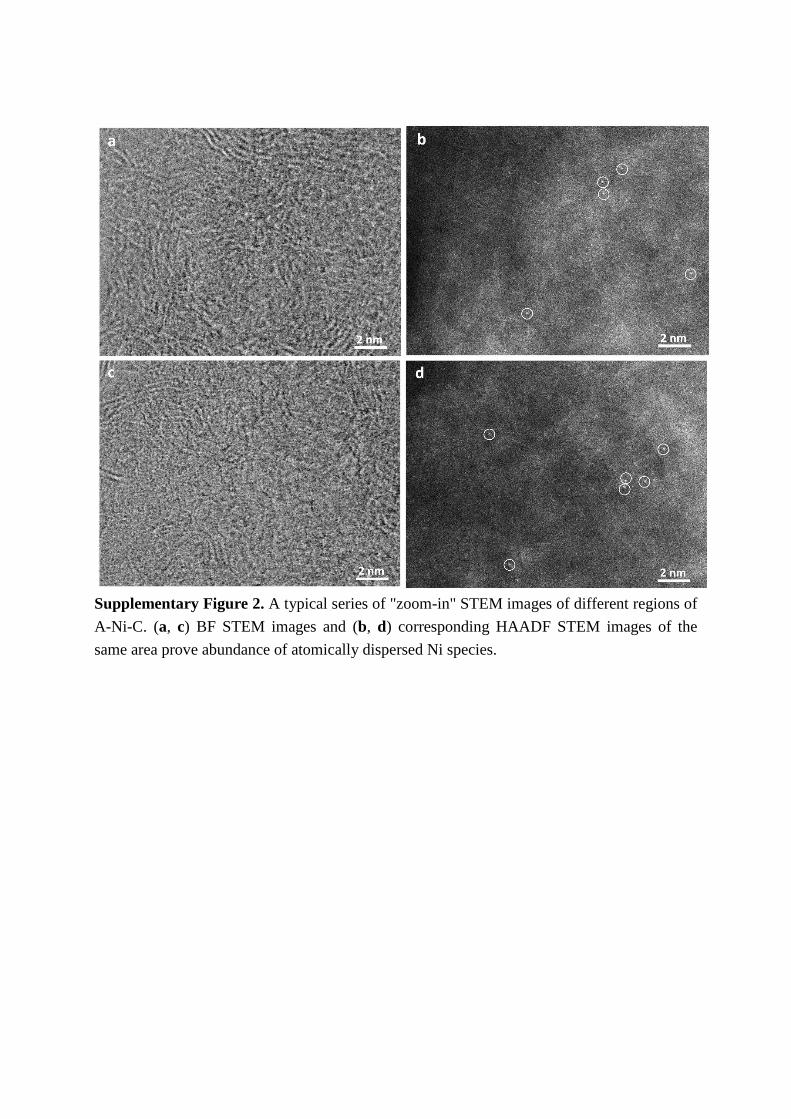
Supplementary Figure 3. HAADF STEM images of controlled samples of A-Ni-C (without
Nafion as binder), showing the existence of atomically dispersed species.
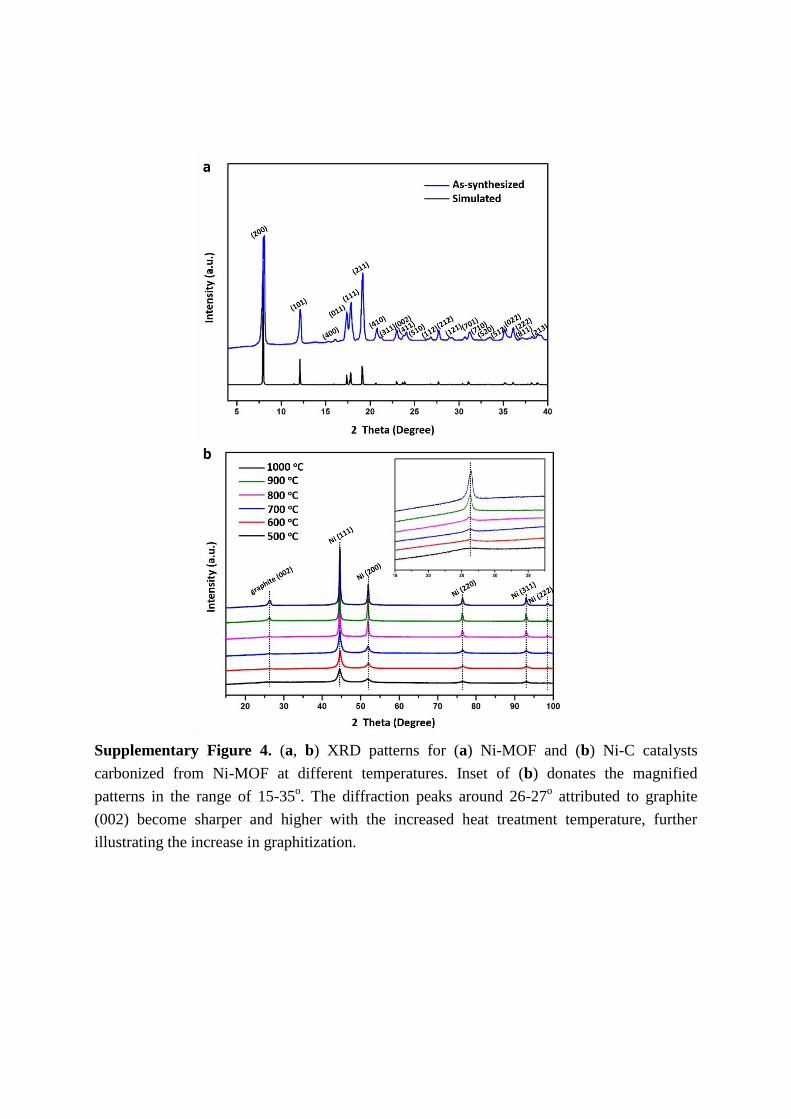
Supplementary Figure 4. (a, b) XRD patterns for (a) Ni-MOF and (b) Ni-C catalysts
carbonized from Ni-MOF at different temperatures. Inset of (b) donates the magnified
patterns in the range of 15-35o. The diffraction peaks around 26-27
o attributed to graphite
(002) become sharper and higher with the increased heat treatment temperature, further
illustrating the increase in graphitization.
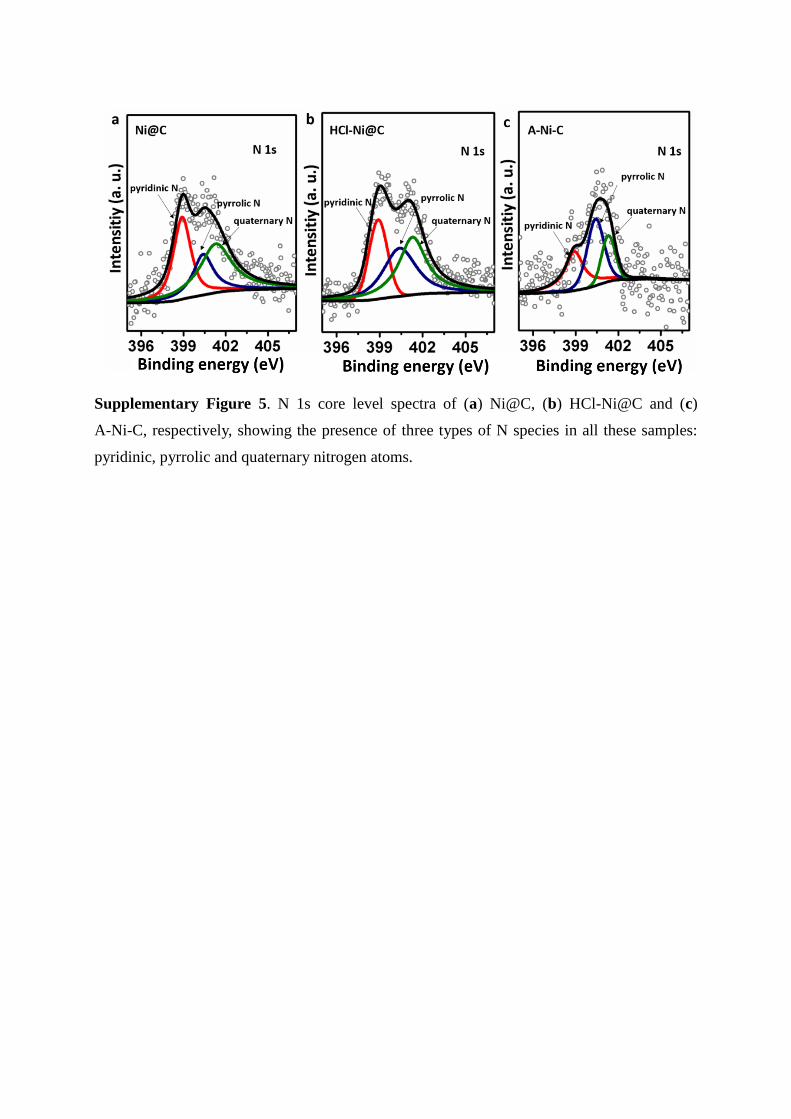
Supplementary Figure 5. N 1s core level spectra of (a) Ni@C, (b) HCl-Ni@C and (c)
A-Ni-C, respectively, showing the presence of three types of N species in all these samples:
pyridinic, pyrrolic and quaternary nitrogen atoms.
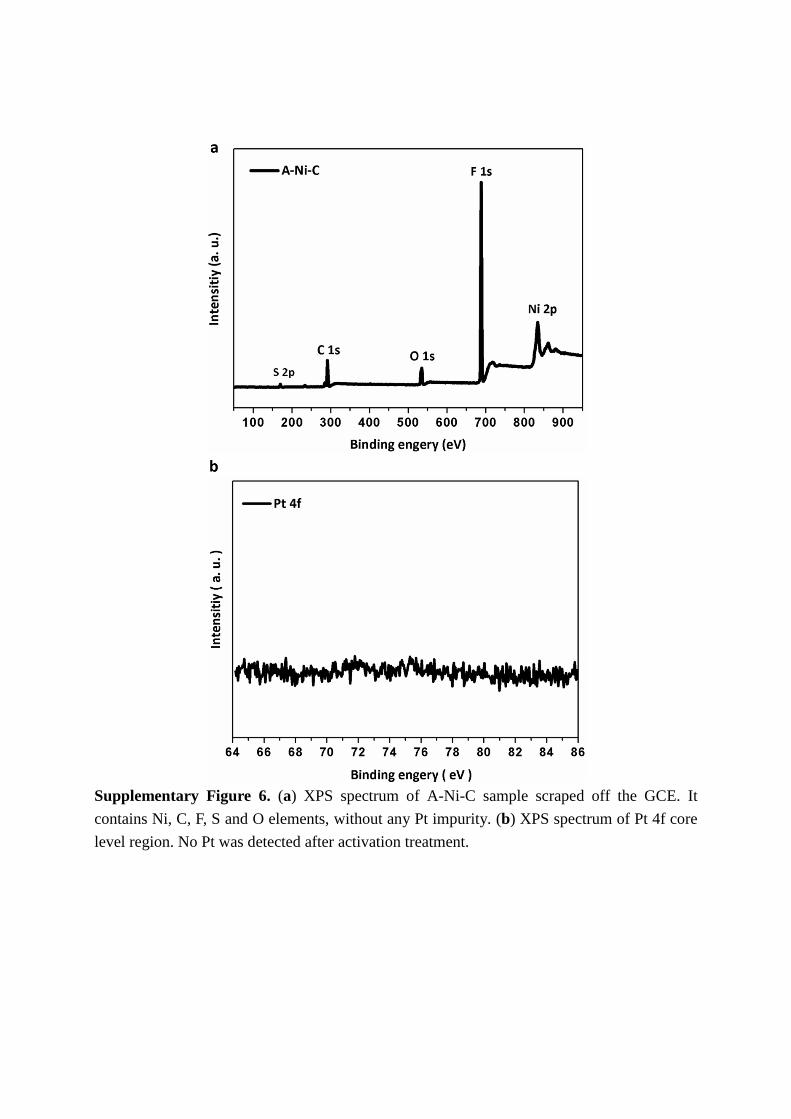
Supplementary Figure 6. (a) XPS spectrum of A-Ni-C sample scraped off the GCE. It
contains Ni, C, F, S and O elements, without any Pt impurity. (b) XPS spectrum of Pt 4f core
level region. No Pt was detected after activation treatment.
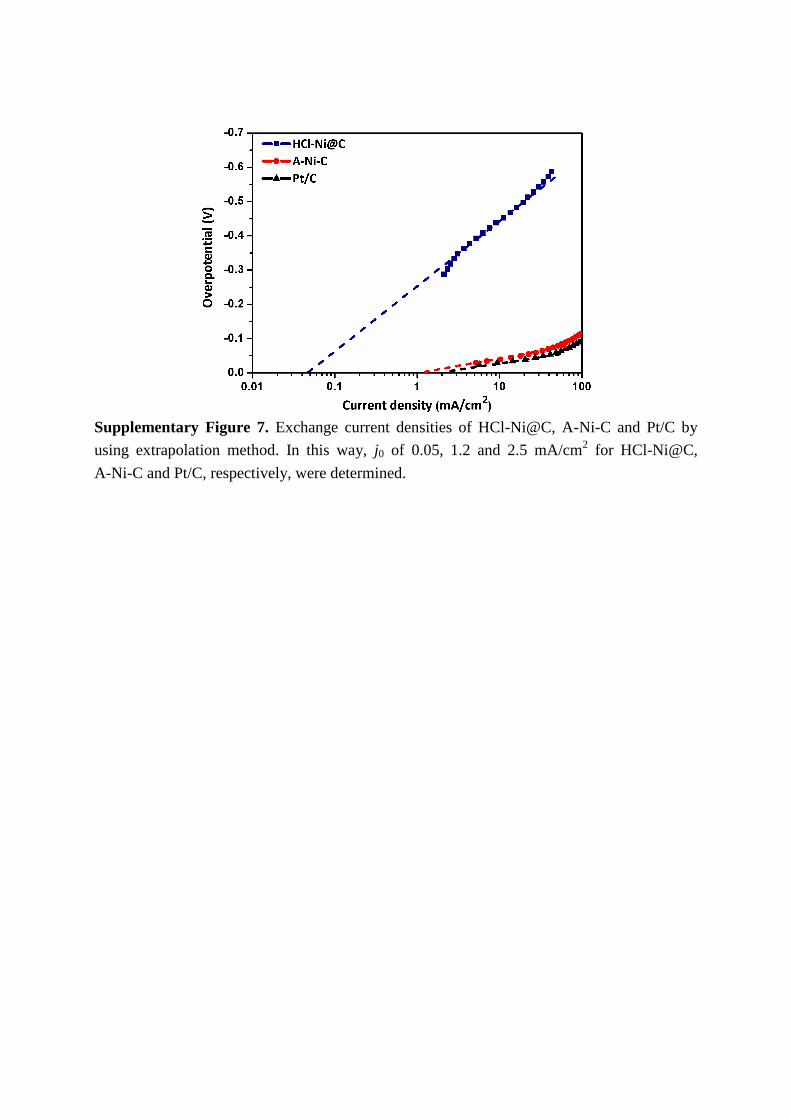
Supplementary Figure 7. Exchange current densities of HCl-Ni@C, A-Ni-C and Pt/C by
using extrapolation method. In this way, j0 of 0.05, 1.2 and 2.5 mA/cm2 for HCl-Ni@C,
A-Ni-C and Pt/C, respectively, were determined.
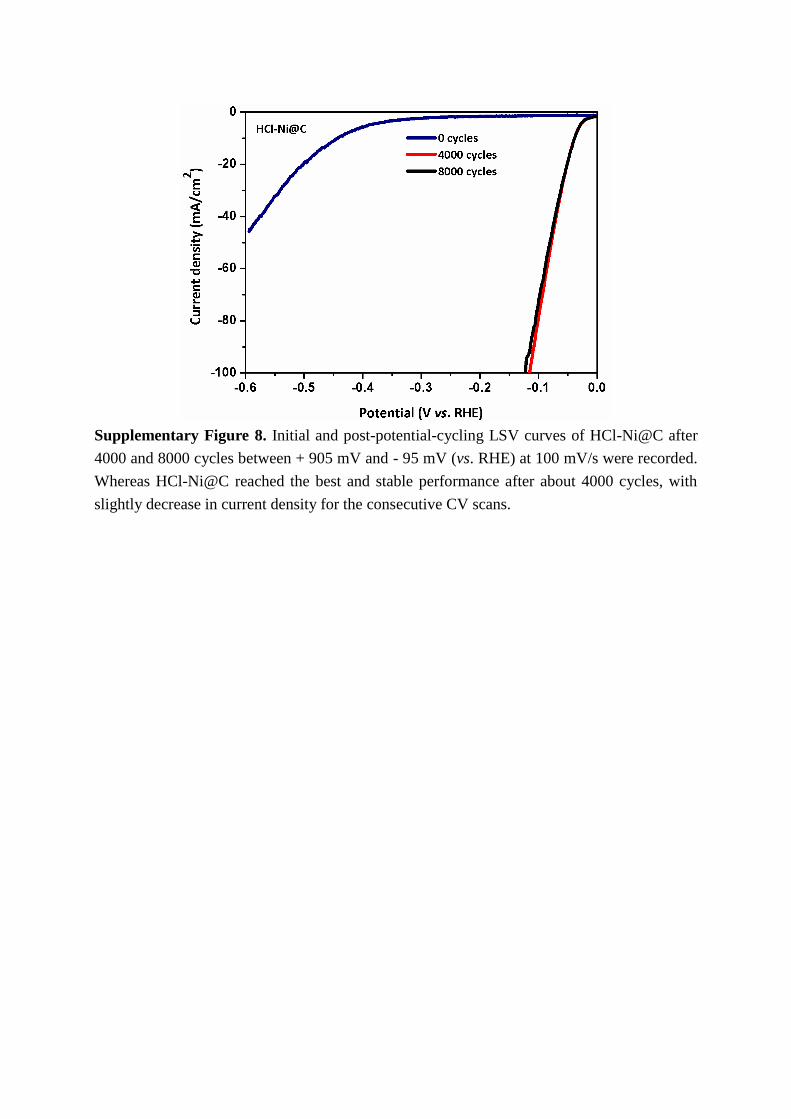
Supplementary Figure 8. Initial and post-potential-cycling LSV curves of HCl-Ni@C after
4000 and 8000 cycles between + 905 mV and - 95 mV (vs. RHE) at 100 mV/s were recorded.
Whereas HCl-Ni@C reached the best and stable performance after about 4000 cycles, with
slightly decrease in current density for the consecutive CV scans.
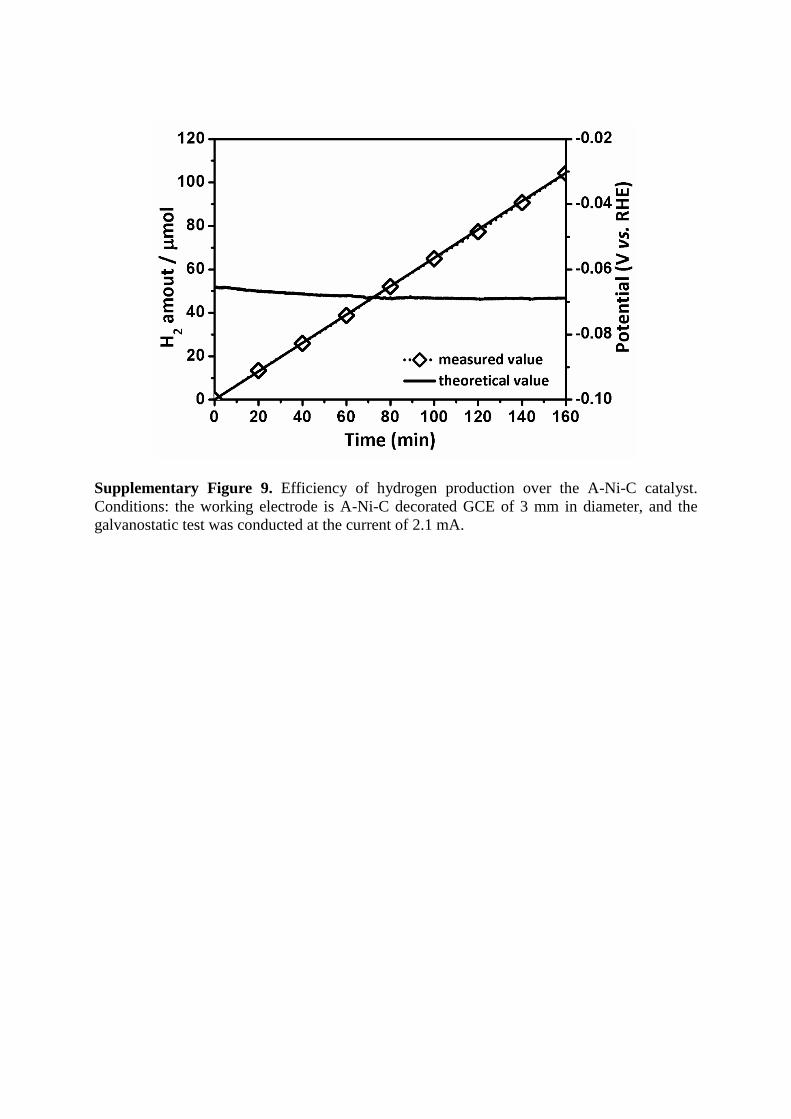
Supplementary Figure 9. Efficiency of hydrogen production over the A-Ni-C catalyst.
Conditions: the working electrode is A-Ni-C decorated GCE of 3 mm in diameter, and the
galvanostatic test was conducted at the current of 2.1 mA.
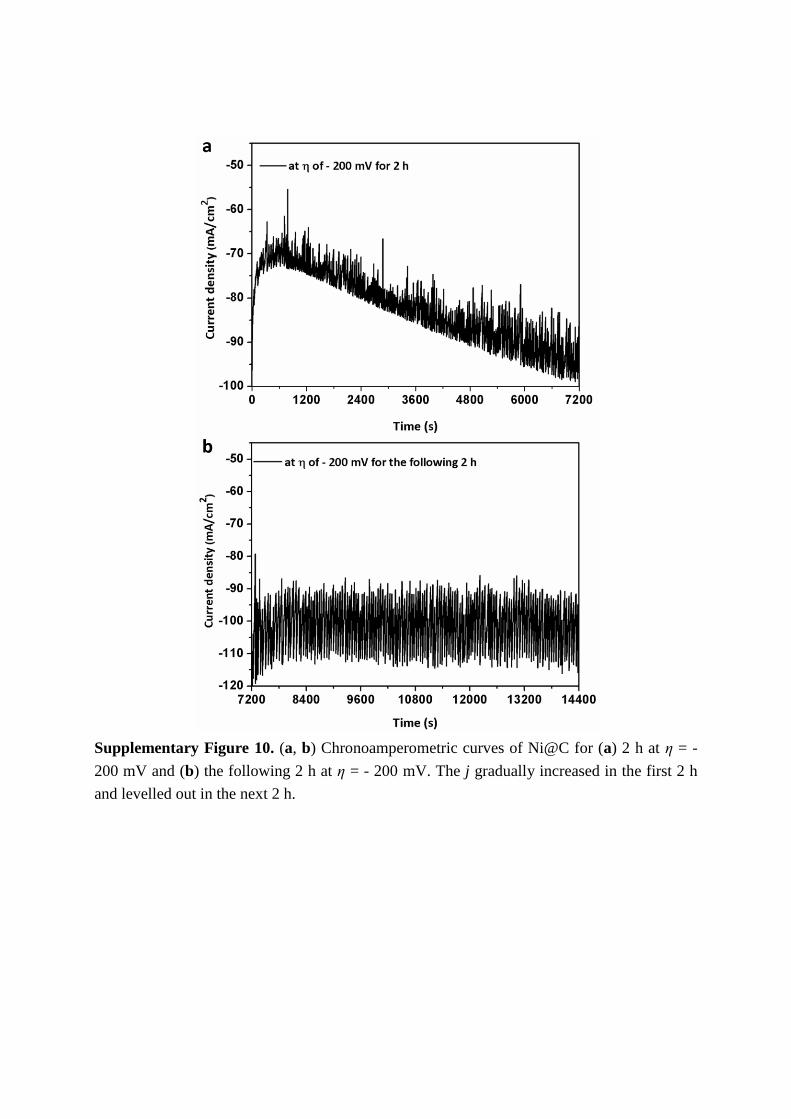
Supplementary Figure 10. (a, b) Chronoamperometric curves of Ni@C for (a) 2 h at η = -
200 mV and (b) the following 2 h at η = - 200 mV. The j gradually increased in the first 2 h
and levelled out in the next 2 h.
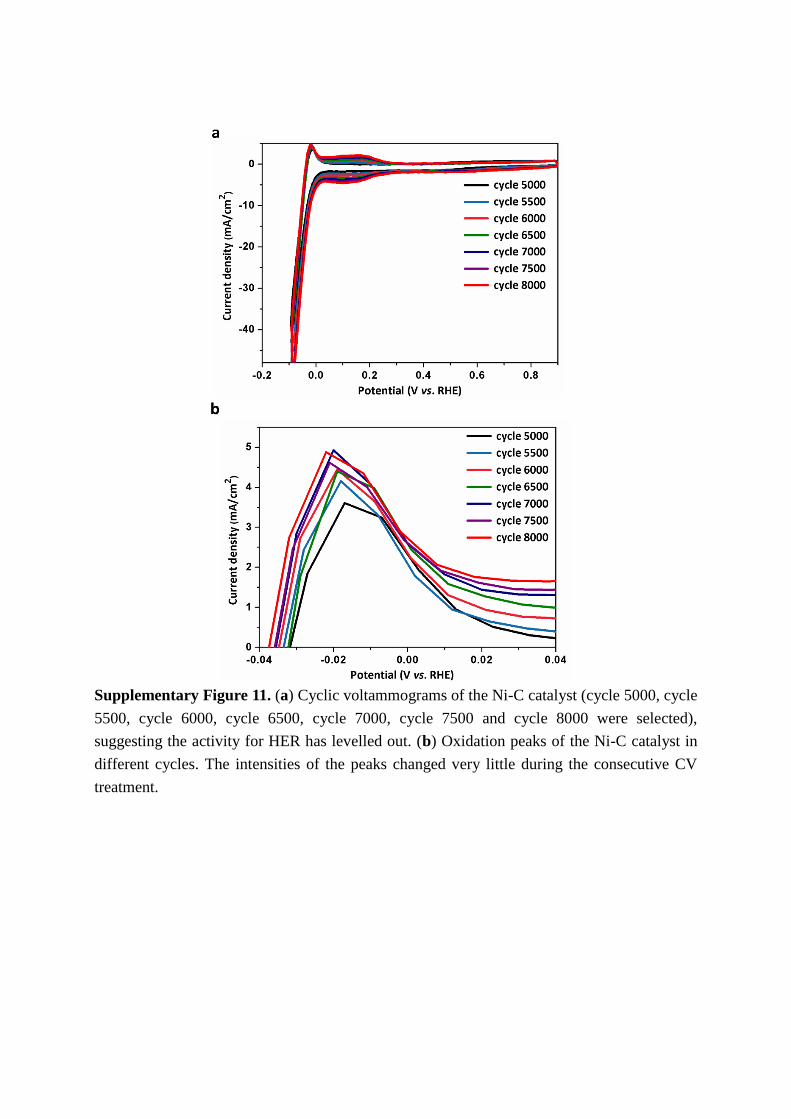
Supplementary Figure 11. (a) Cyclic voltammograms of the Ni-C catalyst (cycle 5000, cycle
5500, cycle 6000, cycle 6500, cycle 7000, cycle 7500 and cycle 8000 were selected),
suggesting the activity for HER has levelled out. (b) Oxidation peaks of the Ni-C catalyst in
different cycles. The intensities of the peaks changed very little during the consecutive CV
treatment.
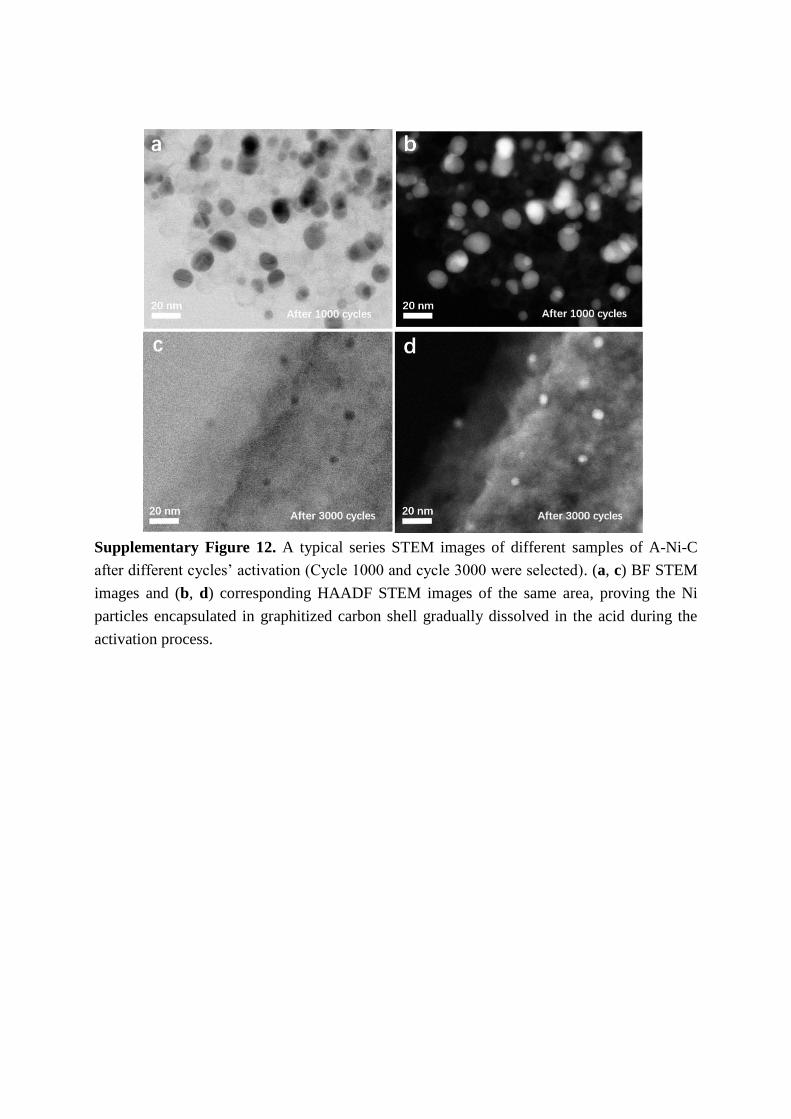
Supplementary Figure 12. A typical series STEM images of different samples of A-Ni-C
after different cycles’ activation (Cycle 1000 and cycle 3000 were selected). (a, c) BF STEM
images and (b, d) corresponding HAADF STEM images of the same area, proving the Ni
particles encapsulated in graphitized carbon shell gradually dissolved in the acid during the
activation process.
.
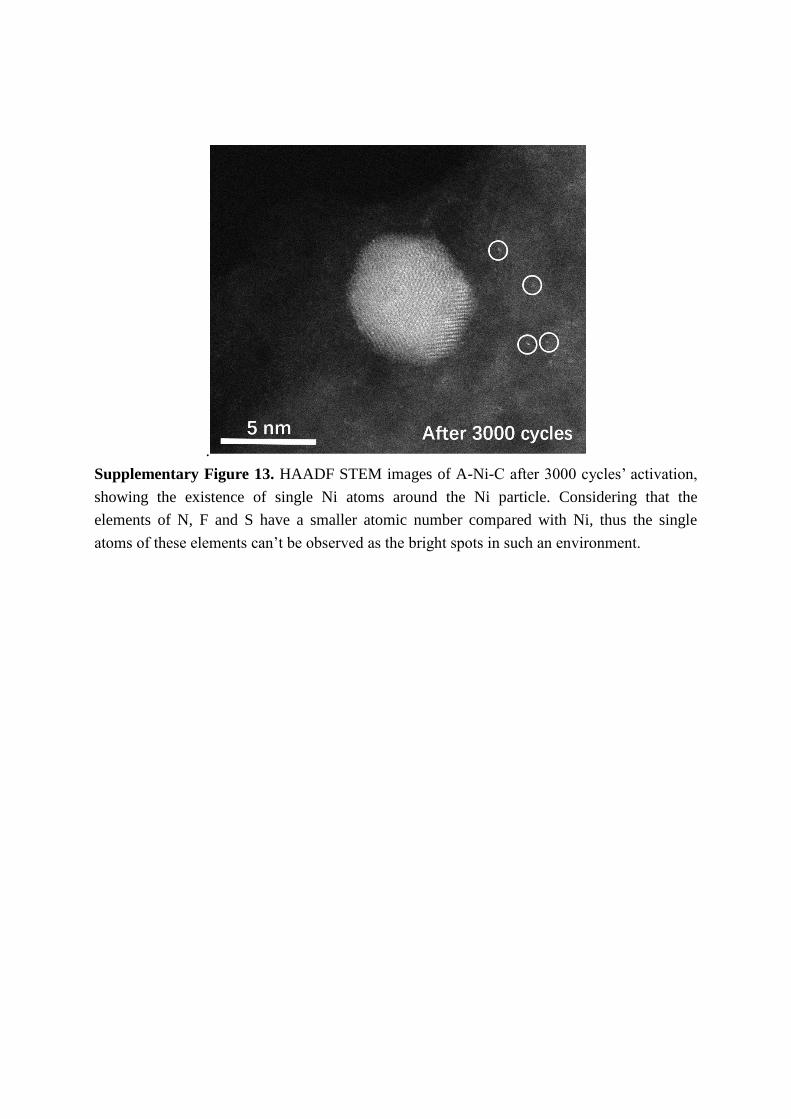
Supplementary Figure 13. HAADF STEM images of A-Ni-C after 3000 cycles’ activation,
showing the existence of single Ni atoms around the Ni particle. Considering that the
elements of N, F and S have a smaller atomic number compared with Ni, thus the single
atoms of these elements can’t be observed as the bright spots in such an environment.
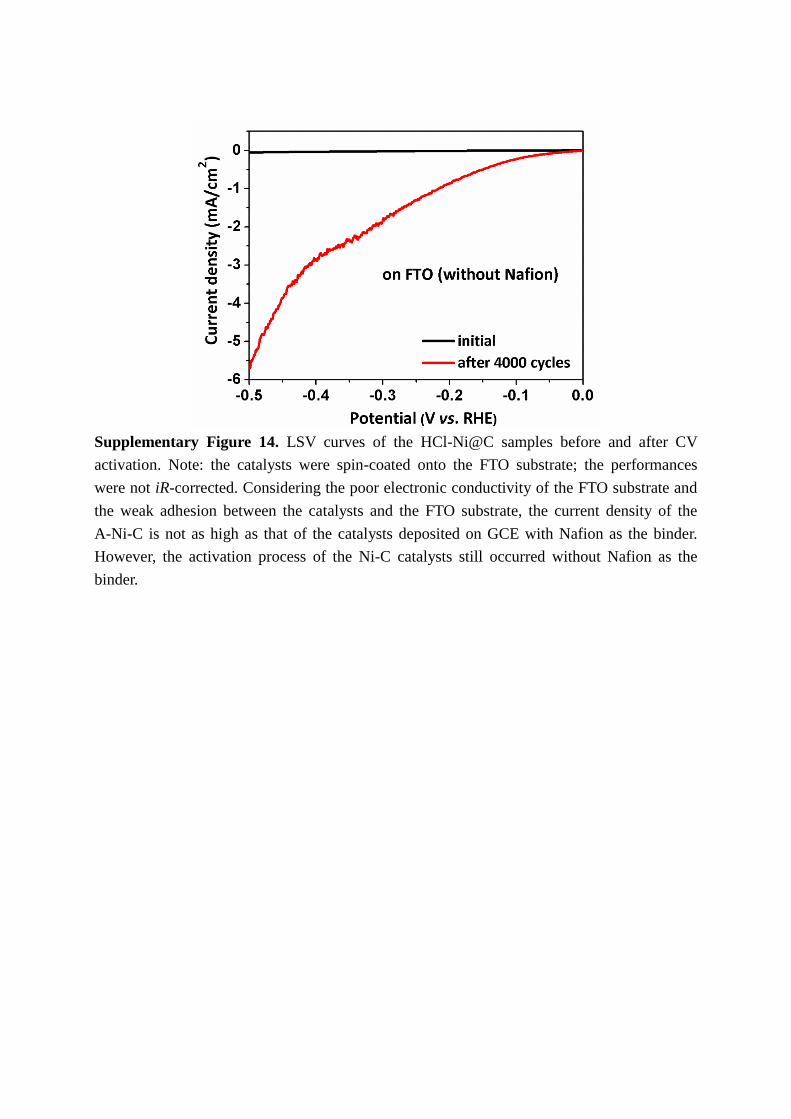
Supplementary Figure 14. LSV curves of the HCl-Ni@C samples before and after CV
activation. Note: the catalysts were spin-coated onto the FTO substrate; the performances
were not iR-corrected. Considering the poor electronic conductivity of the FTO substrate and
the weak adhesion between the catalysts and the FTO substrate, the current density of the
A-Ni-C is not as high as that of the catalysts deposited on GCE with Nafion as the binder.
However, the activation process of the Ni-C catalysts still occurred without Nafion as the
binder.
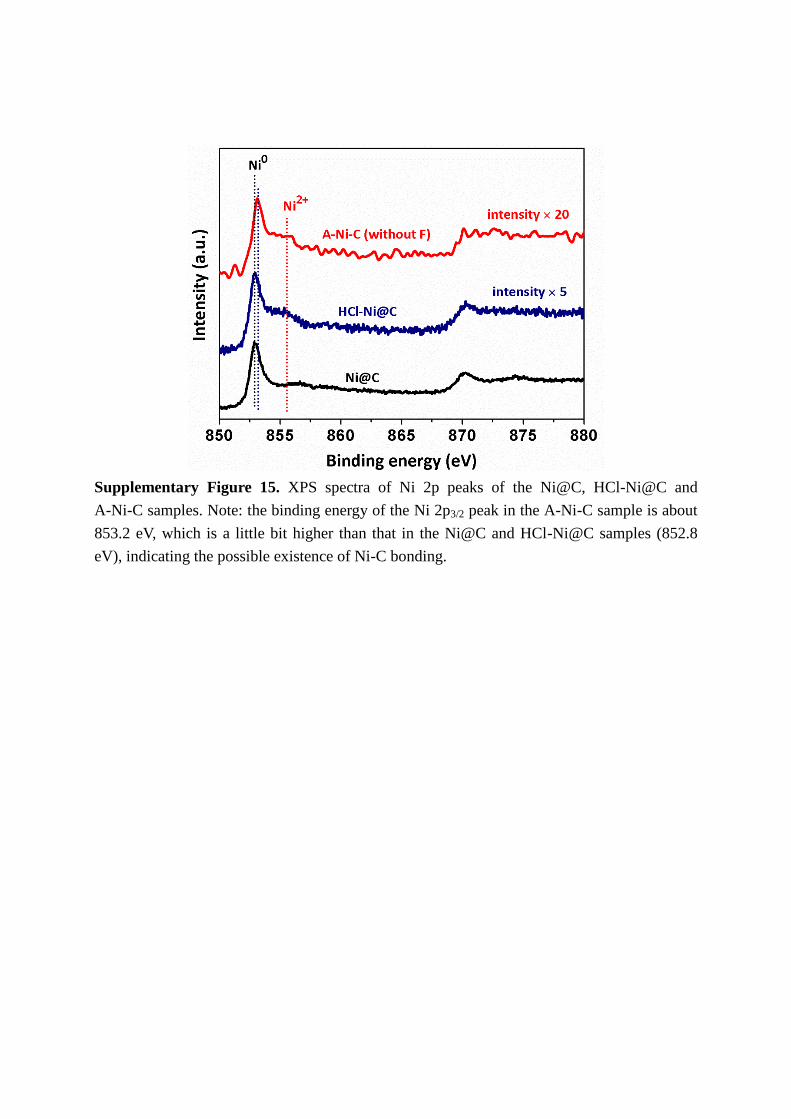
Supplementary Figure 15. XPS spectra of Ni 2p peaks of the Ni@C, HCl-Ni@C and
A-Ni-C samples. Note: the binding energy of the Ni 2p3/2 peak in the A-Ni-C sample is about
853.2 eV, which is a little bit higher than that in the Ni@C and HCl-Ni@C samples (852.8
eV), indicating the possible existence of Ni-C bonding.
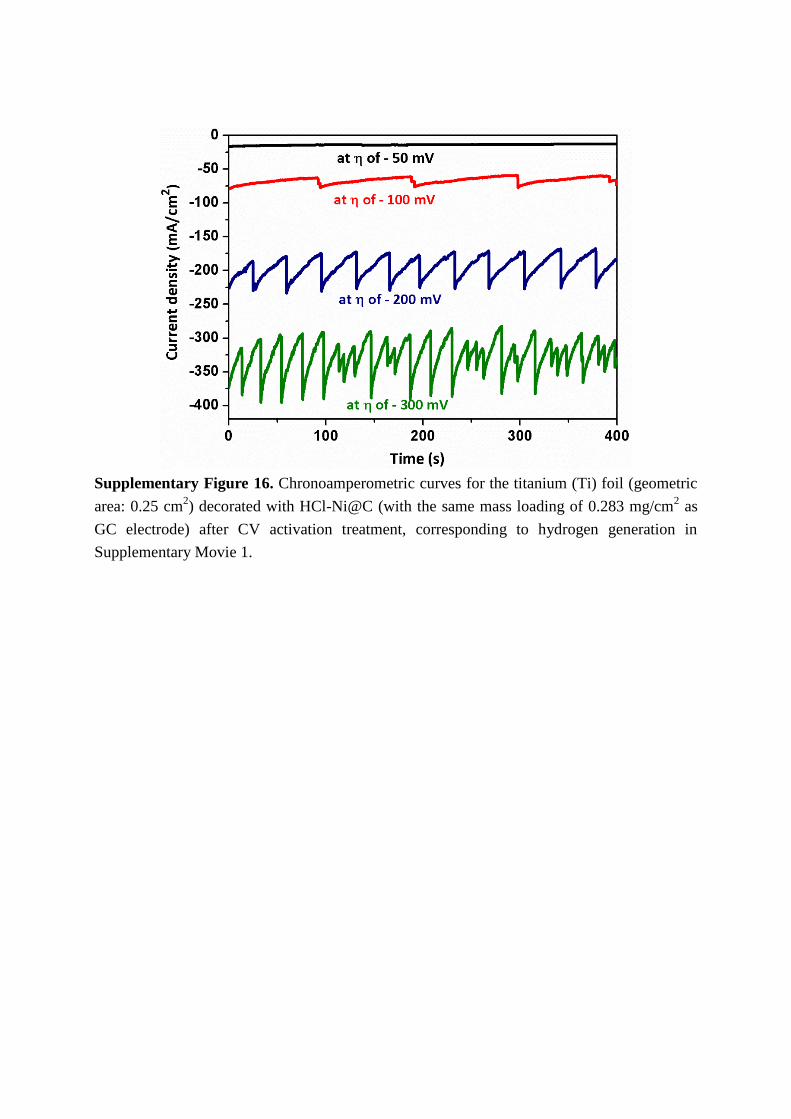
Supplementary Figure 16. Chronoamperometric curves for the titanium (Ti) foil (geometric
area: 0.25 cm2) decorated with HCl-Ni@C (with the same mass loading of 0.283 mg/cm
2 as
GC electrode) after CV activation treatment, corresponding to hydrogen generation in
Supplementary Movie 1.
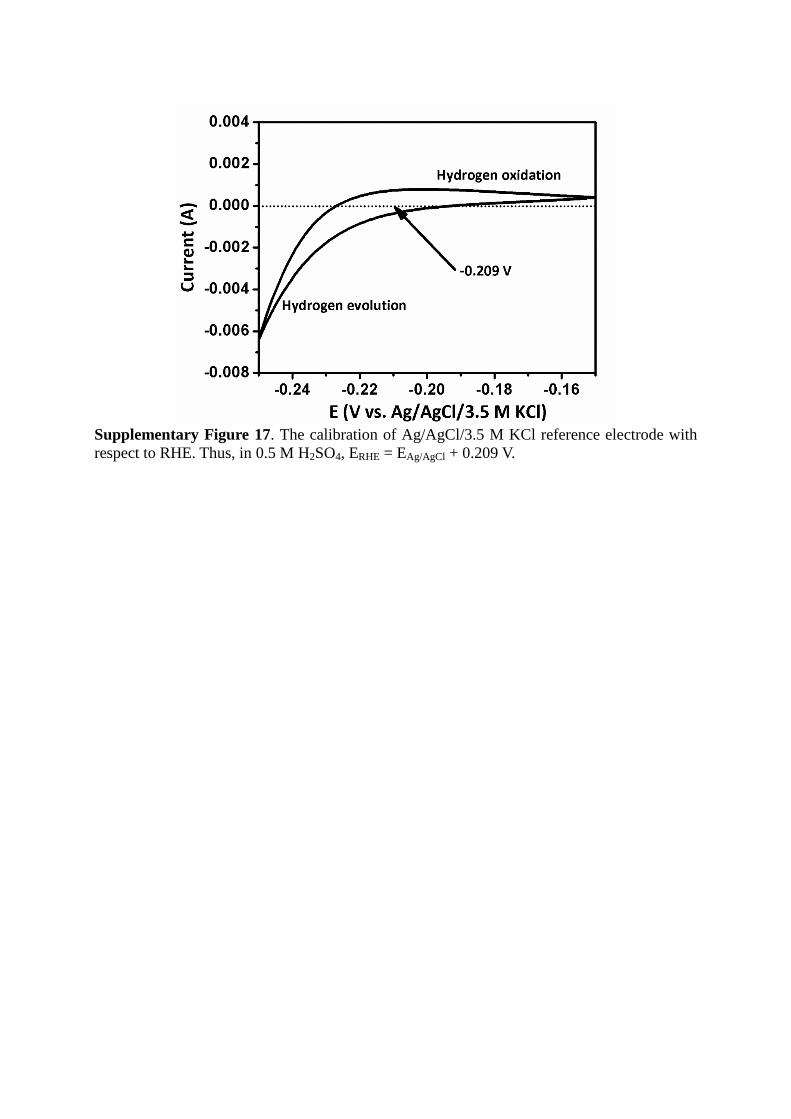
Supplementary Figure 17. The calibration of Ag/AgCl/3.5 M KCl reference electrode with
respect to RHE. Thus, in 0.5 M H2SO4, ERHE = EAg/AgCl + 0.209 V.
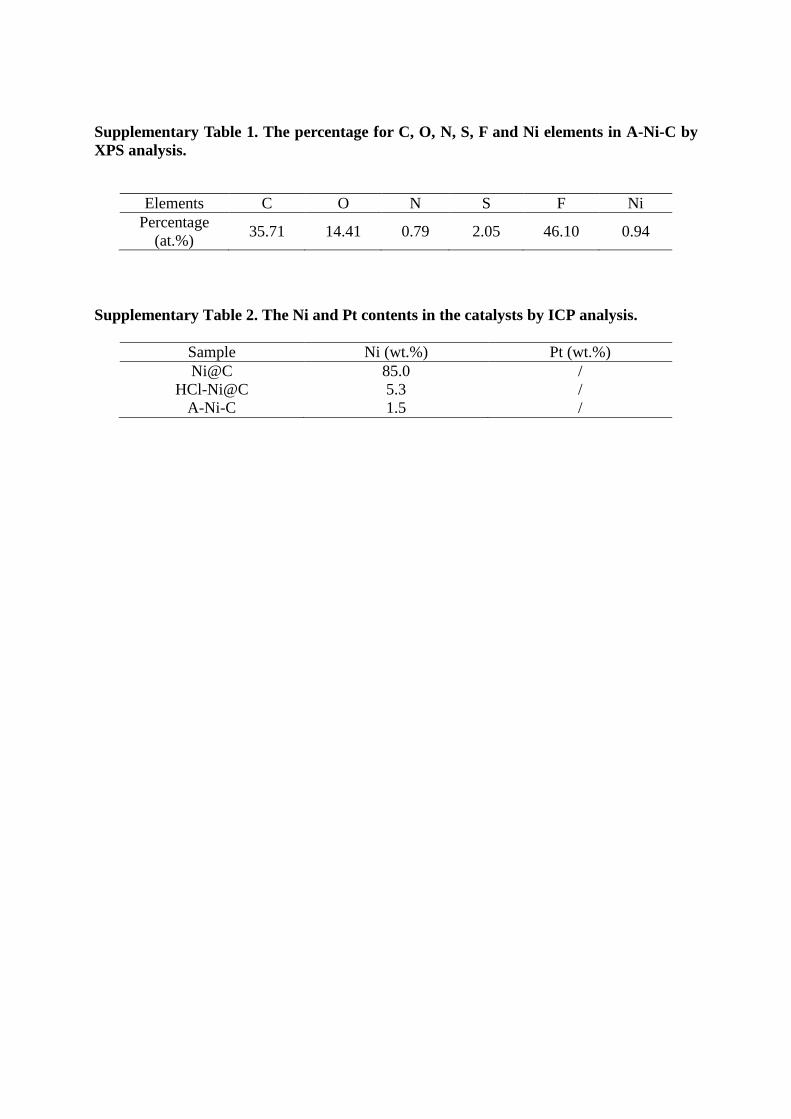
Supplementary Table 1. The percentage for C, O, N, S, F and Ni elements in A-Ni-C by
XPS analysis.
Elements C O N S F Ni
Percentage
(at.%) 35.71 14.41 0.79 2.05 46.10 0.94
Supplementary Table 2. The Ni and Pt contents in the catalysts by ICP analysis.
Sample Ni (wt.%) Pt (wt.%)
Ni@C 85.0 /
HCl-Ni@C 5.3 /
A-Ni-C 1.5 /
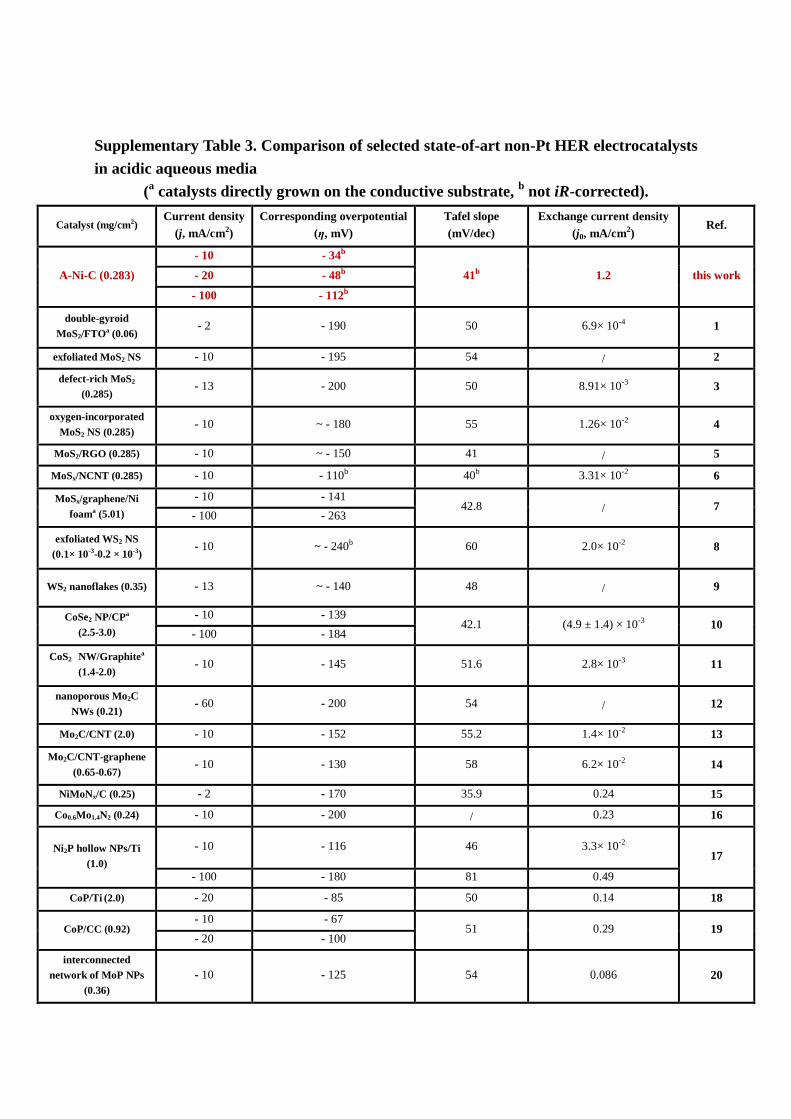
Supplementary Table 3. Comparison of selected state-of-art non-Pt HER electrocatalysts
in acidic aqueous media
(a catalysts directly grown on the conductive substrate,
b not iR-corrected).
Catalyst (mg/cm2) Current density
(j, mA/cm2)
Corresponding overpotential
(η, mV)
Tafel slope
(mV/dec)
Exchange current density
(j0, mA/cm2) Ref.
A-Ni-C (0.283)
- 10 - 34b
41b 1.2 this work - 20 - 48b
- 100 - 112b
double-gyroid
MoS2/FTOa (0.06) - 2 - 190 50 6.9× 10⁻⁴ 1
exfoliated MoS2 NS - 10 - 195 54 / 2
defect-rich MoS2
(0.285) - 13 - 200 50 8.91× 10⁻³ 3
oxygen-incorporated
MoS2 NS (0.285) - 10 ~ - 180 55 1.26× 10⁻² 4
MoS2/RGO (0.285) - 10 ~ - 150 41 / 5
MoSx/NCNT (0.285) - 10 - 110b 40b 3.31× 10⁻² 6
MoSx/graphene/Ni
foama (5.01)
- 10 - 141 42.8 / 7
- 100 - 263
exfoliated WS2 NS
(0.1× 10⁻³-0.2 × 10⁻³) - 10 ~ - 240b 60 2.0× 10⁻² 8
WS2 nanoflakes (0.35) - 13 ~ - 140 48 / 9
CoSe2 NP/CPa
(2.5-3.0)
- 10 - 139 42.1 (4.9 ± 1.4) × 10-3 10
- 100 - 184
CoS2 NW/Graphitea
(1.4-2.0) - 10 - 145 51.6 2.8× 10⁻³ 11
nanoporous Mo2C
NWs (0.21) - 60 - 200 54 / 12
Mo2C/CNT (2.0) - 10 - 152 55.2 1.4× 10⁻² 13
Mo2C/CNT-graphene
(0.65-0.67) - 10 - 130 58 6.2× 10⁻² 14
NiMoNx/C (0.25) - 2 - 170 35.9 0.24 15
Co0.6Mo1.4N2 (0.24) - 10 - 200 / 0.23 16
Ni2P hollow NPs/Ti
(1.0)
- 10 - 116 46 3.3× 10⁻² 17
- 100 - 180 81 0.49
CoP/Ti (2.0) - 20 - 85 50 0.14 18
CoP/CC (0.92) - 10 - 67
51 0.29 19 - 20 - 100
interconnected
network of MoP NPs
(0.36)
- 10 - 125 54 0.086 20
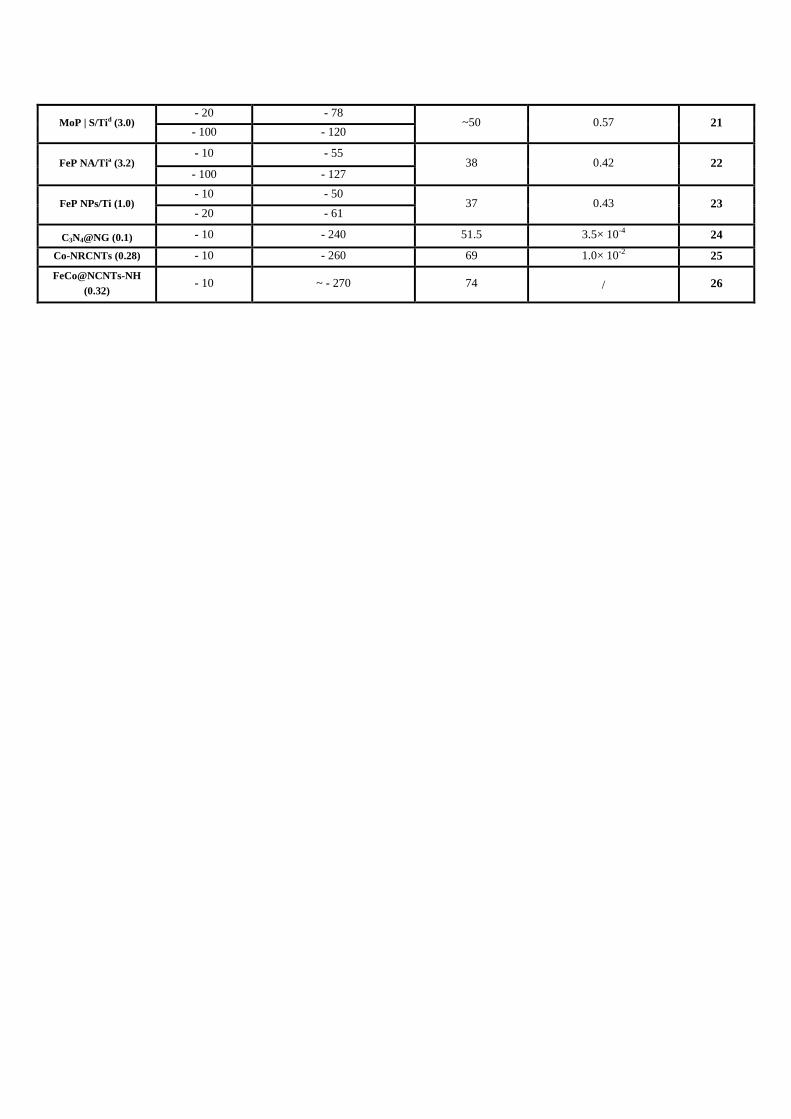
MoP | S/Tid (3.0) - 20 - 78
~50 0.57 21 - 100 - 120
FeP NA/Tia (3.2) - 10 - 55
38 0.42 22 - 100 - 127
FeP NPs/Ti (1.0) - 10 - 50
37 0.43 23 - 20 - 61
C3N4@NG (0.1) - 10 - 240 51.5 3.5× 10⁻⁴ 24
Co-NRCNTs (0.28) - 10 - 260 69 1.0× 10⁻² 25
FeCo@NCNTs-NH
(0.32) - 10 ~ - 270 74 / 26
Supplementary References
1. Kibsgaard, J., Chen, Z., Reinecke, B. N. & Jaramillo, T. F. Engineering the surface
structure of MoS2 to preferentially expose active edge sites for electrocatalysis. Nature
Mater. 11, 963-969 (2012).
2. Lukowski, M. A., Daniel, A. S., Meng, F., Forticaux, A., Li, L. & Jin, S. Enhanced
hydrogen evolution catalysis from chemically exfoliated metallic MoS2 nanosheets. J. Am.
Chem. Soc. 135, 10274-10277 (2013).
3. Xie, J. et al. Defect-rich MoS2 ultrathin nanosheets with additional active edge sites for
enhanced electrocatalytic hydrogen evolution. Adv. Mater. 25, 5807-5813 (2013).
4. Xie, J. et al. Controllable disorder engineering in oxygen-incorporated MoS2 ultrathin
nanosheets for efficient hydrogen evolution. J. Am. Chem. Soc. 135, 17881-17888 (2013).
5. Li, Y. et al. MoS2 nanoparticles grown on graphene: an advanced catalyst for the
hydrogen evolution reaction. J. Am. Chem. Soc. 131, 7296-7299 (2011).
6. Li, D. J. et al. Molybdenum sulfide/N-doped CNT forest hybrid catalysts for
high-performance hydrogen evolution reaction. Nano Lett. 14, 1228-1233 (2014). 7. Chang, Y-H. et al. Highly efficient electrocatalytic hydrogen production by MoSx grown
on graphene-protected 3D Ni foams. Adv. Mater. 25, 756-760 (2013).
8. Voiry, D. et al. Enhanced catalytic activity in strained chemically exfoliated WS2
nanosheets for hydrogen evolution. Nature Mater. 12, 850-855 (2013). 9. Cheng, L. et al. Ultrathin WS2 nanoflakes as a high-performance electrocatalyst for the
hydrogen evolution reaction. Angew. Chem. Int. Ed. 53, 7860-7863 (2014). 10. Kong, D., Wang, H., Lu, Z. & Cui, Y. CoSe2 nanoparticles grown on carbon fiber paper:
an efficient and stable electrocatalyst for hydrogen evolution reaction. J. Am. Chem. Soc.
136, 4897-4900 (2014).
11. Faber, M. S. et al. High-performance electrocatalysis using metallic cobalt pyrite (CoS2)
micro- and nanostructures. J. Am. Chem. Soc. 136, 10053-10061 (2014).
12. Liao, L. et al. A nanoporous molybdenum carbide nanowire as an electrocatalyst for
hydrogen evolution reaction. Energy Environ. Sci. 7, 387-392 (2014).
13. Chen, W. –F. et al. Highly active and durable nanostructured molybdenum carbide
electrocatalysts for hydrogen production. Energy Environ. Sci. 6, 943-951 (2013).
14. Youn, D. H. et al. Highly active and stable hydrogen evolution electrocatalysts based on
molybdenum compounds on carbon nanotube–graphene hybrid support. ACS Nano 8,
5164-5173 (2014). 15. Chen, W. -F. et al. Hydrogen-evolution catalysts based on non-noble metal
nickel-molybdenum nitride nanosheets. Angew. Chem. Int. Ed. 51, 6131-6135 (2012).
16. Cao, B., Veith, G. M., Neuefeind, J. C., Adzic, R. R. & Khalifah, P. G. Mixed close
packed cobalt molybdenum nitrides as non-noble metal electrocatalysts for the hydrogen
evolution reaction. J. Am. Chem. Soc. 135, 19186-19192 (2013). 17. Popczun, E. J. et al. Nanostructured nickel phosphide as an electrocatalyst for the
hydrogen evolution reaction. J. Am. Chem. Soc. 135, 9267-9270 (2013). 18. Popczun, E. J., Read, C. G., Roske, C. W., Lewis, N. S. & Schaak, R. E. Highly active
electrocatalysis of the hydrogen evolution reaction by cobalt phosphide nanoparticles.
Angew. Chem. Int. Ed. 53, 5427-5430 (2014). 19. Tian, J., Liu, Q., Asiri, A. M. & Sun, X. Self-supported nanoporous cobalt phosphide
nanowire arrays: an efficient 3D hydrogen-evolving cathode over the wide range of pH
0–14. J. Am. Chem. Soc. 136, 7587-7590 (2014).
20. Xing, Z., Liu, Q., Asiri, A. M. & Sun, X. Closely interconnected network of molybdenum
phosphide nanoparticles: a highly efficient electrocatalyst for generating hydrogen from
water. Adv. Mater. 26, 5702-5707 (2014).
21. Kibsgaard, J. & Jaramillo, T. F. Molybdenum phosphosulfide: an active, acid-stable,
earth-abundant catalyst for the hydrogen evolution reaction. Angew. Chem. Int. Ed. 53,
14433-14437 (2014).
22. Jiang, P. et al. A cost-effective 3D hydrogen evolution cathode with high catalytic activity:
FeP nanowire array as the active phase. Angew. Chem. Int. Ed. 53, 12855-12859 (2014).
23. Callejas, J. F. et al. Electrocatalytic and photocatalytic hydrogen production from acidic
and neutral-pH aqueous solutions using iron phosphide nanoparticles. ACS Nano 8,
11101-11107 (2014). 24. Zheng, Y. et al. Hydrogen evolution by a metal-free electrocatalyst. Nature Commun. 5,
3783 (2014). 25. Zou, X. et al. Cobalt-embedded nitrogen-rich carbon nanotubes efficiently catalyze
hydrogen evolution reaction at all pH values. Angew. Chem. Int. Ed. 53, 4372-4376
(2014). 26. Deng, J. et al. Highly active and durable non-precious-metal catalyst encapsulated in
carbon nanotubes for hydrogen evolution reaction. Energy Environ. Sci. 7, 1919-1923
(2014).