Embed Size (px)
Citation preview
EUROGRAPHICS Workshops on Graphics and Cultural Heritage (2014)
R. Klein and P. Santos (Editors)
A TaLISMAN: Automatic Text and LIne Segmentation of
historical MANuscripts
Ruggero Pintus1, Ying Yang2, Enrico Gobbetti1 and Holly Rushmeier2
1CRS4, Italy2Yale University, United States
Abstract
Historical and artistic handwritten books are valuable cultural heritage (CH) items, as they provide information
about tangible and intangible cultural aspects from the past. Massive digitization projects have made these kind
of data available to a world-wide population, and pose real challenges for automatic processing. In this scenario,
document layout analysis plays a significant role, being a fundamental step of any document image understanding
system. In this paper, we present a completely automatic algorithm to perform a robust text segmentation of old
handwritten manuscripts on a per-book basis, and we show how to exploit this outcome to find two layout elements,
i.e., text blocks and text lines. Our proposed technique have been evaluated on a large and heterogeneous corpus
content, and our experimental results demonstrate that this approach is efficient and reliable, even when applied
to very noisy and damaged books.
Categories and Subject Descriptors (according to ACM CCS): I.3.0 [Computer Graphics]: General— I.3.3 [Com-
puter Graphics]: Picture/Image Generation—Digitizing and scanning I.3.6 [Computer Graphics]: Methodology
and Techniques— I.3.8 [Computer Graphics]: Applications—
1. Introduction
Massive digitization projects have made large collections of
historic books and manuscripts available to a world-wide
population interested in Cultural Heritage (CH). Digital ac-
cess has made it possible for many people to use these valu-
able documents without the damage associated with physical
handling. Beyond “touchless" access, digital formats offer
the potential to index and search across large collections. To
prepare rich metadata for indexing however there is a need
for automatic tools that can analyze the structure and content
of these books and manuscripts.
The analysis of modern printed materials has been well
studied. However, the analysis of very old hand-prepared
manuscripts remains problematic. Very old works suf-
fer from a wide range of issues associated with wear
and deterioration including smudges, stains, fading, ink
bleed-through, scratches, holes, and creases. Further, hand-
prepared manuscripts do not have standardized style or log-
ical structure. Handwritten characters can have unusual or
varying shapes. Ornamentation has often been added. Illus-
trations appear in varying locations, and often characters are
embellished. Different types of annotations, written in dif-
ferent hands with different materials, have been added in the
margins through the years. To our knowledge no reliable and
completely automatic techniques for extracting and classi-
fying the illustrations, text and annotations from old hand-
prepared manuscripts have been developed.
In computer vision, document layout analysis splits docu-
ments into structural elements that can be labeled by class –
such as text blocks and text lines. Extracting particular tex-
tual fields or blocks can assist scholars in paleographic anal-
ysis for the determination of the geographic and temporal
origin of a manuscript. Further, identifying individual ele-
ments can facilitate automatic or semi-automatic text tran-
scription to enable ASCII-based textual queries. Common
tasks such as word-spotting (e.g., Fischer et al. [FKFB12])
or handwriting recognition are also assisted by layout anal-
ysis.
We present here an automatic, parameter-free framework
for layout analysis of very old handwritten manuscripts. In
particular we focus on the extraction of the following lay-
out entities: text regions, rectangular text blocks and text
lines. We rely on the estimation of the average text lead-
ing value (i.e., inter-line spacing) for all the pages in the
c© The Eurographics Association 2014.
R. Pintus et al. / TaLISMAN: Text and LIne Segmentation of MANuscripts
book [PYR13], and on a class of text recognition meth-
ods [GSD11a, PYR14] that use Support Vector Machine
(SVM) with Radial Basis Function (RBF) kernel to clas-
sify sparse local image features, namely Scale- Invariant
Feature Transform (SIFT). For each member of a sparse
set of text feature positions, we extract neighbor points and
a corresponding radius of influence. We use these to pro-
duce a dense segmentation of text regions. We then extract
main rectangular text blocks, and, for each block, we find a
text line segmentation by applying a Projection Profile tech-
nique [LSZT07, PYR14]. Here we list the major contribu-
tions of the proposed approach.
Page voting framework. We present a framework to se-
lect the most representative pages from a book to use to train
a text feature vector classifier. This increases the probability
of having a training set with well distributed feature vectors
between the text and non-text classes. For each single page,
the voting depends both on its hue histogram, and on the
likelihood of its text leading value, given the corresponding
per-book statistical text leading distribution.
Automatic coarse text segmentation. We improve the
operator presented by Pintus et al. [PYR14] to perform auto-
matic coarse text segmentation. We exploit their frequency
based descriptor, which compares the average text leading
value with the local spatial frequency at different window
sizes. We also consider the amplitude of the predominant
Fourier coefficients as a measure of the local text likelihood.
Automatic per-book basis text segmentation. On a per
book basis, we perform a classification on a set of image fea-
tures to obtain a sparse text segmentation of the book. We
present a pipeline to convert this sparse representation into
a dense separation between text and non-text pixel regions.
We show how to exploit this outcome to find two layout ele-
ments, i.e., text blocks and text lines.
Evaluation. We extensively test and evaluate our docu-
ment layout analysis pipeline with a large and heterogeneous
corpus content, that includes different writing styles, image
resolutions, levels of conservation, noise and amount of illu-
mination and ornamentation. We provide a precision/recall
analysis to quantitatively assess the quality of the proposed
algorithm.
2. Related work
Layout analysis is a well-known and established topic
among the Computer Vision techniques applied to document
structure retrieval. Substantial work has been published in-
cluding character and word spotting [YM12], layout seg-
mentation [GBC09], ancient handwritten document classi-
fication [LGPH08], and extraction of text lines [JL12]. The
literature in this area has been surveyed in Nagy’s [Nag00]
seminal work, as well as in recent reviews [LSZT07]. Here
we discuss only the state-of-the-art techniques closely re-
lated to ours.
Efficient algorithms exist to cope with modern machine-
printed documents or historical documents from the hand-
press period, and to solve the traditional problems of lay-
out analysis, such as document classification [CB07], text
regions/blocks identification [WPH02], or segmentation of
text lines [KC10]. However, the demand for and the com-
plexity of the analysis of old manuscripts requires the devel-
opment of new, more robust methods [AD07].
Common state-of-the-art approaches are based on image
binarization and a morphological analysis of the page im-
age [GBC11,BvKS∗07]. Ramel et al. [RLDB07] exploit the
generation of a connected component map within a semi-
automatic framework, where the user manages and labels
segmented blocks in an interactive manner. Connected com-
ponents extracted by binarization are also used to build a
direct mapping between shape/geometry and binary or color
features [LBK04]. In a similar way, Baechler et al. [BBI10]
rely on adaptive binarization to segment document layouts,
and to provide the user with a semi-automatic annotation
tool for the generation of ground truth of layouts for me-
dieval manuscripts. However, binarization pre-processing
produces uncontrollable errors, since it is sensitive to noise
and to images with low dynamic range, as in the case of
fading-out ink or stains. Further, most of them deal with
very clean layouts, where the background, the text and the
other entities are very easy to separate. For instance, ad-
vanced methods for text block identification and text line
extraction are developed in extreme cases of very complex
writing styles and languages, such as skewed and non-rigid
deformed text [KC10], handwritten Arabic lines [SSG09],
or chinese characters [KC12]. However, all of them act on
datasets with a high contrast between background and fore-
ground, so that the noise is not an issue and they limit the
algorithm to cope with deformed shapes and complex nature
of characters.
Conversely, some techniques do not need a binarization
step [GSD11a]. This makes them more robust to noise,
highly background variability, and ink bleed-through. Since
they deal with gray-scale (or color) images, they usually em-
ploy local image features, and then train multiple classifiers
from the corresponding 2D descriptors [GSD11b]. As re-
cently pointed out by Pintus et al. [PYR13], although these
methods can analyze the document layout without any priors
about its physical and logical structure, their main drawback
is that they all require some amount of user intervention.
Since the semi-automatic nature limits the range of their ap-
plicability, and makes them unsuitable for massive and het-
erogeneous data analysis, they presents a multi-scale frame-
work to automatically estimate the average per-page text
leading value. This approach, applied as a pre-processing
step, makes some of the previously mentioned state-of-the-
art algorithms completely automatic.
Our work is inspired by this literature. Particularly, we use
the text leading computation [PYR13] as a pre-processing
c© The Eurographics Association 2014.
R. Pintus et al. / TaLISMAN: Text and LIne Segmentation of MANuscripts
step, in order to attain a completely automatic pipeline
for text region segmentation and extraction of lines of
text. Since we are dealing with very noisy and damaged
dataset, we avoid the binarization pre-processing, as Garz
et al. [GFSB12], and we employ robust local descriptors
to classify text features [GSD11b]. The paper most simi-
lar to ours is Pintus et al. [PYR14], which presents a per-
page text line extraction. Our contribution overcomes ma-
jor limitations of this work. First of all, we employ a ded-
icated page voting framework to select the most represen-
tative pages from a book. This allows the training of a text
classifier on a per-book basis. This is more robust than the
previous per-page approach, which fails if the text leading
is mis-computed (see [PYR13]) or in the cases of poor ini-
tial text segmentation (see [PYR14]). Further, to compute
an automatic coarse text segmentation, we perform not only
a multi-scale comparison, but we also use the amplitude of
Fourier coefficients as a measure of the local text likelihood.
Moreover, while the previous method is limited to pages
with only one main text block, we exploit the sparse fea-
ture classification, together with a kdtree-based analysis of
text points, to compute a more precise and dense text region
segmentation. Thus, the proposed method provides a more
general support for multiple text block identification, and al-
lows us to find lines of text in a more reliable, versatile and
efficient way. Finally, we show the robustness and reliability
of our technique with an extensive evaluation performed on
a large dataset with a high variability of layouts, syles, and
levels of conservation.
3. Technique overview
Fig. 1 shows an overall view of the proposed layout anal-
ysis pipeline. The algorithm is given an entire book as a
set of images. As a pre-processing step, for each page we
compute the average text leading [PYR13], and the SIFT
features [Low04]. By exploiting the information of the text
leading distribution across the book and the hue histogram
of each image, we select the most salient pages, and the
corresponding local image descriptors. With a modification
of the frequency based approach presented by Pintus et
al. [PYR14] we compute a coarse two-class segmentation
of this subset, and we assign to each feature one of the fol-
lowing labels: text or non-text. We use this rough classifica-
tion to automatically train a Support Vector Machine (SVM)
with Radial Basis Function (RBF), and we then re-launch a
prediction step to all original SIFTs to obtain a fine text key-
points segmentation. Since the predicted points across the
entire manuscript are a sparse representation of text posi-
tions, we employ a kdtree data structure to estimate the influ-
ence radius of each point, and we extract dense text regions
and the associated rectangular text blocks. Finally, for each
block we give the fine SIFT classification to an algorithm
based on Projection Profiles (PP) [PYR14] in order to find
lines of text. The highlighted parts (gray rectangles) repre-
sent the new elements proposed in this paper.
4. Method
The input data for our document layout analysis method
is a complete image set of all pages from a manuscript.
We don’t have particular constraints on the nature of the
data; the input may have ornamentation, portraits, figures,
capital letters and touching and overlapping lines. The in-
put may be degraded by background noise, fading-out and
bleeded-through ink and other kinds of damage due to age-
ing. We make two minor assumptions, that are typically met
in a general scenario. As in Pintus et al. [PYR13], the text
should be quasi-horizontal, or a pre-processing step should
be applied in order to correct the overall orientation of each
page [PGLS13]; this is a common constraint in the capture
and visualization systems of digital libraries and museums.
Without loss of generality, we can assume that it is possible
to model the behaviour of the per-page text leading value
across a single book as a normal distribution, i.e. a pair of a
mean and a variance value. The pipeline we present is com-
pletely automatic, and the parameters involved are set just
once, and they are not data dependent or manually tuned by
the user. Throughout this section, for display purpose only,
we use pages from the book BodleianMSBodley850 from the
Yale University’s Beinecke Rare Book and Manuscript Dig-
ital Library [Bei13b, Bei13a].
4.1. Pre-process
For each input image we extract local, sparse image key-
points and the corresponding descriptors; in this work we use
SIFT features (Scale-Invariant Feature Transform) [Low04].
On the left of fig. 4) we show all the original SIFT fea-
tures extracted for one page of the book. We also com-
pute the average text leading value for each page of the
manuscript [PYR13]. With the aim at a per-book basis ap-
proach, we consider the text leading as a discrete random
variable, and we model its distribution across the manuscript
as a Gaussian probability mass function. We find its mean µ
and variance σ2, and we use these as parameters to drive
some of the following steps in our pipeline. From now on
in the pipeline, for a page i we consider the associate text
leading Li as:
Li =
{
Li if |Li −µ|< σ
µ if |Li −µ| ≥ σ(1)
4.2. Salient pages
To train a text descriptor classifier with a minimal sub-
set of feature vectors, we want to automatically select the
most representative pages from the input manuscript. These
pages/images should contain both text and non-text key-
points, so that the training step can well separate the two
classes in the feature space. For each page we compute two
values: the text leading likelihood and the hue diversity. The
c© The Eurographics Association 2014.
R. Pintus et al. / TaLISMAN: Text and LIne Segmentation of MANuscripts
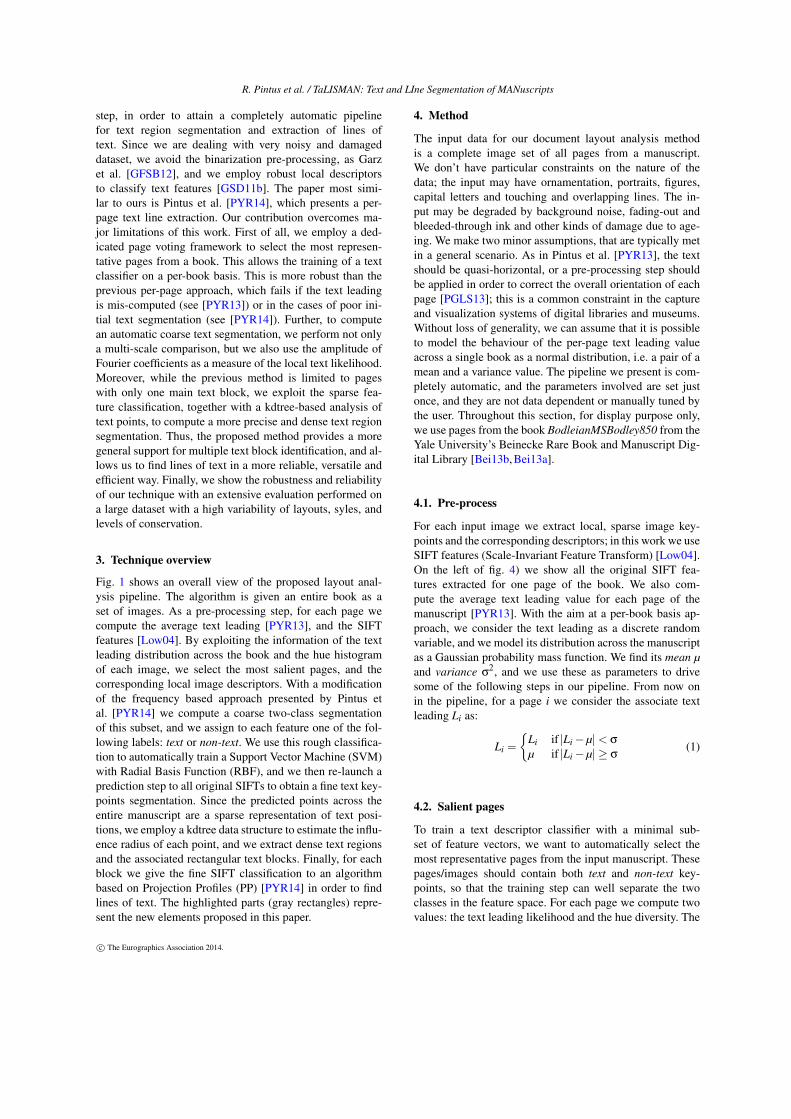
Figure 1: A TaLISMAN - Algorithm pipeline. Given a book, we extract per-page text leadings and features. We select the
most salient pages and image descriptors, and we compute a rough text segmentation that we use to train a SVM classifier.
We re-launch the prediction to all original features to obtain a fine segmentation. We convert these sparse text positions into a
dense text region representation, and we finally extract text blocks and lines.
(a) (b) (c)
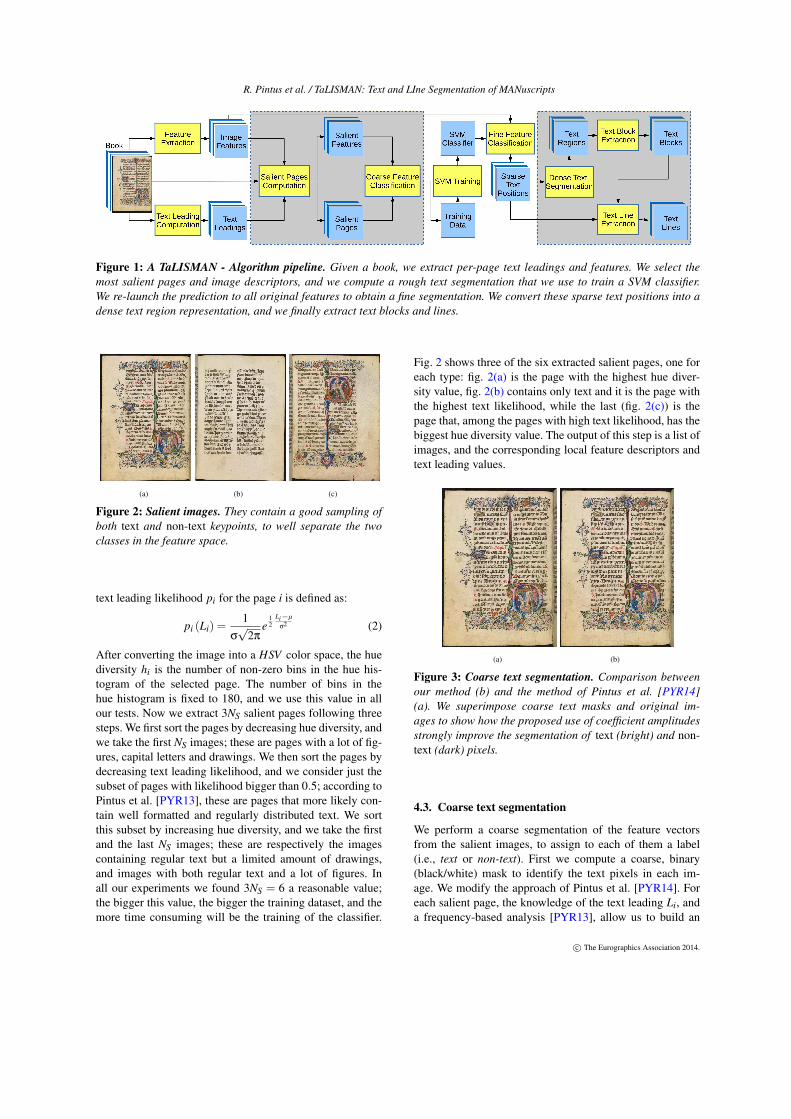
Figure 2: Salient images. They contain a good sampling of
both text and non-text keypoints, to well separate the two
classes in the feature space.
text leading likelihood pi for the page i is defined as:
pi (Li) =1
σ
√2π
e12
Li−µ
σ2 (2)
After converting the image into a HSV color space, the hue
diversity hi is the number of non-zero bins in the hue his-
togram of the selected page. The number of bins in the
hue histogram is fixed to 180, and we use this value in all
our tests. Now we extract 3NS salient pages following three
steps. We first sort the pages by decreasing hue diversity, and
we take the first NS images; these are pages with a lot of fig-
ures, capital letters and drawings. We then sort the pages by
decreasing text leading likelihood, and we consider just the
subset of pages with likelihood bigger than 0.5; according to
Pintus et al. [PYR13], these are pages that more likely con-
tain well formatted and regularly distributed text. We sort
this subset by increasing hue diversity, and we take the first
and the last NS images; these are respectively the images
containing regular text but a limited amount of drawings,
and images with both regular text and a lot of figures. In
all our experiments we found 3NS = 6 a reasonable value;
the bigger this value, the bigger the training dataset, and the
more time consuming will be the training of the classifier.
Fig. 2 shows three of the six extracted salient pages, one for
each type: fig. 2(a) is the page with the highest hue diver-
sity value, fig. 2(b) contains only text and it is the page with
the highest text likelihood, while the last (fig. 2(c)) is the
page that, among the pages with high text likelihood, has the
biggest hue diversity value. The output of this step is a list of
images, and the corresponding local feature descriptors and
text leading values.
(a) (b)
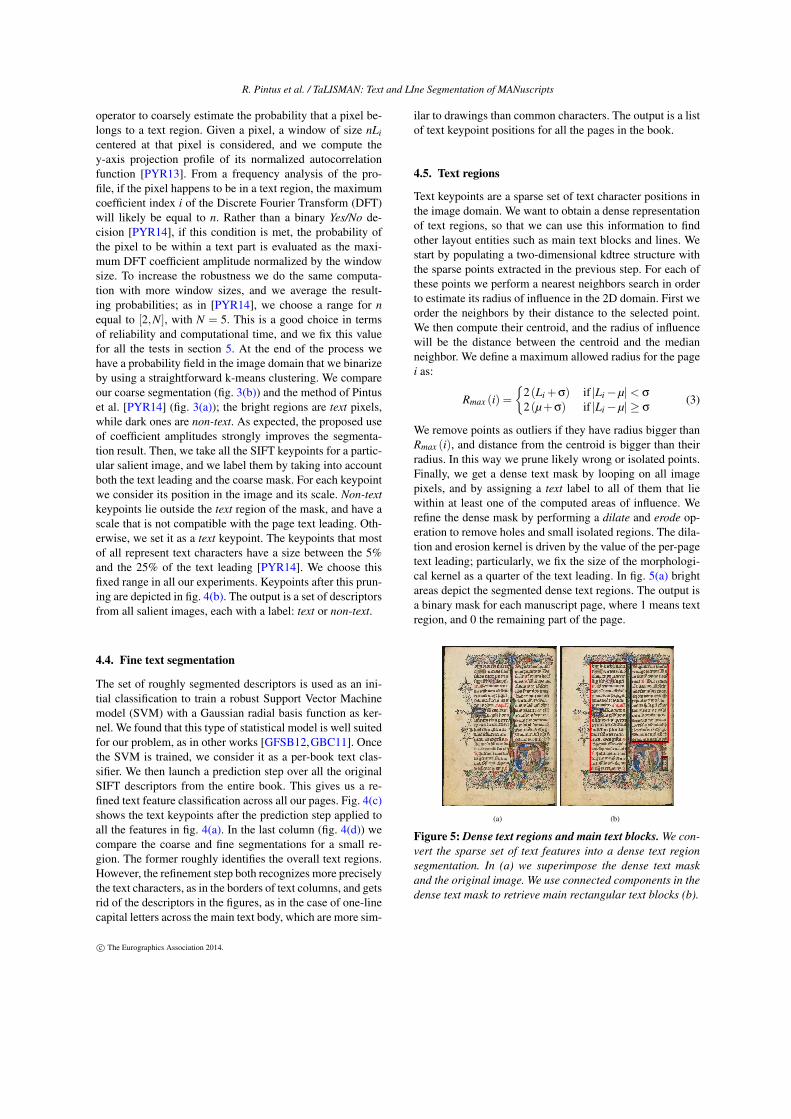
Figure 3: Coarse text segmentation. Comparison between
our method (b) and the method of Pintus et al. [PYR14]
(a). We superimpose coarse text masks and original im-
ages to show how the proposed use of coefficient amplitudes
strongly improve the segmentation of text (bright) and non-
text (dark) pixels.
4.3. Coarse text segmentation
We perform a coarse segmentation of the feature vectors
from the salient images, to assign to each of them a label
(i.e., text or non-text). First we compute a coarse, binary
(black/white) mask to identify the text pixels in each im-
age. We modify the approach of Pintus et al. [PYR14]. For
each salient page, the knowledge of the text leading Li, and
a frequency-based analysis [PYR13], allow us to build an
c© The Eurographics Association 2014.
R. Pintus et al. / TaLISMAN: Text and LIne Segmentation of MANuscripts
operator to coarsely estimate the probability that a pixel be-
longs to a text region. Given a pixel, a window of size nLi
centered at that pixel is considered, and we compute the
y-axis projection profile of its normalized autocorrelation
function [PYR13]. From a frequency analysis of the pro-
file, if the pixel happens to be in a text region, the maximum
coefficient index i of the Discrete Fourier Transform (DFT)
will likely be equal to n. Rather than a binary Yes/No de-
cision [PYR14], if this condition is met, the probability of
the pixel to be within a text part is evaluated as the maxi-
mum DFT coefficient amplitude normalized by the window
size. To increase the robustness we do the same computa-
tion with more window sizes, and we average the result-
ing probabilities; as in [PYR14], we choose a range for n
equal to [2,N], with N = 5. This is a good choice in terms
of reliability and computational time, and we fix this value
for all the tests in section 5. At the end of the process we
have a probability field in the image domain that we binarize
by using a straightforward k-means clustering. We compare
our coarse segmentation (fig. 3(b)) and the method of Pintus
et al. [PYR14] (fig. 3(a)); the bright regions are text pixels,
while dark ones are non-text. As expected, the proposed use
of coefficient amplitudes strongly improves the segmenta-
tion result. Then, we take all the SIFT keypoints for a partic-
ular salient image, and we label them by taking into account
both the text leading and the coarse mask. For each keypoint
we consider its position in the image and its scale. Non-text
keypoints lie outside the text region of the mask, and have a
scale that is not compatible with the page text leading. Oth-
erwise, we set it as a text keypoint. The keypoints that most
of all represent text characters have a size between the 5%
and the 25% of the text leading [PYR14]. We choose this
fixed range in all our experiments. Keypoints after this prun-
ing are depicted in fig. 4(b). The output is a set of descriptors
from all salient images, each with a label: text or non-text.
4.4. Fine text segmentation
The set of roughly segmented descriptors is used as an ini-
tial classification to train a robust Support Vector Machine
model (SVM) with a Gaussian radial basis function as ker-
nel. We found that this type of statistical model is well suited
for our problem, as in other works [GFSB12,GBC11]. Once
the SVM is trained, we consider it as a per-book text clas-
sifier. We then launch a prediction step over all the original
SIFT descriptors from the entire book. This gives us a re-
fined text feature classification across all our pages. Fig. 4(c)
shows the text keypoints after the prediction step applied to
all the features in fig. 4(a). In the last column (fig. 4(d)) we
compare the coarse and fine segmentations for a small re-
gion. The former roughly identifies the overall text regions.
However, the refinement step both recognizes more precisely
the text characters, as in the borders of text columns, and gets
rid of the descriptors in the figures, as in the case of one-line
capital letters across the main text body, which are more sim-
ilar to drawings than common characters. The output is a list
of text keypoint positions for all the pages in the book.
4.5. Text regions
Text keypoints are a sparse set of text character positions in
the image domain. We want to obtain a dense representation
of text regions, so that we can use this information to find
other layout entities such as main text blocks and lines. We
start by populating a two-dimensional kdtree structure with
the sparse points extracted in the previous step. For each of
these points we perform a nearest neighbors search in order
to estimate its radius of influence in the 2D domain. First we
order the neighbors by their distance to the selected point.
We then compute their centroid, and the radius of influence
will be the distance between the centroid and the median
neighbor. We define a maximum allowed radius for the page
i as:
Rmax (i) =
{
2(Li +σ) if |Li −µ|< σ
2(µ+σ) if |Li −µ| ≥ σ(3)
We remove points as outliers if they have radius bigger than
Rmax (i), and distance from the centroid is bigger than their
radius. In this way we prune likely wrong or isolated points.
Finally, we get a dense text mask by looping on all image
pixels, and by assigning a text label to all of them that lie
within at least one of the computed areas of influence. We
refine the dense mask by performing a dilate and erode op-
eration to remove holes and small isolated regions. The dila-
tion and erosion kernel is driven by the value of the per-page
text leading; particularly, we fix the size of the morphologi-
cal kernel as a quarter of the text leading. In fig. 5(a) bright
areas depict the segmented dense text regions. The output is
a binary mask for each manuscript page, where 1 means text
region, and 0 the remaining part of the page.
(a) (b)
Figure 5: Dense text regions and main text blocks. We con-
vert the sparse set of text features into a dense text region
segmentation. In (a) we superimpose the dense text mask
and the original image. We use connected components in the
dense text mask to retrieve main rectangular text blocks (b).
c© The Eurographics Association 2014.
R. Pintus et al. / TaLISMAN: Text and LIne Segmentation of MANuscripts
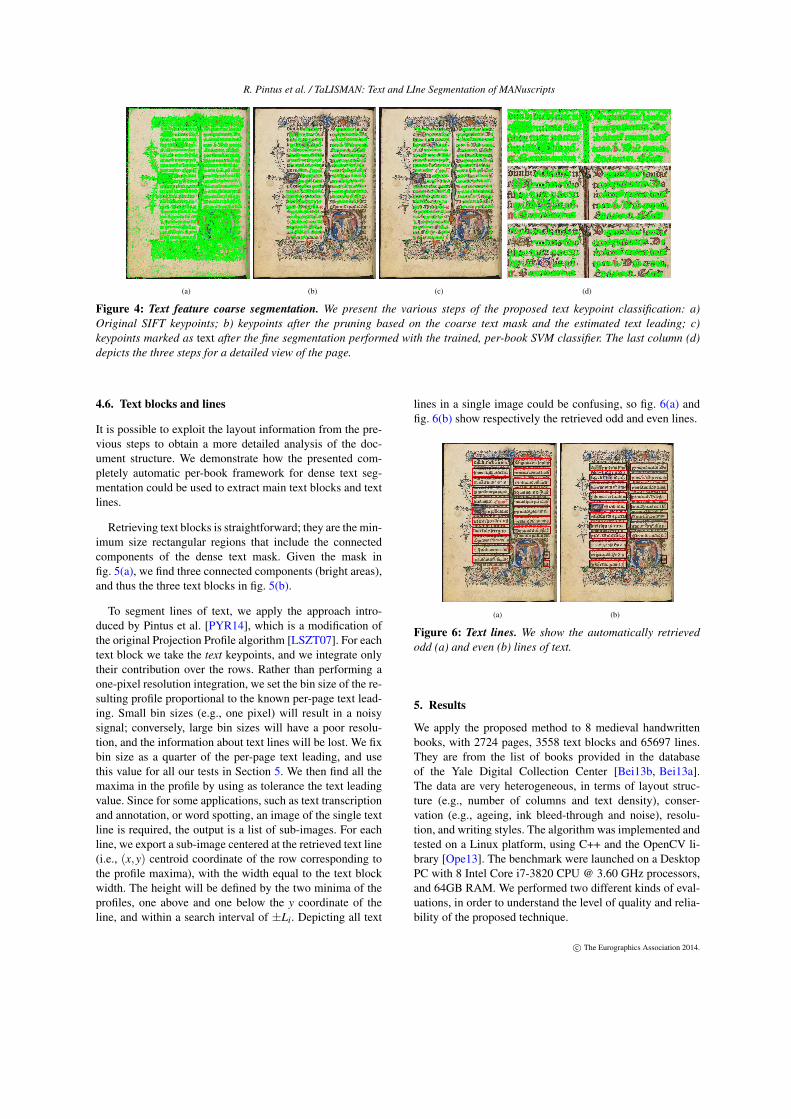
(a) (b) (c) (d)
Figure 4: Text feature coarse segmentation. We present the various steps of the proposed text keypoint classification: a)
Original SIFT keypoints; b) keypoints after the pruning based on the coarse text mask and the estimated text leading; c)
keypoints marked as text after the fine segmentation performed with the trained, per-book SVM classifier. The last column (d)
depicts the three steps for a detailed view of the page.
4.6. Text blocks and lines
It is possible to exploit the layout information from the pre-
vious steps to obtain a more detailed analysis of the doc-
ument structure. We demonstrate how the presented com-
pletely automatic per-book framework for dense text seg-
mentation could be used to extract main text blocks and text
lines.
Retrieving text blocks is straightforward; they are the min-
imum size rectangular regions that include the connected
components of the dense text mask. Given the mask in
fig. 5(a), we find three connected components (bright areas),
and thus the three text blocks in fig. 5(b).
To segment lines of text, we apply the approach intro-
duced by Pintus et al. [PYR14], which is a modification of
the original Projection Profile algorithm [LSZT07]. For each
text block we take the text keypoints, and we integrate only
their contribution over the rows. Rather than performing a
one-pixel resolution integration, we set the bin size of the re-
sulting profile proportional to the known per-page text lead-
ing. Small bin sizes (e.g., one pixel) will result in a noisy
signal; conversely, large bin sizes will have a poor resolu-
tion, and the information about text lines will be lost. We fix
bin size as a quarter of the per-page text leading, and use
this value for all our tests in Section 5. We then find all the
maxima in the profile by using as tolerance the text leading
value. Since for some applications, such as text transcription
and annotation, or word spotting, an image of the single text
line is required, the output is a list of sub-images. For each
line, we export a sub-image centered at the retrieved text line
(i.e., (x,y) centroid coordinate of the row corresponding to
the profile maxima), with the width equal to the text block
width. The height will be defined by the two minima of the
profiles, one above and one below the y coordinate of the
line, and within a search interval of ±Li. Depicting all text
lines in a single image could be confusing, so fig. 6(a) and
fig. 6(b) show respectively the retrieved odd and even lines.
(a) (b)
Figure 6: Text lines. We show the automatically retrieved
odd (a) and even (b) lines of text.
5. Results
We apply the proposed method to 8 medieval handwritten
books, with 2724 pages, 3558 text blocks and 65697 lines.
They are from the list of books provided in the database
of the Yale Digital Collection Center [Bei13b, Bei13a].
The data are very heterogeneous, in terms of layout struc-
ture (e.g., number of columns and text density), conser-
vation (e.g., ageing, ink bleed-through and noise), resolu-
tion, and writing styles. The algorithm was implemented and
tested on a Linux platform, using C++ and the OpenCV li-
brary [Ope13]. The benchmark were launched on a Desktop
PC with 8 Intel Core i7-3820 CPU @ 3.60 GHz processors,
and 64GB RAM. We performed two different kinds of eval-
uations, in order to understand the level of quality and relia-
bility of the proposed technique.
c© The Eurographics Association 2014.
R. Pintus et al. / TaLISMAN: Text and LIne Segmentation of MANuscripts
(a) (b) (c)
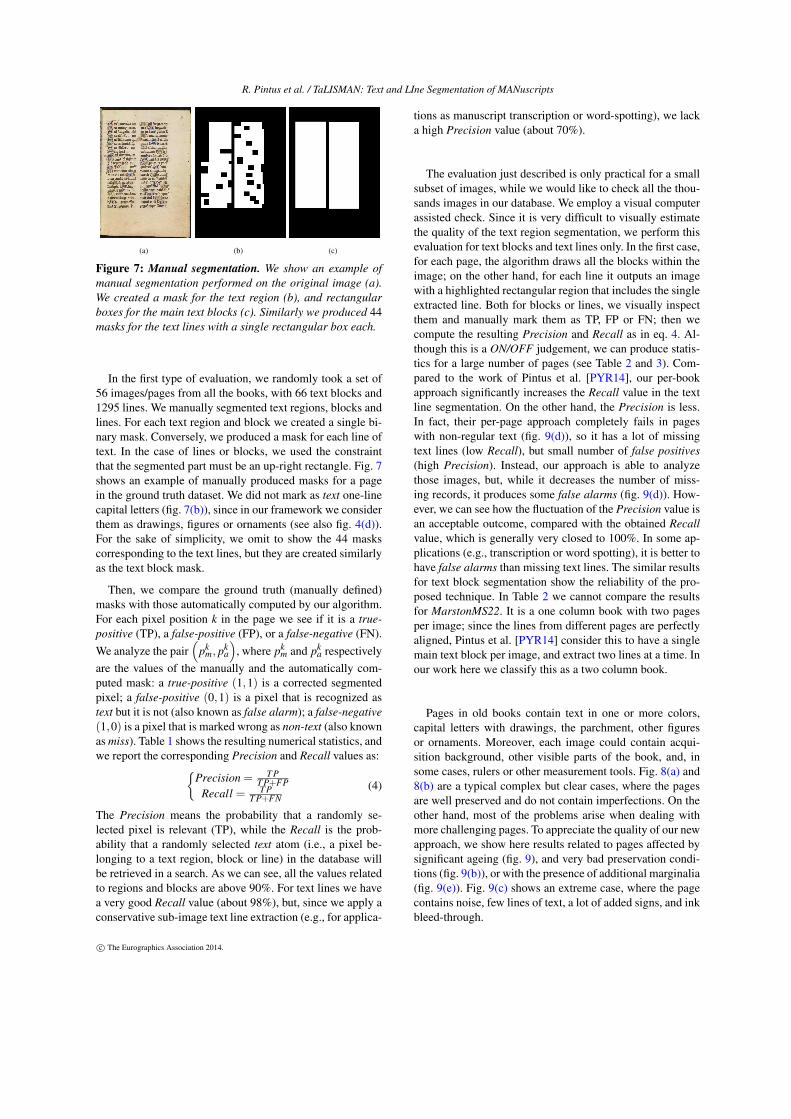
Figure 7: Manual segmentation. We show an example of
manual segmentation performed on the original image (a).
We created a mask for the text region (b), and rectangular
boxes for the main text blocks (c). Similarly we produced 44
masks for the text lines with a single rectangular box each.
In the first type of evaluation, we randomly took a set of
56 images/pages from all the books, with 66 text blocks and
1295 lines. We manually segmented text regions, blocks and
lines. For each text region and block we created a single bi-
nary mask. Conversely, we produced a mask for each line of
text. In the case of lines or blocks, we used the constraint
that the segmented part must be an up-right rectangle. Fig. 7
shows an example of manually produced masks for a page
in the ground truth dataset. We did not mark as text one-line
capital letters (fig. 7(b)), since in our framework we consider
them as drawings, figures or ornaments (see also fig. 4(d)).
For the sake of simplicity, we omit to show the 44 masks
corresponding to the text lines, but they are created similarly
as the text block mask.
Then, we compare the ground truth (manually defined)
masks with those automatically computed by our algorithm.
For each pixel position k in the page we see if it is a true-
positive (TP), a false-positive (FP), or a false-negative (FN).
We analyze the pair(
pkm, pk
a
)
, where pkm and pk
a respectively
are the values of the manually and the automatically com-
puted mask: a true-positive (1,1) is a corrected segmented
pixel; a false-positive (0,1) is a pixel that is recognized as
text but it is not (also known as false alarm); a false-negative
(1,0) is a pixel that is marked wrong as non-text (also known
as miss). Table 1 shows the resulting numerical statistics, and
we report the corresponding Precision and Recall values as:{
Precision = T PT P+FP
Recall = T PT P+FN
(4)
The Precision means the probability that a randomly se-
lected pixel is relevant (TP), while the Recall is the prob-
ability that a randomly selected text atom (i.e., a pixel be-
longing to a text region, block or line) in the database will
be retrieved in a search. As we can see, all the values related
to regions and blocks are above 90%. For text lines we have
a very good Recall value (about 98%), but, since we apply a
conservative sub-image text line extraction (e.g., for applica-
tions as manuscript transcription or word-spotting), we lack
a high Precision value (about 70%).
The evaluation just described is only practical for a small
subset of images, while we would like to check all the thou-
sands images in our database. We employ a visual computer
assisted check. Since it is very difficult to visually estimate
the quality of the text region segmentation, we perform this
evaluation for text blocks and text lines only. In the first case,
for each page, the algorithm draws all the blocks within the
image; on the other hand, for each line it outputs an image
with a highlighted rectangular region that includes the single
extracted line. Both for blocks or lines, we visually inspect
them and manually mark them as TP, FP or FN; then we
compute the resulting Precision and Recall as in eq. 4. Al-
though this is a ON/OFF judgement, we can produce statis-
tics for a large number of pages (see Table 2 and 3). Com-
pared to the work of Pintus et al. [PYR14], our per-book
approach significantly increases the Recall value in the text
line segmentation. On the other hand, the Precision is less.
In fact, their per-page approach completely fails in pages
with non-regular text (fig. 9(d)), so it has a lot of missing
text lines (low Recall), but small number of false positives
(high Precision). Instead, our approach is able to analyze
those images, but, while it decreases the number of miss-
ing records, it produces some false alarms (fig. 9(d)). How-
ever, we can see how the fluctuation of the Precision value is
an acceptable outcome, compared with the obtained Recall
value, which is generally very closed to 100%. In some ap-
plications (e.g., transcription or word spotting), it is better to
have false alarms than missing text lines. The similar results
for text block segmentation show the reliability of the pro-
posed technique. In Table 2 we cannot compare the results
for MarstonMS22. It is a one column book with two pages
per image; since the lines from different pages are perfectly
aligned, Pintus et al. [PYR14] consider this to have a single
main text block per image, and extract two lines at a time. In
our work here we classify this as a two column book.
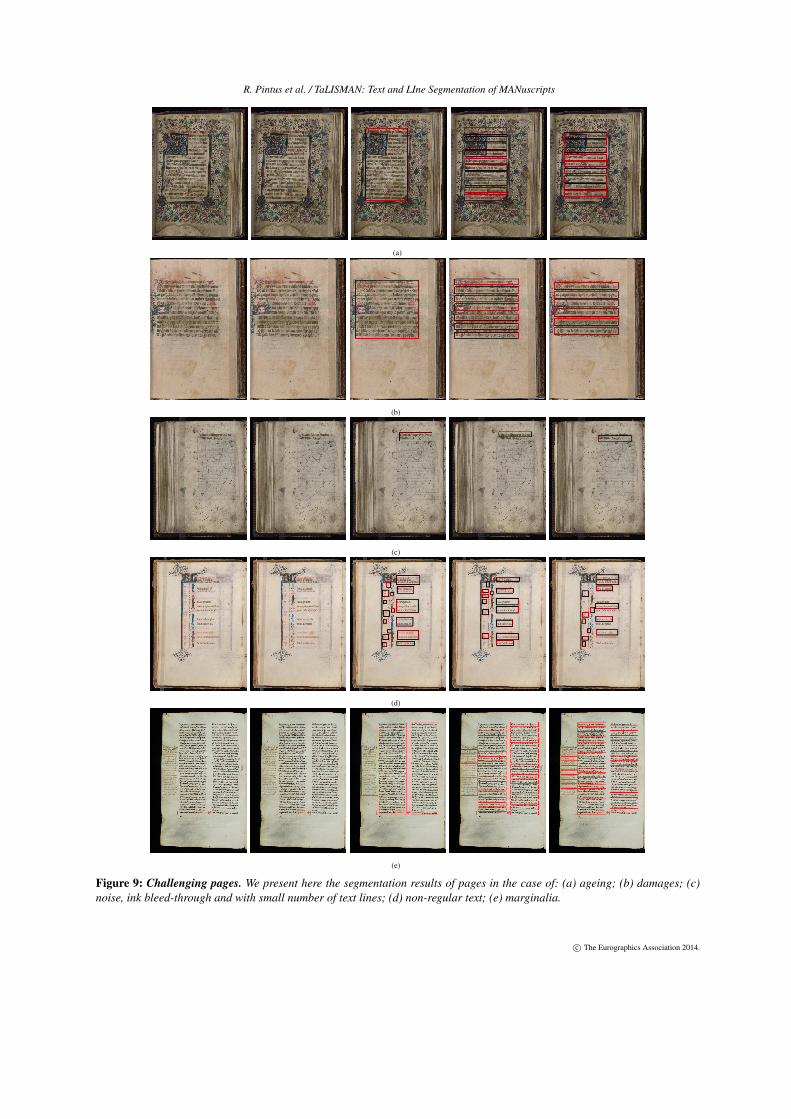
Pages in old books contain text in one or more colors,
capital letters with drawings, the parchment, other figures
or ornaments. Moreover, each image could contain acqui-
sition background, other visible parts of the book, and, in
some cases, rulers or other measurement tools. Fig. 8(a) and
8(b) are a typical complex but clear cases, where the pages
are well preserved and do not contain imperfections. On the
other hand, most of the problems arise when dealing with
more challenging pages. To appreciate the quality of our new
approach, we show here results related to pages affected by
significant ageing (fig. 9), and very bad preservation condi-
tions (fig. 9(b)), or with the presence of additional marginalia
(fig. 9(e)). Fig. 9(c) shows an extreme case, where the page
contains noise, few lines of text, a lot of added signs, and ink
bleed-through.
c© The Eurographics Association 2014.
R. Pintus et al. / TaLISMAN: Text and LIne Segmentation of MANuscripts
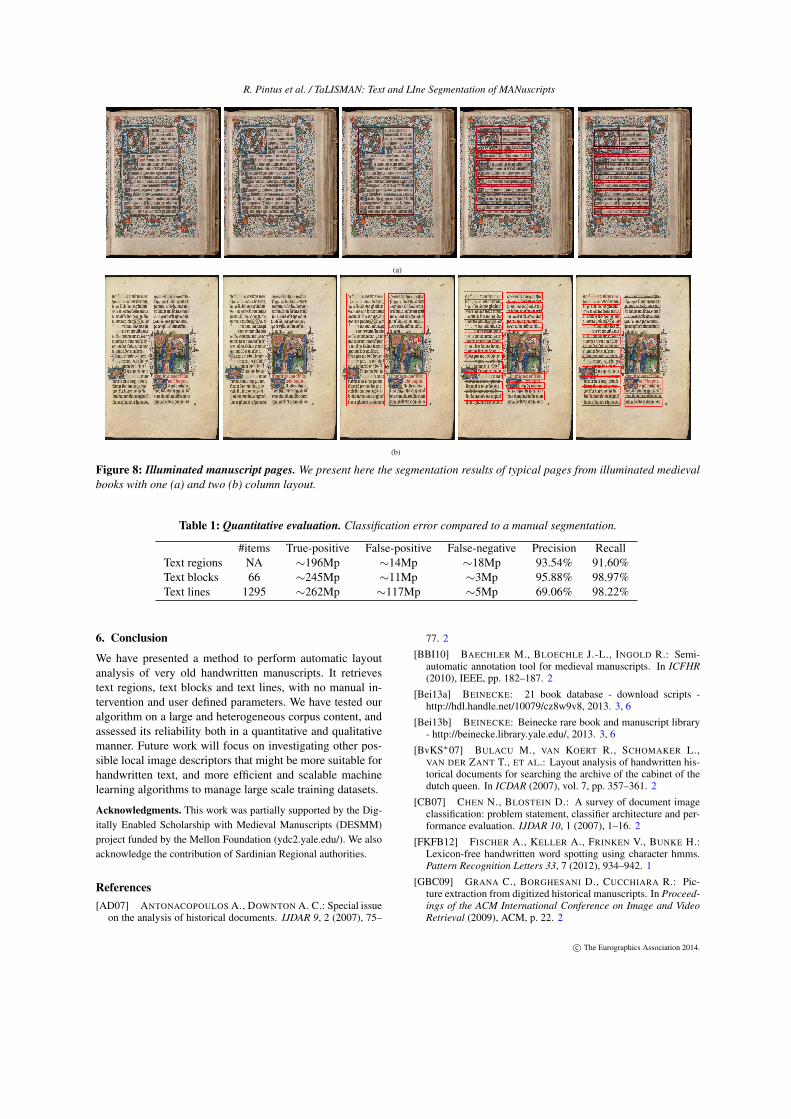
(a)
(b)
Figure 8: Illuminated manuscript pages. We present here the segmentation results of typical pages from illuminated medieval
books with one (a) and two (b) column layout.
Table 1: Quantitative evaluation. Classification error compared to a manual segmentation.
#items True-positive False-positive False-negative Precision Recall
Text regions NA ∼196Mp ∼14Mp ∼18Mp 93.54% 91.60%
Text blocks 66 ∼245Mp ∼11Mp ∼3Mp 95.88% 98.97%
Text lines 1295 ∼262Mp ∼117Mp ∼5Mp 69.06% 98.22%
6. Conclusion
We have presented a method to perform automatic layout
analysis of very old handwritten manuscripts. It retrieves
text regions, text blocks and text lines, with no manual in-
tervention and user defined parameters. We have tested our
algorithm on a large and heterogeneous corpus content, and
assessed its reliability both in a quantitative and qualitative
manner. Future work will focus on investigating other pos-
sible local image descriptors that might be more suitable for
handwritten text, and more efficient and scalable machine
learning algorithms to manage large scale training datasets.
Acknowledgments. This work was partially supported by the Dig-
itally Enabled Scholarship with Medieval Manuscripts (DESMM)
project funded by the Mellon Foundation (ydc2.yale.edu/). We also
acknowledge the contribution of Sardinian Regional authorities.
References
[AD07] ANTONACOPOULOS A., DOWNTON A. C.: Special issueon the analysis of historical documents. IJDAR 9, 2 (2007), 75–
77. 2
[BBI10] BAECHLER M., BLOECHLE J.-L., INGOLD R.: Semi-automatic annotation tool for medieval manuscripts. In ICFHR
(2010), IEEE, pp. 182–187. 2
[Bei13a] BEINECKE: 21 book database - download scripts -http://hdl.handle.net/10079/cz8w9v8, 2013. 3, 6
[Bei13b] BEINECKE: Beinecke rare book and manuscript library- http://beinecke.library.yale.edu/, 2013. 3, 6
[BvKS∗07] BULACU M., VAN KOERT R., SCHOMAKER L.,VAN DER ZANT T., ET AL.: Layout analysis of handwritten his-torical documents for searching the archive of the cabinet of thedutch queen. In ICDAR (2007), vol. 7, pp. 357–361. 2
[CB07] CHEN N., BLOSTEIN D.: A survey of document imageclassification: problem statement, classifier architecture and per-formance evaluation. IJDAR 10, 1 (2007), 1–16. 2
[FKFB12] FISCHER A., KELLER A., FRINKEN V., BUNKE H.:Lexicon-free handwritten word spotting using character hmms.Pattern Recognition Letters 33, 7 (2012), 934–942. 1
[GBC09] GRANA C., BORGHESANI D., CUCCHIARA R.: Pic-ture extraction from digitized historical manuscripts. In Proceed-
ings of the ACM International Conference on Image and Video
Retrieval (2009), ACM, p. 22. 2
c© The Eurographics Association 2014.
R. Pintus et al. / TaLISMAN: Text and LIne Segmentation of MANuscripts
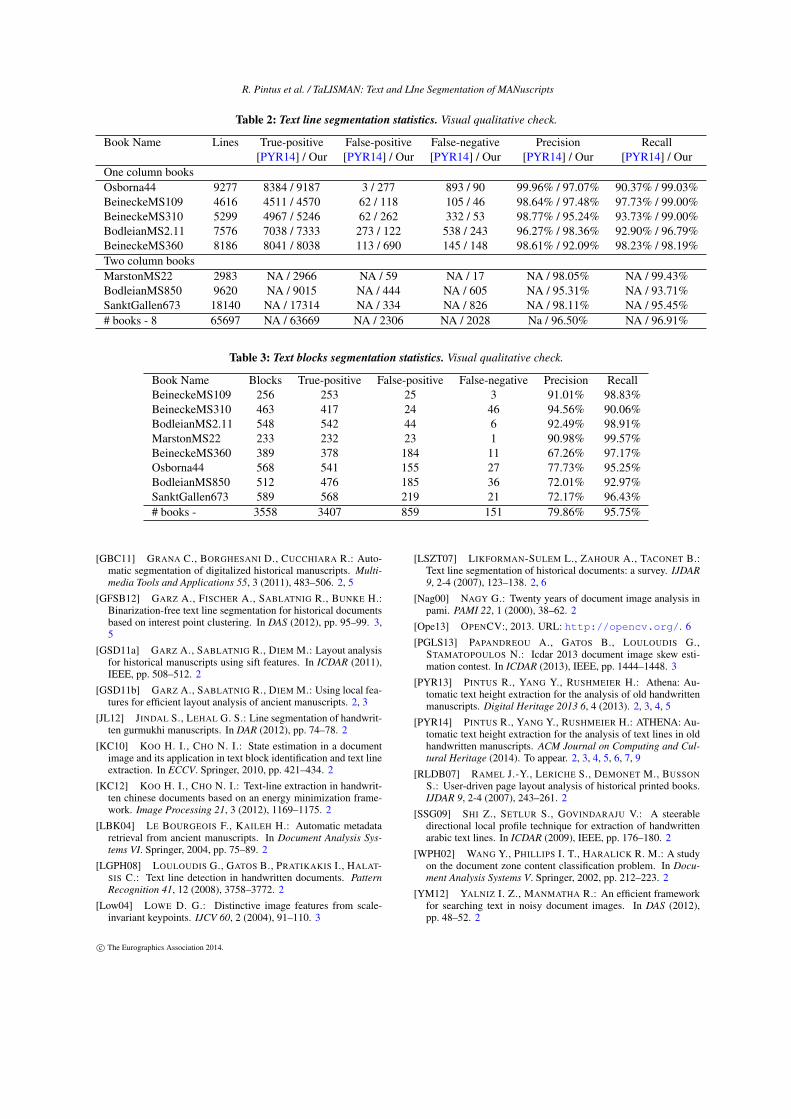
Table 2: Text line segmentation statistics. Visual qualitative check.
Book Name Lines True-positive False-positive False-negative Precision Recall
[PYR14] / Our [PYR14] / Our [PYR14] / Our [PYR14] / Our [PYR14] / Our
One column books
Osborna44 9277 8384 / 9187 3 / 277 893 / 90 99.96% / 97.07% 90.37% / 99.03%
BeineckeMS109 4616 4511 / 4570 62 / 118 105 / 46 98.64% / 97.48% 97.73% / 99.00%
BeineckeMS310 5299 4967 / 5246 62 / 262 332 / 53 98.77% / 95.24% 93.73% / 99.00%
BodleianMS2.11 7576 7038 / 7333 273 / 122 538 / 243 96.27% / 98.36% 92.90% / 96.79%
BeineckeMS360 8186 8041 / 8038 113 / 690 145 / 148 98.61% / 92.09% 98.23% / 98.19%
Two column books
MarstonMS22 2983 NA / 2966 NA / 59 NA / 17 NA / 98.05% NA / 99.43%
BodleianMS850 9620 NA / 9015 NA / 444 NA / 605 NA / 95.31% NA / 93.71%
SanktGallen673 18140 NA / 17314 NA / 334 NA / 826 NA / 98.11% NA / 95.45%
# books - 8 65697 NA / 63669 NA / 2306 NA / 2028 Na / 96.50% NA / 96.91%
Table 3: Text blocks segmentation statistics. Visual qualitative check.
Book Name Blocks True-positive False-positive False-negative Precision Recall
BeineckeMS109 256 253 25 3 91.01% 98.83%
BeineckeMS310 463 417 24 46 94.56% 90.06%
BodleianMS2.11 548 542 44 6 92.49% 98.91%
MarstonMS22 233 232 23 1 90.98% 99.57%
BeineckeMS360 389 378 184 11 67.26% 97.17%
Osborna44 568 541 155 27 77.73% 95.25%
BodleianMS850 512 476 185 36 72.01% 92.97%
SanktGallen673 589 568 219 21 72.17% 96.43%
# books - 3558 3407 859 151 79.86% 95.75%
[GBC11] GRANA C., BORGHESANI D., CUCCHIARA R.: Auto-matic segmentation of digitalized historical manuscripts. Multi-
media Tools and Applications 55, 3 (2011), 483–506. 2, 5
[GFSB12] GARZ A., FISCHER A., SABLATNIG R., BUNKE H.:Binarization-free text line segmentation for historical documentsbased on interest point clustering. In DAS (2012), pp. 95–99. 3,5
[GSD11a] GARZ A., SABLATNIG R., DIEM M.: Layout analysisfor historical manuscripts using sift features. In ICDAR (2011),IEEE, pp. 508–512. 2
[GSD11b] GARZ A., SABLATNIG R., DIEM M.: Using local fea-tures for efficient layout analysis of ancient manuscripts. 2, 3
[JL12] JINDAL S., LEHAL G. S.: Line segmentation of handwrit-ten gurmukhi manuscripts. In DAR (2012), pp. 74–78. 2
[KC10] KOO H. I., CHO N. I.: State estimation in a documentimage and its application in text block identification and text lineextraction. In ECCV. Springer, 2010, pp. 421–434. 2
[KC12] KOO H. I., CHO N. I.: Text-line extraction in handwrit-ten chinese documents based on an energy minimization frame-work. Image Processing 21, 3 (2012), 1169–1175. 2
[LBK04] LE BOURGEOIS F., KAILEH H.: Automatic metadataretrieval from ancient manuscripts. In Document Analysis Sys-
tems VI. Springer, 2004, pp. 75–89. 2
[LGPH08] LOULOUDIS G., GATOS B., PRATIKAKIS I., HALAT-SIS C.: Text line detection in handwritten documents. Pattern
Recognition 41, 12 (2008), 3758–3772. 2
[Low04] LOWE D. G.: Distinctive image features from scale-invariant keypoints. IJCV 60, 2 (2004), 91–110. 3
[LSZT07] LIKFORMAN-SULEM L., ZAHOUR A., TACONET B.:Text line segmentation of historical documents: a survey. IJDAR
9, 2-4 (2007), 123–138. 2, 6
[Nag00] NAGY G.: Twenty years of document image analysis inpami. PAMI 22, 1 (2000), 38–62. 2
[Ope13] OPENCV:, 2013. URL: http://opencv.org/. 6
[PGLS13] PAPANDREOU A., GATOS B., LOULOUDIS G.,STAMATOPOULOS N.: Icdar 2013 document image skew esti-mation contest. In ICDAR (2013), IEEE, pp. 1444–1448. 3
[PYR13] PINTUS R., YANG Y., RUSHMEIER H.: Athena: Au-tomatic text height extraction for the analysis of old handwrittenmanuscripts. Digital Heritage 2013 6, 4 (2013). 2, 3, 4, 5
[PYR14] PINTUS R., YANG Y., RUSHMEIER H.: ATHENA: Au-tomatic text height extraction for the analysis of text lines in oldhandwritten manuscripts. ACM Journal on Computing and Cul-
tural Heritage (2014). To appear. 2, 3, 4, 5, 6, 7, 9
[RLDB07] RAMEL J.-Y., LERICHE S., DEMONET M., BUSSON
S.: User-driven page layout analysis of historical printed books.IJDAR 9, 2-4 (2007), 243–261. 2
[SSG09] SHI Z., SETLUR S., GOVINDARAJU V.: A steerabledirectional local profile technique for extraction of handwrittenarabic text lines. In ICDAR (2009), IEEE, pp. 176–180. 2
[WPH02] WANG Y., PHILLIPS I. T., HARALICK R. M.: A studyon the document zone content classification problem. In Docu-
ment Analysis Systems V. Springer, 2002, pp. 212–223. 2
[YM12] YALNIZ I. Z., MANMATHA R.: An efficient frameworkfor searching text in noisy document images. In DAS (2012),pp. 48–52. 2
c© The Eurographics Association 2014.
R. Pintus et al. / TaLISMAN: Text and LIne Segmentation of MANuscripts
(a)
(b)
(c)
(d)
(e)
Figure 9: Challenging pages. We present here the segmentation results of pages in the case of: (a) ageing; (b) damages; (c)
noise, ink bleed-through and with small number of text lines; (d) non-regular text; (e) marginalia.
c© The Eurographics Association 2014.


![A TaLISMAN: Automatic Text and LIne Segmentation of ...R. Pintus et al. / TaLISMAN: Text and LIne Segmentation of MANuscripts book [PYR13], and on a class of text recognition meth-ods](https://img.pdfslide.us/doc/110x75/5e2f29004803bb4bc80d8655/a-talisman-automatic-text-and-line-segmentation-of-r-pintus-et-al-talisman.jpg)