Embed Size (px)
Citation preview
A Tale of Two Audiences Understanding the Locus of Who Supports/Visits
the Museum
Prepared for
The Cummer Museum of Art and Gardens
Northeast Florida Center for Community Initiatives Department of Sociology and Anthropology
University of North Florida
Jeffry A. Will, Director and Professor of Sociology
Jason Slappe, Senior Research Assistant Timothy Cheney, Assistant Director
Tracy Milligan, Assistant Director
July 2013
1 | P a g e
OVERVIEW ..................................................................................................................................................... 2
LITERATURE REVIEW ..................................................................................................................................... 2
Introduction .............................................................................................................................................. 2
Marketing and Service Orientation ......................................................................................................... 2
Motivating People to Attend ................................................................................................................... 3
Why Not Visit a Museum? ....................................................................................................................... 3
Pricing ....................................................................................................................................................... 4
Summary ................................................................................................................................................... 4
METHODS ...................................................................................................................................................... 4
PART I: PHONE SURVEY ................................................................................................................................. 8
Recognition ............................................................................................................................................... 8
Interest ................................................................................................................................................... 11
Motivation .............................................................................................................................................. 13
Lifestyle ................................................................................................................................................... 15
Part II: FRIENDS AND FAMILY INTERNET SURVEY ....................................................................................... 16
Recognition ............................................................................................................................................. 16
Interest ................................................................................................................................................... 19
Motivation .............................................................................................................................................. 22
Lifestyle ................................................................................................................................................... 25
QUALITATIVE - PHONE SURVEY .................................................................................................................. 26
When you think of an ‘art museum’, what is the first thing that comes to mind? ............................. 26
QUALITATIVE – FRIENDS AND FAMILY INTERNET SURVEY ........................................................................ 28
When you think of an ‘art museum’, what is the first thing that comes to mind? ............................. 28
Why did you first visit The Cummer? .................................................................................................... 29
If you could change one thing about The Cummer, what would it be? ............................................... 30
If you were talking with someone who had never visited The Cummer, how would you briefly describe the museum to them? ............................................................................................................. 31
What motivated you to become a member of The Cummer? .............................................................. 32
DISCUSSION AND CONCLUSION .................................................................................................................. 33
2 | P a g e
OVERVIEW The Cummer Museum of Art & Gardens is the largest fine arts museum in northeast Florida, and it has been committed to engaging the community through arts and culture for over 50 years. Recently, The Cummer Museum Strategic Planning Task Force looked for assistance in understanding who visits The Cummer and how frequently they choose to visit. To this end, the Strategic Planning group commissioned the Northeast Florida Center for Community Initiatives to research what The Cummer can do with “audience development.” The goal of the research was to explore recognition of The Cummer Museum, community interest in its offerings, and the motivation of community members to attend art and cultural events.
LITERATURE REVIEW Introduction
Research and academic studies examining museum attendance has become more prevalent in recent decades as the role of museums in society has evolved. The function of museums has shifted from a storage location for fine arts and artifacts to an outlet for individuals to spend their leisure time. Museums must now focus less on their collections and more on the needs of visitors (Harrison and Shaw, 2004).
Increased resources are needed for museums to compete in the market for the public’s leisure time. Museums are mainly non-profit organizations that rely on public funding, and since the 1980s, public funding has been declining (Ballantyne and Uzell, 2011). The decline in public funding combined with the need for more resources to compete for visitors has led many museums to explore ways to increase attendance (Camarero and Garrido, 2012).
Marketing and Service Orientation
In looking for ways to increase attendance, many museums are now employing marketing strategies and service-oriented approaches to draw in customers (Camarero and Garrido, 2012; Rentschler, 2002). It is critical for museums to understand the demographics, incentives, and price levels that influence the choice to visit or revisit a cultural attraction as they compete for customer’s leisure time (Burton, Louviere, and Young, 2008). From this emerges the need for visitor-based research studies (Weil; 2000). Unlike for-profit leisure attractions that use marketing to increase profitability, museums and other non-profits should focus on improving the customer experience in order to increase visitation (Thyne, 2000). Along with demographic characteristics, museums need to be concerned with understanding the diverse needs of customers, innovating new delivery methods, and providing incentives to revisit. Marketing
3 | P a g e
research for museums allows the organizations to understand who is visiting and why they choose to visit a cultural attraction.
Motivating People to Attend
The literature on what motivates people to visit cultural attractions suggests there are a number of important considerations. At the individual level, motivation to participate in certain leisure activities has been attributed to three main factors: learning, social/family interaction, and escapism (Slater, 2006; Slater and Armstrong, 2010). Escapism, which is the need to experience something enjoyable outside of home or work, is the strongest of these factors. Family influences have been shown to be particularly important if the child in the family has previously visited the museum or been referred to the museum by a teacher as part of a school activity (Slater, 2006; Yeh and Lin, 2005). Museum programming also influences the motivation to attend, and temporary exhibitions are the most likely to bring in new visitors or to encourage someone to revisit (Brida, 2011). The literature outlines three types of museum visitors: frequent, occasional, and non-visitors (Lam, 2004). Understanding the needs of infrequent visitors and non-visitors can be especially important in building a larger audience (Miller, 2011).
To increase museum attendance, marketing attempts and programming should focus on meeting the experiential needs of visitors and non-visitors (Harrison and Shaw, 2004; Dirseham and Yalcim, 2011). Experience satisfaction is strongly correlated with satisfaction of visiting (Harrison and Shaw, 2004). A recurrent suggestion in the literature is to supplement the museum experience with technology to add depth to exhibits (Goulding, 1999; Hume and Mils, 2011). For example, RFID tags and NFC technology can be used in conjunction with visitors’ mobile phones to provide additional context to exhibits such as background details and photos. This technology can also be positioned in other museum areas to direct visitors to membership details, incentives toward future visits, or an online survey. Periodic online surveys are a useful tool to continually monitor the changing preferences of visitors (Miller, 2011).
Why Not Visit a Museum?
Understanding the barriers to museum attendance is equally as important as understanding the motivation to visit. A survey of visitors and non-visitors revealed that the two groups have very different reasons for why they have not attended or revisited a museum. For visitors, the top two reasons for not visiting a museum were cost and distance. Non-visitors main reasons for not visiting were lack of time, lack of interest, or not knowing that the museum exists or what content it offers (Mokhtar, 2011; Lam, 2004; Linton, 1992). Another influence for why people visit or revisit a museum relates to pricing and perceived value.
4 | P a g e
Pricing
Price setting for museums affects revenues through membership dues and visitation, and the literature suggests some useful strategies that are applicable to art museums such as The Cummer. Prices should be set to meet the different needs of members, visitors, and non-visitors. Segmented pricing can be used for membership and entry fees (Rentschler, Hede, and White, 2011; Lampi and Orth, 2009). Membership fees should take into account that some members view museum membership as a charitable donation placing little emphasis on visitation, while others seek utility and value in membership. Membership fees, as well as entry price, should also target the needs of groups that are underrepresented in museum visitors. Specific examples from the literature suggest that price is mainly a barrier for families, low-income groups, and young people (Jun, Kyle, and O’Leary, 2008; Mohktar and Asim, 2011).
Perceived value is also a large determinant in influencing whether someone revisits a museum (Burton, Louviere, and Young, 2009). Suggestions for increasing perceived value include earning membership for visiting a given number of days within a certain time period or allowing reentry into the museum within a given number of days. Research has shown that there is a strong indication that visitors should be rewarded for visiting frequently (Burton, Louviere, and Young, 2009).
Summary
Marketing in museums has become more important in order for them to gain competitive advantage in the market for leisure time activities (McLean, 1995; Rentschler, 2002; Miller, 2011). Marketing and programming should be focused on gaining attendance from groups outside the typical museum visitor. The typical museum or consumer of ‘culture’ being educated, high income, older women (Bourdieu, 1991; Harrison and Shaw, 2004). By focusing on market orientation and the experiential needs of different visitors, museums can increase revenues while still maintaining their artistic integrity (Sorjonen, 2011).
METHODS Two different survey methods were used to gain community input concerning recognition of The Cummer and its offerings, as well as what might lead people to attend more often. First, a phone survey was conducted to poll people who had never heard of The Cummer or who had not visited in more than two years. The phone survey questions focused on general statements about arts and culture, art museum content and preferred use of leisure time. Phone surveys were conducted with residents of Northeast Florida in April of 2013, with each survey averaging about 15 minutes in length. A sample of phone numbers from Jacksonville and the areas surrounding the city including Fernandina, Ponte Vedra, Julington Creek, and Orange Park was chosen in order to align with the demographics of regular
5 | P a g e
Cummer museum attendance. Overall, 2,221 calls were made that resulted in a conversation with an individual. Of those calls, 1,256 individuals declined to participate in the survey, 91 respondents did not complete the survey, and another 363 respondents did not qualify because they had visited The Cummer within the last two years. The 511 completed surveys represent a response rate of approximately 27.5 percent.
The second survey method consisted of an online survey distributed to the roughly 6,700 individuals on The Cummer’s friends and family email list. Since this survey was only sent to those who have attended The Cummer, the interview questions focused on content specific to The Cummer, as well as some more generalized questions similar to those used in the phone survey. The online survey was distributed via email from April 2013 through May 2013. The intended goal of this survey was to get more direct feedback from members and guests of The Cummer that can be used to inform the Strategic Planning group. Approximately 13 percent of those contacted via email responded to the survey.
Overall, there were 511 completed phone surveys and 859 surveys completed online. A good portion of the analysis for the phone survey compares the differences between those who had heard of or visited The Cummer and those who had never heard of nor visited The Cummer. Where applicable, statistical analysis of the data was conducted using the Chi-square test of a contingency table, which measures the extent to which two variables are statistically correlated. Data for the friends and family internet survey uses this same statistical test to compare members with non-members. Data analysis of the internet survey was conducted to explain how individuals view the museum and its offerings, as well as how individuals prefer to spend their leisure time.
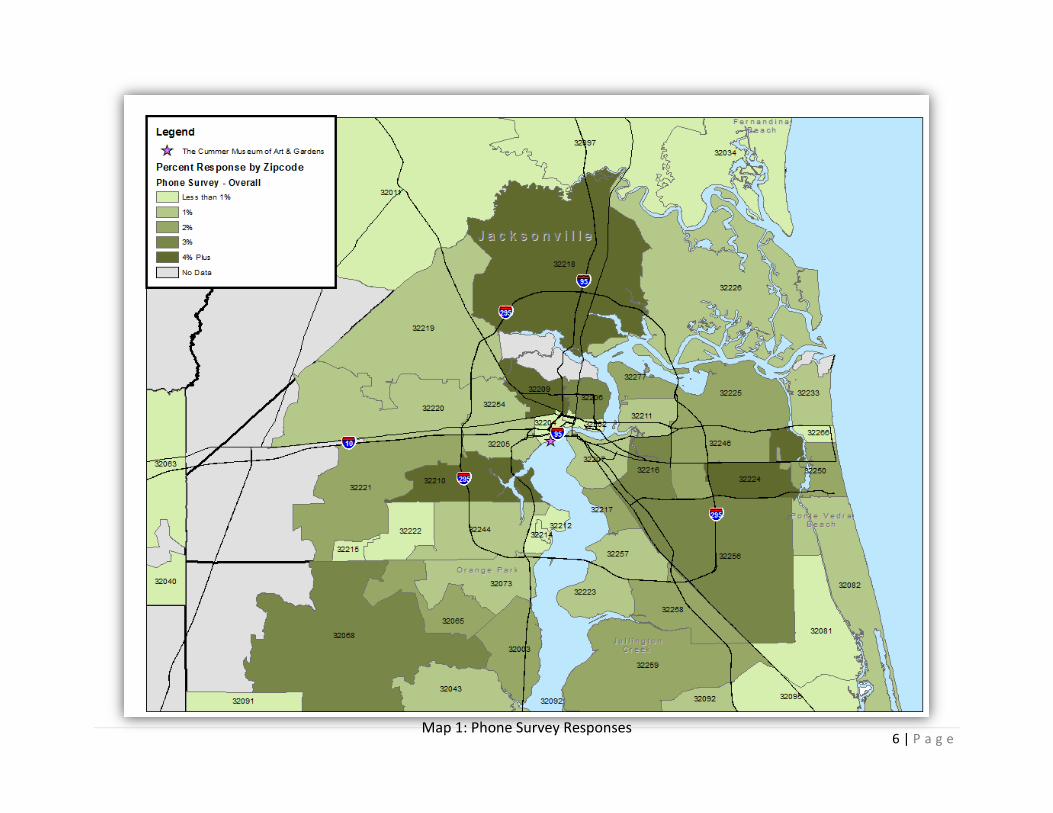
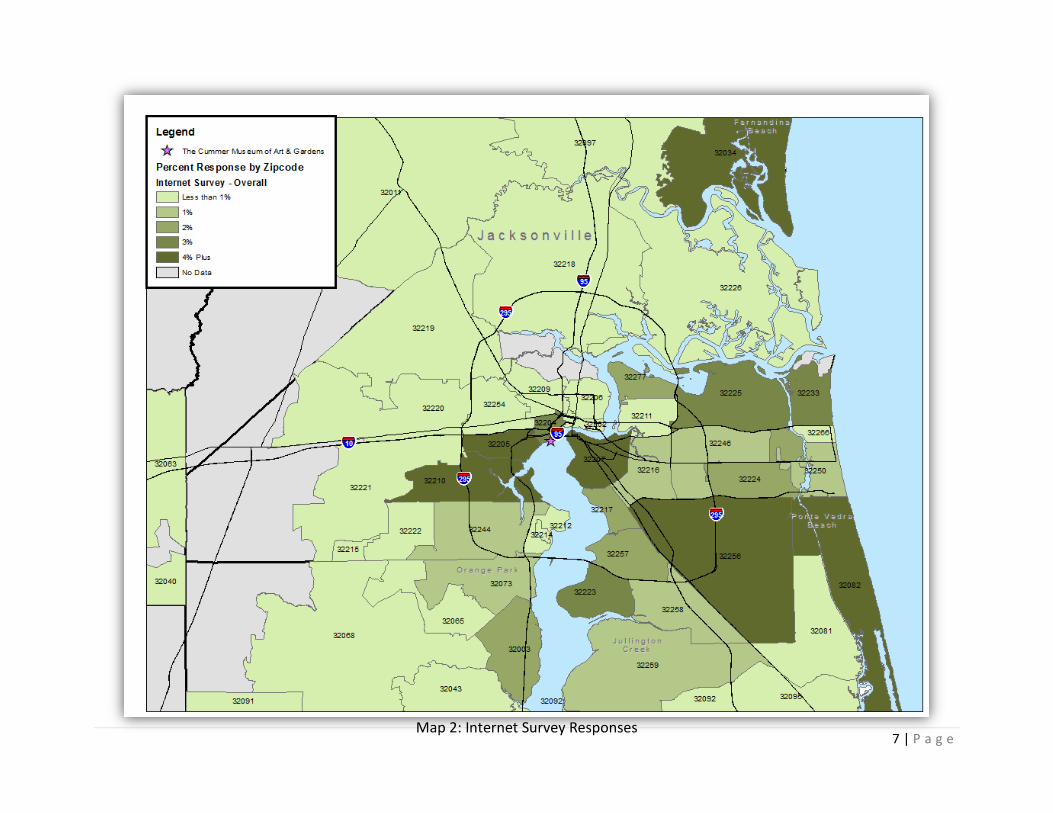
The distribution of responses for both the phone and internet surveys can be seen in MAPS 1 & 2 below.
6 | P a g e
Map 1: Phone Survey Responses
7 | P a g e
Map 2: Internet Survey Responses
8 | P a g e
PART I: PHONE SURVEY Recognition
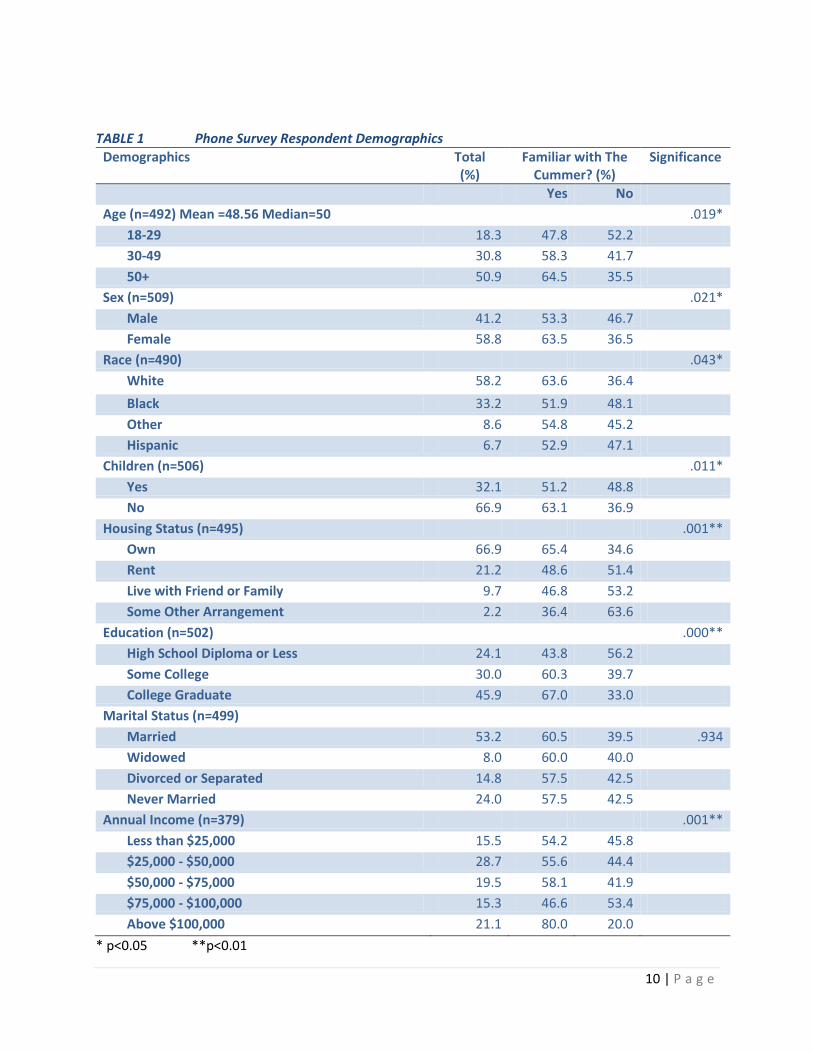
Demographic data, as seen in Table 1 below, was collected to explore how different groups respond to the questions in the survey, and how respondent characteristics are related to whether one was at least familiar with The Cummer. The sample population is for the most part representative of the Jacksonville community with a few exceptions. The phone respondents were slightly older (median age = 50 years) than the general population (median age = 42 years1). The percent of female respondents (58.8 percent) was slightly higher than the percent of females in the overall population (51.5 percent). College graduates were also more represented in the sample with 45.9 percent reporting a Bachelor’s degree or higher, while only around 21.1 percent in the Jacksonville population as a whole have a Bachelor’s degree or higher.
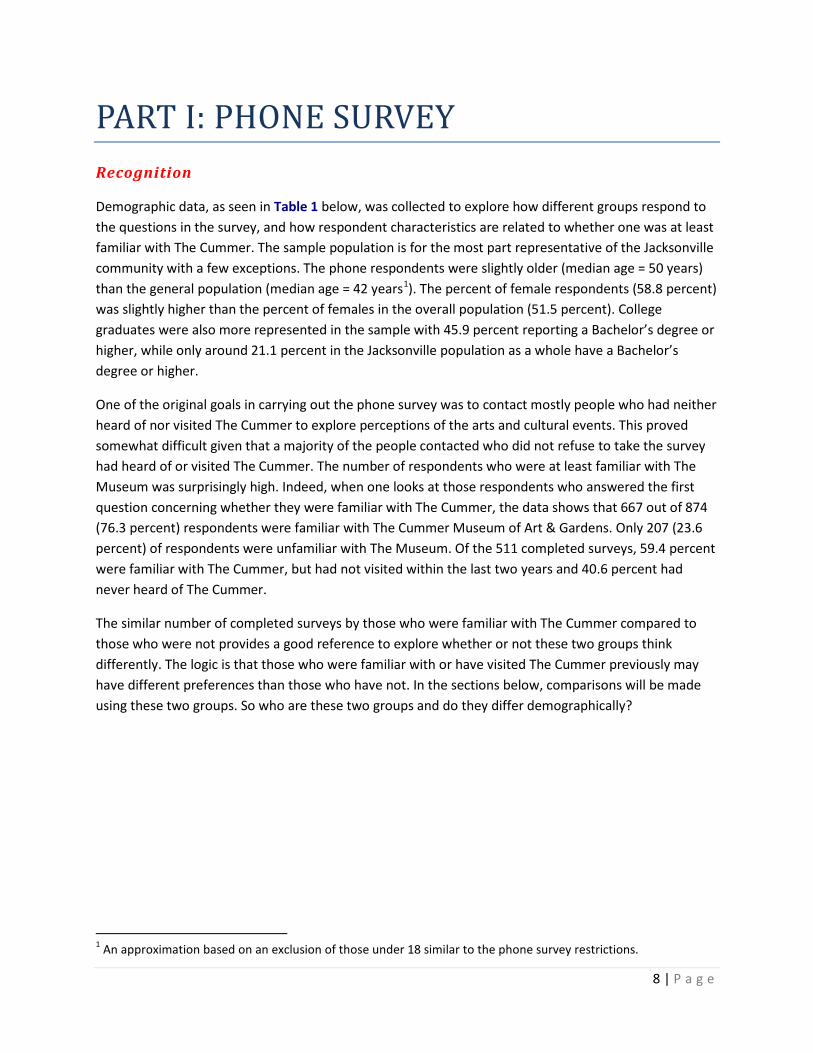
One of the original goals in carrying out the phone survey was to contact mostly people who had neither heard of nor visited The Cummer to explore perceptions of the arts and cultural events. This proved somewhat difficult given that a majority of the people contacted who did not refuse to take the survey had heard of or visited The Cummer. The number of respondents who were at least familiar with The Museum was surprisingly high. Indeed, when one looks at those respondents who answered the first question concerning whether they were familiar with The Cummer, the data shows that 667 out of 874 (76.3 percent) respondents were familiar with The Cummer Museum of Art & Gardens. Only 207 (23.6 percent) of respondents were unfamiliar with The Museum. Of the 511 completed surveys, 59.4 percent were familiar with The Cummer, but had not visited within the last two years and 40.6 percent had never heard of The Cummer.
The similar number of completed surveys by those who were familiar with The Cummer compared to those who were not provides a good reference to explore whether or not these two groups think differently. The logic is that those who were familiar with or have visited The Cummer previously may have different preferences than those who have not. In the sections below, comparisons will be made using these two groups. So who are these two groups and do they differ demographically?
1 An approximation based on an exclusion of those under 18 similar to the phone survey restrictions.
9 | P a g e
When one examines Table 1 more closely, one finds some statistically significant differences when comparing those who were familiar with The Cummer to those who were not. Generally speaking, those who were familiar with The Cummer were more likely to be older (30+), female, white, and college educated (undergraduate or postgraduate). Familiarity of the Cummer is also significantly higher among respondents who own their home, as well as with respondents with higher incomes, households with children were also less likely to have heard of or visited The Cummer. However, this could be related to the age of respondents, since older respondents were more likely to have heard of The Cummer. This group would be less likely to still have children in the home. There were no differences in one’s familiarity with the Cummer when examining marital status.
Those who were familiar with The Cummer were less likely to have children in the home. However, this is likely age related. People 50 or older were more likely to have heard of The Cummer. Respondents aged 18-29 were the group least likely to be familiar with The Cummer. People who own their home were more likely to have heard of The Cummer than those who rent.
59%
41%
Familiar with the Cummer? n = 511
Familiar Not familiar
10 | P a g e
TABLE 1 Phone Survey Respondent Demographics Demographics Total
(%) Familiar with The
Cummer? (%) Significance
Yes No Age (n=492) Mean =48.56 Median=50 .019*
18-29 18.3 47.8 52.2 30-49 30.8 58.3 41.7 50+ 50.9 64.5 35.5
Sex (n=509) .021* Male 41.2 53.3 46.7 Female 58.8 63.5 36.5
Race (n=490) .043* White 58.2 63.6 36.4 Black 33.2 51.9 48.1 Other 8.6 54.8 45.2 Hispanic 6.7 52.9 47.1
Children (n=506) .011* Yes 32.1 51.2 48.8 No 66.9 63.1 36.9
Housing Status (n=495) .001** Own 66.9 65.4 34.6 Rent 21.2 48.6 51.4 Live with Friend or Family 9.7 46.8 53.2 Some Other Arrangement 2.2 36.4 63.6
Education (n=502) .000** High School Diploma or Less 24.1 43.8 56.2 Some College 30.0 60.3 39.7 College Graduate 45.9 67.0 33.0
Marital Status (n=499) Married 53.2 60.5 39.5 .934 Widowed 8.0 60.0 40.0 Divorced or Separated 14.8 57.5 42.5 Never Married 24.0 57.5 42.5
Annual Income (n=379) .001** Less than $25,000 15.5 54.2 45.8 $25,000 - $50,000 28.7 55.6 44.4 $50,000 - $75,000 19.5 58.1 41.9 $75,000 - $100,000 15.3 46.6 53.4 Above $100,000 21.1 80.0 20.0
* p<0.05 **p<0.01
11 | P a g e
Interest
Along with exploring recognition of The Cummer as a community fixture, respondents were asked about their interest, in general, of art exhibitions typically offered by The Museum, as well as their general interest in arts and culture. The main goal of these questions was to establish how much interest currently exists in the specific programming offered by The Cummer. The second goal is to capture how respondents prefer to consume art and cultural activities in order to inform how museum content is delivered. The results suggest that there is a great deal of interest in exhibitions found at The Cummer, and respondents’ preferences for viewing arts and cultural activities provide suggestions on how The Cummer can structure programming.
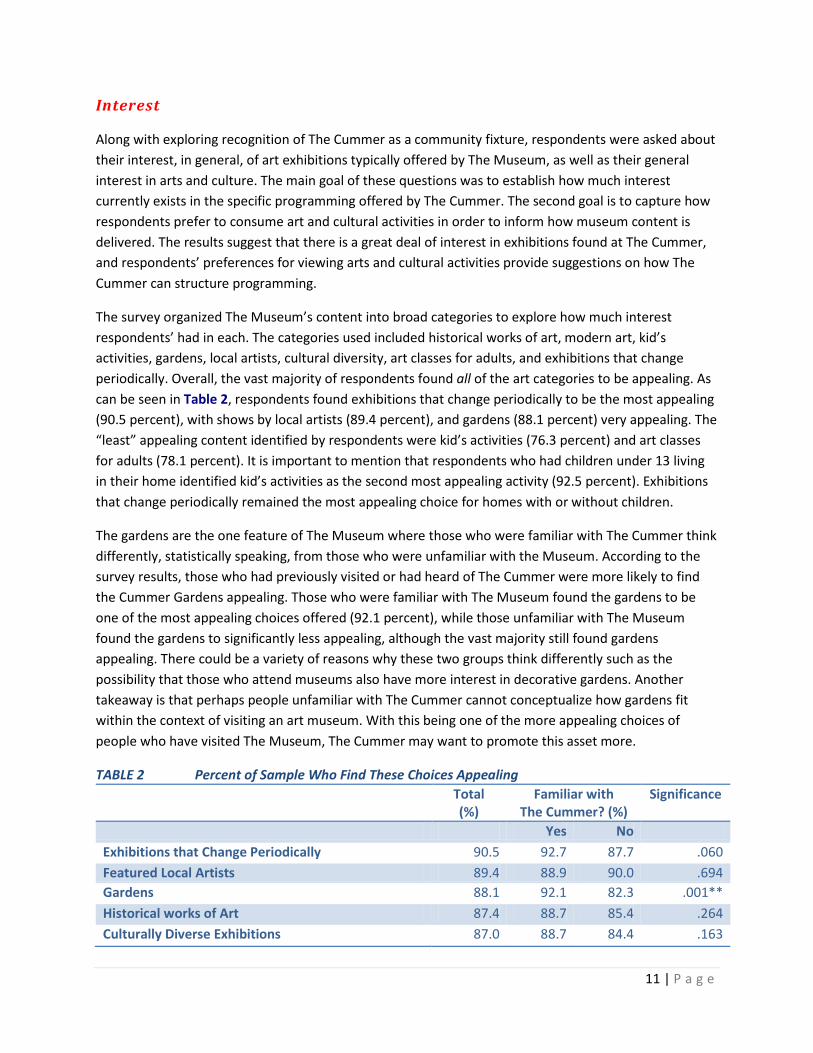
The survey organized The Museum’s content into broad categories to explore how much interest respondents’ had in each. The categories used included historical works of art, modern art, kid’s activities, gardens, local artists, cultural diversity, art classes for adults, and exhibitions that change periodically. Overall, the vast majority of respondents found all of the art categories to be appealing. As can be seen in Table 2, respondents found exhibitions that change periodically to be the most appealing (90.5 percent), with shows by local artists (89.4 percent), and gardens (88.1 percent) very appealing. The “least” appealing content identified by respondents were kid’s activities (76.3 percent) and art classes for adults (78.1 percent). It is important to mention that respondents who had children under 13 living in their home identified kid’s activities as the second most appealing activity (92.5 percent). Exhibitions that change periodically remained the most appealing choice for homes with or without children.
The gardens are the one feature of The Museum where those who were familiar with The Cummer think differently, statistically speaking, from those who were unfamiliar with the Museum. According to the survey results, those who had previously visited or had heard of The Cummer were more likely to find the Cummer Gardens appealing. Those who were familiar with The Museum found the gardens to be one of the most appealing choices offered (92.1 percent), while those unfamiliar with The Museum found the gardens to significantly less appealing, although the vast majority still found gardens appealing. There could be a variety of reasons why these two groups think differently such as the possibility that those who attend museums also have more interest in decorative gardens. Another takeaway is that perhaps people unfamiliar with The Cummer cannot conceptualize how gardens fit within the context of visiting an art museum. With this being one of the more appealing choices of people who have visited The Museum, The Cummer may want to promote this asset more.
TABLE 2 Percent of Sample Who Find These Choices Appealing Total
(%) Familiar with
The Cummer? (%) Significance
Yes No Exhibitions that Change Periodically 90.5 92.7 87.7 .060 Featured Local Artists 89.4 88.9 90.0 .694 Gardens 88.1 92.1 82.3 .001** Historical works of Art 87.4 88.7 85.4 .264 Culturally Diverse Exhibitions 87.0 88.7 84.4 .163
12 | P a g e
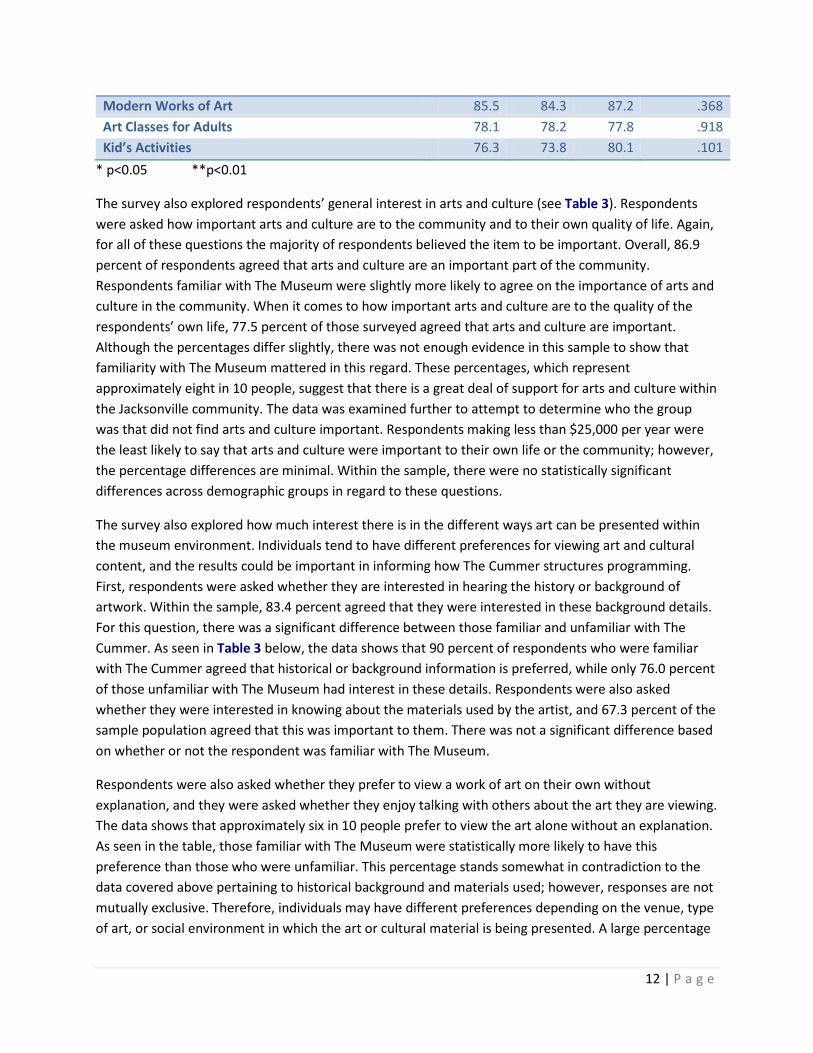
Modern Works of Art 85.5 84.3 87.2 .368 Art Classes for Adults 78.1 78.2 77.8 .918 Kid’s Activities 76.3 73.8 80.1 .101
* p<0.05 **p<0.01
The survey also explored respondents’ general interest in arts and culture (see Table 3). Respondents were asked how important arts and culture are to the community and to their own quality of life. Again, for all of these questions the majority of respondents believed the item to be important. Overall, 86.9 percent of respondents agreed that arts and culture are an important part of the community. Respondents familiar with The Museum were slightly more likely to agree on the importance of arts and culture in the community. When it comes to how important arts and culture are to the quality of the respondents’ own life, 77.5 percent of those surveyed agreed that arts and culture are important. Although the percentages differ slightly, there was not enough evidence in this sample to show that familiarity with The Museum mattered in this regard. These percentages, which represent approximately eight in 10 people, suggest that there is a great deal of support for arts and culture within the Jacksonville community. The data was examined further to attempt to determine who the group was that did not find arts and culture important. Respondents making less than $25,000 per year were the least likely to say that arts and culture were important to their own life or the community; however, the percentage differences are minimal. Within the sample, there were no statistically significant differences across demographic groups in regard to these questions.
The survey also explored how much interest there is in the different ways art can be presented within the museum environment. Individuals tend to have different preferences for viewing art and cultural content, and the results could be important in informing how The Cummer structures programming. First, respondents were asked whether they are interested in hearing the history or background of artwork. Within the sample, 83.4 percent agreed that they were interested in these background details. For this question, there was a significant difference between those familiar and unfamiliar with The Cummer. As seen in Table 3 below, the data shows that 90 percent of respondents who were familiar with The Cummer agreed that historical or background information is preferred, while only 76.0 percent of those unfamiliar with The Museum had interest in these details. Respondents were also asked whether they were interested in knowing about the materials used by the artist, and 67.3 percent of the sample population agreed that this was important to them. There was not a significant difference based on whether or not the respondent was familiar with The Museum.
Respondents were also asked whether they prefer to view a work of art on their own without explanation, and they were asked whether they enjoy talking with others about the art they are viewing. The data shows that approximately six in 10 people prefer to view the art alone without an explanation. As seen in the table, those familiar with The Museum were statistically more likely to have this preference than those who were unfamiliar. This percentage stands somewhat in contradiction to the data covered above pertaining to historical background and materials used; however, responses are not mutually exclusive. Therefore, individuals may have different preferences depending on the venue, type of art, or social environment in which the art or cultural material is being presented. A large percentage
13 | P a g e
(79.1 percent) of the sample population agreed that they enjoy talking with others about the art they are viewing. Respondents familiar with The Cummer were statistically more likely to agree that they enjoy discussing art with others.
TABLE 3 Art and Cultural Experiences Total
(%) Familiar with The
Cummer? (%) Significance
Yes No Arts and culture is an important factor in evaluating our community’s quality of life.
86.9 90.4 84.2 .035*
I enjoy talking with others about the art we are looking at.
79.1 83.8 76.0 .029*
I like to know about the materials and techniques used by the artist.
67.3 69.9 66.7 .445
Arts and culture is an important factor in my quality of life.
77.5 80.2 75.0 .165
I like to view a work of art on my own, without explanations or interpretations.
64.8 69.8 59.8 .020*
I am interested in hearing the historical/background context for particular works of art.
83.4 90.0 76.0 .000**
* p<0.05 **p<0.01
Motivation
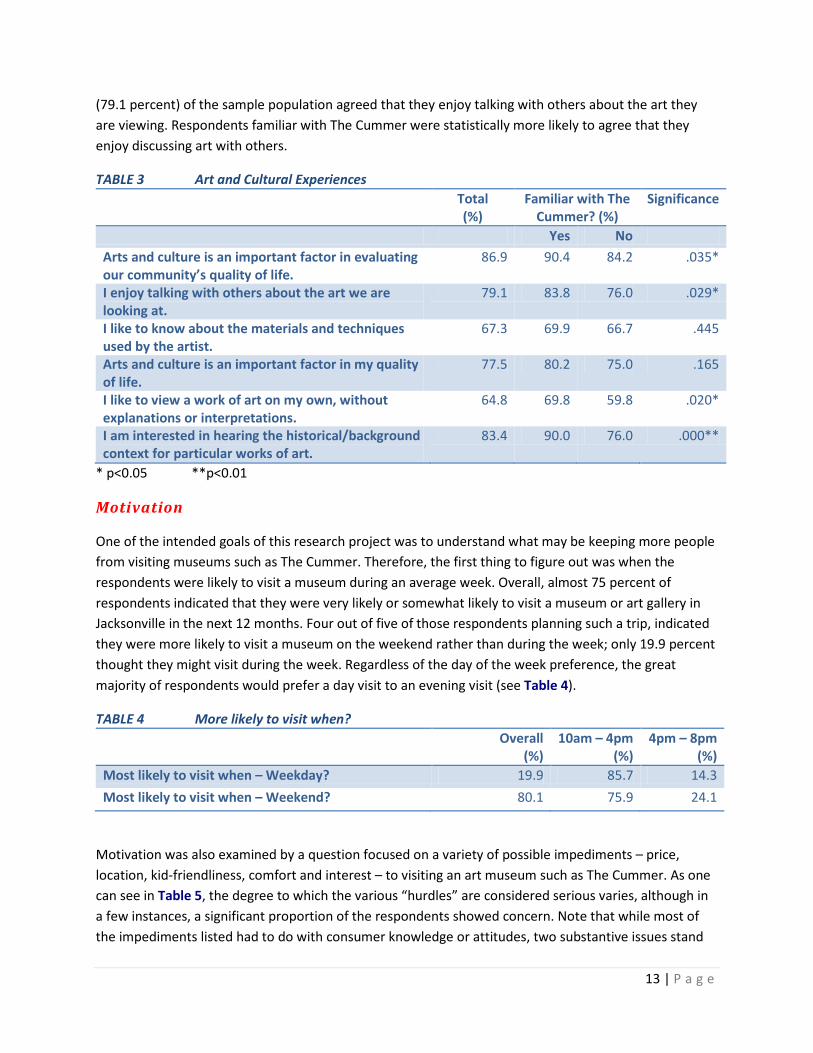
One of the intended goals of this research project was to understand what may be keeping more people from visiting museums such as The Cummer. Therefore, the first thing to figure out was when the respondents were likely to visit a museum during an average week. Overall, almost 75 percent of respondents indicated that they were very likely or somewhat likely to visit a museum or art gallery in Jacksonville in the next 12 months. Four out of five of those respondents planning such a trip, indicated they were more likely to visit a museum on the weekend rather than during the week; only 19.9 percent thought they might visit during the week. Regardless of the day of the week preference, the great majority of respondents would prefer a day visit to an evening visit (see Table 4).
TABLE 4 More likely to visit when? Overall
(%) 10am – 4pm
(%) 4pm – 8pm
(%) Most likely to visit when – Weekday? 19.9 85.7 14.3 Most likely to visit when – Weekend? 80.1 75.9 24.1
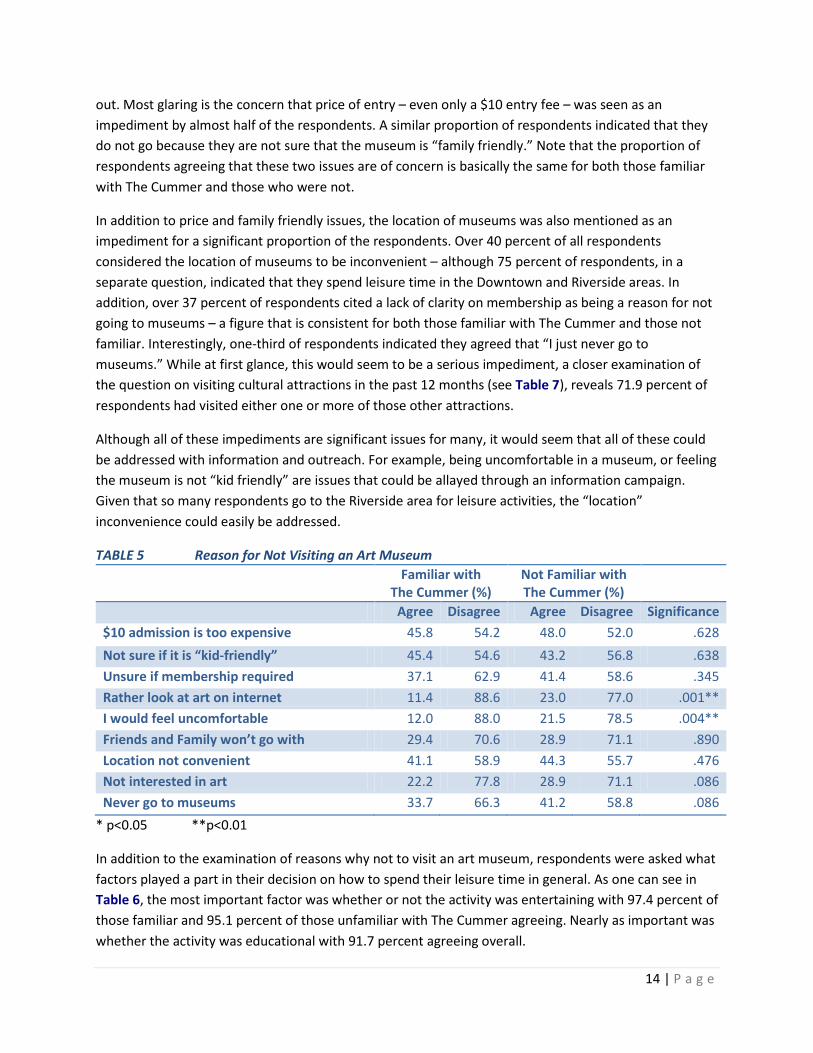
Motivation was also examined by a question focused on a variety of possible impediments – price, location, kid-friendliness, comfort and interest – to visiting an art museum such as The Cummer. As one can see in Table 5, the degree to which the various “hurdles” are considered serious varies, although in a few instances, a significant proportion of the respondents showed concern. Note that while most of the impediments listed had to do with consumer knowledge or attitudes, two substantive issues stand
14 | P a g e
out. Most glaring is the concern that price of entry – even only a $10 entry fee – was seen as an impediment by almost half of the respondents. A similar proportion of respondents indicated that they do not go because they are not sure that the museum is “family friendly.” Note that the proportion of respondents agreeing that these two issues are of concern is basically the same for both those familiar with The Cummer and those who were not.
In addition to price and family friendly issues, the location of museums was also mentioned as an impediment for a significant proportion of the respondents. Over 40 percent of all respondents considered the location of museums to be inconvenient – although 75 percent of respondents, in a separate question, indicated that they spend leisure time in the Downtown and Riverside areas. In addition, over 37 percent of respondents cited a lack of clarity on membership as being a reason for not going to museums – a figure that is consistent for both those familiar with The Cummer and those not familiar. Interestingly, one-third of respondents indicated they agreed that “I just never go to museums.” While at first glance, this would seem to be a serious impediment, a closer examination of the question on visiting cultural attractions in the past 12 months (see Table 7), reveals 71.9 percent of respondents had visited either one or more of those other attractions.
Although all of these impediments are significant issues for many, it would seem that all of these could be addressed with information and outreach. For example, being uncomfortable in a museum, or feeling the museum is not “kid friendly” are issues that could be allayed through an information campaign. Given that so many respondents go to the Riverside area for leisure activities, the “location” inconvenience could easily be addressed.
TABLE 5 Reason for Not Visiting an Art Museum Familiar with
The Cummer (%) Not Familiar with The Cummer (%)
Agree Disagree Agree Disagree Significance $10 admission is too expensive 45.8 54.2 48.0 52.0 .628 Not sure if it is “kid-friendly” 45.4 54.6 43.2 56.8 .638 Unsure if membership required 37.1 62.9 41.4 58.6 .345 Rather look at art on internet 11.4 88.6 23.0 77.0 .001** I would feel uncomfortable 12.0 88.0 21.5 78.5 .004** Friends and Family won’t go with 29.4 70.6 28.9 71.1 .890 Location not convenient 41.1 58.9 44.3 55.7 .476 Not interested in art 22.2 77.8 28.9 71.1 .086 Never go to museums 33.7 66.3 41.2 58.8 .086
* p<0.05 **p<0.01
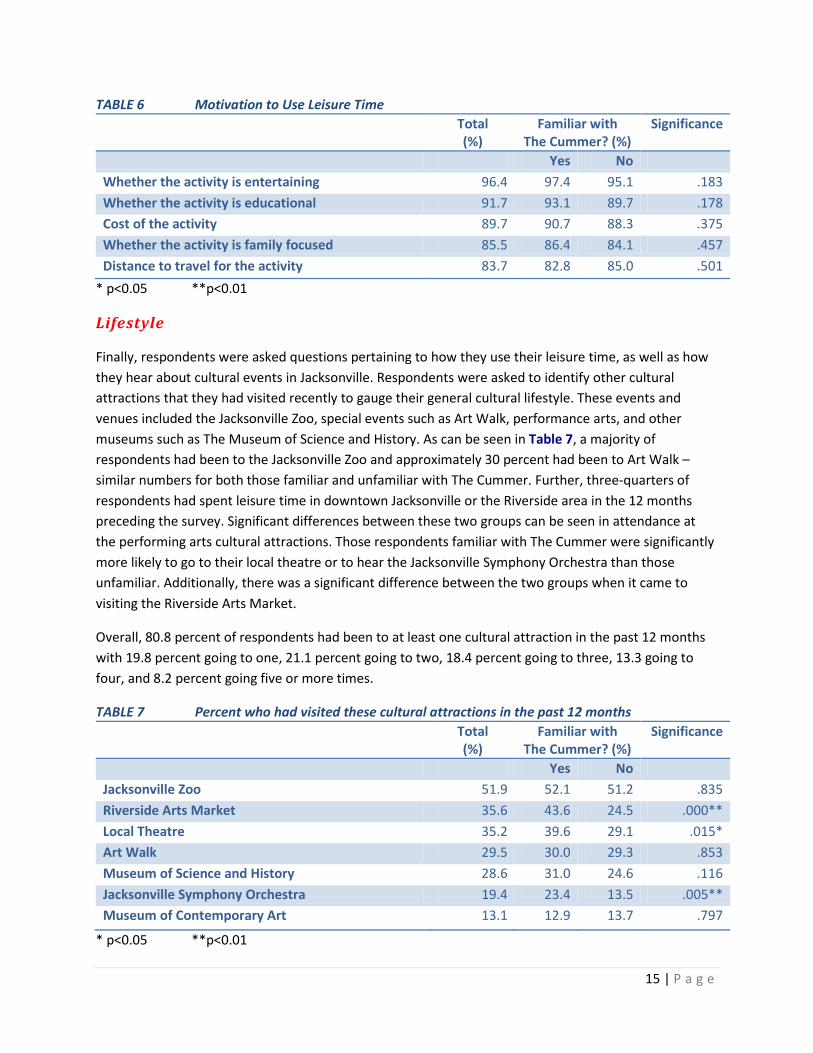
In addition to the examination of reasons why not to visit an art museum, respondents were asked what factors played a part in their decision on how to spend their leisure time in general. As one can see in Table 6, the most important factor was whether or not the activity was entertaining with 97.4 percent of those familiar and 95.1 percent of those unfamiliar with The Cummer agreeing. Nearly as important was whether the activity was educational with 91.7 percent agreeing overall.
15 | P a g e
TABLE 6 Motivation to Use Leisure Time Total
(%) Familiar with
The Cummer? (%) Significance
Yes No Whether the activity is entertaining 96.4 97.4 95.1 .183 Whether the activity is educational 91.7 93.1 89.7 .178 Cost of the activity 89.7 90.7 88.3 .375 Whether the activity is family focused 85.5 86.4 84.1 .457 Distance to travel for the activity 83.7 82.8 85.0 .501
* p<0.05 **p<0.01
Lifestyle
Finally, respondents were asked questions pertaining to how they use their leisure time, as well as how they hear about cultural events in Jacksonville. Respondents were asked to identify other cultural attractions that they had visited recently to gauge their general cultural lifestyle. These events and venues included the Jacksonville Zoo, special events such as Art Walk, performance arts, and other museums such as The Museum of Science and History. As can be seen in Table 7, a majority of respondents had been to the Jacksonville Zoo and approximately 30 percent had been to Art Walk – similar numbers for both those familiar and unfamiliar with The Cummer. Further, three-quarters of respondents had spent leisure time in downtown Jacksonville or the Riverside area in the 12 months preceding the survey. Significant differences between these two groups can be seen in attendance at the performing arts cultural attractions. Those respondents familiar with The Cummer were significantly more likely to go to their local theatre or to hear the Jacksonville Symphony Orchestra than those unfamiliar. Additionally, there was a significant difference between the two groups when it came to visiting the Riverside Arts Market.
Overall, 80.8 percent of respondents had been to at least one cultural attraction in the past 12 months with 19.8 percent going to one, 21.1 percent going to two, 18.4 percent going to three, 13.3 going to four, and 8.2 percent going five or more times.
TABLE 7 Percent who had visited these cultural attractions in the past 12 months Total
(%) Familiar with
The Cummer? (%) Significance
Yes No Jacksonville Zoo 51.9 52.1 51.2 .835 Riverside Arts Market 35.6 43.6 24.5 .000** Local Theatre 35.2 39.6 29.1 .015* Art Walk 29.5 30.0 29.3 .853 Museum of Science and History 28.6 31.0 24.6 .116 Jacksonville Symphony Orchestra 19.4 23.4 13.5 .005** Museum of Contemporary Art 13.1 12.9 13.7 .797
* p<0.05 **p<0.01
16 | P a g e
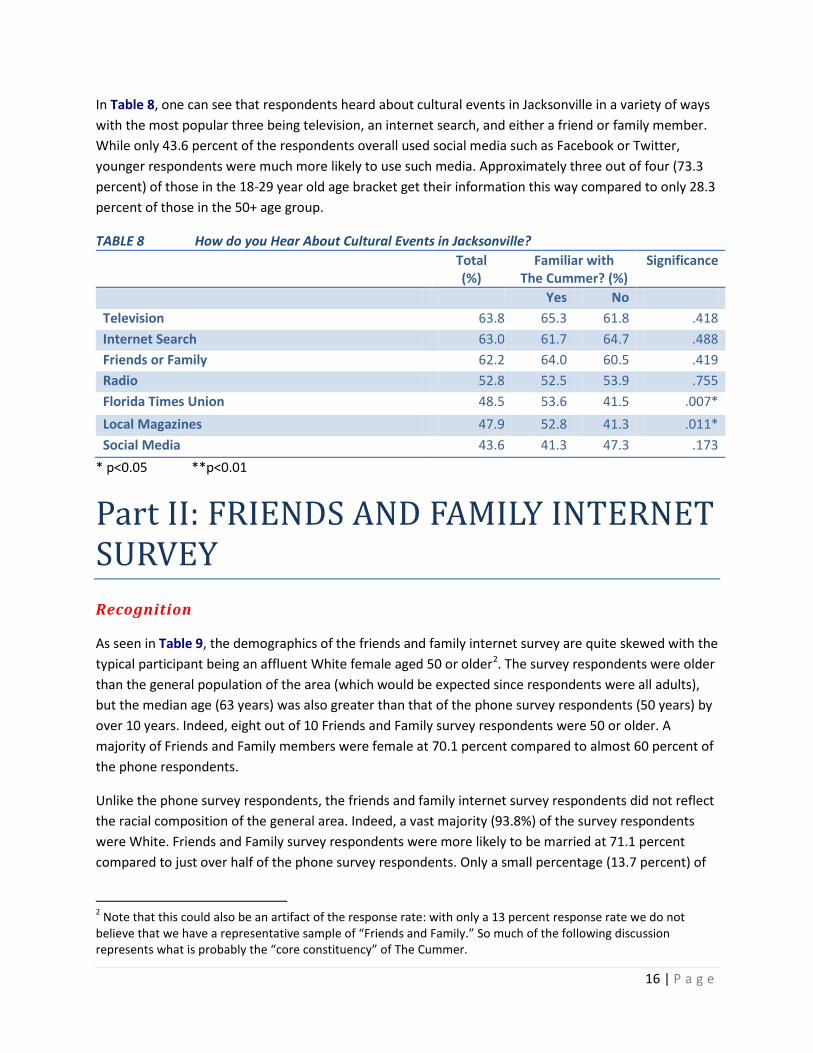
In Table 8, one can see that respondents heard about cultural events in Jacksonville in a variety of ways with the most popular three being television, an internet search, and either a friend or family member. While only 43.6 percent of the respondents overall used social media such as Facebook or Twitter, younger respondents were much more likely to use such media. Approximately three out of four (73.3 percent) of those in the 18-29 year old age bracket get their information this way compared to only 28.3 percent of those in the 50+ age group.
TABLE 8 How do you Hear About Cultural Events in Jacksonville? Total
(%) Familiar with
The Cummer? (%) Significance
Yes No Television 63.8 65.3 61.8 .418 Internet Search 63.0 61.7 64.7 .488 Friends or Family 62.2 64.0 60.5 .419 Radio 52.8 52.5 53.9 .755 Florida Times Union 48.5 53.6 41.5 .007* Local Magazines 47.9 52.8 41.3 .011* Social Media 43.6 41.3 47.3 .173
* p<0.05 **p<0.01
Part II: FRIENDS AND FAMILY INTERNET SURVEY Recognition
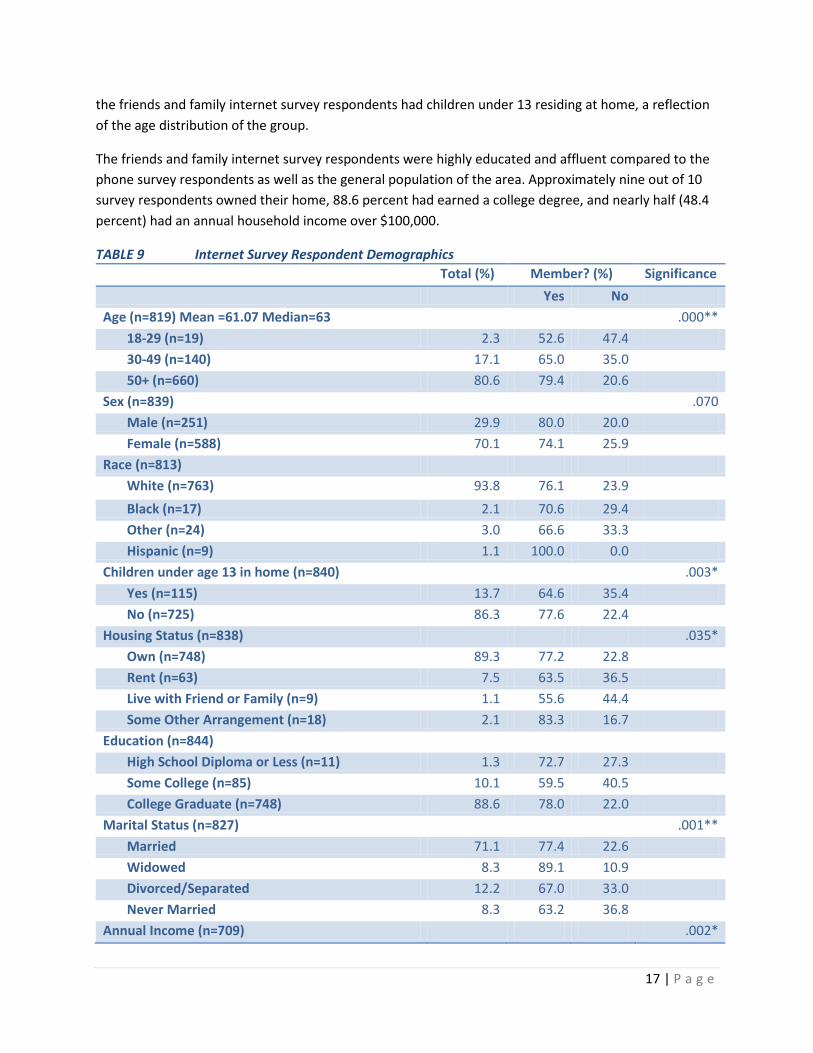
As seen in Table 9, the demographics of the friends and family internet survey are quite skewed with the typical participant being an affluent White female aged 50 or older2. The survey respondents were older than the general population of the area (which would be expected since respondents were all adults), but the median age (63 years) was also greater than that of the phone survey respondents (50 years) by over 10 years. Indeed, eight out of 10 Friends and Family survey respondents were 50 or older. A majority of Friends and Family members were female at 70.1 percent compared to almost 60 percent of the phone respondents.
Unlike the phone survey respondents, the friends and family internet survey respondents did not reflect the racial composition of the general area. Indeed, a vast majority (93.8%) of the survey respondents were White. Friends and Family survey respondents were more likely to be married at 71.1 percent compared to just over half of the phone survey respondents. Only a small percentage (13.7 percent) of
2 Note that this could also be an artifact of the response rate: with only a 13 percent response rate we do not believe that we have a representative sample of “Friends and Family.” So much of the following discussion represents what is probably the “core constituency” of The Cummer.
17 | P a g e
the friends and family internet survey respondents had children under 13 residing at home, a reflection of the age distribution of the group.
The friends and family internet survey respondents were highly educated and affluent compared to the phone survey respondents as well as the general population of the area. Approximately nine out of 10 survey respondents owned their home, 88.6 percent had earned a college degree, and nearly half (48.4 percent) had an annual household income over $100,000.
TABLE 9 Internet Survey Respondent Demographics Total (%) Member? (%) Significance Yes No Age (n=819) Mean =61.07 Median=63 .000**
18-29 (n=19) 2.3 52.6 47.4 30-49 (n=140) 17.1 65.0 35.0 50+ (n=660) 80.6 79.4 20.6
Sex (n=839) .070 Male (n=251) 29.9 80.0 20.0 Female (n=588) 70.1 74.1 25.9
Race (n=813) White (n=763) 93.8 76.1 23.9 Black (n=17) 2.1 70.6 29.4 Other (n=24) 3.0 66.6 33.3 Hispanic (n=9) 1.1 100.0 0.0
Children under age 13 in home (n=840) .003* Yes (n=115) 13.7 64.6 35.4 No (n=725) 86.3 77.6 22.4
Housing Status (n=838) .035* Own (n=748) 89.3 77.2 22.8 Rent (n=63) 7.5 63.5 36.5 Live with Friend or Family (n=9) 1.1 55.6 44.4 Some Other Arrangement (n=18) 2.1 83.3 16.7
Education (n=844) High School Diploma or Less (n=11) 1.3 72.7 27.3 Some College (n=85) 10.1 59.5 40.5 College Graduate (n=748) 88.6 78.0 22.0
Marital Status (n=827) .001** Married 71.1 77.4 22.6 Widowed 8.3 89.1 10.9 Divorced/Separated 12.2 67.0 33.0 Never Married 8.3 63.2 36.8
Annual Income (n=709) .002*
18 | P a g e
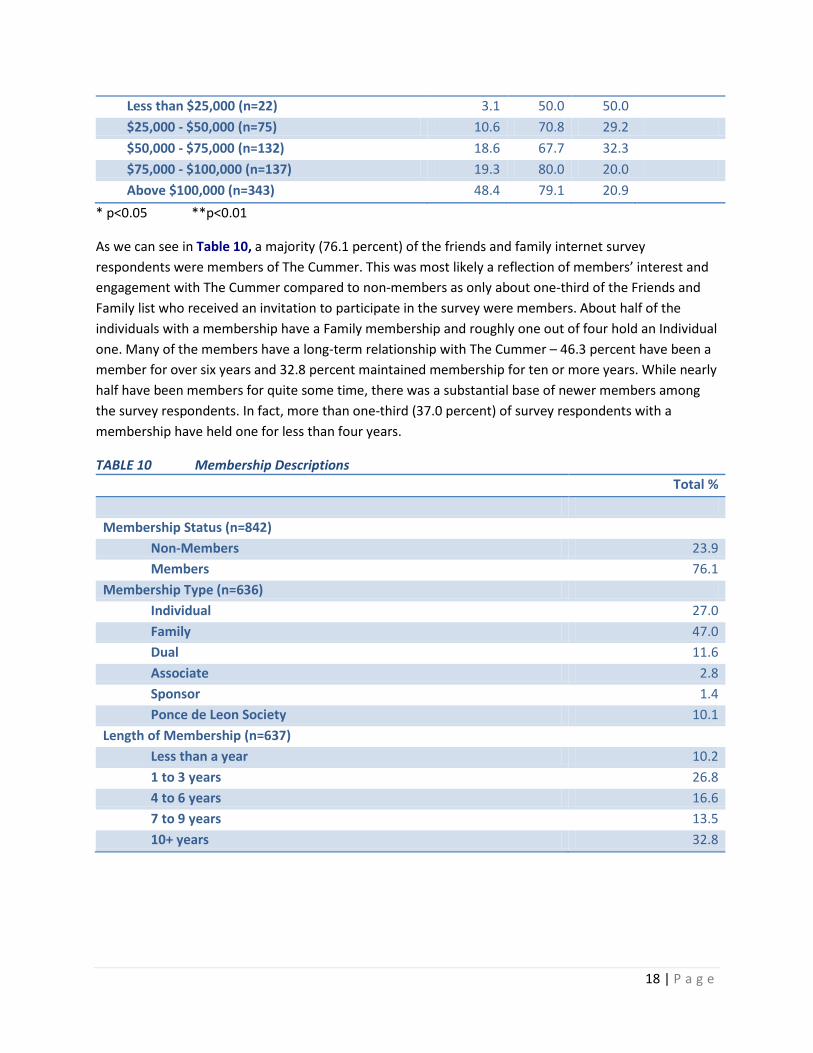
Less than $25,000 (n=22) 3.1 50.0 50.0 $25,000 - $50,000 (n=75) 10.6 70.8 29.2 $50,000 - $75,000 (n=132) 18.6 67.7 32.3 $75,000 - $100,000 (n=137) 19.3 80.0 20.0 Above $100,000 (n=343) 48.4 79.1 20.9
* p<0.05 **p<0.01
As we can see in Table 10, a majority (76.1 percent) of the friends and family internet survey respondents were members of The Cummer. This was most likely a reflection of members’ interest and engagement with The Cummer compared to non-members as only about one-third of the Friends and Family list who received an invitation to participate in the survey were members. About half of the individuals with a membership have a Family membership and roughly one out of four hold an Individual one. Many of the members have a long-term relationship with The Cummer – 46.3 percent have been a member for over six years and 32.8 percent maintained membership for ten or more years. While nearly half have been members for quite some time, there was a substantial base of newer members among the survey respondents. In fact, more than one-third (37.0 percent) of survey respondents with a membership have held one for less than four years.
TABLE 10 Membership Descriptions Total %
Membership Status (n=842) Non-Members 23.9 Members 76.1 Membership Type (n=636) Individual 27.0 Family 47.0 Dual 11.6 Associate 2.8 Sponsor 1.4 Ponce de Leon Society 10.1 Length of Membership (n=637) Less than a year 10.2 1 to 3 years 26.8 4 to 6 years 16.6 7 to 9 years 13.5 10+ years 32.8
19 | P a g e
Interest
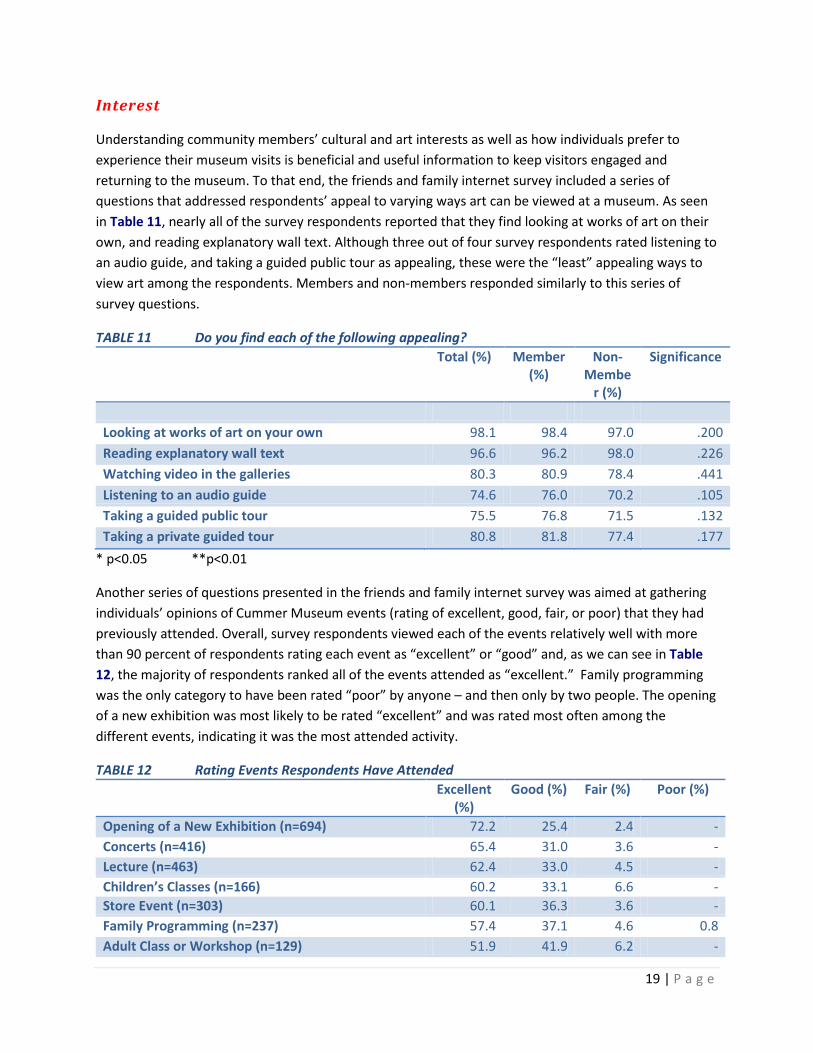
Understanding community members’ cultural and art interests as well as how individuals prefer to experience their museum visits is beneficial and useful information to keep visitors engaged and returning to the museum. To that end, the friends and family internet survey included a series of questions that addressed respondents’ appeal to varying ways art can be viewed at a museum. As seen in Table 11, nearly all of the survey respondents reported that they find looking at works of art on their own, and reading explanatory wall text. Although three out of four survey respondents rated listening to an audio guide, and taking a guided public tour as appealing, these were the “least” appealing ways to view art among the respondents. Members and non-members responded similarly to this series of survey questions.
TABLE 11 Do you find each of the following appealing? Total (%) Member
(%) Non-
Member (%)
Significance
Looking at works of art on your own 98.1 98.4 97.0 .200 Reading explanatory wall text 96.6 96.2 98.0 .226 Watching video in the galleries 80.3 80.9 78.4 .441 Listening to an audio guide 74.6 76.0 70.2 .105 Taking a guided public tour 75.5 76.8 71.5 .132 Taking a private guided tour 80.8 81.8 77.4 .177
* p<0.05 **p<0.01
Another series of questions presented in the friends and family internet survey was aimed at gathering individuals’ opinions of Cummer Museum events (rating of excellent, good, fair, or poor) that they had previously attended. Overall, survey respondents viewed each of the events relatively well with more than 90 percent of respondents rating each event as “excellent” or “good” and, as we can see in Table 12, the majority of respondents ranked all of the events attended as “excellent.” Family programming was the only category to have been rated “poor” by anyone – and then only by two people. The opening of a new exhibition was most likely to be rated “excellent” and was rated most often among the different events, indicating it was the most attended activity.
TABLE 12 Rating Events Respondents Have Attended Excellent
(%) Good (%) Fair (%) Poor (%)
Opening of a New Exhibition (n=694) 72.2 25.4 2.4 - Concerts (n=416) 65.4 31.0 3.6 - Lecture (n=463) 62.4 33.0 4.5 - Children’s Classes (n=166) 60.2 33.1 6.6 - Store Event (n=303) 60.1 36.3 3.6 - Family Programming (n=237) 57.4 37.1 4.6 0.8 Adult Class or Workshop (n=129) 51.9 41.9 6.2 -
20 | P a g e
Note: The above figures are based on the number of people who had attended these events. People who had not attended were not included in the total (n) or the percentages.
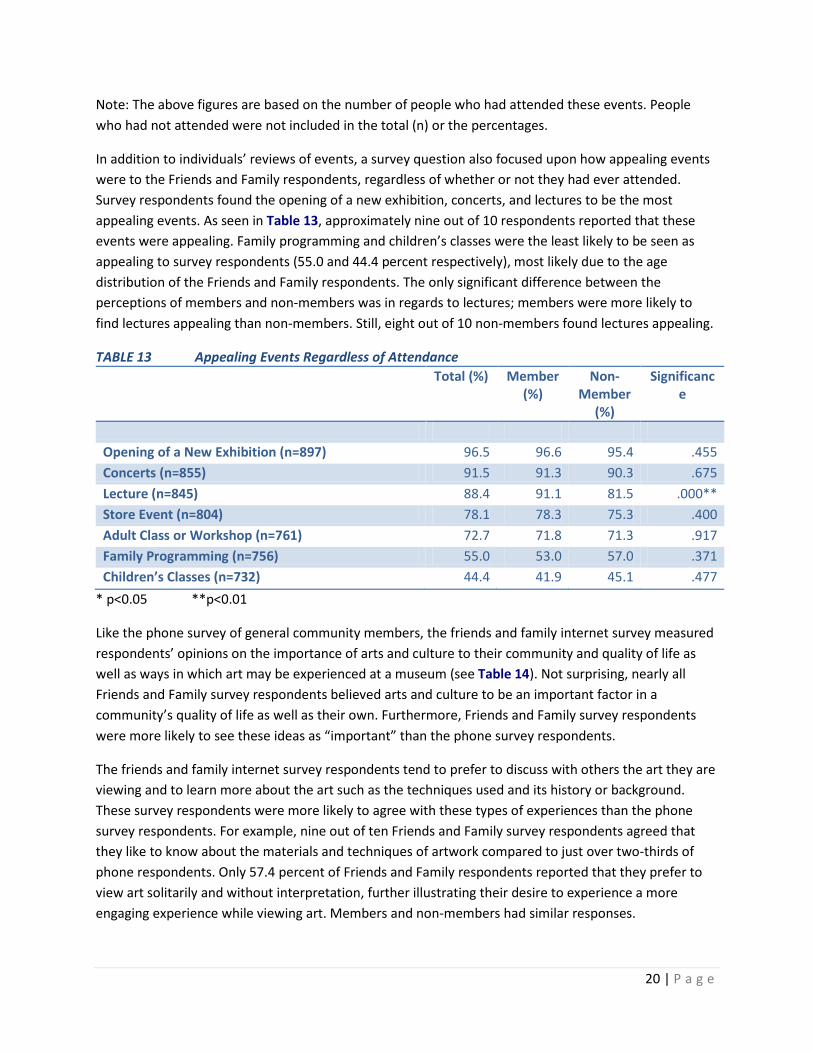
In addition to individuals’ reviews of events, a survey question also focused upon how appealing events were to the Friends and Family respondents, regardless of whether or not they had ever attended. Survey respondents found the opening of a new exhibition, concerts, and lectures to be the most appealing events. As seen in Table 13, approximately nine out of 10 respondents reported that these events were appealing. Family programming and children’s classes were the least likely to be seen as appealing to survey respondents (55.0 and 44.4 percent respectively), most likely due to the age distribution of the Friends and Family respondents. The only significant difference between the perceptions of members and non-members was in regards to lectures; members were more likely to find lectures appealing than non-members. Still, eight out of 10 non-members found lectures appealing.
TABLE 13 Appealing Events Regardless of Attendance Total (%) Member
(%) Non-
Member (%)
Significance
Opening of a New Exhibition (n=897) 96.5 96.6 95.4 .455 Concerts (n=855) 91.5 91.3 90.3 .675 Lecture (n=845) 88.4 91.1 81.5 .000** Store Event (n=804) 78.1 78.3 75.3 .400 Adult Class or Workshop (n=761) 72.7 71.8 71.3 .917 Family Programming (n=756) 55.0 53.0 57.0 .371 Children’s Classes (n=732) 44.4 41.9 45.1 .477
* p<0.05 **p<0.01
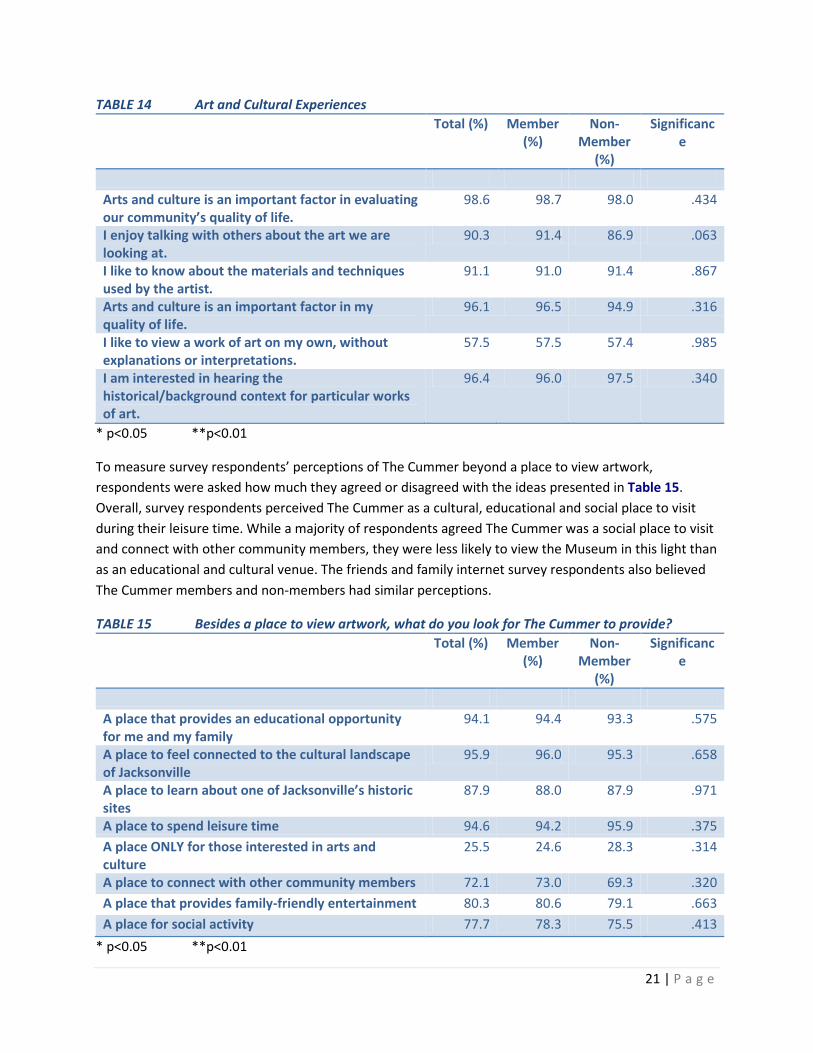
Like the phone survey of general community members, the friends and family internet survey measured respondents’ opinions on the importance of arts and culture to their community and quality of life as well as ways in which art may be experienced at a museum (see Table 14). Not surprising, nearly all Friends and Family survey respondents believed arts and culture to be an important factor in a community’s quality of life as well as their own. Furthermore, Friends and Family survey respondents were more likely to see these ideas as “important” than the phone survey respondents.
The friends and family internet survey respondents tend to prefer to discuss with others the art they are viewing and to learn more about the art such as the techniques used and its history or background. These survey respondents were more likely to agree with these types of experiences than the phone survey respondents. For example, nine out of ten Friends and Family survey respondents agreed that they like to know about the materials and techniques of artwork compared to just over two-thirds of phone respondents. Only 57.4 percent of Friends and Family respondents reported that they prefer to view art solitarily and without interpretation, further illustrating their desire to experience a more engaging experience while viewing art. Members and non-members had similar responses.
21 | P a g e
TABLE 14 Art and Cultural Experiences Total (%) Member
(%) Non-
Member (%)
Significance
Arts and culture is an important factor in evaluating our community’s quality of life.
98.6 98.7 98.0 .434
I enjoy talking with others about the art we are looking at.
90.3 91.4 86.9 .063
I like to know about the materials and techniques used by the artist.
91.1 91.0 91.4 .867
Arts and culture is an important factor in my quality of life.
96.1 96.5 94.9 .316
I like to view a work of art on my own, without explanations or interpretations.
57.5 57.5 57.4 .985
I am interested in hearing the historical/background context for particular works of art.
96.4 96.0 97.5 .340
* p<0.05 **p<0.01
To measure survey respondents’ perceptions of The Cummer beyond a place to view artwork, respondents were asked how much they agreed or disagreed with the ideas presented in Table 15. Overall, survey respondents perceived The Cummer as a cultural, educational and social place to visit during their leisure time. While a majority of respondents agreed The Cummer was a social place to visit and connect with other community members, they were less likely to view the Museum in this light than as an educational and cultural venue. The friends and family internet survey respondents also believed The Cummer members and non-members had similar perceptions.
TABLE 15 Besides a place to view artwork, what do you look for The Cummer to provide? Total (%) Member
(%) Non-
Member (%)
Significance
A place that provides an educational opportunity for me and my family
94.1 94.4 93.3 .575
A place to feel connected to the cultural landscape of Jacksonville
95.9 96.0 95.3 .658
A place to learn about one of Jacksonville’s historic sites
87.9 88.0 87.9 .971
A place to spend leisure time 94.6 94.2 95.9 .375 A place ONLY for those interested in arts and culture
25.5 24.6 28.3 .314
A place to connect with other community members 72.1 73.0 69.3 .320 A place that provides family-friendly entertainment 80.3 80.6 79.1 .663 A place for social activity 77.7 78.3 75.5 .413
* p<0.05 **p<0.01
22 | P a g e
Note: Before recoding to “Agree” and “Disagree”, there was a statistical difference (.001**) between members and non-members in regard to “A place to feel connected to the cultural landscape of Jacksonville.” Members were more likely to “Strongly Agree”, while non-members were more likely to “Somewhat Agree.”
Motivation
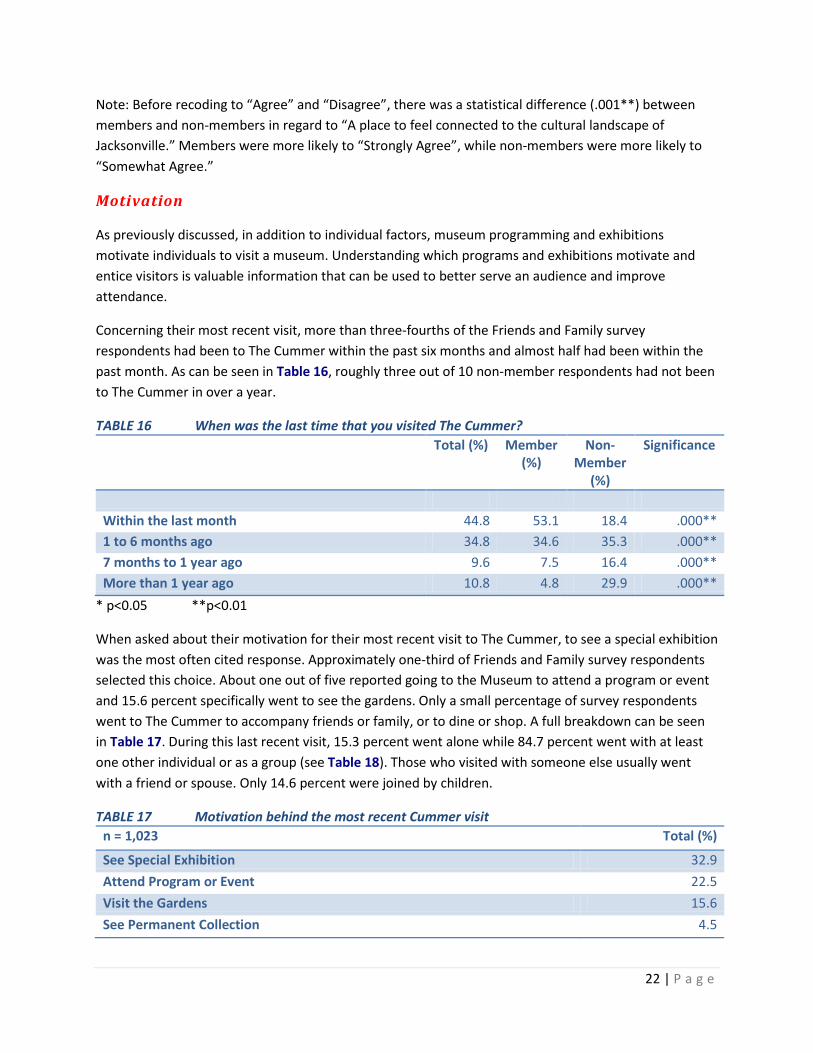
As previously discussed, in addition to individual factors, museum programming and exhibitions motivate individuals to visit a museum. Understanding which programs and exhibitions motivate and entice visitors is valuable information that can be used to better serve an audience and improve attendance.
Concerning their most recent visit, more than three-fourths of the Friends and Family survey respondents had been to The Cummer within the past six months and almost half had been within the past month. As can be seen in Table 16, roughly three out of 10 non-member respondents had not been to The Cummer in over a year.
TABLE 16 When was the last time that you visited The Cummer? Total (%) Member
(%) Non-
Member (%)
Significance
Within the last month 44.8 53.1 18.4 .000** 1 to 6 months ago 34.8 34.6 35.3 .000** 7 months to 1 year ago 9.6 7.5 16.4 .000** More than 1 year ago 10.8 4.8 29.9 .000**
* p<0.05 **p<0.01
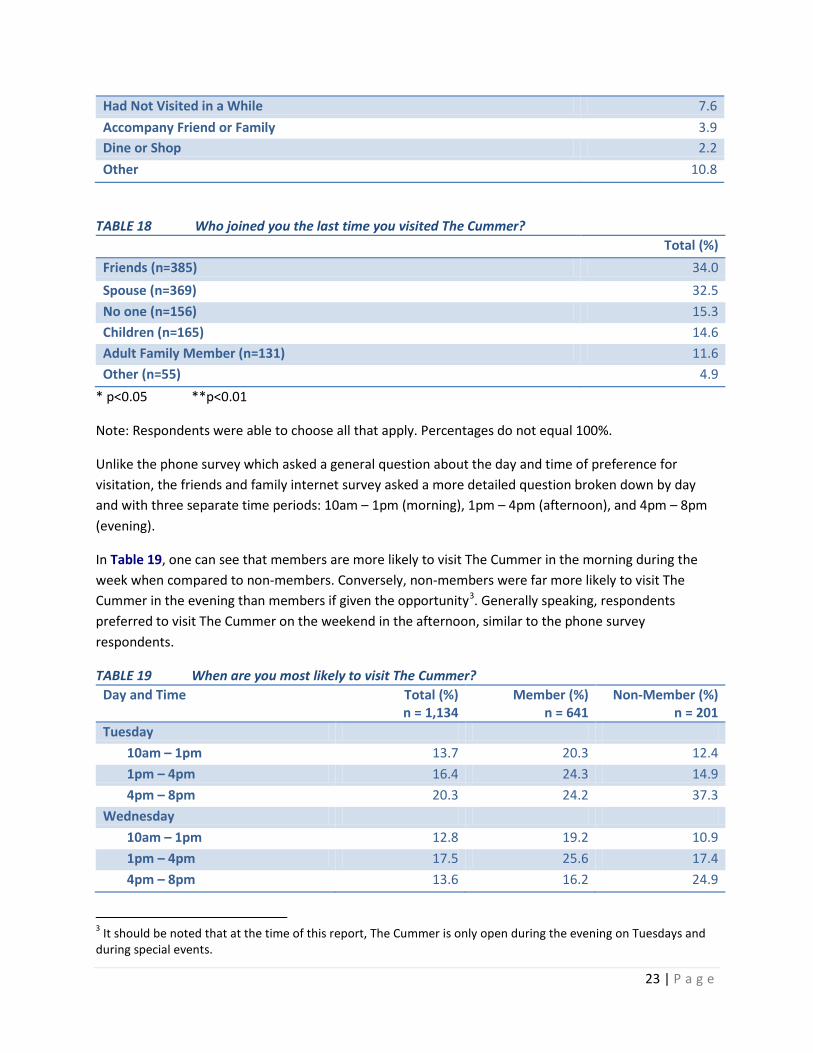
When asked about their motivation for their most recent visit to The Cummer, to see a special exhibition was the most often cited response. Approximately one-third of Friends and Family survey respondents selected this choice. About one out of five reported going to the Museum to attend a program or event and 15.6 percent specifically went to see the gardens. Only a small percentage of survey respondents went to The Cummer to accompany friends or family, or to dine or shop. A full breakdown can be seen in Table 17. During this last recent visit, 15.3 percent went alone while 84.7 percent went with at least one other individual or as a group (see Table 18). Those who visited with someone else usually went with a friend or spouse. Only 14.6 percent were joined by children.
TABLE 17 Motivation behind the most recent Cummer visit n = 1,023 Total (%)
See Special Exhibition 32.9 Attend Program or Event 22.5 Visit the Gardens 15.6 See Permanent Collection 4.5
23 | P a g e
Had Not Visited in a While 7.6 Accompany Friend or Family 3.9 Dine or Shop 2.2 Other 10.8
TABLE 18 Who joined you the last time you visited The Cummer? Total (%) Friends (n=385) 34.0 Spouse (n=369) 32.5 No one (n=156) 15.3 Children (n=165) 14.6 Adult Family Member (n=131) 11.6 Other (n=55) 4.9
* p<0.05 **p<0.01
Note: Respondents were able to choose all that apply. Percentages do not equal 100%.
Unlike the phone survey which asked a general question about the day and time of preference for visitation, the friends and family internet survey asked a more detailed question broken down by day and with three separate time periods: 10am – 1pm (morning), 1pm – 4pm (afternoon), and 4pm – 8pm (evening).
In Table 19, one can see that members are more likely to visit The Cummer in the morning during the week when compared to non-members. Conversely, non-members were far more likely to visit The Cummer in the evening than members if given the opportunity3. Generally speaking, respondents preferred to visit The Cummer on the weekend in the afternoon, similar to the phone survey respondents.
TABLE 19 When are you most likely to visit The Cummer? Day and Time Total (%)
n = 1,134 Member (%)
n = 641 Non-Member (%)
n = 201 Tuesday
10am – 1pm 13.7 20.3 12.4 1pm – 4pm 16.4 24.3 14.9 4pm – 8pm 20.3 24.2 37.3
Wednesday 10am – 1pm 12.8 19.2 10.9 1pm – 4pm 17.5 25.6 17.4 4pm – 8pm 13.6 16.2 24.9
3 It should be noted that at the time of this report, The Cummer is only open during the evening on Tuesdays and during special events.
24 | P a g e
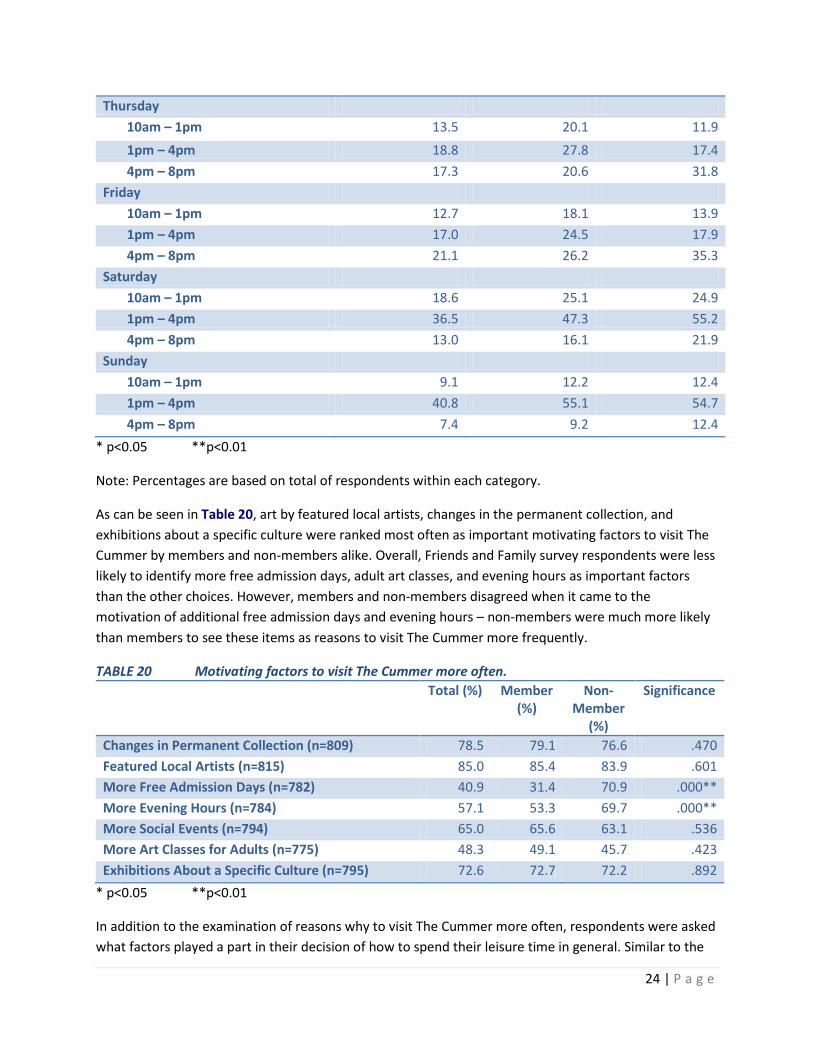
Thursday 10am – 1pm 13.5 20.1 11.9 1pm – 4pm 18.8 27.8 17.4 4pm – 8pm 17.3 20.6 31.8
Friday 10am – 1pm 12.7 18.1 13.9 1pm – 4pm 17.0 24.5 17.9 4pm – 8pm 21.1 26.2 35.3
Saturday 10am – 1pm 18.6 25.1 24.9 1pm – 4pm 36.5 47.3 55.2 4pm – 8pm 13.0 16.1 21.9
Sunday 10am – 1pm 9.1 12.2 12.4 1pm – 4pm 40.8 55.1 54.7 4pm – 8pm 7.4 9.2 12.4
* p<0.05 **p<0.01
Note: Percentages are based on total of respondents within each category.
As can be seen in Table 20, art by featured local artists, changes in the permanent collection, and exhibitions about a specific culture were ranked most often as important motivating factors to visit The Cummer by members and non-members alike. Overall, Friends and Family survey respondents were less likely to identify more free admission days, adult art classes, and evening hours as important factors than the other choices. However, members and non-members disagreed when it came to the motivation of additional free admission days and evening hours – non-members were much more likely than members to see these items as reasons to visit The Cummer more frequently.
TABLE 20 Motivating factors to visit The Cummer more often. Total (%) Member
(%) Non-
Member (%)
Significance
Changes in Permanent Collection (n=809) 78.5 79.1 76.6 .470 Featured Local Artists (n=815) 85.0 85.4 83.9 .601 More Free Admission Days (n=782) 40.9 31.4 70.9 .000** More Evening Hours (n=784) 57.1 53.3 69.7 .000** More Social Events (n=794) 65.0 65.6 63.1 .536 More Art Classes for Adults (n=775) 48.3 49.1 45.7 .423 Exhibitions About a Specific Culture (n=795) 72.6 72.7 72.2 .892
* p<0.05 **p<0.01
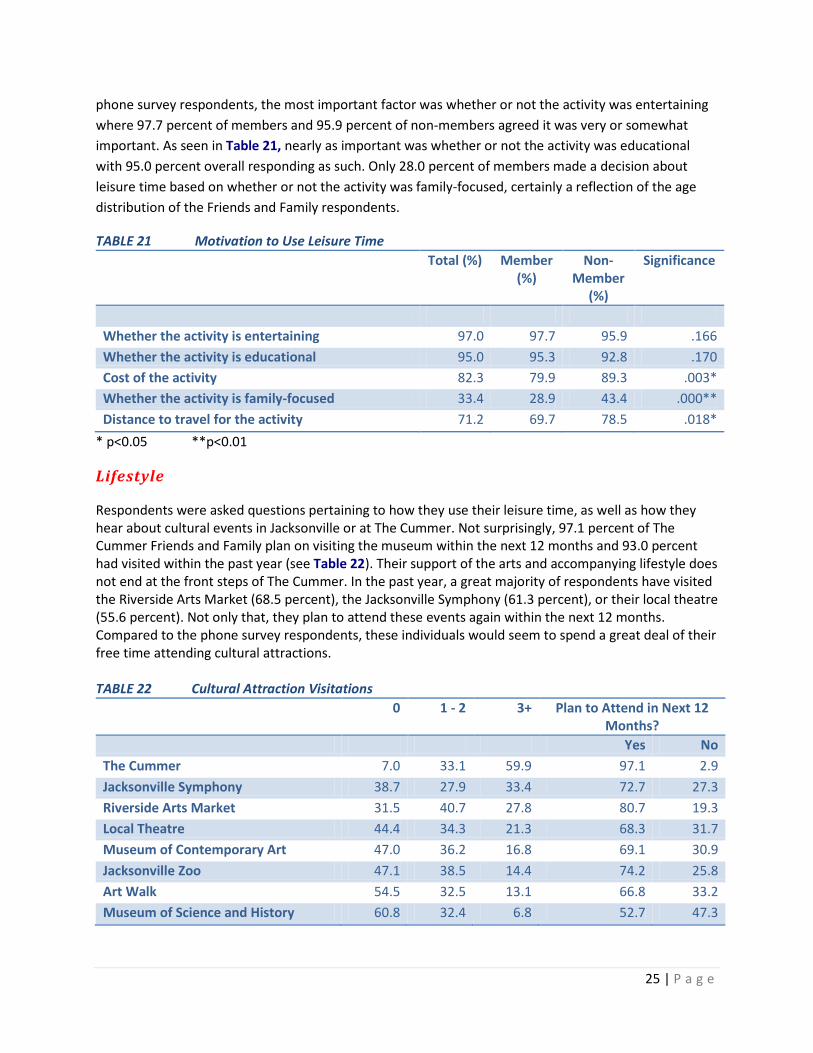
In addition to the examination of reasons why to visit The Cummer more often, respondents were asked what factors played a part in their decision of how to spend their leisure time in general. Similar to the
25 | P a g e
phone survey respondents, the most important factor was whether or not the activity was entertaining where 97.7 percent of members and 95.9 percent of non-members agreed it was very or somewhat important. As seen in Table 21, nearly as important was whether or not the activity was educational with 95.0 percent overall responding as such. Only 28.0 percent of members made a decision about leisure time based on whether or not the activity was family-focused, certainly a reflection of the age distribution of the Friends and Family respondents.
TABLE 21 Motivation to Use Leisure Time Total (%) Member
(%) Non-
Member (%)
Significance
Whether the activity is entertaining 97.0 97.7 95.9 .166 Whether the activity is educational 95.0 95.3 92.8 .170 Cost of the activity 82.3 79.9 89.3 .003* Whether the activity is family-focused 33.4 28.9 43.4 .000** Distance to travel for the activity 71.2 69.7 78.5 .018*
* p<0.05 **p<0.01
Lifestyle
Respondents were asked questions pertaining to how they use their leisure time, as well as how they hear about cultural events in Jacksonville or at The Cummer. Not surprisingly, 97.1 percent of The Cummer Friends and Family plan on visiting the museum within the next 12 months and 93.0 percent had visited within the past year (see Table 22). Their support of the arts and accompanying lifestyle does not end at the front steps of The Cummer. In the past year, a great majority of respondents have visited the Riverside Arts Market (68.5 percent), the Jacksonville Symphony (61.3 percent), or their local theatre (55.6 percent). Not only that, they plan to attend these events again within the next 12 months. Compared to the phone survey respondents, these individuals would seem to spend a great deal of their free time attending cultural attractions. TABLE 22 Cultural Attraction Visitations
0 1 - 2 3+ Plan to Attend in Next 12 Months?
Yes No The Cummer 7.0 33.1 59.9 97.1 2.9 Jacksonville Symphony 38.7 27.9 33.4 72.7 27.3 Riverside Arts Market 31.5 40.7 27.8 80.7 19.3 Local Theatre 44.4 34.3 21.3 68.3 31.7 Museum of Contemporary Art 47.0 36.2 16.8 69.1 30.9 Jacksonville Zoo 47.1 38.5 14.4 74.2 25.8 Art Walk 54.5 32.5 13.1 66.8 33.2 Museum of Science and History 60.8 32.4 6.8 52.7 47.3
26 | P a g e
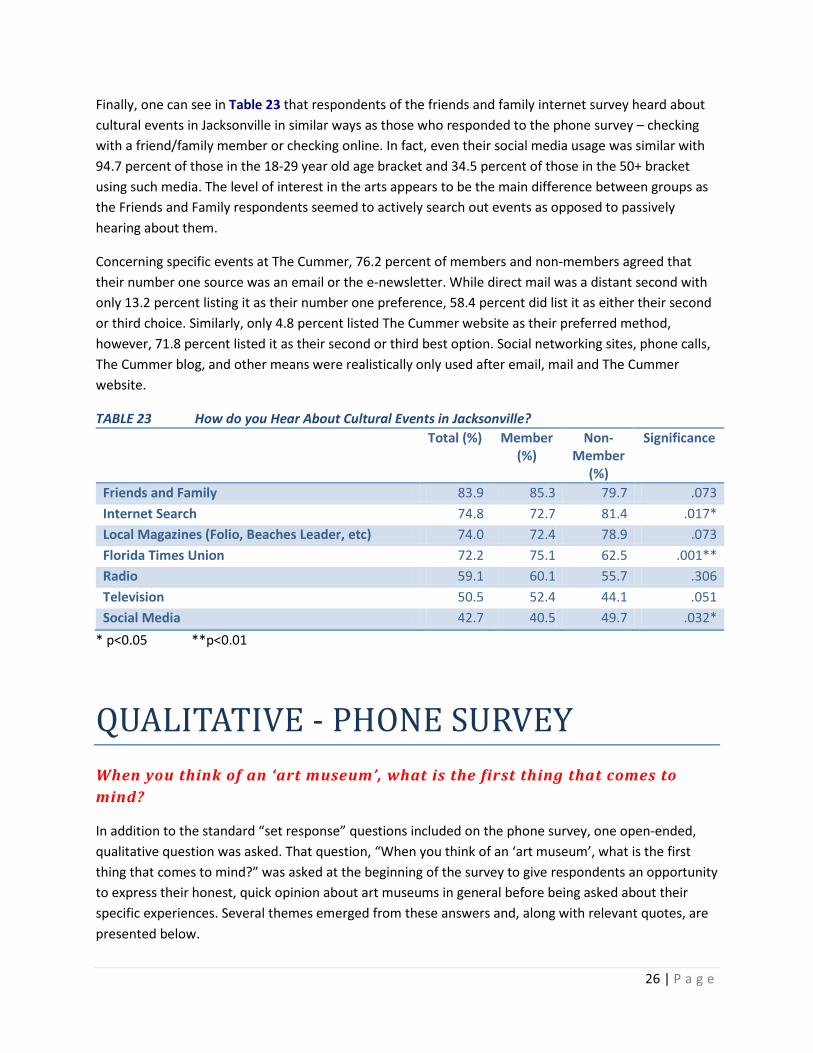
Finally, one can see in Table 23 that respondents of the friends and family internet survey heard about cultural events in Jacksonville in similar ways as those who responded to the phone survey – checking with a friend/family member or checking online. In fact, even their social media usage was similar with 94.7 percent of those in the 18-29 year old age bracket and 34.5 percent of those in the 50+ bracket using such media. The level of interest in the arts appears to be the main difference between groups as the Friends and Family respondents seemed to actively search out events as opposed to passively hearing about them.
Concerning specific events at The Cummer, 76.2 percent of members and non-members agreed that their number one source was an email or the e-newsletter. While direct mail was a distant second with only 13.2 percent listing it as their number one preference, 58.4 percent did list it as either their second or third choice. Similarly, only 4.8 percent listed The Cummer website as their preferred method, however, 71.8 percent listed it as their second or third best option. Social networking sites, phone calls, The Cummer blog, and other means were realistically only used after email, mail and The Cummer website.
TABLE 23 How do you Hear About Cultural Events in Jacksonville? Total (%) Member
(%) Non-
Member (%)
Significance
Friends and Family 83.9 85.3 79.7 .073 Internet Search 74.8 72.7 81.4 .017* Local Magazines (Folio, Beaches Leader, etc) 74.0 72.4 78.9 .073 Florida Times Union 72.2 75.1 62.5 .001** Radio 59.1 60.1 55.7 .306 Television 50.5 52.4 44.1 .051 Social Media 42.7 40.5 49.7 .032*
* p<0.05 **p<0.01
QUALITATIVE - PHONE SURVEY When you think of an ‘art museum’, what is the first thing that comes to mind?
In addition to the standard “set response” questions included on the phone survey, one open-ended, qualitative question was asked. That question, “When you think of an ‘art museum’, what is the first thing that comes to mind?” was asked at the beginning of the survey to give respondents an opportunity to express their honest, quick opinion about art museums in general before being asked about their specific experiences. Several themes emerged from these answers and, along with relevant quotes, are presented below.
27 | P a g e
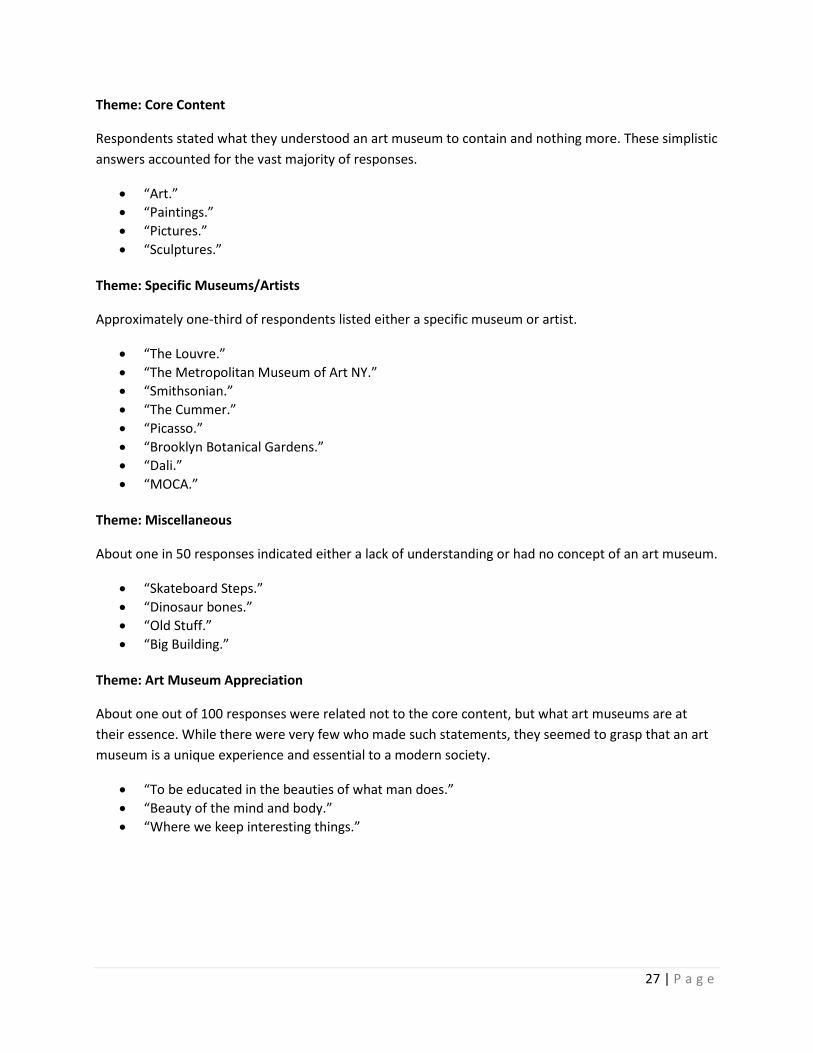
Theme: Core Content
Respondents stated what they understood an art museum to contain and nothing more. These simplistic answers accounted for the vast majority of responses.
• “Art.” • “Paintings.” • “Pictures.” • “Sculptures.”
Theme: Specific Museums/Artists
Approximately one-third of respondents listed either a specific museum or artist.
• “The Louvre.” • “The Metropolitan Museum of Art NY.” • “Smithsonian.” • “The Cummer.” • “Picasso.” • “Brooklyn Botanical Gardens.” • “Dali.” • “MOCA.”
Theme: Miscellaneous
About one in 50 responses indicated either a lack of understanding or had no concept of an art museum.
• “Skateboard Steps.” • “Dinosaur bones.” • “Old Stuff.” • “Big Building.”
Theme: Art Museum Appreciation
About one out of 100 responses were related not to the core content, but what art museums are at their essence. While there were very few who made such statements, they seemed to grasp that an art museum is a unique experience and essential to a modern society.
• “To be educated in the beauties of what man does.” • “Beauty of the mind and body.” • “Where we keep interesting things.”
28 | P a g e
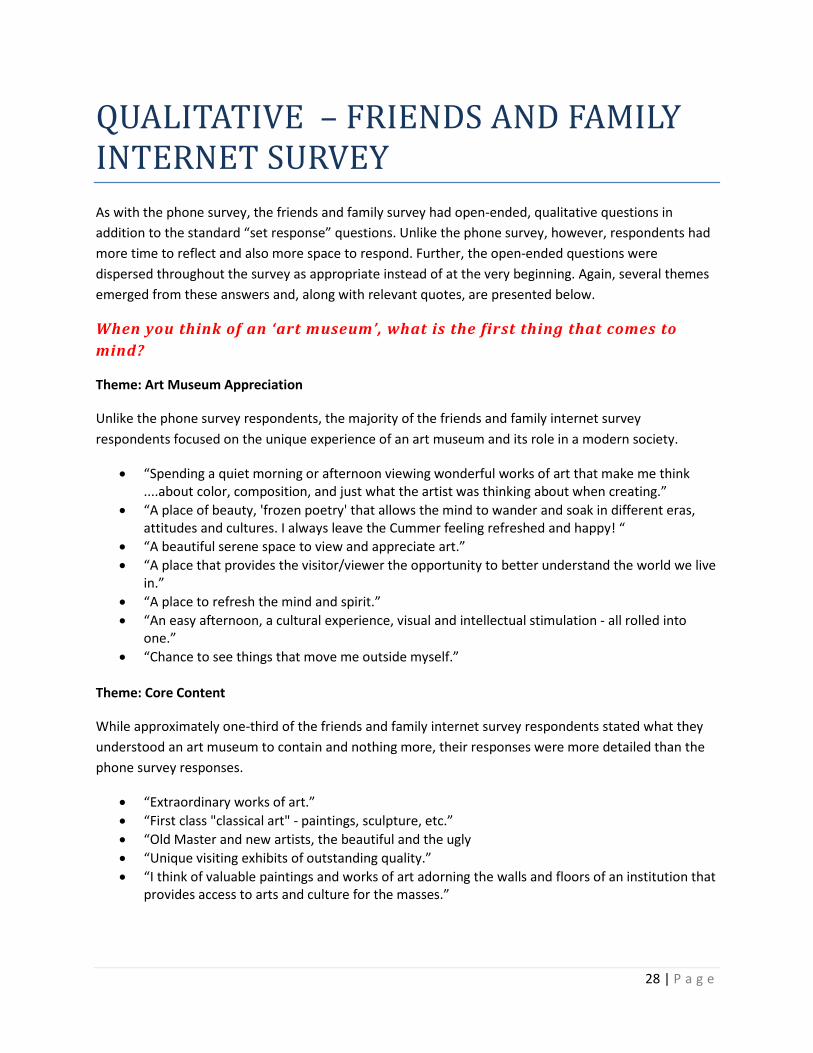
QUALITATIVE – FRIENDS AND FAMILY INTERNET SURVEY As with the phone survey, the friends and family survey had open-ended, qualitative questions in addition to the standard “set response” questions. Unlike the phone survey, however, respondents had more time to reflect and also more space to respond. Further, the open-ended questions were dispersed throughout the survey as appropriate instead of at the very beginning. Again, several themes emerged from these answers and, along with relevant quotes, are presented below.
When you think of an ‘art museum’, what is the first thing that comes to mind?
Theme: Art Museum Appreciation
Unlike the phone survey respondents, the majority of the friends and family internet survey respondents focused on the unique experience of an art museum and its role in a modern society.
• “Spending a quiet morning or afternoon viewing wonderful works of art that make me think ....about color, composition, and just what the artist was thinking about when creating.”
• “A place of beauty, 'frozen poetry' that allows the mind to wander and soak in different eras, attitudes and cultures. I always leave the Cummer feeling refreshed and happy! “
• “A beautiful serene space to view and appreciate art.” • “A place that provides the visitor/viewer the opportunity to better understand the world we live
in.” • “A place to refresh the mind and spirit.” • “An easy afternoon, a cultural experience, visual and intellectual stimulation - all rolled into
one.” • “Chance to see things that move me outside myself.”
Theme: Core Content
While approximately one-third of the friends and family internet survey respondents stated what they understood an art museum to contain and nothing more, their responses were more detailed than the phone survey responses.
• “Extraordinary works of art.” • “First class "classical art" - paintings, sculpture, etc.” • “Old Master and new artists, the beautiful and the ugly • “Unique visiting exhibits of outstanding quality.” • “I think of valuable paintings and works of art adorning the walls and floors of an institution that
provides access to arts and culture for the masses.”
29 | P a g e
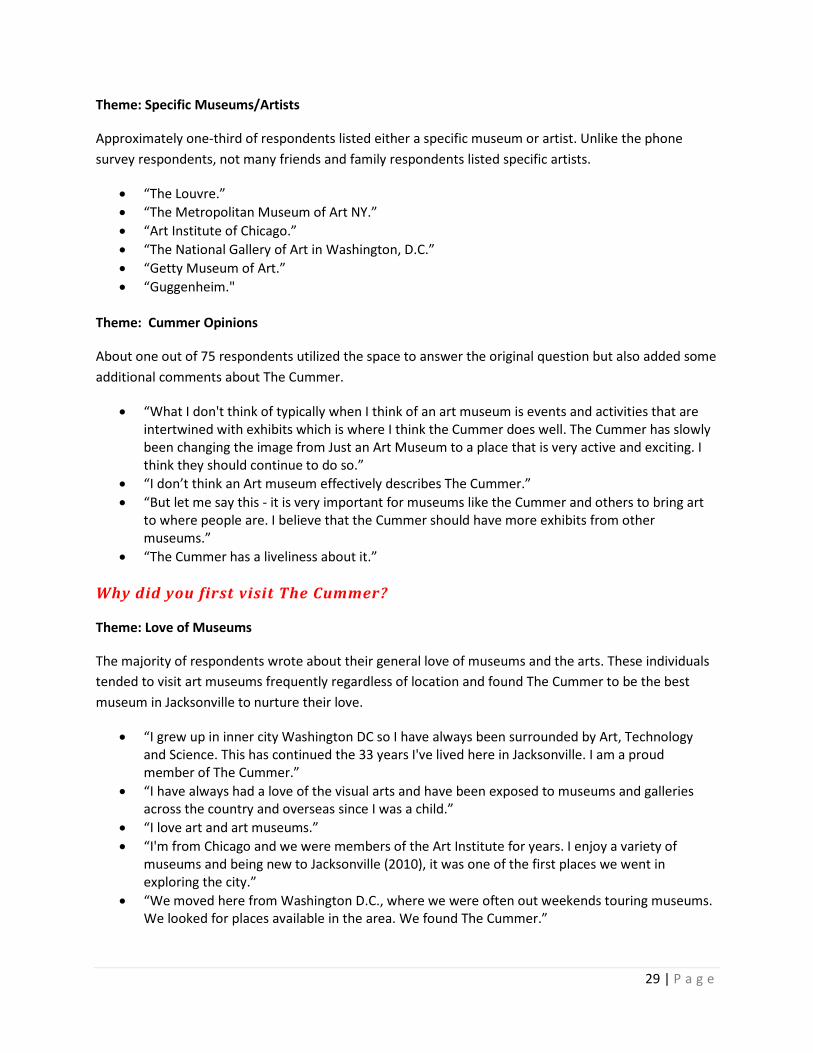
Theme: Specific Museums/Artists
Approximately one-third of respondents listed either a specific museum or artist. Unlike the phone survey respondents, not many friends and family respondents listed specific artists.
• “The Louvre.” • “The Metropolitan Museum of Art NY.” • “Art Institute of Chicago.” • “The National Gallery of Art in Washington, D.C.” • “Getty Museum of Art.” • “Guggenheim."
Theme: Cummer Opinions
About one out of 75 respondents utilized the space to answer the original question but also added some additional comments about The Cummer.
• “What I don't think of typically when I think of an art museum is events and activities that are intertwined with exhibits which is where I think the Cummer does well. The Cummer has slowly been changing the image from Just an Art Museum to a place that is very active and exciting. I think they should continue to do so.”
• “I don’t think an Art museum effectively describes The Cummer.” • “But let me say this - it is very important for museums like the Cummer and others to bring art
to where people are. I believe that the Cummer should have more exhibits from other museums.”
• “The Cummer has a liveliness about it.”
Why did you first visit The Cummer?
Theme: Love of Museums
The majority of respondents wrote about their general love of museums and the arts. These individuals tended to visit art museums frequently regardless of location and found The Cummer to be the best museum in Jacksonville to nurture their love.
• “I grew up in inner city Washington DC so I have always been surrounded by Art, Technology and Science. This has continued the 33 years I've lived here in Jacksonville. I am a proud member of The Cummer.”
• “I have always had a love of the visual arts and have been exposed to museums and galleries across the country and overseas since I was a child.”
• “I love art and art museums.” • “I'm from Chicago and we were members of the Art Institute for years. I enjoy a variety of
museums and being new to Jacksonville (2010), it was one of the first places we went in exploring the city.”
• “We moved here from Washington D.C., where we were often out weekends touring museums. We looked for places available in the area. We found The Cummer.”
30 | P a g e
Theme: Self Curiosity / School Curiosity
Approximately one-third of respondents were curious of what Jacksonville had to offer in the form of art and art museums. These respondents were either self-curious (i.e. looking for something to do, enrich their lives) or school curious (i.e. member of a school field trip, part of a class assignment). Regardless of the original source of curiosity, many of the respondents indicated the initial visit was merely the first of many to come.
• “Curious to see what kind of art we had in Jacksonville.” • “Looking for a new place to spend a Sunday afternoon with my 1-year-old daughter.” • “I first visited the Cummer to get more insight of the museum and view their exhibits.” • “I live in Palm Coast, travel a lot by motorcycle, and I come to Jacksonville frequently. I'm a
professional fine artist and when I became aware of the Cummer I had to check it out. I was pleasantly surprised by the quality of the museum and its exhibit.”
• “I took new neighbors there who had never seen it.” • “I was an art student at UNF and they encouraged us to visit and write about our experience.” • “I was interested in seeing the collection and the gardens and I had family in town to entertain.” • “My first visit to the Cummer was on a field trip with my elementary school in the 1970's. I fell in
love with the Museum and the Gardens that day.”
Theme: Specific Program
A little less than one-quarter of respondents wrote that they visited The Cummer for the first time to attend a specific program or event.
• “I first visited the Cummer during the Egyptian Exhibit a few years ago, it was absolutely fantastic.”
• “I first visited The Cummer to view the special exhibits of the Florida Highwaymen.” • “I visited to see Jim Draper's paintings.” • “I love the gardens.” • “My husband and I attended the opening of the Thomas Jacobsen Gallery.“ • “The Egypt exhibit had a creative night and I signed up that night.”
If you could change one thing about The Cummer, what would it be?
Theme:
The great majority of respondents would not change anything about The Cummer and in fact took the opportunity to compliment The Cummer.
• “I don't know if I would change anything. It appears to be a well-run organization. I have no complaints. “
• “A this point, I would not change anything. In the past I have wished it was more inclusive, but they have been very successful at opening it up in the past few years.”
• “Change? Not on your life - it's wonderful, as is!” • “I am at a loss....wouldn't change anything.”
31 | P a g e
Theme: More
Approximately 20 percent of respondents liked what The Cummer has to offer but simply wants it to offer more. Suggestions including special programs, classes, and exhibits or just having the Cummer open longer were seen as ways of improving The Cummer experience.
• “More adult art classes.” • “More audio tours.” • “More changing exhibits.” • “More child friendly.” • “More concerts.” • “Open the Cafe and museum one or more nights each week.”
Theme: Structural
While the vast majority of respondents did not want to change anything or just wanted more offerings, there were a few (roughly 10 percent) who thought the structure itself could be improved upon or developed further. It should be noted that while there were calls for better parking, there were also those who noticed that the parking situation appeared to be improving with the new construction.
• “Better parking!” • “Better acoustics in the auditorium. It is sometimes difficult to hear a guest speaker when others
are moving about outside in the corridor.” • “Connect to the Riverwalk.” • “Complete the Lane building and develop garden on its riverfront.” • “Remove the silly and incongruous sculpture from the front lawn.“
Theme: Cost
About 1 out of 50 responses made note of the cost to visit either as a guest or member. Of those, it was divided between respondents who wanted the cost to be lowered for all so that all might come and enjoy and those who see their own tight budgets and need relief.
• “I am blessed to be able to continue my support, but some of the events are a little too pricey for me, leaving me out of some of the finer affairs."
• “I wish it was free to everyone.” • “Lower family membership fee.”
If you were talking with someone who had never visited The Cummer, how would you briefly describe the museum to them?
Nearly each of the responses to this question heaped praise on The Cummer by liberally describing it as beautiful, a gem, lovely, peaceful, important, and excellent. To try and break the answers into themes would have been futile as each roughly said the same thing. Therefore, only the quote below is shown as it seemed to thoroughly, yet elegantly, best describe The Cummer to someone who had never visited before.
32 | P a g e
“The museum is set in a beautiful garden where the Cummer family used to live. They donated their home, gardens, and private collection to the city. The collection has been greatly enhanced during the more than 50 years since the museum opened and includes works from all periods of Western art. One can spend many hours in the museum, studying the collection and enjoying the quiet, intimate atmosphere. It is large enough to be inclusive but not so large that it is overwhelming. The gardens are truly lovely, and an ideal place to spend quiet time or take visiting friends. The cafe offers fine meals for reasonable prices, and the store is a good place to purchase special gifts for friends or yourself. The Cummer is always the first place I take friends visiting from out of town. I want them to think of the museum when they think of Jacksonville.”
What motivated you to become a member of The Cummer?
Theme: Support with a Personal Return on Investment
Nearly two-thirds of respondents wanted to support the arts while at the same time receiving some sort of benefit for themselves.
• “Supporting the arts in Northeast Florida and also the member preview events.” • “To take advantage of member events, pricing and reciprocal admission to other museums.” • “I want to support the arts in Jacksonville and I enjoy occasional visits.” • “To support the arts and ability to stay informed about various programs.” • “I can go as many times as I want, there are special member only exhibition openings, and I like
educational activities.”
Theme: Support with no Return on Investment
Approximately 20 percent of respondents made it clear that they simply wanted to support The Cummer for art’s sake, that they love art, or that they think having a museum in the community is good for business.
• “Love of art and the beautiful gardens.” • “The Cummer is a real treasure!” • “Love of art and support for local community.” • “I love art!” • “Reputation and offerings of The Cummer.” • “Believe that facilities of this nature are necessary to make Jacksonville an attractive place to
live and do business.”
Theme: Social Belonging
About 15 percent of respondents looked at being a member of The Cummer as part of belonging to a large family. They mentioned shared experiences, a sense of belonging, and great, personal family memories.
• “An opportunity to share the experience as a family.” • “I am an Artist and want to become part of the local art community.”
33 | P a g e
• “I like to go to the Cummer and I like to bring my grandchildren.” • “My family and being brought up going to Cummer.”
DISCUSSION AND CONCLUSION The primary purpose of this study was to provide the Cummer Museum of Art and Gardens information on why and how frequent people attend the Museum, and to understand the characteristics of those who do not know, or do not come to The Cummer. The information was to be used by the Strategic Planning Task Force for future development of the Museum’s programs and outreach. To that end, CCI conducted phone surveys with people who did not know about the museum, or had not been to the museum within the past two years. An internet survey was also conducted, focusing on people who were in The Cummer “Friends and Family” database. Originally, the plan was two-fold: first to identify reasons why some do not know of and/or do not come to the museum for possible future outreach; and 2) to understand what can be done to improve the experience for Family and Friends of The Cummer.
Upon reflecting on the two components in depth, however, we believe that some substantive issues face The Cummer with regard to outreach, and ramifications for improving the experience. For as we have seen in the preceding discussion and analysis of the findings of these surveys, the two populations are in many ways dramatically different, although both groups are very interested in the arts, the role of arts in our community, and their consumption of art. However, preparing outreach efforts to bring in those people from the phone survey may prove difficult. Indeed, in many ways the differences between the “non-friends” and the “friends and family” mirror many of the divides and differences facing Jacksonville overall. For example, the “Friends” who responded to the survey were overwhelmingly white (94 percent compared to 58 percent phone respondents), wealthier (more than two-thirds of “Friends” earned over $75,000, compared to only 15 percent phone respondents), and highly educated (88 percent college graduates compared to 46 percent). Friends were older, more likely to own their own homes, and more likely to be currently married.
More importantly, significant differences are found when looking at more “substantive” issues relating to museums – in general and The Cummer specifically. For example, “Friends” see museums as places to “converse” with the artists and their works – a personal experience within which they immerse themselves and do not want to be interrupted. Phone respondents, however, are more likely to see museums as places to find art things, paintings and stuff.
This is not to say, however, that phone respondents are not interested in arts and culture. Much like “Friends” respondents, almost 90 percent of phone respondents believed the arts were important for the community, and more than 40 percent attended three or more arts events over the previous year. The vast majority of phone respondents found a wide variety of arts and cultural events appealing – ranging from historic works of art to modern art, as well as exhibits from local artists and art classes. They went to MOCA, MOSH, Art Walks, Ram and the Zoo – just not The Cummer. There were a number of reasons why phone respondents have not visited, but most notable were the perceived high costs (46
34 | P a g e
percent), concerns about museums not being “kid friendly,” and location of museum (both 41 percent). Note that although a large proportion of phone respondents indicated the inconvenience of the location, on a separate question 75 percent indicated that they go to the Riverside area for leisure activities. Thus, they are in the neighborhood, just not stopping by.
Several striking difference with regards to perceptions and knowledge of art stands out between phone respondents and “Friends.” Whereas over 85 percent of phone respondents indicated that “family focused” leisure activities were important, only about one-third of “Friends” focused on family friendly events. Similarly, how one learns of cultural experiences differs dramatically between the groups. Phone respondents are much more likely to use social media and the internet and television for information on cultural events compared to The Cummer members. Finally, phone respondents placed more importance on cost, distance, and family-focus when deciding leisure time than “Friends.” While these differences may well be a function of the different demographic characteristics of the group (e.g. “Friends” and The Cummer members respondents were overall significantly older and wealthier), these areas represent a potential avenue for attracting new people down the road.
Several important findings are clear from the survey. First, the respondents of the friends and family internet survey care deeply for The Cummer Museum of Art and Gardens. They visit The Cummer often and plan to attend a number of times over the next year. Most do not see anything pressing that needs changing at The Cummer and are overall supportive of the leadership and the direction the museum is going. This represents a very strong base to support the Museum over the long run.
Also clear is that there is a substantive portion of the Northeast Florida population that, while interested in art and culture, and believed the arts were important for this community; they do not visit The Cummer for a variety of reasons. Yet it seems that this group represents a significant un-tapped resource for The Cummer. Phone respondents for the most part do attend cultural events, although they seem to see issues like being “family friendly” and being affordable as barriers to going to more up-scale cultural events. Efforts to target towards groups who may be significantly different than the “Base” could be successful in attracting increased visitor numbers and membership.