Embed Size (px)
Citation preview
1
A Systems Approach to Risk Management Through Leading Safety Indicators1
Nancy Leveson
Aeronautics and Astronautics Engineering Systems
MIT
Abstract: The goal of leading indicators for safety is to identify the potential for an accident before it occurs. Past efforts have focused on identifying general leading indicators, such as maintenance backlog, that apply widely in an industry or even across industries. Other recommendations produce more system-specific leading indicators, but start from system hazard analysis and thus are limited by the causes considered by the traditional hazard analysis techniques. Most rely on quantitative metrics, often based on probabilistic risk assessments. This paper describes a new and different approach to identifying system-specific leading indicators and provides guidance in designing a risk management structure to generate, monitor and use the results. The approach is based on the STAMP (System-Theoretic Accident Model and Processes) model of accident causation and tools that have been designed to build on that model. STAMP extends current accident causality to include more complex causes than simply component failures and chains of failure events or deviations from operational expectations. It incorporates basic principles of systems thinking and is based on systems theory rather than traditional reliability theory.
Keywords: Leading indicators; system safety; process safety; STAMP; STPA; risk management
Corresponding Author Information: Prof. Nancy Leveson Room 33-334 Massachusetts Institute of Technology 77 Massachusetts Ave. Cambridge, MA 02139 USA 617-258-0505 [email protected]
1 A version of this paper will appear in the Elsevier Journal of Reliability Engineering and System Safety.
2
Managing Operational Risk through an
Assumption-Based Leading Safety Indicators Program2
Nancy G. Leveson
Aeronautics and Astronautics Engineering Systems
MIT
1. Introduction
2. State of the Art
2.1 Leading Safety Indicators
2.2 Risk and Risk Assessment
3. Assumption-Based Leading Indicators
3.1. Basic Concepts and Definitions
3.2. Characteristics of a Good Leading Indicator Identification Process
3.3. The Starting Point: Assumptions about why Accidents Occur
3.3.1 A General Categorization of the Causes of Accidents
3.3.2 Vulnerability vs. Likelihood
4. Identifying Safety-Critical Assumptions
4.1. STAMP: The Accident Causality Model Underlying the Process
4.2. Assumptions Underlying Engineering Decisions
4.3. Management and Organizational Safety Control Assumptions
4.4. Assumptions Underlying Coordination Risks
5. An Assumption-Based Leading Indicator Program
5.1. A Structured Process for Identifying Leading Indicators based on STAMP
5.2. Operationalizing a Leading Indicators Monitoring Program
5.3. Managing a Leading Indicators Program
5.4. Feasibility
6. Summary
2 This research was partially supported by a research grant from BP.
3
1. Introduction There are always warning signs before a major accident, but these signs may only be noticeable or interpretable as a leading indicator in hindsight. In fact, most major accidents have multiple precursors and cues that an accident is likely to happen. Before an accident, such “weak signals” are often perceived only as noise. The problem then becomes how to distinguish the important signals from the noise. Defining effective leading indicators is a way to accomplish this goal by providing specific clues that can be monitored.
There is commonly a belief—or perhaps, hope—that a small number of general “leading indicators” can identify increasing risk of an accident. While some general indicators may be useful, large amounts of effort over decades has not provided much progress [1]. The lack of progress may be a sign that such general, industry-wide indicators do not exist or will not be particularly effective in identifying increasing risk. An alternative, which is the focus of this paper, is to identify leading indicators that are specific to the system being monitored.
Underlying and justifying the use of leading indicators is a belief that most major accidents do not result simply from a unique set of proximal, physical events but from the migration of the organization to a state of heightened risk over time as safeguards and controls are relaxed due to conflicting goals and tradeoffs [2]. If this belief is correct, there should be ways to detect evidence of this migration and intervene before a loss occurs.
As an example, consider the accidental release of methyl isocyanate (MIC) from the Union Carbide plant in Bhopal, India, in 1984, one of the worst industrial accidents in history. Almost all the factors involved at Bhopal existed before the actual triggering event that led directly to the loss. The plant was losing money. In response, Union Carbide had ordered that costs be reduced, without considering how these cuts might conflict with safety. Requirements in the operating manual, such as never filling the tanks more than half their volume, the use of safety equipment for potentially hazardous operations, and the operation of a refrigeration unit to keep the MIC at a safe temperature, were not followed. In fact, when the refrigeration unit was turned off (most likely to save money), the high temperature alarm threshold was raised correspondingly, which eliminated the possibility of an early warning of rising temperatures. Valves leaks and gauges frequently were inaccurate or out of order. Maintenance procedures were severely cutback and critical jobs were left unfilled in shifts when someone called in sick.
A review and audit two years before had noted that many of the safety devices, such as alarms, the flare tower and the gas scrubber, were inoperable or inadequate. Most of the specific practices leading directly to the accident, such as filter-cleaning operations without using slip blinds, leaking valves, bad pressure gauges, etc., were noted in the report and never fixed. Union Carbide did not follow up to ensure the deficiencies were corrected. Qualifications of personnel went down. Training and oversight were reduced. A similar accident had occurred the year before at the plant but under circumstances where the results were less severe (one person was killed), but nothing was done about fixing the hazardous operation of the plant. Given this state of the plant and its operations, some events were bound to occur that would trigger an accident.
While the events and practices at Bhopal were strikingly bad, in hindsight nearly every major accident has similar migration toward the accident over time that potentially could have been detected and the accident prevented. These changes are often ignored in accident reports, which tend to concentrate on proximal events. The challenge in preventing accidents is to try to prevent and, if unsuccessful, detect migration toward a state of unacceptable risk before an accident occurs.
4
But detection alone is not enough—there must be a management process in place to act when the leading indicators show that action is necessary. Note that at Bhopal there had been an audit report showing the conditions existed, but they were never adequately addressed.
The process of tracking leading indicators of increasing risk, where that process is embedded within an effective risk management structure, can play an important role in preventing accidents, but a way to derive effective leading indicators is required. The signs are not always as clear as at Bhopal, and, of course, we cannot wait until hindsight shows us what we should have noted before the loss occurred.
This paper proposes an approach to identifying and monitoring system-specific leading indicators and provides guidance in designing a risk management structure to use such indicators effectively. In contrast to the usual ad hoc approach to leading indicators, the paper suggests a formal foundation and structured process for identifying them. It also includes suggestions for operationalizing and managing a leading indicator program.
The approach is based a new model of accident causation called STAMP and on tools that have been designed to build on that model [3,4]. STAMP extends current accident causality models to include more complex causes than simply component failures and chains of failure events. It incorporates basic principles of systems thinking and is based on systems theory rather than traditional reliability theory.
While the subject of the paper is limited to identifying leading indicators related to safety and accidents, the ideas apply to leading indicators and risk management for system properties other than safety.
2. Background There has been much industrial effort devoted to developing leading indicators as well as academic interest in precursors. The problems in assessing risk, which arise in determining what precursors to check, are also relevant.
2.1 Leading Indicators
Much effort has been spent on trying to identify leading indicators, particularly in the petrochemical industry. Almost all of the past effort has involved finding a set of generally applicable metrics or signals that presage an accident. Examples of such identified leading indicators are quality and backlog of maintenance, inspection, and corrective action; minor incidents such as leaks or spills; equipment failure rates, and so on. Some depend on surveys about employee culture and beliefs, with the underlying assumption that all or most accidents are caused by employee misbehavior, and include as leading indicators such culture aspects as safety awareness, mutual trust, empowerment, and promotion of safety [5].
A large number of proposals for leading indicators outside the petrochemical industry focus on occupational safety rather than system safety, and some are simply a listing of potential hazards, such as lack of safety training; whether there is a lock-out, tag-out policy or a stop-work policy; and whether there are medical facilities on site [6]. In fact, the BP Grangemouth Major Incident Investigation Report suggested that industries may have a false sense of safety performance due to their focus on managing personal safety rates rather than process safety3 [7].
3 While the term “system safety” is common in most industries, the same thing is called “process safety” in the
process industries. The more general term is used in this paper as the approach being described applies in any industry.
5
As a result of major accidents in the chemical industry, a concerted and long-term effort has been devoted to identifying leading indicators of risk. Khawaji [1] provides a comprehensive description of these efforts. To summarize Khawaji’s analysis, early attempts to develop process safety performance metrics (leading indicators) date from the mid-1900’s, but attempts accelerated after the Grangemouth report recommended that “companies should develop key performance indicators for major hazards and ensure that process safety performance is monitored [7].
A series of documents have been issued since that time by the AICE [8,9,10,11], OECD [12,13,], UK HSE [14], OSHA [15], IEC [16], Step Change in Safety [17], and the API [18,19]. Most of these standards recommend that the identification of leading indicators start from the hazard analysis, but they assume that accidents are caused by a linear chain of events and do not address indirect interactions and complex systemic factors in accidents [1]. Most assume that accidents are caused by component failures and that likelihood of failures should be used to reduce the scope of the search for leading indicators despite the fact that likelihood may often be unknown and the practice may result in overlooking low likelihood events.
Beyond these industrial efforts, a large number of research papers have been written about identifying precursors to accidents. The proposals generally can be divided into those that consider technical or organizational precursors.
On the technical side, many people have suggested using incident reporting systems to identify precursors, for example [20,21,22]. The information could come from a root cause analysis that identifies the events that led up to the specific loss or near miss that occurred. A limitation is that only those events that have occurred will be identified and usually simple chains of failure events are the only precursors identified. Most root cause analysis techniques used widely are limited in the factors they can identify.
Another common suggestion is to use probabilistic risk analysis to detect and analyze precursor events. A leading proponent of this approach is Pate-Cornell [23].
A third general approach to identifying technical precursors is to use Hazard Analysis, for example [24]. The power of the hazard analysis to identify scenarios leading to losses will impact the effectiveness of the approach. Most current hazard analysis techniques focus on component failures and do not handle software requirements flaws, system design errors, the role of operators in accidents very well and usually ignore management and sophisticated errors in decision making..
Kongvik [25] provides a nice summary of the suggested approaches identifying organizational precursors to accidents. Many of these try to identify a small number of common dimensions or general factors. (say 5 or 6) that are applicable to every organization [26,27]. Some emphasize the input obtained from safety surveys and risk analyses [26].
Many of the organizational precursor proposals apply quantitative risk analysis, for example fault trees and Bayesian networks, to try to quantify the effect of safety management systems on risk, for example [28,29]. Oien uses what he calls organizational risk influence model using Bayesian networks [30]. The human and technical factors in the causal chain are used to calculate conditional probabilities. The approach leans heavily on expert judgment, as do many of the others.
Kongvik [25] has proposed a qualitative description of organizational risk controlling systems as well as some quantitative measures. Investigated accidents are used to identify causal factors as well as using task analyses of critical operations associated with a hazard. Again the goal appears to be finding general factors relevant for everyone in an industry.
While the precursors identifying technical precursors use a common but perhaps too simple a model of accident causation, the organizational approaches suffer from not having a model that specifies the
6
causes, content, and consequences of safety culture/climate [25]. Hudson and others describe the problem as a lack of a theoretically coherent framework to how and why accidents happen [31]
2.2 Risk and Risk Assessment
Risk is usually defined as the severity of an event combined with the probability or likelihood of that event occurring. Combining the severity of all loss events associated with a system with their estimated future probability or likelihood provides a metric for risk of loss associated with the system itself. This definition is widely used and accepted.
Risk is used in engineering in many ways, including determining how much effort and resources should be applied during development of an engineered system to prevent particular types of hazards or loss events in order to provide an acceptable level of risk in the operational system. It can also be used to select what events or conditions should be monitored during use of the system to prevent losses that occur despite the efforts applied during development. It is the latter topic that is the subject of this paper. There is usually a relationship between the two because events that are considered unlikely enough to bother about during development will often not be assigned a high priority during operations, although there may be exceptions.
Determining severity, or worst case losses, is usually not difficult. The problems arise in estimating the likelihood of events in the future. While these estimates may be informed estimates, they are always estimates. Handling risk effectively and preventing accidents is often highly dependent on their accuracy. If the system design and use in the future are very similar to those in the past and adequate historical data is available, estimating probability is not subject to much controversy. If new designs or new technology is involved or usage may differ from the past, likelihood estimates are more difficult to establish.
There is very little scientific data validating probabilistic risk assessment or evaluating the methods for calculating it, particularly for complex engineered systems that include software and humans [32,33,34]. An obvious problem is that risk involves predicting the future so validation would require long periods of time. There have been some studies comparing probabilistic risk assessments performed by different groups on the same system where the results indicated large differences in the frequencies calculated for the event [32,35]. Further problems were identified by Rae and Nicholson, i.e., that there can be significant divergence between the modeled system and the as-built system, interactions between the social and technical parts of the system may invalidate the technical assumptions underlying the probabilistic analysis, and the effectiveness of the mitigation measures may change over time [32].
Many major, well-known (as well as lesser-known) accidents have occurred in systems where the probability of an accident was previously calculated to be 10-9 or less, including Chernobyl, Fukushima, Texas City, Deep Water Horizon, the Therac-25, Challenger, and Columbia, to name but a few. Follensbee , in a report skeptical of the use of probabilistic risk assessment, cites five large transport aircraft accidents and one near accident where the calculated probabilities were 10-9 or less [36]. In several of these cases, the need for specific protection against the loss events was judged not necessary based on these probability calculations. Boeing has had recent poor experiences with estimates of risk in Lithium-ion batteries on the B-787, where the likelihood assumed was one in 10,000,000 flight hours but the actual occurrence was twice in the first 52,000 [37]. Why are likelihood estimates inaccurate in practice? Often important causal factors are omitted, such as operator error, flawed decision making, and sometimes software, for which probability estimates of unsafe behavior are difficult (and perhaps impossible) to determine. Humans usually play a major role in accidents, but human error when supervising complex, usually automated systems is not quantifiable (although that has not stopped some from trying). When technology changes or conditions differ from
7
the past, historical experience is not available. The other problem is that many of the errors involved in the leading indicator events are not stochastic and therefore the likelihood cannot be estimated using a probability.
The reason these limitations are important in identifying leading indicators is that an unlimited number cannot be checked so there needs to be a way to determine which are the most important. There is usually some type of selection or judgment involved. A non-probabilistic way to make these decisions is suggested n this paper.
A problem common to both probabilistic and non-probabilistic estimates of risk is heuristic biases. Psychologists have written extensively about the biases inherent in assessing risk, e.g., [38,39,40,41,42,43]. These biases may have an impact on the leading indicators we design and how we react to them. For example, confirmation bias is the name given to the tendency of people to pay more attention to information that supports their views than to evidence that conflicts with them. So people tend to be overconfident in the accuracy of their forecasts, tending to deny uncertainty and vulnerability.
Another common bias is called the availability heuristic and suggests that people tend to base likelihood judgments of an event on the ease with which instances or occurrences of that or similar events can be brought to mind. While this heuristic may often be a reasonable one to use, it can also lead to systematic bias. For example, psychologists have found that judgments of the risk of various hazards or events will tend to be correlated with how often they are mentioned in the news media.
A third bias occurs when people think about future events whose likelihood cannot be based on past historical rates. They will often construct their own simple causal scenarios of how the event could occur, using the difficulty of producing reasons for an event’s occurrence as an indicator of the event’s likelihood. If no plausible cause or scenario comes to mind, an assumption may be made that the event is impossible or highly unlikely.
People also have difficulty predicting cumulative causes. They tend to identify simple, dramatic events rather than causes that are chronic or cumulative. Dramatic changes are given a relatively high probability or likelihood whereas a change resulting from a slow shift in social attitudes is more difficult to imagine and thus is given a lower probability. At the same time, the conjunction fallacy says that an outcome paired with a likely cause is often judged to be more probable than the outcome alone even though this conclusion violates the laws of probability.
A further bias is caused by an incomplete search for possible causes. Searches are often stopped once one possible cause or explanation for an event has been identified. If that first possible cause is not very compelling, stopping the search can mean that other, more plausible and compelling causes, are not identified and likelihood is underestimated.
A final common psychological bias is called defensive avoidance. This type of bias may be reflected in the rejection or downgrading of the accuracy of leading indicators or in people’s inability to take them seriously or to accept that risk may be increasing. Defensive avoidance is based on the common psychological tendency to rationalize and avoid consideration of a topic that is stressful or conflicts with other pressing goals.
In addition to these psychological biases, organizational culture and politics can cause likelihood and vulnerability to be underestimated or overestimated.
Successful creation and use of leading indicators will require ways to control the psychological biases involved in assessing risk. Suggestions for achieving this goal are included in this paper.
8
3. Assumption-Based Leading Indicators The basic hypothesis in this paper is that useful leading indicators can be identified based on the assumptions underlying our safety engineering practices and on the vulnerability of those assumptions rather than on likelihood of loss events. All engineering involves assumptions about the behavior of the operational system and its components and the environment in which the system will operate. The goal of a leading indicators program is to monitor the assumptions upon which the safety of the system was assured, both to find assumptions that originally were incorrect and those that have become incorrect over time. As will be shown, the assumptions considered go beyond simply mechanical or structural assumptions but include social and managerial ones. The rest of this paper describes how to create an assumption-based, leading indicator program.
The idea of assumptions being the basis for identifying leading indicators was originally proposed for risk management programs outside of engineering. RAND developed the methodology of assumption-based planning (ABP) primarily to assist U.S. Army clients with mid- and long-term defense planning and to reduce uncertainty and manage risk [44]. Some terminology and ideas from ABP are used in the leading indicator process being proposed in this paper.
3.1 Basic Concepts and Definitions
Some basic terminology is needed.
Leading indicator: A warning sign that can be used in monitoring a safety-critical process to detect when a safety-related assumption is broken or dangerously weak and that action is required to prevent an accident. Alternatively, a leading indicator is a warning signal that the validity or vulnerability of an assumption is changing.
Shaping actions: Actions intended to maintain assumptions, to prevent hazards and to control migration to states of higher risk. These are essentially actions taken during the design of the physical system or the safety control structure to prevent hazards and to prevent the violation of the assumptions underlying the analysis and design. In control theory terms, these provide feedforward control and are built into the physical and organizational safety controls either originally or later added in response to an accident or serious incident. Physical examples might be an interlock to ensure that two events occur in a particular sequence or the use of a desiccant to prevent moisture that could lead to corrosion in a tank or pipe. For human behavior, shaping actions may be to design the operation of a safety control action to be easy and difficult to omit. A final example of a shaping action is the design of operational procedures to be followed under various types of conditions and following hypothesized events, such as creating an evacuation plan.
Hedging (contingency) actions: Actions that prepare for the possibility that an assumption will fail. Hedging actions come from thinking through a possible scenario (hazard analysis) in which the assumption collapses and asking what might be done now to prepare for that scenario. Some responses will be shaping actions. Others will involve situations where shaping actions are deemed impossible or impractical or the shaping actions are unsuccessful. Another way of saying this is that the hazard analysis generates scenarios from broken assumptions (worst case analysis) to identify hedging actions that might be taken. In control theory and STAMP terminology, hedging actions involve feedback control during system operation using set points that maintain safety constraints. Examples of feedback include performance audits to determine whether the system and the safety controls are operating as designed and operators are following designed procedures.
Signposts: Points in the unfolding future where changes in the current safety controls (shaping and hedging actions) may be necessary or advisable. In essence, they involve planning for monitoring and responding to particular identified changes in the assumptions underlying the safety controls. For
9
example, new construction or known future changes in the system or in the environment may trigger a planned response. Signposts may be established to trigger standard Management of Change procedures common in industry.
Assumption checking: The process of checking whether the assumptions underlying the safety design are still valid. Assumption checking differs from signposts in that signposts are identified during the design and development process and specific responses created and specified. In assumption checking, risk managers and controllers monitor the system during the operation of the plant and ask whether the assumptions are still valid. Such monitoring might focus on signposts or perhaps just changes and failures of assumptions that have not been adequately handled by shaping and hedging actions.
Accidents often occur after some type of change [35] . While signposts can be used for planned or expected changes, assumption checking is useful for detecting unplanned and potentially unsafe change.
3.2 Characteristics of a Good Leading Indicators Process
In some organizations, the desire to predict the future leads to collecting a large amount of information based on the hope that something will be obtained that is useful. The NASA Space Shuttle program was collecting 600 metrics a month, for example, right before the loss of the Columbia, none of which turned out to be helpful in predicting the loss or identifying the clear migration of the program to states of increasing risk [45].
A structured process may provide a more effective set of leading indicators than an ad hoc process. There are several goals for such a process and for the resulting set of leading indicators:
Complete: All critical assumptions leading to an accident are identified. Of course, no process is perfect, but that does not negate the goal of aiming for perfection. Because completeness may mean that a very large set of leading indicators is identified, a process for determining what should be checked, how, and when will be a critical part of the leading indicators program.
Consistent: Inconsistencies in the assumptions underlying the leading indicators need to be identified and handled. Inconsistency may indicate a flawed safety design process.
Effective: The indicators should appropriately address the underlying assumptions, uncertainties, and vulnerabilities and accurately evaluate risk.
Traceable: Each leading indicator and the action attached to it (see Section 5) should be identified as a response to one or more assumptions.
Minimal: There should be no extraneous assumptions, checks, or actions that are not necessary to prevent accidents.
Continually improving: The design of the leading indicators program should be continually updated over time in response to feedback about its effectiveness.
Unbiased: The leading indicator process should minimize (combat) standard biases in risk assessment and management.
Removing or significantly reducing biases is perhaps the most difficult of these characteristics to achieve. While heuristic biases can never be totally eliminated, there are ways to reduce them. One way is to use a structured method for identifying, detecting, and managing leading indicators. Following a structured process can diminish the power of our biases and encourage us to do a more thorough search. Biases may also have an impact on decisions about which leading indicators to use and in recognizing the changes that do occur and accepting that the leading indicator is in fact accurately
10
predicting increased risk. A structured process and rules to follow can potentially combat these biases too.
In addition to using a structured process, biases can be controlled by concentrating on plausibility (vulnerability) rather than likelihood. That is, thinking about whether an assumption could fail to hold in a given way, not whether it is likely to do so and concentrating on causal mechanisms rather than likelihoods. Anything that could happen within the expected lifetime of the system should be accorded serious attention as a vulnerability. Vulnerability is discussed further in the next section.
A final way to control biases is to use worst-case analysis. Worst-case thinking can assist in deterring people from concentrating on the more likely but usually less severe consequences of events or ignoring cases completely due to confirmation bias. The nuclear industry, for example, has traditionally used design basis accidents in analyzing safety. According to the U.S. Nuclear Regulatory Agency [46], a design basis accident is “a postulated accident that a nuclear facility must be designed and built to withstand without loss to the systems, structures, and components necessary to ensure public health and safety.” In contrast, a beyond design basis accident is defined as an accident sequence that is possible but is not fully considered in the design process because it is judged to be too unlikely. Defining design basis accidents (and thus by inference beyond design basis accidents) is obviously subject to heuristic biases. At Fukushima, for example, the sea wall was built to withstand likely events, which was reasonable. Worst case analysis, however, which is common outside the nuclear industry, would in addition try to protect against the worst case, for example, designing the plant so that a breach of the sea wall (which was possible even if considered highly unlikely) would not lead to losing all power in the plant and a potential catastrophe. At the least, if an accident scenario is not fully incorporated into the design process and that scenario is not impossible, then it needs to be considered for inclusion in a leading indicators program.
3.3 The Starting Point: Assumptions about why Accidents Occur
Despite much effort to avoid them, accidents still occur. Theoretically, if we design a safe system, that is, eliminate or adequately control or mitigate all the hazards and nothing changes, then we should not have accidents. The problem is that neither of these conditions is usually true in practice: no engineering process is perfect nor is human behavior. In addition, every system and its environment are subject to change over time. The starting point in seeking more effective leading indicators is with the assumptions about why accidents occur.
3.3.1 A General Categorization of the Causes of Accidents
The causes for accidents may arise in technical system development or in physical operations and may reflect management and cultural deficiencies, in both development and operations. Often several or all of these types of causes can be found in accident scenarios. The following list describes the way accident causes can arise in each of these three areas:
Development and implementation
Inadequate hazard analysis: Assumptions about the system hazards or the process used to identify them do not hold.
o HA is not performed or is not completed
o Some hazards are not identified due to inadequacies in the hazard analysis process or in how it is performed.
o Hazards are identified but they are not handled because they are assumed to be “sufficiently unlikely”
o HA is incomplete, that is, important causes are omitted and therefore not handled.
11
Inadequate design of control and mitigation measures for the identified hazards, possibly due to inadequate engineering knowledge or to inappropriate assumptions about operations.
Inadequate construction of control and mitigation measures.
Operations
Controls that designers assumed would exist during operations are not adequately implemented or used.
Controls are implemented, but changes over time violate the assumptions underlying the original design of the controls.
o New hazards arise with changing conditions, were not anticipated during design and development, or were dismissed as unlikely to occur
o Physical controls and mitigation measures degrade over time in ways not accounted for in the analysis and design process
o Components (including humans) behave differently over time (violate assumptions made during design and analysis)
o The system environment changes over time (violates assumptions made during design and analysis)
Management
The safety management system design is flawed.
The safety management system does not operate the way it was designed (assumed) to operate. While there may be many reasons for misbehavior, one general cause is that the safety culture, i.e., the goals and values of the organization with respect to safety, degrades over time. In addition, the behavior of those making safety-related decisions may be influenced by competitive, financial or other pressures.
To prevent accidents, we must eliminate or reduce the occurrence of these causes. The response may be in the form of shaping or hedging actions. A leading indicators program can be used to attempt to detect them before an accident occurs.
Some of these causes involve engineering errors, for example, inadequate design of physical control mechanisms. Simple calculation or knowledge errors may be involved, but incorrect assumptions can also play an important role. The common engineering design assumption about independence when redundancy is used to protect against failures is an example. Consider the Macondo (Deep Water Horizon) blowout preventer. There was redundancy in the means to control a potential blowout, but the redundant units contained a common cause failure mode. Acceptance of the belief that blowout preventers never failed was widespread in the industry despite the fact that ineffective blowout preventers had previously contributed to several serious accidents (a heuristic bias?) [47,48]. Challenger is another example of a common cause failure, only this time the independence assumption about the independence of the O-rings was checked and invalidated scientifically many years before the fatal Challenger flight, but the change was never documented in the Marshall Space Center data base where the launch decision was made [45]. Given the very large number of accidents that have involved common mode/cause failure [35], it appears to be an important assumption to revisit as are others that have contributed to many accidents.
The goals and values of those participating in an industry or organization, i.e., the safety culture, is an important assumption that when wrong can be a major factor in accidents and must be reflected in the set of leading indicators. For example, a safety policy is a basic requirement for every company or organization to communicate the desired safety culture and behavior expected of individuals. There
12
must be a way to measure how well that policy is being followed and if adherence changes over time. Assumptions about management behavior and decision making are also commonly found to be violated after accidents occur and must be monitored.
Sometimes the safety-related assumptions underlying the system or operational design process hold originally but become untrue due to changes over time. The world is constantly changing, especially human behavior and, as noted, major accidents are usually preceded by the migration of the system to a state of unrecognized high risk. Using the terminology developed so far, that migration basically involves moving to states where the assumptions used during the design and development of the system and the shaping actions are violated. So even if a good job in terms of hazard analysis and design for safety has been done during development and manufacturing, there will still, almost inevitably, be accidents. This potential for migration toward the violation of the assumptions underlying the safety of the system needs to be reflected in the set of leading indicators. For example, operators may start to take shortcuts or turn off safety devices in order to operate more efficiently or, in an air traffic control system, the airspace may become more crowded than originally considered in the system design.
3.3.2 Vulnerability vs. Likelihood
The evaluation of “likelihood” when assessing risk is a key assumption that, if incorrect, can lead to accidents that might have been prevented. Too often, there is no scientific basis for making such assumptions about likelihood and occasionally politics intervenes. After accidents, it is common to find that the hazard involved had been identified but not controlled because it was deemed too unlikely to occur [35].
Instead of trying to predict the likelihood that an event will occur or an assumption will fail, the similar but different concept of vulnerability can be used. Vulnerability in the world of assumption-based planning involves assessing whether an assumption could plausibly fail during the lifetime of the system, not the specific probability of that happening. Trying to assess the exact probability of software issuing an unsafe command or operators making a mistake or changing their behavior is impossible in a world of imperfect engineering and changing human behavior.
If an assumption is vulnerable, then it makes no sense not to protect against it in some way. While some events may not be technically impossible, they may be implausible enough that for practical reasons they are treated as such. An example is a meteorite hitting an aircraft. Such an event has never occurred in the past and nothing has changed to alter the vulnerability, that is, to increase the number of meteorites penetrating our atmosphere or to make our aircraft more vulnerable to them. Note, however, that vulnerability may change over time. Part of a leading indicator program involves identifying when vulnerability has changed from that previously assumed.
The potential for reducing biases by using a structured process was described in Section 3.1. In addition to using a structured process, biases can be controlled by concentrating on plausibility and causal mechanisms rather than likelihood. That is, thinking about whether an assumption could fail to hold in a given way, not whether it is likely to do so and concentrating on causal mechanisms rather than likelihoods, i.e., what are the potential scenarios that could lead to the failure of the assumption. Anything that could happen within the expected lifetime of the system should be accorded serious attention as vulnerable. Ensuring the assumptions are revisited occasionally and checks are instituted for failures of the assumptions is not expensive.
It can reasonably be argued that likelihood is actually being considered here, using plausibility as a proxy. The difference is in the potential for error in the two types of estimates. Vulnerability does not require assigning a probability, such as 3.5E-7, or even relative (but usually undefined or poorly defined) categories such as those often used in a risk matrix. Examples of such categories are frequent, probable, occasional, remote, improbable, impossible. The difference is that instead of trying to assign a numerical
13
likelihood estimate or one of a set of poorly defined categories, only two categories, possible and impossible, are used. That is, if the likelihood is not zero, then the assumption needs to be considered for inclusion in the leading indicators program. That conclusion does not necessarily imply that costly controls will be used, but the hazard cannot be dismissed at the beginning of development (during preliminary hazard analysis) and never considered again—at least until the first accident caused by it.
4. Identifying Safety-Critical Assumptions How do we identify the safety-related assumptions that need to be included in a leading indicator program? This section describes a concrete process. The process is based on an accident causality model, STAMP (System-Theoretic Accident Model and Processes), that is more comprehensive than traditional models. The process also includes a new hazard analysis method STPA (System Theoretic Process Analysis) built on STAMP as a theoretical foundation. STPA can be used to identify safety critical assumptions that can then form the basis for a leading indicator program.
4.1 STAMP: The Accident Causality Model Underlying the Process
Accident causality modes underlie all our efforts to engineer for safety. Basically they provide an explanation for why accidents occur and impose patterns on accident causation. You may not be aware you are using one, but you are: Our mental models of how accidents occur determine how we investigate and prevent accidents and the causal factors we identify.
Identifying leading indicators will necessarily be related to our assumptions about why accidents occur. Traditional accident causality models explain accidents in terms of a chain of directly related events that cause the accident. The events usually involve failures4 of system components, and such causality models are built on reliability theory. Chain-of-failure-event models are limited in their ability to handle accidents in complex systems, organizational and managerial (social and cultural) factors in accidents, and the systemic causes of the events, most of which do not involve failures.
In contrast, STAMP is a new model of accident causation that extends the old models to include non-linear and indirect relationships and thus can better handle the levels of complexity and technical innovation in today’s systems [4]. STAMP is based on systems theory rather than reliability theory. A systems-theoretic model allows capturing the non-linear dynamics of interactions among system components and anticipating the risk-related consequences of change and adaptation over time.
In STAMP, accidents are conceived as resulting not simply from system component failures but more generally from interactions among system components (both physical and social) that violate system safety constraints. Examples of safety constraints are that a highly reactive chemical must be stored below a maximum temperature, pressure in a well must be within acceptable levels at all times, aircraft must maintain minimum separation when aloft, and a nuclear power plant must not discharge more than a minimum amount of radioactive materials into the environment. The constraints must be enforced in the operating process and contingency action must be taken if the constraints are somehow violated.
STAMP views process or system safety as a control problem, not a reliability problem: accidents occur when component failures, external disturbances, and/or potentially unsafe interactions among system components are not controlled (handled) adequately. The controls may be managerial, organizational, physical, operational, or manufacturing. Major accidents rarely have a single root cause such as component failure or human error (which are symptoms rather than root causes) but from the
4 A standard definition of failure is “The nonperformance or inability of the system or component to perform its
specified function for a specified time under specified environmental conditions.”
14
inadequate enforcement of safety-related constraints on the development, design, construction, and operation of the entire socio-technical system. Often they can also be characterized as resulting from an adaptive feedback function that fails to maintain safety as performance changes over time to meet a complex and changing set of goals and values [2].
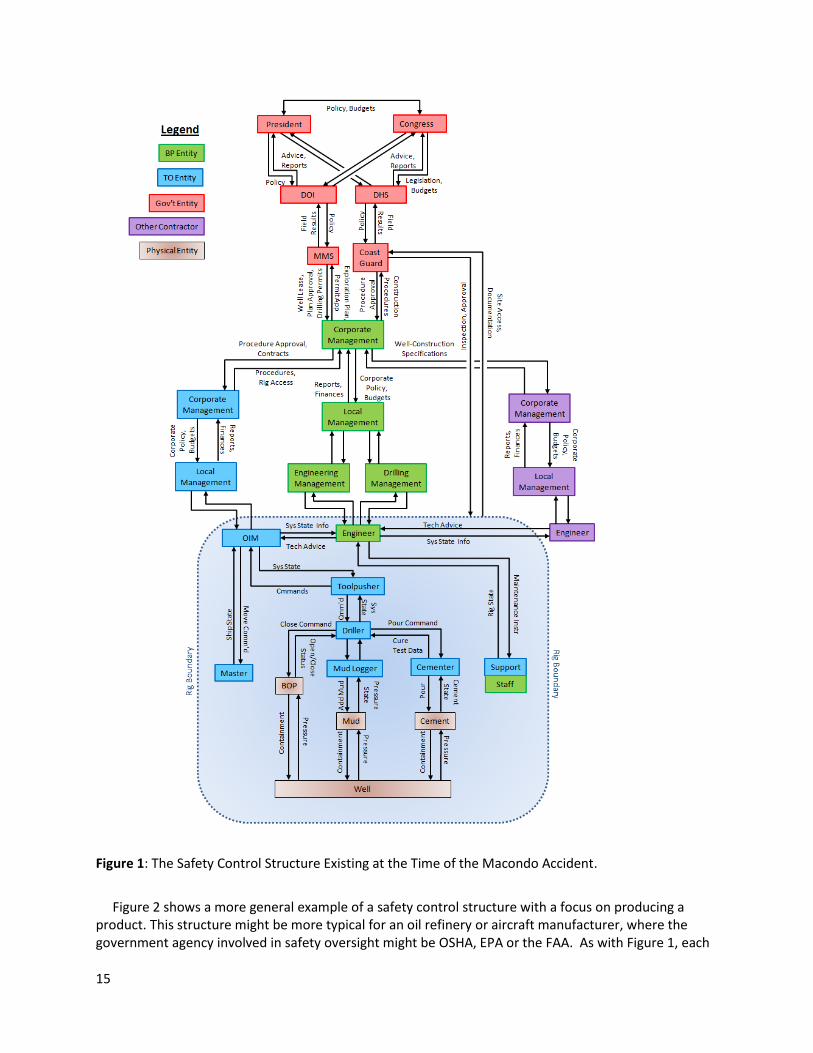
Safety-related constraints and the safety requirements are enforced by a safety control structure that must be carefully designed and evaluated to ensure that the controls are adequate to maintain the constraints on behavior necessary to control risk. Figure 1 shows the safety control structure existing at the time of the Macondo well blowout. Each component has specific assigned responsibilities for maintaining the safety of the system, that is, enforcing the safety constraints and preventing losses. For example, the mud logger is responsible for creating a detailed record of a borehole by examining the contents of the circulating drilling medium, the cementer is responsible for properly sealing off a wellbore, and local management has responsibilities for overseeing that these and other activities are carried out properly and safely. The government oversight agency may be responsible for ensuring that safe practices are being followed and acceptable equipment being used. And so on. Higher level component responsibilities may be broader than the components below them but no less important in maintaining safety.
Major accidents are rarely the result of unsafe behavior by only one of the components but usually the result of unsafe behavior and interactions involving all or most of the components in the control structure. When accidents occur and they are investigated thoroughly, as was true for the Macondo well blowout, it almost always turns out that more than one component (and often all) did not fulfill its control responsibilities. Also, as shown in Figure 1, more than one company may participate in the safety control structure, with the controllers of the components (whether part of their own company or another) having individual responsibilities for ensuring that the controlled processes or components are fulfilling their safety responsibilities. As long as the necessary constraints are enforced by someone or by several groups, different designs of the safety control structure can be equally effective.
15
Figure 1: The Safety Control Structure Existing at the Time of the Macondo Accident.
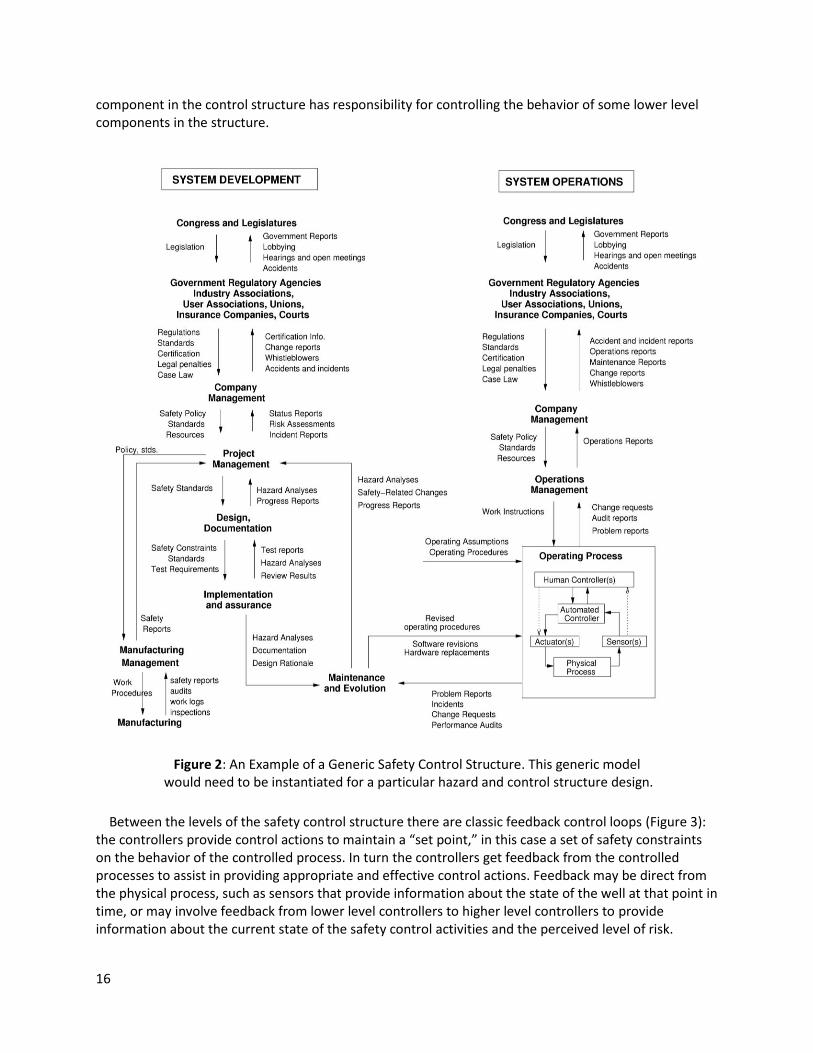
Figure 2 shows a more general example of a safety control structure with a focus on producing a product. This structure might be more typical for an oil refinery or aircraft manufacturer, where the government agency involved in safety oversight might be OSHA, EPA or the FAA. As with Figure 1, each
16
component in the control structure has responsibility for controlling the behavior of some lower level components in the structure.
Figure 2: An Example of a Generic Safety Control Structure. This generic model would need to be instantiated for a particular hazard and control structure design.
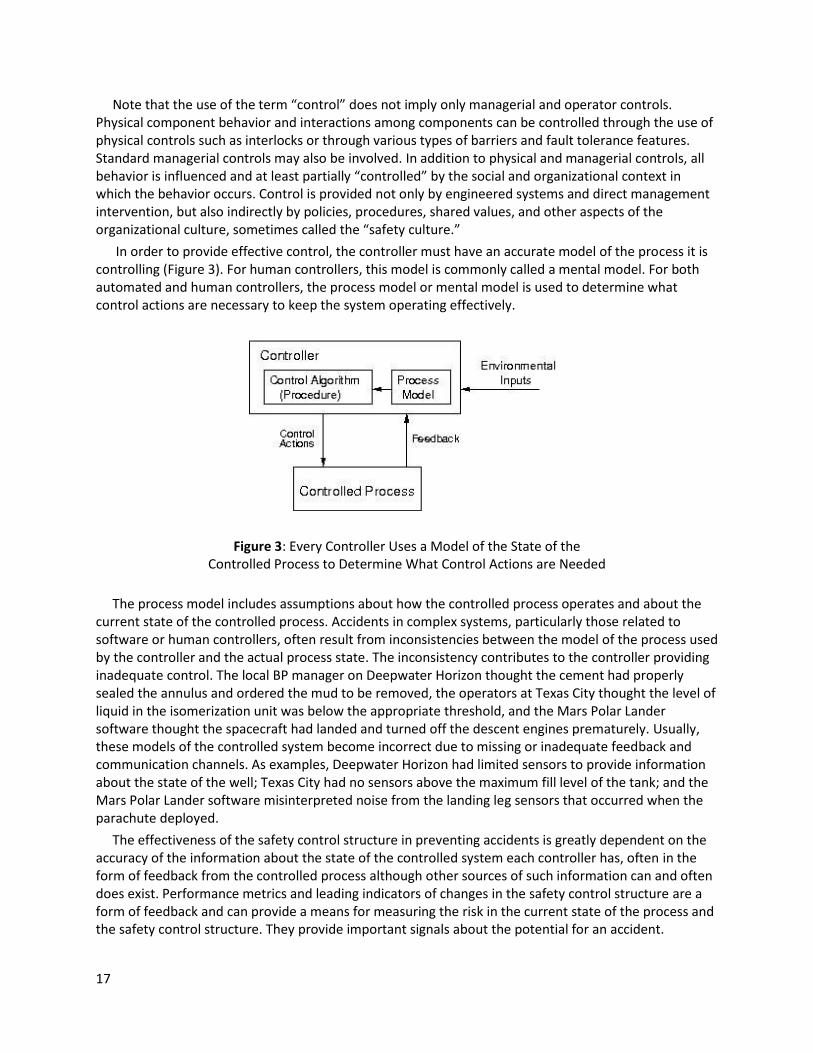
Between the levels of the safety control structure there are classic feedback control loops (Figure 3): the controllers provide control actions to maintain a “set point,” in this case a set of safety constraints on the behavior of the controlled process. In turn the controllers get feedback from the controlled processes to assist in providing appropriate and effective control actions. Feedback may be direct from the physical process, such as sensors that provide information about the state of the well at that point in time, or may involve feedback from lower level controllers to higher level controllers to provide information about the current state of the safety control activities and the perceived level of risk.
17
Note that the use of the term “control” does not imply only managerial and operator controls. Physical component behavior and interactions among components can be controlled through the use of physical controls such as interlocks or through various types of barriers and fault tolerance features. Standard managerial controls may also be involved. In addition to physical and managerial controls, all behavior is influenced and at least partially “controlled” by the social and organizational context in which the behavior occurs. Control is provided not only by engineered systems and direct management intervention, but also indirectly by policies, procedures, shared values, and other aspects of the organizational culture, sometimes called the “safety culture.”
In order to provide effective control, the controller must have an accurate model of the process it is controlling (Figure 3). For human controllers, this model is commonly called a mental model. For both automated and human controllers, the process model or mental model is used to determine what control actions are necessary to keep the system operating effectively.
Figure 3: Every Controller Uses a Model of the State of the Controlled Process to Determine What Control Actions are Needed
The process model includes assumptions about how the controlled process operates and about the current state of the controlled process. Accidents in complex systems, particularly those related to software or human controllers, often result from inconsistencies between the model of the process used by the controller and the actual process state. The inconsistency contributes to the controller providing inadequate control. The local BP manager on Deepwater Horizon thought the cement had properly sealed the annulus and ordered the mud to be removed, the operators at Texas City thought the level of liquid in the isomerization unit was below the appropriate threshold, and the Mars Polar Lander software thought the spacecraft had landed and turned off the descent engines prematurely. Usually, these models of the controlled system become incorrect due to missing or inadequate feedback and communication channels. As examples, Deepwater Horizon had limited sensors to provide information about the state of the well; Texas City had no sensors above the maximum fill level of the tank; and the Mars Polar Lander software misinterpreted noise from the landing leg sensors that occurred when the parachute deployed.
The effectiveness of the safety control structure in preventing accidents is greatly dependent on the accuracy of the information about the state of the controlled system each controller has, often in the form of feedback from the controlled process although other sources of such information can and often does exist. Performance metrics and leading indicators of changes in the safety control structure are a form of feedback and can provide a means for measuring the risk in the current state of the process and the safety control structure. They provide important signals about the potential for an accident.
18
The identification of assumptions to support a leading indicators program starts from the causes of accidents in Section 3.3 and the STAMP accident causality model. In general, safety critical assumptions involve:
1. Assumptions about the system hazards and the paths to (causes of) hazards. New hazards may arise or assumptions underlying the causal analysis of existing hazards may change.
2. Assumptions about the effectiveness of the controls, that is, the shaping and hedging actions, used to reduce or manage hazards. For example, the flare tower in a chemical plant may be sufficient to handle the maximum amount of gas released when the plant is designed, but changes in the plant or even new information about the hazards may invalidate these assumptions over time.
3. Assumptions about how the system will be operated and the environment (context) in which it will operate. For example, assumptions that the controls will be operating as assumed by the designers (e.g., refrigeration units would control the reactivity of the MIC at Bhopal). Assumptions about human behavior are particularly vulnerable as humans tend to adapt their behavior over time.
4. Assumptions about the development environment and processes
5. Assumptions about the organizational and societal safety control structure during operations, i.e., that it is working as designed, the design was adequate to ensure the system safety requirements are enforced, and the system controllers are fulfilling their safety responsibilities and operating as designed. For example, accident investigations often uncover the fact that some feedback and communication channels are broken or degraded and are not operating as assumed. Such assumptions include those about the state of the safety culture, for example, that the organizational safety policy is being followed.
6. Assumptions about vulnerability or severity in risk assessment that may change over time and thus require a redesign of the risk management and leading indicators system itself.
A process for identifying the first three technical (engineering) assumptions is described in Section 4.2 while identifying the last three managerial and organizational assumptions is discussed in Section 4.3.
4.2 Assumptions Underlying Engineering Decisions
TCAS II5 (Traffic alert and Collision Avoidance System) is used in this paper as an example of identifying safety-related engineering assumptions that can be used to create leading indicators. TCAS is a device required on most commercial and some general aviation aircraft that assists in avoiding midair collisions. It was intended to be an independent backup to the normal Air Traffic Control (ATC) system and the pilot’s “see and avoid” responsibilities by reading signals from air traffic control transponders on aircraft in its vicinity and analyzing them with respect to slant range and relative altitude. TCAS determines which aircraft represent potential collision threats and provides appropriate indications, called advisories, to the flight crew to assure proper separation. Two types of advisories can be issued: Resolution Advisories (RAs), which provide instructions to the pilots to ensure safe separation from nearby traffic in the vertical plane,6 and Traffic Advisories (TAs), which indicate the positions of intruding aircraft and may later cause resolution advisories to be displayed.
A sophisticated system engineering process should document the assumptions and rationale underlying the design decisions when they are made as that information is important in standard system engineering processes such as rework and upgrades. If assumptions and rationale have not already been specified, then a special effort will be needed to identify them.
5 TCAS is called ACAS in Europe. In the rest of this paper, it will be called simply TCAS.
6 Adding horizontal maneuvers is planned but not yet implemented for TCAS/ACAS.
19
Documentation is critical both in system engineering and in operating the systems that result. One way to integrate the assumptions and design rationale into the system engineering documentation is to use Intent Specifications [4,49], but other documentation methods can be used. Assumptions and design rationale are specified when needed to explain a decision or to record fundamental information on which the design is based. The italicized statements below are taken from an Intent Specification for TCAS II created by Leveson [50].
The goals for TCAS are:
G1: Provide affordable and compatible collision avoidance system options for a broad spectrum of National Airspace System Users.
G2: Detect potential midair collisions with other aircraft in all meteorological conditions; throughout navigable airspace, including airspace not covered by ATC primary or secondary radar systems, and in the absence of ground equipment.
From the goals, a set of high-level system requirements can be derived, for example:
1.18: TCAS shall provide collision avoidance protection for any two aircraft closing horizontally at any rate up to 1200 knots and vertically up to 10,000 feet per minute.
AssumptIon: This requirement is derived from the assumption that commercial aircraft can operate up to 600 knots and 5000 feet per minute during vertical climb or controlled descent and therefore two planes can close horizontally up to 1200 knots and vertically up to 10,000 fpm.
This assumption is an example of something that will need to be checked in the future to ensure that technological changes have not contradicted it and thus made vulnerable all the technical design decisions based on it (which can be identified by the traceability pointers in an intent specification).
Another system requirement is that:
1.19.1: TCAS shall operate in enroute and terminal areas with traffic densities up to 0.3 aircraft per square nautical miles (i.e., 24 aircraft within 5 nmi).
Assumption: Traffic density may increase to this level by 1990, and this will be the maximum density over the next 20 years.
Again, future aircraft performance limits may change or there may be significant changes in airspace management, such as reduced vertical separation or very different ways of handling air traffic. Lots of computations in TCAS are based on the assumption underlying requirement 1.19.1, and it needs to be monitored to trigger recomputation of safety parameters if it changes.
Another type of assumption may be specified to explain a decision or to record fundamental information on which the design is based. For example, the design may be based on assumptions about the environment in which the system will operate. Examples from TCAS include:
EA1: High-integrity communications exist among aircraft
EA2: The TCAS-equipped aircraft carries a Mode-S air traffic control transponder.7
EA3: All aircraft have operating transponders
EA4: All aircraft have legal identification numbers
EA5: Altitude information is available from intruding targets with a minimum precision of 100 feet.
EA6: The altimetry system that provides own aircraft pressure altitude to the TCAS equipment will satisfy the requirements in RTCA Standard …
EA7: Threat aircraft will not make an abrupt maneuver that thwarts the TCAS escape maneuver.
7 An aircraft transponder sends information that assists air traffic control in maintaining aircraft separation.
20
New technology and new types of aircraft integrated into controlled airspace could violate these assumptions. EA4 is an example of a non-technical assumption. Identification numbers are usually provided by the aviation authorities in each country. That assumption will need to be ensured by international agreement and monitored by some international agency. The assumption that aircraft have operating transponders (EA3) may be enforced by the airspace rules in a particular country and, again, must be ensured by some group. The truth of this assumption is critical as TCAS will not display any aircraft without an operating transponder nor provide an RA. EA7 is an example of an assumption on the behavior of pilots and the air traffic control system and could also be violated by the introduction of unmanned or other types of new aircraft into the airspace.
Some assumptions may be imposed on the system by environmental requirements and constraints. Those assumptions may lead to restrictions on the use of the new system (which will require assumption checking) or may indicate the need for system safety and other analyses to determine the constraints that must be imposed on the system being created or on the larger encompassing system to ensure safety. Examples for TCAS include:
E1: The behavior or interaction of non-TCAS equipment with TCAS must not degrade the performance of the TCAS equipment or the performance of the equipment with which TCAS interacts.
E2: Among the aircraft environmental alerts, the hierarchy shall be: Windshear has first priority, then the Ground Proximity Warning System (GPWS), then TCAS.
E3: The TCAS alerts and advisories must be independent of those using the master caution and warning system.
The process for identifying safety-critical assumptions also gets important input from system hazard analysis and the larger system engineering process within which such analyses are embedded. First, accidents for the system under consideration are defined. Without defining what is being considered as a loss, it is not possible to identify when a loss might be imminent. For TCAS, an important loss is a mid-air collision. Because TCAS can affect airworthiness and safety of flight in other ways, other types of losses need to be considered in addition, such as a collision with the ground (terrain).
Then the system hazards are identified. A hazard is a system state or set of conditions that, together with a particular set of worst-case environmental conditions, will lead to an accident (loss event). Hazards are defined as within the system boundaries, that is, within the control of the system designers. For TCAS, the hazards are:
H1: TCAS causes or contributes to a near midair collision (NMAC), defined as a pair of controlled aircraft violating minimum separation standards.
H2: TCAS causes or contributes to an aircraft coming too close to a fixed structure or natural terrain.
H3: TCAS causes or contributes to the pilot losing control over the aircraft.
H4: TCAS interferes with other safety-related aircraft systems (for example, ground proximity warning)
H5: TCAS interferes with the ground-based air traffic control system (e.g., transponder transmissions to the ground or radar or radio services).
H6: TCAS interferes with an ATC advisory that is safety-related (e.g., avoiding a restricted area or adverse weather conditions).
The first basic set of safety-critical assumptions is that hazards will not occur in a properly designed and operated system. Any occurrence of one of these hazards (even if an accident does not result) should trigger a complete review of the safety engineering process, in this case, the process used to
21
eliminate or mitgate TCAS hazards. Checking an assumption after the hazard has occurred is likely too late to prevent a loss, however, but the identification of hazards serves as a starting point from which earlier checks can be derived by identifying the scenarios that can lead to a hazard.
Additional assumptions can even at this high level be deduced, for example, that there is a ground-based air traffic control system (which could change in the future) and that TCAS will not interfere with its operation. While hazards rarely change, new ones may be introduced when changes are made to the system and the process used to handle them may be undermined.
Checks for the occurrence of hazards also provide important information about the adequacy of the hazard analysis process itself. The goal of hazard analysis and safety engineering is to identify hazards and then either eliminate or prevent them. If they cannot be prevented, then they need to be mitigated. Hazards that the engineers thought were eliminated or prevented should, of course, never occur. If they do, this event is an indication of flaws in the engineering process or perhaps in the assumptions made about the operational system, such as assumptions about pilot or air traffic controller behavior. It is not just enough to fix the technical process. The holes in the development process that allowed hazardous behavior to occur need to be fixed.
Ideally, flaws in engineering practices or operational behavior assumptions will be identified by leading indicators before the actual hazardous states occur. This goal can be achieved by identifying the assumptions underlying the hazardous scenarios identified by hazard analysis. Most of the traditional hazard analysis methods are limited to failure events or simple scenarios. Clearly, more powerful hazard analysis techniques, which can generate a larger set of causal scenarios, will be preferable. The causal scenarios are used to design the controls and thus form the assumptions under which the controls are created.
STPA [4] is a new hazard analysis technique based on the theoretical STAMP accident causality model. It is basically a rigorous method for examining the control loops in the safety control structure to identify scenarios or paths to accidents. Because the STAMP framework extends current accident models and thus includes accidents caused by component failure(s), STPA can not only identify the hazard scenarios typically generated by the traditional hazard analysis methods, but it also includes those factors not included or poorly handled by them such as software requirements errors, component interaction accidents, complex human decision-making errors, inadequate coordination among multiple controllers, and flawed management and regulatory decision making. STPA works not only on the physical system but on the management structure and organizational design, as discussed in the next section.
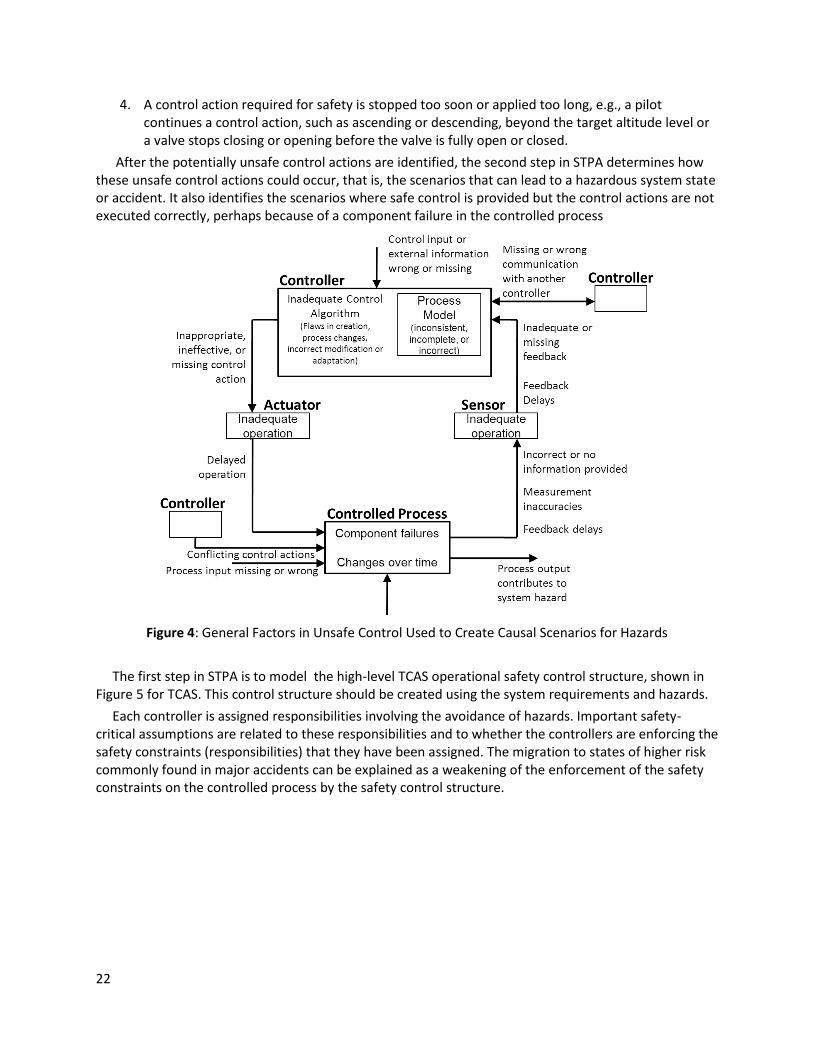
Figure 4 shows some of the types of general flaws considered in an STPA analysis. The analysis is performed on a specification of the system’s safety control structure and is broken into two steps in order to more carefully structure it.
The first step in STPA assists in identifying the safety control requirements and unsafe, ineffective, and missing control actions that can lead to hazards. There are four types of hazardous unsafe control:
1. An action required for safety is not provided or not followed, e.g., the operator does not close the intake valve when the tank is full.
2. An unsafe control action is provided, e.g., mud is removed before the well has been properly sealed.
3. A potentially safe control action is provided too early or too late, that is, at the wrong time or in the wrong sequence, e.g., the plant evacuation signal is delayed or, as in Bhopal, the operators do not investigate a reported leak until after the tea break.
22
4. A control action required for safety is stopped too soon or applied too long, e.g., a pilot continues a control action, such as ascending or descending, beyond the target altitude level or a valve stops closing or opening before the valve is fully open or closed.
After the potentially unsafe control actions are identified, the second step in STPA determines how these unsafe control actions could occur, that is, the scenarios that can lead to a hazardous system state or accident. It also identifies the scenarios where safe control is provided but the control actions are not executed correctly, perhaps because of a component failure in the controlled process
Figure 4: General Factors in Unsafe Control Used to Create Causal Scenarios for Hazards
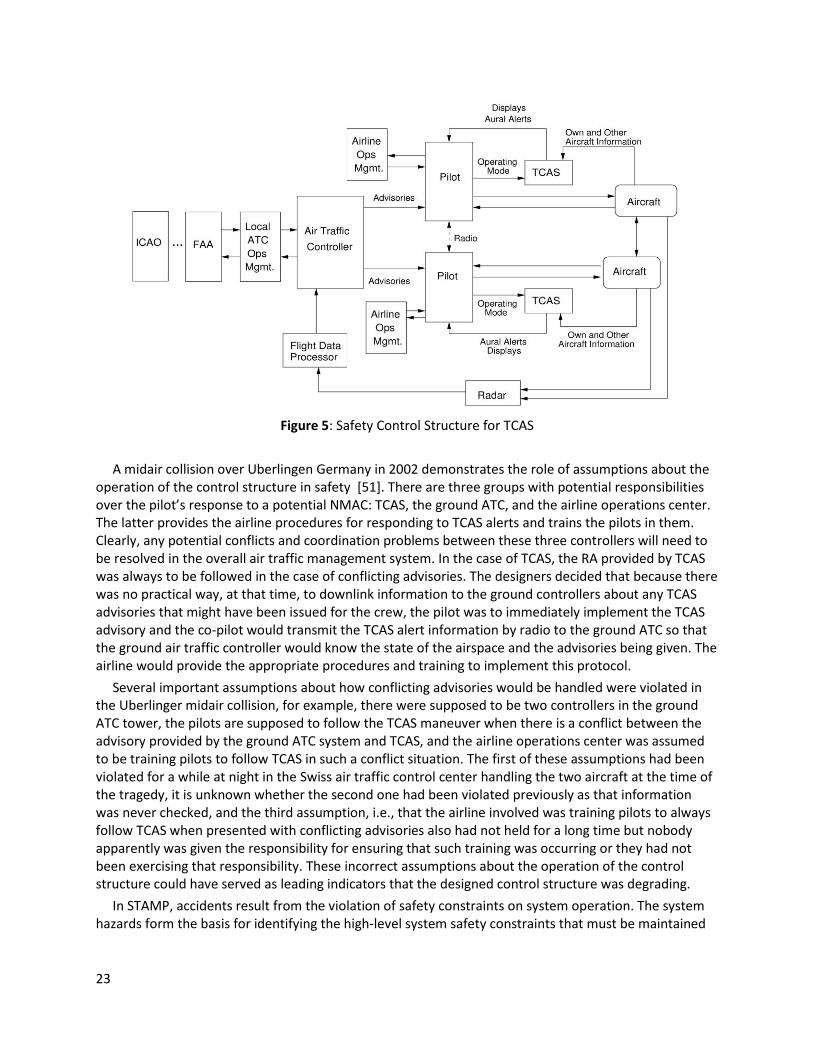
The first step in STPA is to model the high-level TCAS operational safety control structure, shown in Figure 5 for TCAS. This control structure should be created using the system requirements and hazards.
Each controller is assigned responsibilities involving the avoidance of hazards. Important safety-critical assumptions are related to these responsibilities and to whether the controllers are enforcing the safety constraints (responsibilities) that they have been assigned. The migration to states of higher risk commonly found in major accidents can be explained as a weakening of the enforcement of the safety constraints on the controlled process by the safety control structure.
23
Figure 5: Safety Control Structure for TCAS
A midair collision over Uberlingen Germany in 2002 demonstrates the role of assumptions about the operation of the control structure in safety [51]. There are three groups with potential responsibilities over the pilot’s response to a potential NMAC: TCAS, the ground ATC, and the airline operations center. The latter provides the airline procedures for responding to TCAS alerts and trains the pilots in them. Clearly, any potential conflicts and coordination problems between these three controllers will need to be resolved in the overall air traffic management system. In the case of TCAS, the RA provided by TCAS was always to be followed in the case of conflicting advisories. The designers decided that because there was no practical way, at that time, to downlink information to the ground controllers about any TCAS advisories that might have been issued for the crew, the pilot was to immediately implement the TCAS advisory and the co-pilot would transmit the TCAS alert information by radio to the ground ATC so that the ground air traffic controller would know the state of the airspace and the advisories being given. The airline would provide the appropriate procedures and training to implement this protocol.
Several important assumptions about how conflicting advisories would be handled were violated in the Uberlinger midair collision, for example, there were supposed to be two controllers in the ground ATC tower, the pilots are supposed to follow the TCAS maneuver when there is a conflict between the advisory provided by the ground ATC system and TCAS, and the airline operations center was assumed to be training pilots to follow TCAS in such a conflict situation. The first of these assumptions had been violated for a while at night in the Swiss air traffic control center handling the two aircraft at the time of the tragedy, it is unknown whether the second one had been violated previously as that information was never checked, and the third assumption, i.e., that the airline involved was training pilots to always follow TCAS when presented with conflicting advisories also had not held for a long time but nobody apparently was given the responsibility for ensuring that such training was occurring or they had not been exercising that responsibility. These incorrect assumptions about the operation of the control structure could have served as leading indicators that the designed control structure was degrading.
In STAMP, accidents result from the violation of safety constraints on system operation. The system hazards form the basis for identifying the high-level system safety constraints that must be maintained
24
for safety. Essentially the system safety constraints are the system safety requirements. For example, H5 gives rise to the following system safety constraint:
SC.2: TCAS must not interfere with the ground ATC system or other aircraft transmissions to the ground ATC system (H5).
STAMP assumes that accidents occur when safety constraints on the behavior of the system are violated. STPA hazard analysis identifies scenarios leading to the violation of the safety constraints (and thus the hazards). These scenarios lead to more detailed safety constraints and requirements on the design and operation of the system. For example, STPA can be used to identify causes for the violation of SC.2. This information can then be refined into a more detailed safety constraint SC2.1:
SC2.1 The system design must not interfere with ground-based secondary surveillance radar, distance-measuring equipment channels, and with other radio services that operate in the 1030/1090 MHz frequency band (2.5.1).
The assumption underlying a safe design of TCAS is that such interference will never occur. If it does, then this is a leading indicator that the design or operation of the system is flawed.
Humans tend to change their behavior over time and use automation in different ways than originally intended by the designers and assumptions about operator behavior provide an important source for identifying leading indicators. For example, H3 is that TCAS causes or contributes to the pilots losing control over the aircraft. Safety constraint SC.6, which is derived by STPA from H3, says:
SC.6: TCAS must not disrupt the pilot and ATC operations during critical phases of flight nor disrupt aircraft operation (H3, 2.2.3, 2.19, 2.24.2).
Besides identifying the related hazard from which this safety constraint was derived (in this case H3), the specification also points to features of the design (2.2.3, 2.19, and 2.24.2) used to control that hazard, i.e., to enforce SC.6. These controls also contain important assumptions that need to be checked. The most basic assumption is that these controls will be effective in preventing the hazardous scenario and that they are implemented correctly. For example, in the STPA analysis, one of the scenarios identified that could lead to the violation of SC.6 is that TCAS provides distracting resolution advisories while the pilot is on the ground or in the middle of taking off. A control was designed to prevent this scenario that allows the pilot to inhibit resolution advisories during critical phases of takeoff and landing:
SC6.1 The pilot of a TCAS-equipped aircraft must have the option to switch to the Traffic-Advisory-Mode-Only where traffic adviories are displayed but display of resolution advisories is inhibited (2.2.3).
Assumption: This feature will be used only during takeoff or in final approach to parallel runways, when two aircraft are projected to come close to each other and TCAS would call for an evasive maneuver.
Addition of the control, i.e., the ability of the pilot to inhibit TCAS resolution advisories by switching to TA-only mode, creates another hazardous scenario that must be controlled through pilot procedures, training, etc., and leads to another assumption that should be checked during operation of the system to ensure that pilots are not violating the assumption associated with SC6.1.
Other examples of operational procedures that were created to eliminate or control hazardous scenarios are:
OP4: After the threat is resolved, the pilot shall return promptly and smoothly to his/her previously assigned flight path.
OP9: The pilot must not maneuver on the basis of a Traffic advisory only
25
Because these procedures were created to counter specific scenarios that were identified as leading to hazards, they represent a source of assumptions that should be checked to identify hazardous behavior that could lead to an accident.
As another example, in the Uberlingen accident, there were additional causal factors not mentioned earlier. One was that maintenance was being performed on the ATC equipment at the time of the collision, which disabled the controller’s aural conflict alert. If the controller had known it was not working, he could have adjusted his behavior. This type of causal factor can be controlled in operational procedures, in this case, the procedures for performing maintenance while the ATC tower is still operating. An important assumption, of course, is that such procedures are being followed and this assumption will need to be checked.
A final source for assumptions that can be used to identify leading indicators is limitations in the design of safety-related controls. These limitations should be documented as they represent important information in the decision about whether the system should be deployed. Some limitations are related to the basic functional requirements, for example:
L4: TCAS does not currently indicate horizontal escape maneuvers and therefore does not (and is not intended to) increase horizontal separation.
Other limitations are related to the environmental assumptions, for example:
L1. TCAS provides no protection against aircraft without transponders or with nonoperational transponders (EA3).
L6: Aircraft performance limitations constrain the magnitude of the escape maneuver that the flight crew can safely execute in response to a resolution advisory. It is possible for these limitations to preclude a successful resolution of the conflict (H3, 2.38, 2.39)
L4: TCAS is dependent on the accuracy of the threat aircraft’s reported altitude. Separation assurance may be degraded by errors in intruder pressure altitude as reported by the transponder of the intruder aircraft (EA5)
An example assumption related to L1 is that the operation of aircraft without transponders will be precluded in operations.
Limitations may relate to hazards or hazard causal factors that could not be completely eliminated or controlled in the design: Thus they represent accepted risks.
L3: TCAS will not issue an advisory if it is turned on or enabled to issue resolution advisories in the middle of a conflict.
An implied assumption here is that pilots will, except under unusual circumstances, turn TCAS on before taking off, which can be checked in performance audits.
Finally, limitations may be related to problems encountered or tradeoffs made during system design. For example, TCAS has a high-level, performance-monitoring requirement that led to the inclusion of a self-test function in the system design to determine whether TCAS is functioning correctly. The following system limitation relates to this self-test facility:
L9: Use by the pilot of the self-test function in flight will inhibit TCAS operation for up to 20 seconds depending upon the number of targets being tracked. The ATC transponder will not function during some portion of the self-test sequence.
A safety-related assumption is that this behavior will be rare and therefore not result in frequent periods of non-operation of TCAS and therefore increased risk of an NMAC.
26
4.3 Management and Organizational Safety Control Structure Assumptions
To provide a richer example for deriving the assumptions underlying the management and organizational components of the safety control structure, the Space Shuttle operational safety control structure is used. After the Columbia accident, an Independent Technical Authority (ITA) with safety responsibility was integrated into the existing NASA manned space program management structure.
As with the engineering design process, design and operational effectiveness of the higher-levels of the safety control structure starts from the safety requirements, which are derived from the hazards. The hazard here will be broader than that for the technical process alone:
System Hazard: Poor engineering and management decision making leading to the loss of a Space Shuttle or serious injury to the crew.
This hazard can be used to generate detailed requirements, such as:
SC1: Safety considerations must be first and foremost in technical decision making.
SC1a: State-of-the-art standards and requirements for NASA missions must be established, implemented, enforced, and maintained that protect the astronauts, the workforce, and the public.
SC1b: Safety-related technical decision making must be independent from programmatic considerations, including cost and schedule.
SC1c: Safety-related decision making must be based on correct, complete, and up-to-date information.
SC1d: Overall (final) decision making must include transparent and explicit consideration of both safety and programmatic concerns.
SC1e: NASA must provide for effective assessment and improvement in safety-related decision making.
See [4] for the complete list of organizational safety constraints for this management system.
These safety requirements/constraints should be manifested in the safety control structure. An example of the Safety Control structure for the Shuttle program created after the Space Shuttle Columbia loss is shown in Figure 6.
The components have specific responsibilities with respect to maintaining safety in the Space Shuttle Program [4]. Part of the STPA analysis of the safety control structure involves ensuring that the high-level requirements/constraints are traceable to the component responsibilities and that adequate responsibility for ensuring the safety requirements has been allocated and designed into the structure.
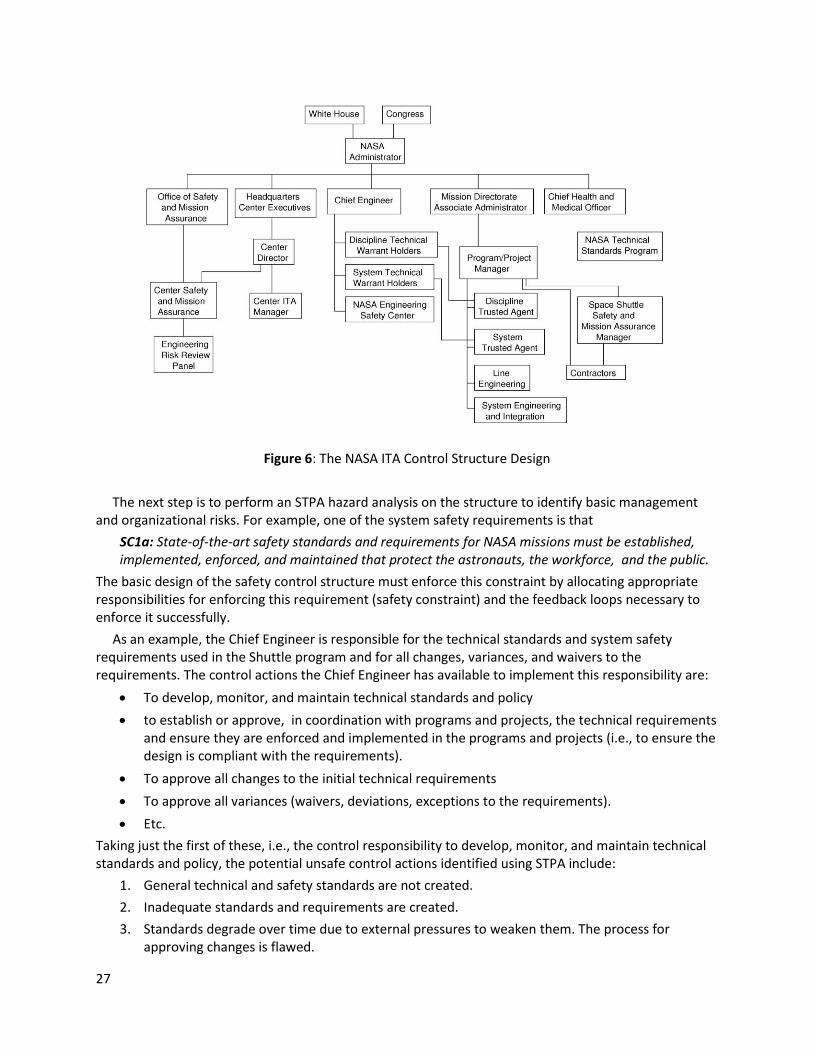
27
Figure 6: The NASA ITA Control Structure Design
The next step is to perform an STPA hazard analysis on the structure to identify basic management and organizational risks. For example, one of the system safety requirements is that
SC1a: State-of-the-art safety standards and requirements for NASA missions must be established, implemented, enforced, and maintained that protect the astronauts, the workforce, and the public.
The basic design of the safety control structure must enforce this constraint by allocating appropriate responsibilities for enforcing this requirement (safety constraint) and the feedback loops necessary to enforce it successfully.
As an example, the Chief Engineer is responsible for the technical standards and system safety requirements used in the Shuttle program and for all changes, variances, and waivers to the requirements. The control actions the Chief Engineer has available to implement this responsibility are:
To develop, monitor, and maintain technical standards and policy
to establish or approve, in coordination with programs and projects, the technical requirements and ensure they are enforced and implemented in the programs and projects (i.e., to ensure the design is compliant with the requirements).
To approve all changes to the initial technical requirements
To approve all variances (waivers, deviations, exceptions to the requirements).
Etc.
Taking just the first of these, i.e., the control responsibility to develop, monitor, and maintain technical standards and policy, the potential unsafe control actions identified using STPA include:
1. General technical and safety standards are not created.
2. Inadequate standards and requirements are created.
3. Standards degrade over time due to external pressures to weaken them. The process for approving changes is flawed.
28
4. Standards are not changed over time as the environment and needs change.
Each of these violates an assumption underlying the design of the safety control structure and could provide important information if included in a leading indicator program.
As another example, the Chief Engineer cannot perform all the duties listed above with respect to technical standards, so he or she has a network of people in the hierarchy below to whom some of the responsibilities are delegated or “warranted.” The chief engineer retains responsibility for ensuring that the warrant holders perform their duties adequately as in any hierarchical management structure.
The Chief Engineer responsibility to approve all variances and waivers to technical requirements is assigned to the System Technical Warrant Holder (STWH). The risks or potentially unsafe control actions of the STWH with respect to this responsibility are:
1. An unsafe engineering variance or waiver is approved.
2. Designs are approved without determining conformance with safety requirements. Waivers become routine.
3. Reviews and approvals take so long that ITA becomes a bottleneck. Mission achievement is threatened. Engineers start to ignore the need for approvals and work around the STWH in other ways.
In fact, all of these risks were part of the causal factors in the Space Shuttle Columbia loss. They were, unfortunately, not identified as such at the time [45]. Once again, they represent a migration of the state of the shuttle program safety control structure over time due to financial and time pressures. The ITA program was designed to prevent a reoccurrence. But the same financial and political pressures that led to the loss still existed after the Shuttle program operation resumed, and the assumptions underlying the design of the new ITA management structure should have been part of a leading indicators program.
Important assumptions also arise from the safety culture. The safety culture is the set of values and deep cultural assumptions upon which safety-related actions are taken and decisions are made in the safety control structure. Although these assumptions are not directly reflected in the design of the structure, they are implicit in its operation because they affect the behavior of the human controllers and human-implemented controls and also underlie the basic requirements (such as SC1 above), i.e. that safety considerations will be first and foremost in decision making.
The core organizational safety values (the desired safety culture) of the organization should be documented along with providing education and buy-in by all employees. A critical assumption underlying safety is that the safety culture is accepted and underlies decision making. The weakening or inaccuracy of this assumption is an important leading indicator that risk is increasing [4].
4.4 Assumptions Underlying Coordination Risks
The risks and assumptions underlying the safety control structure (at both the operational process and organizational control structure levels) may also involve coordination problems. Coordination risks arise when multiple people or groups control the same process. The types of unsafe interactions that may result include: (1) both controllers assume that the other is performing the control responsibilities and, as a result, nobody does or (2) controllers provide conflicting control actions that have unintended side effects. Coordination problems among multiple controllers were a factor in the Uberlingen accident.
When similar responsibilities related to the same system requirements are assigned to multiple controllers, then the assumptions that the control structure designers made about how the actions would be coordinated need to be recorded and used in the leading indicators program.
29
5. An Assumption-Based Leading Indicator Program Once safety-related assumptions are identified and documented, they can be used as the basis for a leading indicators program. Such a program has three aspects: (1) identifying appropriate and effective leading indicators, (2) creating a safety indicator monitoring program to use them, and (3) embedding this monitoring system within a risk management program. The next three sections propose a process for each of these in turn.
5.1 A Structured Process for Identifying Leading Indicators based on STAMP
In general, the assumptions under which the system will be used and the environment in which the system will operate are of three types: 1. The models and assumptions used during initial decision making and design are correct. 2. The system will be constructed, operated, and maintained in the manner assumed by the designers. 3. The models and assumptions are not violated by changes in the system, such as workarounds or
unauthorized changes in procedures, or by changes in the environment. These assumptions are used to determine what should be checked, how, when, and what actions should be taken if the checking determines an assumption is no longer true. As shown in Section 4, STPA can be used to generate specific assumptions underlying the safety of a particular system, including the assumptions underlying the shaping and hedging actions designed to prevent the hazards. The next step is to generate leading indicators that will detect when these assumptions no longer hold. First the vulnerability of the assumptions needs to be determined. Even if an assumption is judged to be vulnerable, it may only be so if a significant change occurs in the system or the environment. An example may be a change in air traffic control procedures or in the performance ability of the aircraft that operate in controlled airspace. Specific signposts can then be identified from the appropriate assumptions that will trigger management of change procedures, particularly a reanalysis of the impact of the specific change on safety. Using the vulnerability and severity associated with the failure of the assumptions, the creation of leading indicators is straightforward. Each leading indicator should be specified along with the
Associated assumption(s),
How it will be checked
When it will be checked
The (hedging) action(s) to take if the indicator is true (the assumption is violated).
For example, for the Shuttle ITA example in Section 4.2, one assumption of the program is that the ITA will provide an independent assessment of the safety of decision making. One potential cause of the program to violate this assumption is that reviews and approvals take so long that engineers start to ignore the need for approvals and work around the required process. A leading indicator here might be that the time for the ITA to perform reviews and grant approvals starts to increase. Collecting this data would be assigned as someone’s responsibility. If the time does increase significantly over time, then a review of why that increase was occurring would be made in order to design control structure and programmatic changes to bring the times down to acceptable limits.
Once again, documentation is critical. The assumptions need to be recorded and used to plan operations, to design the data and feedback that must be collected (Section 5.2), and to design the overall leading indicator program (Section 5.3). The relative importance of the leading indicators (the consequences of not detecting something) and potential action plans upon their failure is determinable by ranking the severity of the hazards to which they are traceable.
30
Leading indicators will be similar for different organizations only to the extent that the hazards, safety constraints, system design and safety control structure are similar. There are potentially many designs for an effective safety control structure and leading indicators will need to be identified for the particular one being used. For refineries owned by one company, the leading indicators may be different for each physical refinery design but more general leading indicators at higher levels in the safety control structure, such as the organization’s safety management system design, may apply organization wide. Alternatively, all companies using the same off-shore oil drilling rig may be able to use similar leading indicators related to the common physical platform, but appropriate indications may differ with respect to the management and operations of the organizations using the platform. Basically, the leading indicators should reflect the specific physical or organizational structure they are monitoring.
Notice that in the process being proposed in this paper, the causal scenarios are identified before categorizing hazards with respect to vulnerability. In the more common Preliminary Hazard Analysis (PHA) process, hazards are identified and then a likelihood estimate is assigned. The hazards with low likelihood assessments may be dismissed from further consideration in development and operations or limited effort put into preventing them. This assessment occurs before hazard analysis is performed to determine the causal scenarios and how easily they might be eliminated or controlled. Given the difficulty in determining likelihood at that early stage in a complex new system design, the lack of detailed information about causality before hazard analysis is performed, and the known effects of heuristic biases, PHA risk assessments can be very inaccurate. This author has been involved in the investigation of many accidents that were caused by hazards that were dismissed as not credible by a probabilistic likelihood estimate and no protection therefore provided.
One reason for the incorrect dismissal of hazards early in the process is that detailed designs are required for most hazard analysis techniques. STPA, in contrast, can be performed early in the system concept development stage and refined as design decisions are made. That is, a hazard analysis can be started immediately after the system hazards are identified and the information it provides can be used to identify underlying assumptions and make decisions about vulnerability and potential risk as well as the shaping and hedging actions and signposts that might be used. The result would be a more nuanced and informed risk analysis process rather than simply tossing out any consideration of the risk involved in an event that is identified as improbable.
This change also has an impact on heuristic biases. One of the ways heuristic biases can be reduced, as stated earlier, is to focus on causal mechanisms. By identifying and understanding the causal scenarios, better decisions can be made about vulnerability and even likelihood. While heuristic biases can still operate in the face of full or extensive information, they are likely to be reduced. Many of the heuristic biases described in Section 2.2 involve oversimplification of accident causes. Using a powerful hazard analysis technique that generates more causal scenarios will result in better decision making.
Once the leading indicators have been identified, a safety indicator monitoring program must be designed.
5.2 Operationalizing a Leading Indicators Monitoring Program
Many, if not most, of the identified safety-critical assumptions can be handled through designed shaping and hedging actions and signposts. Assumption checking then reduces to checking that these actions are effective.
Monitoring for leading indicators can be done partially through the established organizational accident/incident analysis process and error reporting systems. The effectiveness of this solution assumes that all accidents and incidents are investigated thoroughly. The use of CAST [4], an accident/incident investigation analysis process based on STAMP, will help with this goal. Whatever
31
process is used, the leading indicator program needs to be tightly integrated with the incident or adverse events investigation process.
Using the occurrence of adverse events as a primary way to identify leading indicators will be of limited effectiveness. Tjerk and colleagues have studied why people do not report errors and bias in incident reporting [52].
Additional checking should be incorporated, such as periodic performance audits, for example to identify changing behavior, or in continued or periodic measurements and assumption checking. If the safety constraints are being enforced by a process, it may only be necessary to check occasionally that the process is being carried out as designed rather than continually checking the failure of each individual assumption.
Various designs of a leading indicator monitoring program are possible. For example, Dokas et. al. have created a process called EWaSAP (Early Warning Sign Analysis using STPA) as an addition to STPA [53]. EWaSAP adds steps to (a) define the data indicating the violation of safety constraints and design assumptions within the system or process and (b) specify the capabilities and characteristics of the sensors, in order to be able to perceive these data.
EWaSAP operationalizes an early warning sign and defines it as the value of an observation provided by a sensor, which according to the process models and accident scenarios identified by STPA indicates the presence of causal factors for a potential loss or the violation of safety-related constraints and assumptions. He adds an additional type of control action, an awareness action, to the general control loop shown in Figure 3. An awareness control action allows a controller to provide a signal to other controllers inside or outside the system boundary whenever data indicating the presence of vulnerabilities have been perceived and comprehended. A set of additional guidewords is also added to STPA (Figure 4) that specifically relate to the transmission of early warning signals. Perceived signs and warning signals must be designed so they do not contribute to system hazards.
EWaSAP was used experimentally on a drinking water treatment plant to identify leading indicators and compare them to the ad hoc leading indicators already used by the operators and managers of the plant [53]. The new process resulted in identifying 43 warning signs of which 37 were new and 6 already were used in everyday operations. Fourteen warning signs were deemed by management and staff to be of sufficient importance that they were incorporated into the existing safety management system at the plant.
EWaSAP focuses on physical leading indicators. It is also necessary to generate leading indicators to detect weaknesses and changes in the safety control structure and the safety culture. The same or similar approach to operationalizing a monitoring program may apply to the complete safety control structure and to cultural leading indicators. For example, leading indicators can be generated from the corporate safety philosophy and safety policy can be used as a basis for designing surveys to detect degradation of the safety culture within the organization.
5.3 Managing a Leading Indicators Program
General management principles apply here, but some specific features are especially important. Even if the right information is clear and available about elevated risk in the plant or organization, many companies are still slow to process these signals and respond. This paper so far has discussed how to identify leading indicators and operationalize them as shaping and hedging actions and warning signals. But having leading indicators will not help if they are not used or do not result in appropriate action being taken. As described in the section on psychological biases about risk, too often defensive avoidance is practiced and clear leading indicators are ignored until there is an accident.
32
To encourage effective action, leading indicators have to be integrated into the risk management program. Not only must they be communicated to appropriate decision makers, but detailed action plans for critical scenarios should be developed and triggers specified for implementing those action plans. Responsibilities need to be assigned for checking the existence of the leading indicators and for following through if problems are found.
Every leading indicator should indicate when and how it will be checked and must have an action associated with it. Required action plans should be created before the assumptions are found to be invalid in order to lessen denial and avoidance behaviors and overcome organizational and cultural blinders. Responsibility for monitoring and action may need to be assigned to an independent organization and not to the project managers and those under conflicting pressures.
Periodically the list of leading indicators needs to be revisited and, if necessary, updated. A continuous improvement process should be created that both reevaluates the current indicators over time in the light of experience and diagnoses any identified lack of effectiveness. For example, if an accident or serious incident occurs that was not presaged by the leading indicators, an analysis should be made of why the leading indicators did not identify the problems in time to prevent the events or, if they did, why effective action was not taken. The entire leading indicators program should then be evaluated and improved using this information. Was a leading indicator identified but not checked? If an appropriate leading indicator had not been identified, then it clearly must be added. In addition, the reason for its exclusion should be determined as that reason can involve a flaw in the process and lead to identifying other important safety-critical assumptions that are not being checked.
5.4 Feasibility
An important question may arise in the reader’s mind at this point as to the feasibility of documenting and checking all the vulnerable assumptions in complex systems. Most of the assumptions that need to be identified and documented are already considered during system development but may not be documented as such. The only new aspects are documenting them and using them in a leading indicators program.
Documentation of assumptions underlying engineering decisions is important for other reasons, such as making changes in the future, particularly safety-critical changes. The process of documenting assumptions (design rationale) can be justified for more than a leading indicators program.
Leveson, while participating in the certification of TCAS II, documented the assumptions underlying the safety assessment and design of this complex system [49,50]. It did not take an unreasonable effort, and it was done before the tools described in this paper were developed. This anecdotal experience is clearly not scientific proof, of course, and more careful evaluations are necessary.
Additional data for applying this approach to the management and social aspects of the safety control structure was acquired in the application of an early version of the approach in this paper to the risk analysis of the NASA ITA structure when it was originally designed. The resulting list contained 250 potential risks, which seems like a large number but not when compared to the 600 metrics that were being collected monthly at that time on the Shuttle program. Most of the 250 risks could be handled with hedging and shaping actions and did not require continual assessment [54].
Finally, Dokas and colleagues have applied EWaSAP successfully in industrial safety-critical systems and found it to be feasible.
One final aspect of feasibility is the cost of using vulnerability versus likelihood. Essentially, the use of vulnerability implies planning for the worst case and not just the likely case. A major reason for using likelihood early—even though the information to determine such likelihood is usually not available for new systems—is to avoid a lot of hazard analysis expense. In practice, STPA appears to be much cheaper
33
and requires many fewer resources than the traditional hazard analysis techniques [4] so the cost may not be prohibitive to examine more hazards in depth. In addition, if full analysis is not possible, then at least it is possible to note where some risk was allowed because a hazard could not be eliminated or controlled. This information can be used to create leading indicators to determine if those decisions were flawed. Finally, even without detailed analysis of all the potential causes, it is often possible to provide protection (a shaping or hedging action and signposts) against a hazard knowing only the hazard itself and not all of its causes. The protection may not be as efficient as that which could have been created with more causal information, but if the vulnerability of the assumptions underlying the hazard truly is low, the drawbacks of an inefficient or more costly response if it occurs may not be very important.
6. Conclusions This paper proposes assumptions and their vulnerability as the basis for identifying leading indicators rather than the classic probabilistic risk methods. It also proposes a process for identifying leading indicators and using them in a risk management program. The same process can be used for identifying and managing risks other than safety. For example, Samadi used STAMP in a general programmatic risk analysis for CO2 capture, transport, and storage [55]. Georges used it to analyze the risk of quality loss in complex system design [56].
The STAMP/STPA process for safety-guided design and hazard analysis provides the framework for the structured leading indicator identification process. System hazards are first identified and used to derive the safety constraints and system safety requirements. Hazards are categorized, if necessary, with respect to potential worst-case severity and vulnerability. The functional safety control structure is designed with safety responsibilities identified for each component, where these control responsibilities are traceable to the system safety constraints. Once the safety control structure is created, STPA is used to identify unsafe control actions and their causes. An attempt to eliminate the causes is first attempted and, if elimination is not possible, to mitigate and control them. Using the assumptions underlying the hazard analysis process and the system design and management features used to control the identified hazard scenarios, leading indicators are developed to identify weakening effectiveness of the controls to enforce the safety constraints and ways to measure or identify the leading indicators.
One of the goals of the proposed process is to reduce the well-known and common heuristic biases that lead to flawed risk assessment. While biases can never be completely eliminated, they can be reduced by concentrating on plausibility (vulnerability) rather than likelihood, using a structured process for assessing risk, specifying required responses to failed assumptions, employing worst-case analysis, and identifying causal mechanisms through a structured process before making risk-related decisions.
References [1] Khawaji, Ibrahim. Developing System-Based Leading Indicators for Proactive Risk Management in the
Chemical Processing Industry, SM Thesis, MIT, 2012.
[2] Rasmussen, Jens. “Risk management in a dynamic society: A modeling problem,” Safety Science 27 (2/3): 183-213, 1997.
[3] Leveson, Nancy. “A new accident model for engineering safer systems,” Safety Science, 42(4):237-27, 2004.
[4] Leveson, Nancy. Engineering a Safer World: Applying Systems Thinking to Safety, MIT Press, 2012.
[5] American Bureau of Shipping, Safety Culture and Leading Indicators of Safety, January 2012, Houston TX.
34
[6] International Council on Mining and Metals, Leading Indicators for Occupational Health and Safety in Mining, ICMM, 2012.
[7] The BP Grangemouth Major Incident Investigation Report, UK Health and Safety Executive, August 2003.
[8] American Institute of Chemical Engineers, Center for Chemical Process Safety Center of Chemical Process Safety, Layer of Protection Analysis. New York: Wiley & Sons, 2001.
[9] American Institute of Chemical Engineers, Center for Chemical Process Safety Center of Chemical Process Safety, Guidelines for Risk Based Process Safety. New Jersey: Wiley & Sons, 2007.
[10] American Institute of Chemical Engineers, Center for Chemical Process Safety Center of Chemical Process Safety, Process Safety Leading and Lagging Metrics. 2008.
[11] American Institute of Chemical Engineers, Center for Chemical Process Safety Center of Chemical Process Safety, Guidelines for Process Safety Metrics. New Jersey: Wiley & Sons, 2010.
[12] Guidance on Developing Safety Performance Indicators, OECD Working Group on Chemical Accidents, 2003.
[13] Organization for Economic Coordination and Development (OECD), Guidance on Safety Performance Indicators. Environment, Health and Safety Publications, 2008.
[14] Step-by-Step Guide to Developing Process Safety Performance Indicators, UK Health and Safety Executive, HSG254, 2006.
[15] Process Safety Management of Highly Hazardous Chemicals Regulation, The U.S. Occupational Safety and Health Administration (OSHA), Title 29 of CFR Section 1910.119, 1991.
[16] Functional Safety: Safety Related Systems, IEC 61511, 2008. 79
[17] Leading Performance Indicators: A Guide for Effective Use, Step-Change in Safety, 2001.
[18] Guide to Report Process Safety Incidents, the American Petroleum Institute, 2008.
[19] Process Safety Performance Indicators for the Refining and Petrochemical Industries, the American Petroleum Institute, ANSI/API 754, First Edition, April 2010.
[20] James P. Bagian. The opportunity of precursors, in Phimister JR, Bier VM, Kunreuther HC, editors.
Accident precursor analysis and management: reducing technological risk through diligence.
Washington, DC: The National Academies Press; 2004 p. 127-36.
[21] William R. Corcoran, “Defining and analyzing precursors,” in Phimister JR, Bier VM, Kunreuther HC,
editors. Accident precursor analysis and management: reducing technological risk through diligence.
Washington, DC: The National Academies Press; 2004 p. 127-36.
[22] Mihal Tamuz, “Understanding accident precursors,” in Phimister JR, Bier VM, Kunreuther HC,
editors. Accident precursor analysis and management: reducing technological risk through diligence.
Washington, DC: The National Academies Press; 2004 p. 127-36.
[23] M.E. Pate-Cornell, Warning systems in risk management, Risk Analysis, 5(2): 223-234
[24] Martin B. Sattison, “Nuclear accident precursor assessment,” in Phimister JR, Bier VM, Kunreuther
HC, editors. Accident precursor analysis and management: reducing technological risk through
diligence. Washington, DC: The National Academies Press; 2004 p. 127-36.
[25] Trond Kongvik, Petter Almklov, Jorn Fenstad. Organizational safety indicators: Some conceptual
considerations and a supplementary qualitative approach. Safety Science, 48: 1402-1411, 2010.
35
[26] Flin, R., Mearns, K., O’Connor, P., Bryden, R., 2000. Measuring safety climate: Identifying the common features. Safety Science 34:177–192.
[27] K. Oien, I.B. Utne, R.K. Tinmannsvik, S. Massaiu, Building aafety indicators: Part 2 — Application, practices, and results. Safety Science 49: 162-171, 2011.
[28] Murphy, D.M., Patè-Cornell, E.M., 1996. The SAM framework: modelling the effects of management factors on human behaviour in risk analysis. Risk Analysis 16: 501–515.
[29] Hale, A.R., Ale, B.J.M., Goossens, L.H.J., Heijer, T., Bellamy, L.J., Mud, M.L., Roelen, A., Baksteen, H., Post, J., Papazoglou, I.A., Bloemhoff, A., Oh, J.I.H., 2007, “Modeling accidents for prioritizing prevention,” Reliability Engineering and System Safety 92: 1701–1715.
[30] K. Oien, I.B. Utne, I.A. Herrera, Building safety indicators: Part 1 — Theoretical foundation. Safety Science 49: 148-161, 2011.
[31] Hudson, P., 2009. “Process indicators: managing safety by the numbers,” SafetyScience 47: 483–485.
[32] Andrew Rae, John McDermid, and Rob Alexander. “The science and superstition of quantitative risk assessment, Proceedings of Probabilistic Safety Assessment and Management (PSAM) Conference 11, International Association for Probabilistic Safety Assessment and Management (IAPSAM), Helsinki, June 2012, pp. 2292-2301.
[33] M. Manion, “The epistemology of fault tree analysis: An ethical critique,” Int. Journal of Risk Assessment and Management, 7(3), 2007.
[34] H.W. Lewis, R.J. Budnitz, W.D. Rowe, H.J.C. Kouts, F. von Hippel, W.B. Loewenstein, and F. Zachariasen, “Risk assessment review group to the U.S. Nuclear Regulatory Commission,” IEEE Trans. Nucl. Sci., 26(5): 4686-4690, 1979.
[35] Leveson, Nancy, Safeware, Boston: Addison-Wesley Publishers, 1995.
[36] Follensbee, Robert E. Six Recent Accidents/Incidents where the Probability of Occurrence Calculates to Less than 10-9, http:/sunnyday.mit.edu/16.863/follensbee.html, 1993.
[37] Matthew Wald; Jad Mouwad (2013-01-25). “Protracted fire inquiry keeping 787 on ground, New York Times. http://www.nytimes.com/2013/01/25/business/the-ntsb-sees-lengthy-inquiry-into-787-dreamliner.html?_r=1&, Retrieved 2013-01-2
[38] Kahneman, D. and Tversky, A. "On the psychology of prediction". Psychological Review 80 (4): 237–251, 1973
[39] Tversky, A. and D. Kahneman, D. "Availability: A heuristic for judging frequency and probability," Cognitive Psychology 5 (2): 207–232, 1973.
[40] Tversky, A. and Kahneman, D. "Judgment under uncertainty: Heuristics and biases," Science 185 (4157): 1124–1131, 1974.
[41] Tversky, A. and Kahneman, D. "The framing of decisions and the psychology of choice," Science, 1981
[42] D. Kahneman, D., Slovic, P., and Tversky, A. Judgment Under Uncertainty: Heuristics and Biases, New York: Cambridge University Press, 1982
[43] Slovic, P., Fischhoff, B., and Lichtenstein, S. Facts and fears: Understanding perceived risk,” Societal Risk Assessment, 181-216, 1980
[44] Dewar, James. Assumption-Based Planning, Cambridge University Press, 2002.
[45] Leveson, N.G. “Technical and managerial factors in the NASA Challenger and Columbia losses: Looking forward to the future,'' in Handelsman and Fleishman (eds.), Controversies in Science and Technology, Vol. 2: From Chromosomes to the Cosmos}, Mary Ann Liebert, Inc., 2007.
36
[46] Nuclear Regulatory Commission, Glossary, http://www.nrc.gov/reading-rm/basic-ref/glossary/design-basis-accident.html, 2014
[47] CBS News, “Oil blowout preventers known to fail,” www.cbsnews.com/ap-oil-blowout-preventers-known -to-fail/, May 8, 2010
[48] Shanks, Earl, Andrew Dykes, Marc Quilici, and John Pruitt, “Deepwater BOP control systems – A look at reliability issues,” Paper OTC 15194, Offshore Technology Conference, 2003.
[49] Leveson, N.G. ``Intent specifications: An approach to building human-centered specifications,'' Transactions on Software Engineering, SE-26, No. 1, January 2000
[50] Leveson, N.G. and Reese, Jon D. “TCAS Intent Specification,” http://sunnyday.mit.edu/papers/tcas-intent.pdf
[51] Bundesstelle fur Flugunfalluntersuchung, Investigation Report, German Federal Bureau of Aircraft Accidents Investigation, May 2004.
[52] Tjerk van der Schaaf and Lisette Kanse, “ Checking for biases in incident reporting,” in Phimister JR, Bier VM, Kunreuther HC, editors. Accident precursor analysis and management: Reducing technological risk through diligence. Washington, DC: The National Academies Press; 2004 p. 127-36.
[53] Dokas, Ioannis M., Feehan, John, and Imran, Syed. “EWaSAP: An early warning sign identification approach based on a systemic hazard analysis,” Safety Science, Vol. 58, Oct. 2013, pages 11-26.
[54] Leveson, N.G., Dulac, N., Cutcher-Gershenfeld, J., Barrett, B., Carroll, J, Zipkin, D., and Friedenthal, S. ``Modeling, analyzing, and engineering safety culture,'' 1st Int. Conference of the Association for the Advancement of Space Safety, Nice, Oct. 2005.
[55] Samadi, Jaleh. Development of a Systematic Risk Management Approach for CO2 Capture, Transport, and Storage Projects, Ph.D. Dissertation, Ecole Nationale Superieure des Mines de Paris, December 2012.
[56] Georges, Stephanie. A System Theoretic Approach for Determining Causal Factors of Quality Loss in Complex System Design, MIT S.M. Thesis, Engineering Systems Division, February 2013.


![[02]JSR Stamp Spacecraft Leveson](https://img.pdfslide.us/doc/110x75/577cd8881a28ab9e78a16415/02jsr-stamp-spacecraft-leveson.jpg)


![The Leveson Report: implementation · statutory underpinning), he expressed his support for Leveson’s key proposal: [Lord Justice Leveson] has found that changing the law is the](https://img.pdfslide.us/doc/110x75/5e7eabca53ab7515da1e4843/the-leveson-report-implementation-statutory-underpinning-he-expressed-his-support.jpg)