Embed Size (px)
Citation preview
A Systemic-Structural Activity Approach to theDesign of Human–Computer Interaction Tasks
Gregory BednyDivision of Social Sciences
Essex County College
Waldemar KarwowskiCenter for Industrial Ergonomics, Department of Industrial Engineering
University of Louisville
In this article, a new approach to the study of human–computer interaction (HCI)from the activity theory perspective is presented. A computer-based task was selectedfor demonstration purposes. Due to its complexity, variability, and number of mentalcomponents, the selected computer-based task presented difficulties in observationand formal description. Other tasks involving computers bared similar difficulties. Inthis study, it is demonstrated that activity theory, which has precise units of analysisand carefully elaborated concepts and terminology, can be useful in the study of HCIs.The examination and description of the computer-based task in this study are carriedout through a systemic-structural analysis approach associated with activity theory.
1. INTRODUCTION
At present, there is a gap between research studies and applied human–computerinteraction (HCI) design. Some scientists assert that software designers can derivethe relation between theoretical studies and practical guidelines from the humaninformation approach alone. More commonly, guidelines are based on practical ex-perience without the use of an underlying theory. As a result, some of the designrecommendations are fragmented and may lack precision or coherence (for furtherdiscussion, see Bannon & Bodker, 1991; Kuutti, 1996, Nardi, 1997). Despite such de-ficiencies, cognitive psychology that is based on human information processingmay be adapted for practical use. The human information approach was devel-oped as a theoretical basis for the study of the psychological aspects of humanbrain functions. Frequently, supplementary methods of study develop theoreticalconcepts enabling the application of theories to practice.
INTERNATIONAL JOURNAL OF HUMAN–COMPUTER INTERACTION, 16(2), 235–260Copyright © 2003, Lawrence Erlbaum Associates, Inc.
Requests for reprints should be sent to Waldemar Karwowski, University of Louisville, Department ofIndustrial Engineering, Lutz Hall, Room 445, Louisville, KY 40292. E-mail: [email protected]
The concept of action provides a way to transcend the limitations of prevailingmentalist notions and bridge the practical domain. Through actions, participantsalter their external world while simultaneously forming their mental models(Rubinshtein, 1973). Mental and behavioral actions and operations are major unitsof analysis in activity theory, rendering this theory decisive in the study of humanwork. Human cognition is organized as a continuous process (Brushlinsky, 1979).At the same time, this process is organized into a hierarchy of recursive subsystemsdirected to achieve goals of various operations and actions (Bedny, Seglin, &Meister, 2000). Hence, cognition should be studied as a continuous processing sys-tem and as a system of cognitive actions and operations. From a theoretical andpractical perspective, the cognitive approach should be integrated with an activityapproach. In our concept of the systemic-structural analysis and design of activity,cognitive analysis is one stage in the analysis of human performance (Bedny &Karwowski, 2000; Bedny, Karwowski, & Kwon, 2001).
1.1. Objectives
The main objective of this article was to explore the usefulness of the systemic-struc-tural theoryofactivity (SSTA)tothestudyofHCIs.SSTAbuildsonthegeneral theoryof activity that originated in the former Soviet Union and now is widely recognizedworldwide. The founders of the general activity theory were Rubinshtein (1963),Leont’ev (1977), and Vygotsky (1978). In Europe, the early work of Volpert (1982),Hacker (1985), and others (e.g., see Nardi, 1996; Engestrom, Miettinen, & Punamaki,1999) influenced this field. However, in the past, the general activity theory was notsufficiently adapted to the study of human performance at work.
The last decade witnessed development of the SSTA that is specifically tailoredto the study of work (Bedny, 2000; Bedny, Karwowski, & Bedny, 2001; Bedny,Karwowski, & Kwon, 2001; Bedny & Meister, 1997, 1999; Bedny & Seglin, 1999).Within SSTA, one can isolate three different approaches: (a) the parametrical ap-proach, which concentrated on the study of different parameters of activity such ascognitive analyses, errors analyses, and so forth; (b) the morphological approach inwhich mental and motor actions concepts are the most important ones; and (c) thefunctional approach in which the major concepts are self-regulation and functionblocks. From the SSTA perspective, task analysis focuses on the structure of activityduring the task performance. Activity is presented as a system comprised of dis-crete hierarchically organized elements that are units of analysis. The content ofthese elements and the specifics of their interaction characterize the structure of ac-tivity. A description of the structure of activity as a system is called the sys-temic-structural analysis and description of activity.
With some exceptions (see Decortis, 2000; Kuutti, 1996), most of the current ap-proaches in the HCI area typically concentrate on the systematic description of thehuman–computer interface but not on human performance itself as a system. Sys-temic-structural analysis is possible only because activity theory has developedunits of analysis and corresponding methods to guide it. Actions, operations, func-tion blocks, and members of an algorithm of activity supply the conceptual frame-work for such analyses. Systemic-structural analysis of activity employs distinct
236 Bedny and Karwowski
methods that are categorized in terms of specific criteria. Activity as an object ofstudy embodies multiple, distinct aspects enabling the systemic-structural ap-proach to capture the multidimensionality of activity during task performance.Therefore, multiple approaches must be employed to describe a single episode ofactivity.
The systemic-structural approach allows one to formulate activity as a multidi-mensional system and to describe those diverse models that capture various as-pects of its structure. The method of systemic-structural analysis of activity sug-gests four stages: (a) qualitative description, (b) algorithmic analysis, (c) timestructure analysis and (d) quantitative analysis. The major importance of the latteris the objective evaluation of task complexity. All stages are related to one anotherin a recursive, loop structure. Later stages frequently require revisiting preliminarystages of analysis. At any stage of the design process, activity may be described atdifferent levels of detail or decomposition beginning with a gross description andfollowed by a more detailed one. Each level of analysis also has a recursive loopstructure (Bedny, Karwowski, & Jeng, 2000; Bedny, Karwowski, & Kwon, 2001).Depending on the purpose of a study and the specificity of the object of study, somestages of analysis and description may be abbreviated or eliminated altogether.
1.2. Morphological Analysis of Task Performance
In this article, we delineate a morphological analysis of task performance as a majormethod of study. Morphological analysis refers to the division of activity into actionsand operations, algorithmic descriptions of activity, and developing time structureof activity. During the algorithmic description of activity, actions and operationsbecome major units for the definition of members of the algorithms. The methodfor isolating actions in a holistic structure of activity is described in Bedny,Karwowski, & Kwon (2001). In turn, members of the algorithm are the basic unitsof an algorithmic description of activity. Usually, a member of an algorithm con-sists of one or several mental or motor actions integrated by the general goal. Algo-rithmic description serves as a basis for a practical application, which we considerin greater detail in what follows. On the basis of algorithmic description, activity isdelineated in terms of a logically organized system of actions and operations dis-tributed in space and time. If necessary, each element of activity may be treated as asubsystem entailing further decomposition.
As a practical case, in this study a task within an inventory process system of amanufacturing firm was selected. This inventory process includes receiving parts,putting them away, storage, withdrawal, and movement through work-in-process(WIP) while simultaneously tracking their movement as well as recording all ofthese events. In this study, we focused on the receiving task. This is a com-puter-based task in which an operator performs his or her job mostly through com-puter interactions. We conducted the study within a framework of systemic-struc-tural analysis of work activity. This study of computer-based task performance islimited to some aspects of qualitative analysis, which are restricted to parametricmethods of analysis and algorithmic description of activity, which are related tomorphological analysis.
Systemic-Structural Activity Approach 237
2. QUALITATIVE STAGE OF ACTIVITY ANALYSIS
This stage of analysis can be performed based on parametric or functional analysisof activity. In simple cases, when general qualitative analysis of work performanceis discussed, scientists use a parametrical method of study that allows concentra-tion on distinct aspects of activity, as was carried out in this study.
Qualitative analysis of activity starts with objectively logical analysis. It may be re-duced to providing a short verbal description of job performance, analysis of relatedproduction operations or tasks, and determination of their logical organization in spaceand time. Furthermore, a short description of technological processes is performed in-cluding description of major equipment, tools, raw materials, sequence of basic techno-logical procedures, and so forth. Conditions of work such as temperatures, noise, illumi-nation, and so forth also should be described, including the potential for extremesituations. The relation between computerized and noncomputerized components ofwork and the calculated proportion of time in computer-based work are called for.
Activity theory is distinctive in the attention it dedicates to sociocultural aspectsof activity and the role of external and internal tools of activity in task performance(Vygotsky, 1978). Culture is considered as the mediator between the user and tech-nology. It is the aggregation of beliefs, attitudes, values, social norms, and standards.Culture is comprised of shared social meanings. Individuals affiliated with a cultureinternalize these shared meanings. The social context under which a task is per-formed should be noted, including the social dynamics of the group involved in jobperformance.Allof thesequestionsmaybeaddressedinbroadordetailedfashion.
Another aspect of activity analysis is individual-psychological study. Personalrequirements for job performance such as individual features of personality, educa-tional background, motivational aspects of work, needs and desires, and wishesshould be considered at this stage of analysis. The background and training of us-ers in the use of a computer and their subjective relation to computerization are an-alyzed along with relative job satisfaction from the use of a computer.
During the next stage, researchers perform detailed task analysis or analysis of pro-duction operations in which they attend to separate tasks or production operations.Specialists become involved in a detailed description of task performance. Descriptionof the structure of activity becomes important at this stage. This method of analysismay be transformed into a cognitive or functional analysis of task performance withwhich it is intimately connected. In some cases, qualitative methods of analysis sug-gest the use or development of symbolic process models. These models are distinctiveinsofar as each symbol refers to a unit of analysis in activity theory. Depending on thedegree of detail, this analysis may be at either a microstructural or macrostructurallevel (Bedny, 2000). During the qualitative analysis of activity, widely used methods ofcomparative analysis, such as contrasts between effective and substandard perform-ers, worker’s error analysis, and definition of difficulties and obstacles, are used. Theworkers’ strategies of performance may also be compared. Observation, experimenta-tion, verbal protocols, and so forth are widely used in such studies. Methods forchanging strategies of performance during acquisition of skills and experience are fun-damental to activity theory. Individual styles of performance, derived from personalfeatures, are also relevant (Bedny & Seglin, 1999). Error analysis, variability of time oftask performance, and so forth are essential components of this approach.
238 Bedny and Karwowski
3. ALGORITHMIC ANALYSIS OF ACTIVITY
Algorithmic analysis of activity is a particularly powerful method of morphologi-cal analysis. It consists of the subdivision of activity into qualitatively distinct psy-chological units and determination of the logic of their organization and sequence.These units are formulated as elements of activity with a specific logical structure.Typically, such elements, called members of an algorithm, are made of actions withtheir associated subgoals integrated through supervening goals. Due to limits onthe capacity of working memory, each member of an algorithm is limited to be-tween one to three actions. Whereas motor actions can be performed simulta-neously, mental actions are usually performed sequentially. Participants may alsocombine motor and cognitive actions according to the rules of temporal combina-tion described by Bedny and Meister (1997). As units of activity, the members of al-gorithms are termed operators and logical conditions. Operators consist of actionsthat transform objects, energy, and information. For example, operators that are im-plicated in receiving information, analyzing a situation and comprehending it,shifting of gears, levers, and so forth can be described. Logical conditions are mem-bers of the algorithm that determine logic of selection and realization of differentmembers of an algorithm and include a decision-making process. Human algo-rithms are just such algorithms defined by associated units of analysis made up ofhuman actions. Actions as units of analysis constitute the distinctive features of ahuman algorithm from flow charts widely used to represent human performance.
Operative units of activity (OUA) are fundamental concepts in the study of ac-tivity. OUA is understood as contextually defined entities (image, concept, state-ment, comment, etc.) formed through training or experience that enable a partici-pant to manage mentally and semantically meaningful units at levels of specificityrelevant to the execution of the indicated task (Zarkovosky, Korolev, Medvedev, &Shlain, 1974). Appropriate characterization of OUA provides a great deal of lever-age in developing algorithms of performance during HCI. Sometimes algorithmicdescription of activity may be represented as an iterative process, with sequentialapproaches an optimal method of performance.
Each member of the algorithm is designated by special symbols. For example, op-eratorsarerepresentedbythesymbol“O”andlogicalconditionsbythesymbol“l.”
All operators involved in reception of information are categorized as afferent op-erators and are designated with the superscripts α, as in “Oα.“ If the operator is in-volved in extracting information from long-term memory, the symbol µ is used as inOµ. The symbol Oµ is associated with keeping information in working memory, andthe symbol Oε is associated with the executive components of activity such as themovement of a gear. Operators with the symbol Oε are efferent operators. In deter-ministic algorithms, the logical conditions designated with l have two values, zero orone. In some cases, logical conditions can be a combination of simpler ones. Thesesimple logical conditions are connected through “and,” “or,” “if-then,” and so forthrules. Complex logical conditions are designated by a capital “L,” whereas simplelogical conditions are designated by a lowercase “l.” Logical connections betweensimple ones are designated with standard symbols such as “&,” “^,” “→,” and soforth. For example, complicated logical conditions comprised from simple ones maybe designated as L1 (l11 & l12 & l13). Symbol 1 as a subscript of capital L designates that
Systemic-Structural Activity Approach 239
it is the first complex logical condition. Symbol 1 as a subscript of a lowercase l desig-nates that it is a simple logical condition that belongs to L1. The numbers 1 through 3are used as superscripts and designate the number of logical conditions.
In a probabilistic algorithm, logical conditions may have two or more outputswith a probability between zero and one. As a simple example, these logical con-ditions may be represented in the following way. Suppose the algorithm has alogical condition with three outputs with distinct probabilities of occurrence. Insuch a case, the logical condition can be designated as L1↑1 (1–3), which possessesnot two potential values but three. In this case, there are three versions of output:↑1 (1), ↑1 (2), and ↑1 (3), with different probabilities. For example, the first outputhas the probability .2, the second is .3, and the third is .5. Knowledge of the prob-ability of the output may be taken into consideration in a study probability ofperformance of different actions, strategies of performance, calculation of theperformance time of the algorithm or components of the algorithm, and evalua-tion of task complexity. Frequently in algorithmic description, an always-falselogical condition is used, which is defined by the symbol ω. This logical condi-tion is introduced only to make it easier to write the algorithm. It does not desig-nate real actions performed by the participant. It always defaults to the nextmember of the algorithm as indicated by the arrow included in the specificationof this always-false logical condition.
An arrow designates the logic of transition from one member of an algorithm toanother. Thus, the algorithm exhibits all the possible actions and their logical organi-zation and therefore constitutes a precise description of human performance. It de-scribes activity of a participant in terms of actions through which the participant at-tains the goal of activity. The tabular form of the algorithm is carried out in thefollowing way. On the left side of the table, there is a column in which the previouslydescribed symbols are placed. It is a symbolic description of the algorithm or its for-mula.Ontherightside, there isaverbaldescriptionofthemembersof thealgorithm.
The symbols l or L for logical conditions in the left column include an associated ar-row numbered with a superscript such as ↑2. An arrow with the same number but a re-versed position must be presented in front of another member of the algorithm towhich the arrow makes reference, ↓2. Thus, the syntax of the system is based on a se-mantic denotation of a system of errors and superscripted numbers. An upward point-ing of a logical state of simple logical conditions l when l = 1 requires skipping the fol-lowing members of the algorithm until the next appearance of the superscriptednumber with a downward arrow (e.g.,↑1 ↓1). Therefore, the operator with the down-ward arrow with the same superscripted number in front of it is the next to be exe-cuted. If, for example, this is a probabilistic algorithm, one needs to skip the next ap-pearance of the superscripted numbers for all possible arrows of the logical condition.Each superscripted number is associated with a discrete probability that needs to berepresented as the transition process from the member of one algorithm to another.
The tabular form of an algorithm is read top to bottom. The left column withsymbolic description is called the formula of the algorithm and is presented in a ver-tical orientation. In some cases, a formula for the algorithm may be presented sepa-rately as a horizontal line of symbols. In this case, the formula is read from left toright. A separate formula is used when a horizontal line is presented as an abbrevi-ated exhibition of an algorithm. In some cases, algorithms have such large realiza-
240 Bedny and Karwowski
tions that experts extract only critical ones to serve as markers for the analysis. Analgorithm enables an expert to describe human performance in a probabilistic man-ner and uncover constraints of the work process.
Following the development of the algorithm, experts then perform psychologicalanalysisof thealgorithm,returningtoaqualitativestageofanalysis.Eachmemberofan algorithm can be evaluated as a whole from qualitative and quantitative points ofview. From the morphological perspective, each member of an algorithm can be de-scribed at a more detailed level in terms of actions and operations performed by hu-mans. Actions in turn may be described in terms of the “typical elements of a task”(technological units) and “typical elements of activity” (psychological units). Typi-cal elements of activity (psychological units) should be used during the study of HCIwhen researchers need a very detailed description of the structure of activity.
The relation between qualitative and algorithmic analysis of activity is not strictlylinear. It is possible to transfer not only from qualitative analysis to algorithmical butalso in the reverse direction. This relation between stages of analysis demonstratesprinciples of systemic-structural analysis of activity. When resources of qualitativestages of analysis are exhausted, the researcher then switches to algorithmic analysis.Thereafter, a qualitative analysis of a human algorithm can be performed, allowing forthe correction of algorithmic description. Hence, design becomes iterative in nature.
If necessary, more detailed stages of analysis may be pursued. A designer mayeven proceed to a third stage of systemic-structural analysis composed of the de-scription of the time structure of activity by using psychological units of analysis.Thereafter, the complexity of task performance can be evaluated. We do not con-sider these two stages in this example.
4. QUALITATIVE ANALYSIS OF INVENTORY RECEIVING TASK
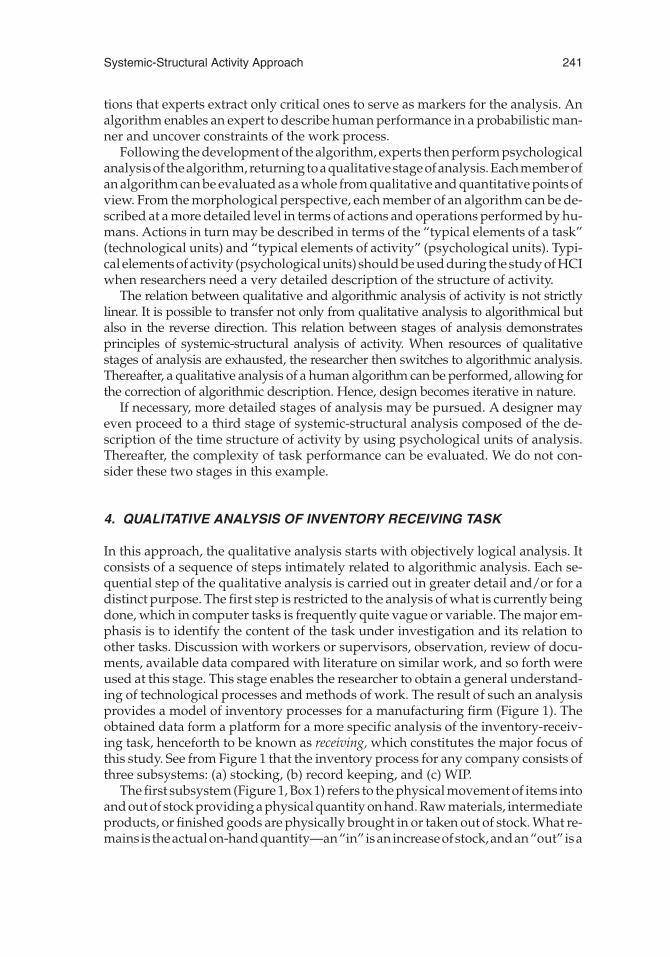
In this approach, the qualitative analysis starts with objectively logical analysis. Itconsists of a sequence of steps intimately related to algorithmic analysis. Each se-quential step of the qualitative analysis is carried out in greater detail and/or for adistinct purpose. The first step is restricted to the analysis of what is currently beingdone, which in computer tasks is frequently quite vague or variable. The major em-phasis is to identify the content of the task under investigation and its relation toother tasks. Discussion with workers or supervisors, observation, review of docu-ments, available data compared with literature on similar work, and so forth wereused at this stage. This stage enables the researcher to obtain a general understand-ing of technological processes and methods of work. The result of such an analysisprovides a model of inventory processes for a manufacturing firm (Figure 1). Theobtained data form a platform for a more specific analysis of the inventory-receiv-ing task, henceforth to be known as receiving, which constitutes the major focus ofthis study. See from Figure 1 that the inventory process for any company consists ofthree subsystems: (a) stocking, (b) record keeping, and (c) WIP.
The first subsystem (Figure 1, Box 1) refers to the physical movement of items intoand out of stock providing a physical quantity on hand. Raw materials, intermediateproducts, or finished goods are physically brought in or taken out of stock. What re-mains is theactualon-handquantity—an“in”isanincreaseofstock,andan“out” isa
Systemic-Structural Activity Approach 241
decrease. An in occurs when something material is entered; an out occurs whensomething leaves. Stock can be increased either by purchasing or by returning itemsfrom manufacturing to stock. Stock is decreased by sale of products or componentparts to customers, by putting intermediate products into manufacturing, or byscraping. When purchases are added to the stock, the stock volume increases. This isdesignated by a plus sign. A minus sign represents a reduction of stock.
The second subsystem (Figure 1, Box 2) represents WIP. This is a value addingmanufacturing process in which diverse raw materials or intermediate productsare transformed into a ready product. Movement in and out is designated the sameas in the stock process.
Whenever material physically moves into or out of stock, that movement is mir-rored as a transaction in the record-keeping process, which is the third componentof the process model. A properly designed inventory process is capable of produc-ing a match between the physical events that occur in Box 1 and Box 2. The re-cord-keeping process is a complicated computerized system that has to track allphysical movements of different parts, purchases, intermediate products, and soforth. The model of the inventory process depicted in Figure 1 facilitates under-standing the specifics of different tasks involved in this process.
The first task is named inventory-receiving. Four workers responsible for registra-tion of all purchases and movement of intermediate and final product perform thistask. The task includes two parts of the job performance. One part involves physi-cal work when a worker (later receiver) receives a box with raw material or inter-mediate parts. The receiver can perform two similar tasks. One task entails recep-tion of parts from different vendors to restock the warehouse and fulfill special andemergency orders. The second task entails receiving intermediate or finished prod-uct from WIP. This study pertains to the first task.
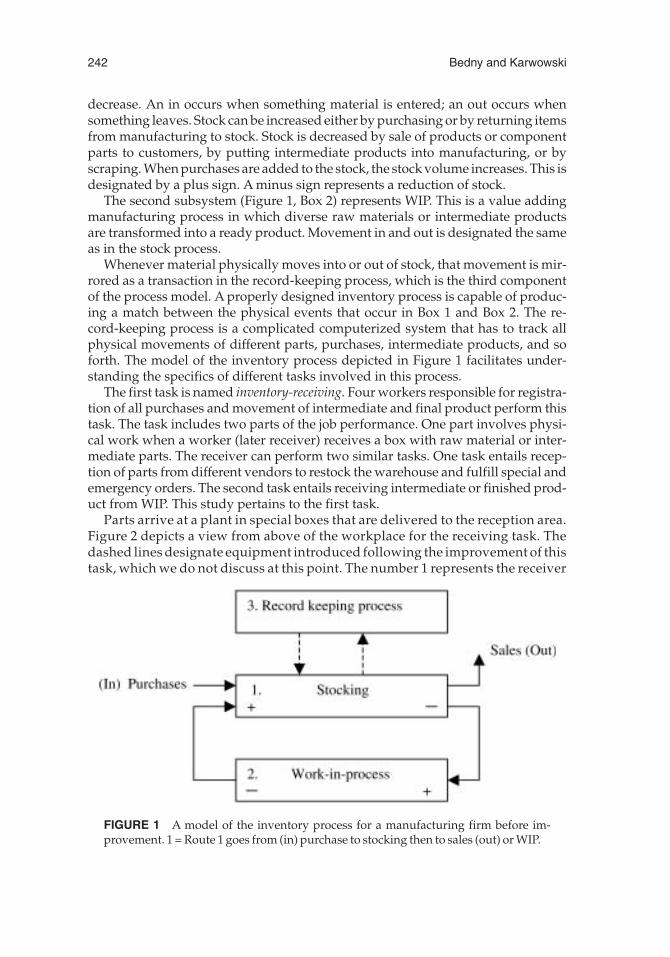
Parts arrive at a plant in special boxes that are delivered to the reception area.Figure 2 depicts a view from above of the workplace for the receiving task. Thedashed lines designate equipment introduced following the improvement of thistask, which we do not discuss at this point. The number 1 represents the receiver
242 Bedny and Karwowski
FIGURE 1 A model of the inventory process for a manufacturing firm before im-provement. 1 = Route 1 goes from (in) purchase to stocking then to sales (out) or WIP.
who opens the boxes placed on the base unit (5). For this purpose, the receiveruses a special knife. After opening the box, the receiver removes a packing slipand reads it. Then the receiver uses a computer-based warehouse managementsystem (3). The receiver enters the purchase order (PO) number listed on the pack-ing slip and hits the F3 key to check what is still open on the PO. The receiver takesthe parts out of the box and compares the order quantity with received quantity.The receiver chooses the item from the PO then changes or confirms the quantityand the price and assigns allocation if necessary. If allocation is already reservedfor the item, the system will select it automatically. All required information isshown on the screen; later this information is printed on the label.
One can specify two kinds of subtasks; the first is the setup subtask, and the sec-ond is the main subtask. The setup operation includes login, menu selection, key inPO number, and so forth. The main operation begins when an item is taken out ofthe box and ends when it is put in the tote. The receiver places each part from thevendor into a tote. The tote thus filled with parts is placed in a put-away area by thestock Belt 8. The second task is putting away. The put-away operator takes partsfrom the tote and places them on the corresponding shelves.
The next task is pickup. The pickup operator takes the parts that have been or-dered from the shelves and places them in the tote. This tote is later delivered to the
Systemic-Structural Activity Approach 243
FIGURE 2 A view of the receiving task from above the workplace. 1 = receiver; 2 =work table; 3 = computer; 4 = tag printer; 5 = base unit for unpacking; 6 = base unit forstock process; 7 = base unit for work-in-process (WIP); 8 = belt for stocking; 9 = belt forWIP; 10 = put aside area; 11 = place for tote.
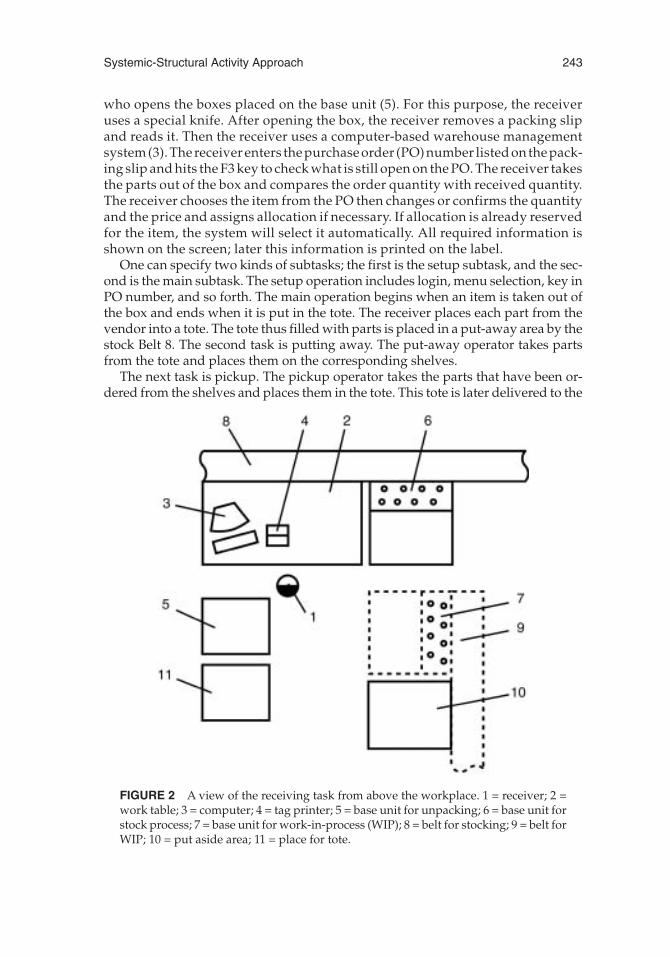
workshop for production. The pickup operator also places ready-for-sale productsinto the tote. Delivering of the required parts for production is related to the deliv-ery task. Figure 3 designates the sequence of operations just described before theimprovement. These operations are covered in relation to the receiving task.
In the previous section, we give a brief description of the receiving task andthose tasks that attend it. The qualitative analysis may be labeled as analysis with atechnological orientation. The data gathered by qualitative-technological analysis(the first step of qualitative analysis) may now be used for the second stage of anal-ysis called algorithmic analysis.
5. ALGORITHMIC DESCRIPTION OF THE RECEIVING TASK BEFORE ITSIMPROVEMENT
The data discussed in the previous section merely provides preliminary data re-lated to qualitative analysis. To perform more in-depth qualitative analysis, moredetailed information is needed. Accordingly, a second stage of analysis using algo-rithmic description is called for. Only after this second stage may a qualitative anal-ysis be revisited with greater elaboration and insight. The algorithmic model of ac-tivity during the performance of the receiving task is presented in Table 1 (onlythose actions intimately related to computer use are described). In Table 1, the leftcolumn delineates the symbolic model of the activity. The right column of Table 1contains a verbal description of the algorithm. A short description of the develop-ment of the algorithm was offered in the preceding preliminary sections. Table 1 re-veals that for the description of human activity, a probabilistic algorithm was usedrather than a deterministic one. Actually, many logical conditions possess morethan two outputs. Moreover, each output can possess different probabilities.Hence, this task has different degrees of uncertainty. Progressive reading of this al-gorithm from top to bottom and comparison of each member of the algorithm withinformation presented on the computer screen enables one to see a precise pictureof how users carried out the computer-mediated task.
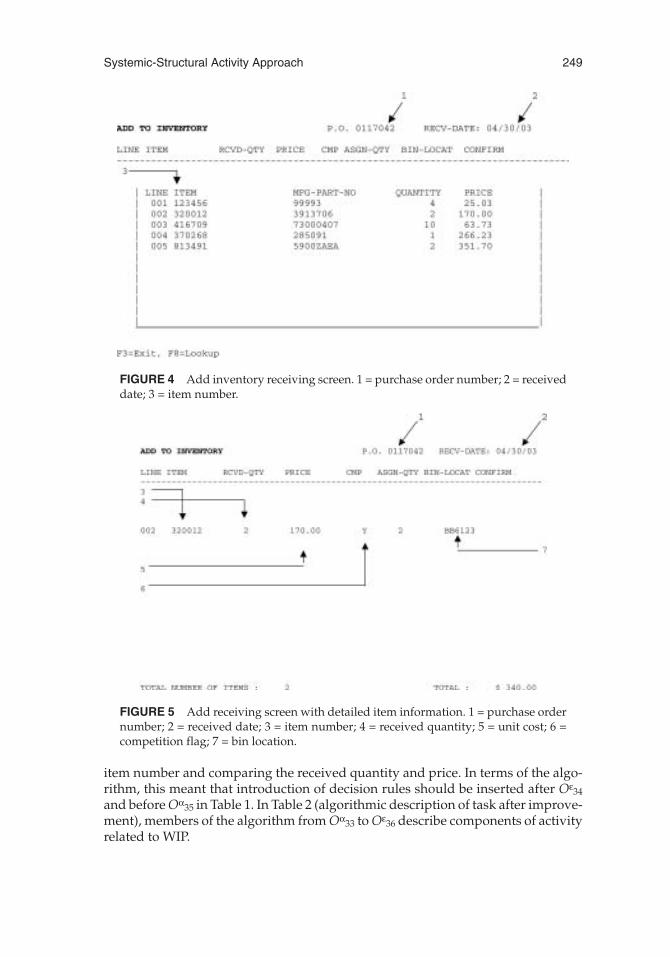
Reading each member of an algorithm in symbolic representation allows one to un-derstand the logic of the transition from one member of an algorithm to another. Algo-rithmic description also provides insight into the psychological peculiarities of eachmember of the algorithm. For example, Oα indicates that this member of the algorithmrefers to perceptual actions, lµ15↑(1–10) exhibits decision-making actions with 10 outputsand shows its involvement in intensive utilization of memory and so forth. Figures 4and 5 are examples of screens used in the algorithmic description of activity.
244 Bedny and Karwowski
FIGURE 3 The sequence of tasks before the improvement.
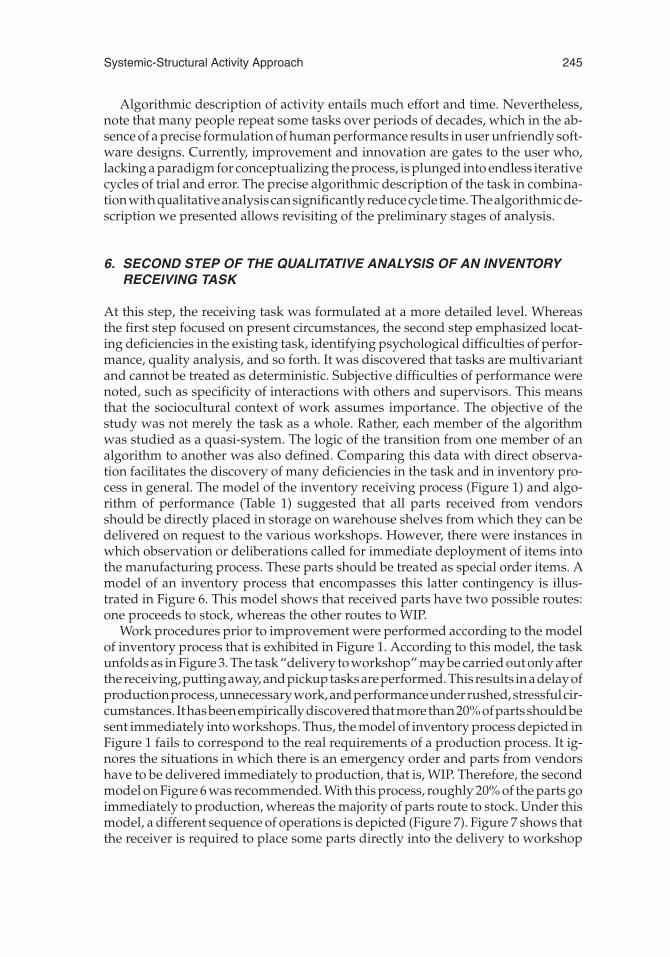
Algorithmic description of activity entails much effort and time. Nevertheless,note that many people repeat some tasks over periods of decades, which in the ab-sence of a precise formulation of human performance results in user unfriendly soft-ware designs. Currently, improvement and innovation are gates to the user who,lacking a paradigm for conceptualizing the process, is plunged into endless iterativecycles of trial and error. The precise algorithmic description of the task in combina-tionwithqualitativeanalysiscansignificantlyreducecycle time.Thealgorithmicde-scription we presented allows revisiting of the preliminary stages of analysis.
6. SECOND STEP OF THE QUALITATIVE ANALYSIS OF AN INVENTORYRECEIVING TASK
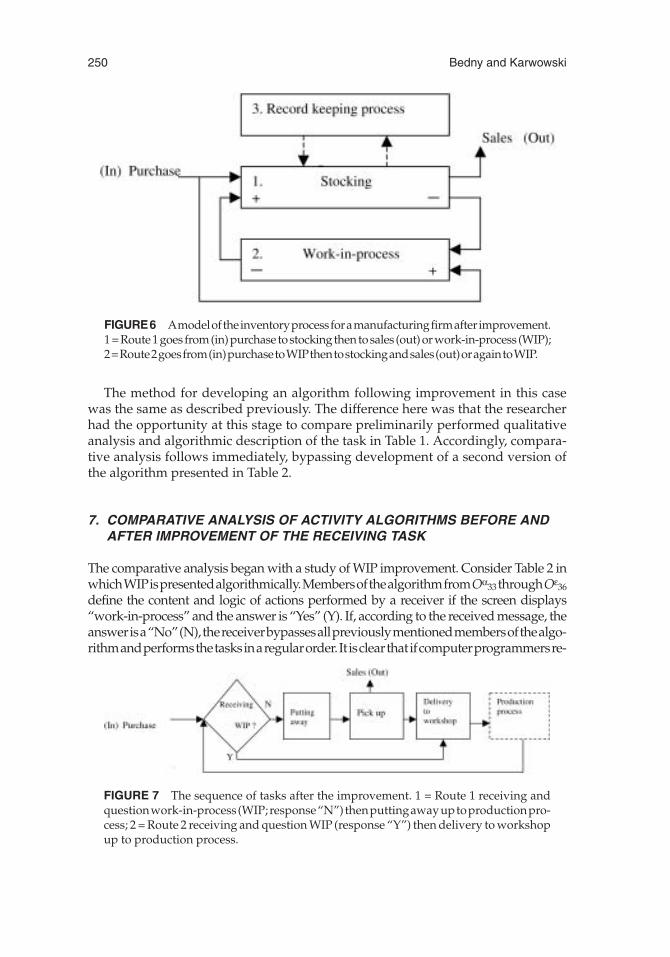
At this step, the receiving task was formulated at a more detailed level. Whereasthe first step focused on present circumstances, the second step emphasized locat-ing deficiencies in the existing task, identifying psychological difficulties of perfor-mance, quality analysis, and so forth. It was discovered that tasks are multivariantand cannot be treated as deterministic. Subjective difficulties of performance werenoted, such as specificity of interactions with others and supervisors. This meansthat the sociocultural context of work assumes importance. The objective of thestudy was not merely the task as a whole. Rather, each member of the algorithmwas studied as a quasi-system. The logic of the transition from one member of analgorithm to another was also defined. Comparing this data with direct observa-tion facilitates the discovery of many deficiencies in the task and in inventory pro-cess in general. The model of the inventory receiving process (Figure 1) and algo-rithm of performance (Table 1) suggested that all parts received from vendorsshould be directly placed in storage on warehouse shelves from which they can bedelivered on request to the various workshops. However, there were instances inwhich observation or deliberations called for immediate deployment of items intothe manufacturing process. These parts should be treated as special order items. Amodel of an inventory process that encompasses this latter contingency is illus-trated in Figure 6. This model shows that received parts have two possible routes:one proceeds to stock, whereas the other routes to WIP.
Work procedures prior to improvement were performed according to the modelof inventory process that is exhibited in Figure 1. According to this model, the taskunfolds as in Figure 3. The task “delivery to workshop” may be carried out only afterthereceiving,puttingaway,andpickuptasksareperformed.Thisresults inadelayofproductionprocess,unnecessarywork,andperformanceunderrushed,stressfulcir-cumstances. Ithasbeenempiricallydiscoveredthatmorethan20%ofpartsshouldbesent immediately into workshops. Thus, the model of inventory process depicted inFigure 1 fails to correspond to the real requirements of a production process. It ig-nores the situations in which there is an emergency order and parts from vendorshave to be delivered immediately to production, that is, WIP. Therefore, the secondmodel on Figure 6 was recommended. With this process, roughly 20% of the parts goimmediately to production, whereas the majority of parts route to stock. Under thismodel, a different sequence of operations is depicted (Figure 7). Figure 7 shows thatthe receiver is required to place some parts directly into the delivery to workshop
Systemic-Structural Activity Approach 245
246
Table 1: Algorithmic Description of Activity During Computer Based TaskPerformance (Before Improvement)
Member of Algorithm Description of Members of Human Algorithm
Oα1
Check for presence of inventory receiving screen
↓1
2Oε Type 1 and then press ENTER to choose ADD INVENTORY RECEIVINGscreen (see Figure 4)
Oα3 Check to see if you are at the ADD TRANSACTION screen (cursor on Field 1)
l11↑
If you are at the right screen, go to Oε4; if the screen is wrong, hit F3 for exit
and go back to Oε2
↓ ↓ ↓17 1 9 1 7 1
4( ) ( ) ( )Oε Take a packing slip from the box placed on Base Unit 5 (see Figure 2)
Oα5 Find purchase order (PO) number on the slip
Oε6 Key in PO number and hit enter (Figure 6, Field 1)
Oα7 Look at the screen message
l22↑
If the screen displays an error message INVALID PO NUMBER, then go tooperator Oα
8; if PO number is correct, the cursor moves to the secondfield RECV-DATE (see Figure 4), go to Oε
11
Oα8 Compare PO number on the screen with the number on the packing slip
l33↑
If PO number does not match, go to Oε9; if the PO number is correct and
error message persists (system can not find purchase order) go to Oε10
Oε9 Key in the correct number again
↓3Oε
10 Call manager
↓2Oε
11Key in a current date or the date it has been received (the cursor moves to
Field 2; see Figure 4)
↓ ↓ ↓17 2 11 2 7 2
12( ) ( ) ( )Oε Press F8 to look up items on the PO (Figure 4)
Oε13 Take out item from Box 5
Oα14 *
Look at item number and compare it with item numbers (Figure 4, Field 3) onthe screen
l44↑
If item number is on the first page, go to Oε16; if item number is not on the
first page, go to Oε15
Oε15 Hit arrow key (repeat if required)
↓4Oε
16Put cursor on the selected line (Figure 4) and hit ENTER to go to the screen
with detail item information (Figure 5)
↓4Oα
17 Compare received quantity with PO quantity (Figure 5, Field 4)
lαth 5
5 ↑ **
If received quantity and ordered quantity are the same, press ENTER and go toOε
24; if received quantity is greater or less than ordered quantity, go toOε
19
Oε19
Type the received quantity and press ENTER to get a question on the bottomof the screen
Oα20
Read the statement: THE RECIVED QUANTITY AND ORDEREDQUANTITY DOES NOT MATCH. DO YOU ACCEPT? (YES/NO)
247
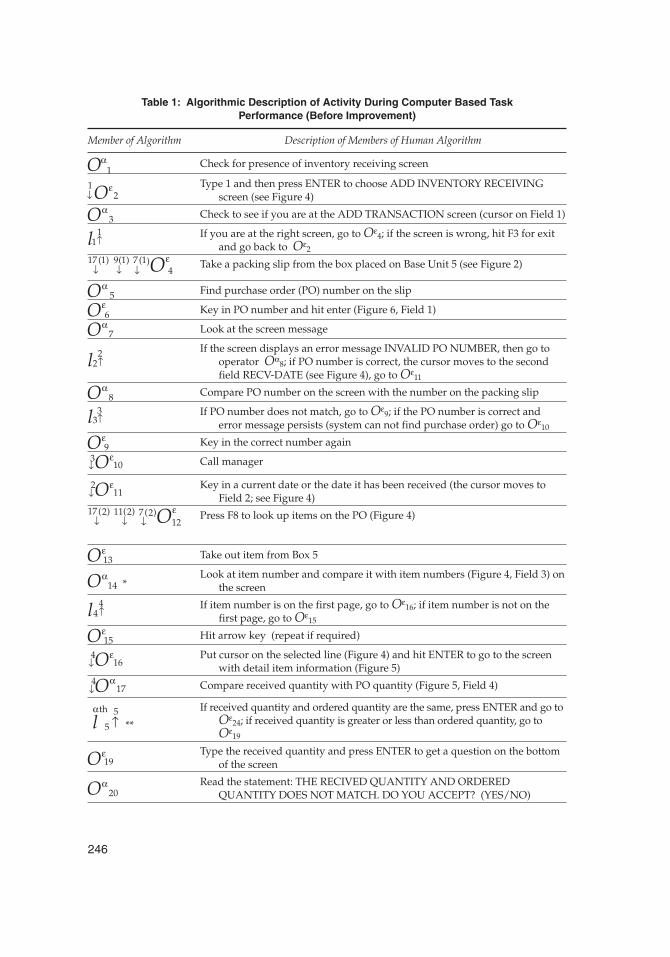
(continued)Table 1 (Continued)
Member of Algorithm Description of Members of Human Algorithm
lth 6
6 ↑If quantity is not accepted (computer defaults to “N”) go to Oε
21; otherwise,go to Oε
23
Oε21 Press ENTER
Oα22 Check if there are other items on this PO to receive
l77 1 2
↑−( ) If there are no more items in the box, go to Oε
4, otherwise go to Oε12
↓6Oε
23 Type “Y”, press ENTER
↓5Oε
24 Compare price of the item on the shipping list with price on the screen
l88↑
If the price on the screen and shipping list are different, go to Oε25; otherwise,
go to 2Oε31
Oε25 Key in the new price and hit ENTER
Oα26
Read the message, THE PRICE YOU ENTERED DOES NOT MATCHINITIAL PRICE. DO YOU WANT TO ACCEPT? (Y/N) on the screen(Figure 5, Field 5)
O27α th *** Compare new price with ordered price
l99↑ If new price is smaller or equal, go to 1Oε
31; if new price is greater go to O28th µ
O28t h µ Mentally calculate the price difference
l1010µ↑
If difference is less than 10%, go to 1Oε31; if difference is greater than 10%, go
to 1Oε29 (unless instructed otherwise)
Oε29 Type “N” and hit ENTER (the item is put aside and task is completed)
Oα30 Check if there are other items in this box to receive
l1111 1 2
↑−( ) If there are no more items to receive, go to Oε
4; otherwise go to Oε12
↓ ↓10 9 1
31Oε Type “Y”
↓8 2
31Oε Hit ENTER to go to the Completion Flag field (Figure 5, Field 6)
Oα32
Check system default (Y/N) “flag;” system gives default according to the rule“If received quantity ≥ ordered quantity system defaults to ‘Y’ otherwiseit defaults to ‘N’“
l1212↑ If you except the system default (Y/N), go to Oε
34; otherwise go to Oε33
Oε33
If system defaults to “N”, type “Y”, and go to Oε34; if system defaults to “Y”,
type “N”, and go to Oε34
↓12Oε
34 Hit ENTER to go to the next field (Figure 5, Field 7)
Oα35 Check if there is a bin for this item
l1313↑
If the bin is not assigned for this item, go to Oµ36; otherwise the system will
automatically assign the required bin then go to Oε40
↓15(1)Oµ
36Depending on the size, shape and special features (“HazMat”) of item, recall
required bin type
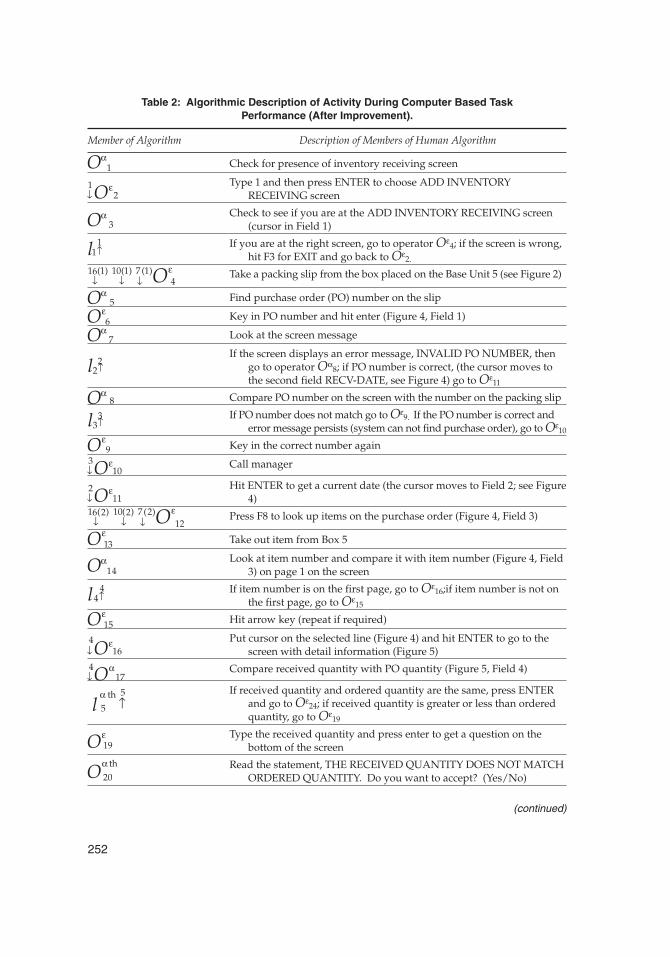
tote, whereas the majority of the parts should be directed to stock bins. Hence, thecontentof thereceivingtaskshouldbechanged. Inaddition, thereceiverhas todeter-mine what category of the order he or she is processing by answering the question“WORK-IN-PROCESS (Y/N)?” on the screen (see Figure 8).
The algorithm of performance facilitated determination of which step to intro-duce decision rules regarding assignment of parts and new actions related to theWIP. The analysis of the logic of the performance algorithm revealed that these ac-tions should be introduced following checking the purchase order number and
248 Bedny and Karwowski
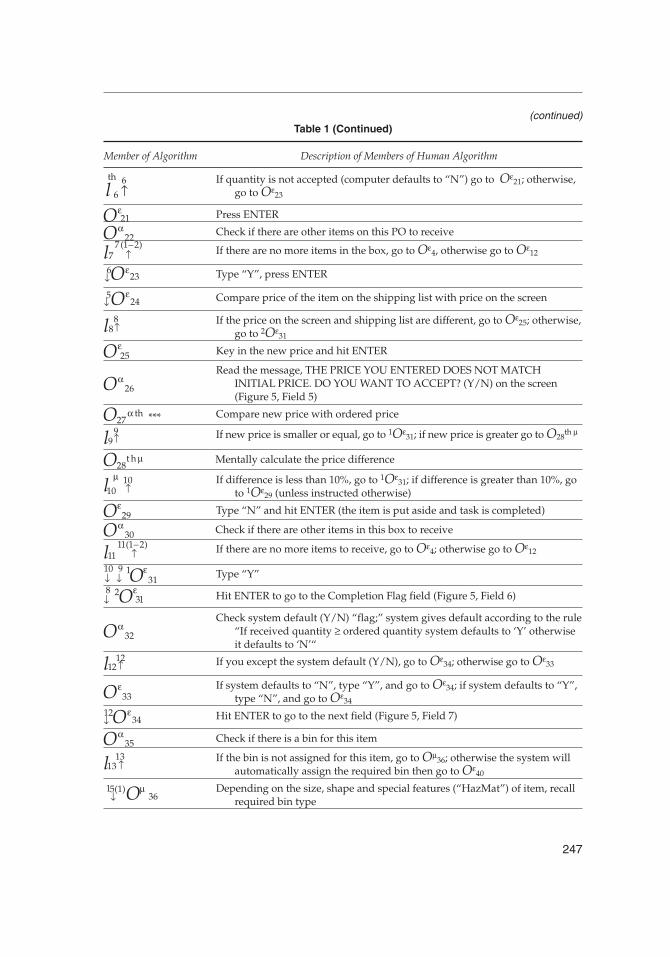
(continued)Table 1 (Continued)
Member of Algorithm Description of Members of Human Algorithm
lµ14
14 1 10↓−( ) If bin type is 1, go to 1Oε
37, up to “If bin type is 10,” go to 10Oε37
↓ ↓16 1 14 1
137
( ) ( )Oε Type “1” and hit ENTER
ω ω1 1↑ **** Always falls logical conditions (see Oα38)
. . . . Choose the required bin type
↓ ↓16 10 14 10
137
( ) ( )Oε Type “10” and hit ENTER
↓ −ωα
( )1 9 38OCheck error message on the screen (Oα
38 follow after every Oε37)
l1515 1 2
↑−( ) If you get an error message, THIS IS A WRONG BIN TYPE, go to Oα
39 orOµ
36; otherwise go to Oε40
Oα39 Look at the bin type chart
l1616↑ If bin type is 1, go to 1Oε
37; if bin type is 10, go to 10Oε37
↓ ↓15 2 3
40
( )Oε Hit ENTER to print the label
Oε41 Peel the label off the printer and put it on the part
Oε42 Put part in the tote
Oα43 Check if there are other items in the box to receive
l1717 1 2↑
−( ) If there are no more items to receive, go to Oε4, otherwise go to Oε
12; if thereare no new boxes to work with, go to Oε
44
Oε44 Hit F3 and go to the previous screen
↓18Oε
45 Type “3” and then press ENTER to choose PRINT REPORT
Oα46 Check to see if you are at the PRINT REPORT screen
l1818↑
If you are at the right screen, go to Oε47; if the screen is wrong, hit F3 for EXIT
and go back to Oε45
Oε47 Key in Start Date, hit ENTER, key in End Date, hit ENTER
Oε48 Wait for the report completion message
*One PO usually required no more than 3 passes on the screen. **lαth stands for “thinking actions” in-volved in decision making that are performed based on visual information. ***O27
αth stands for execu-tive “thinking actions” that are performed based on visual information. ****ω always falls logical condi-
item number and comparing the received quantity and price. In terms of the algo-rithm, this meant that introduction of decision rules should be inserted after Oε34
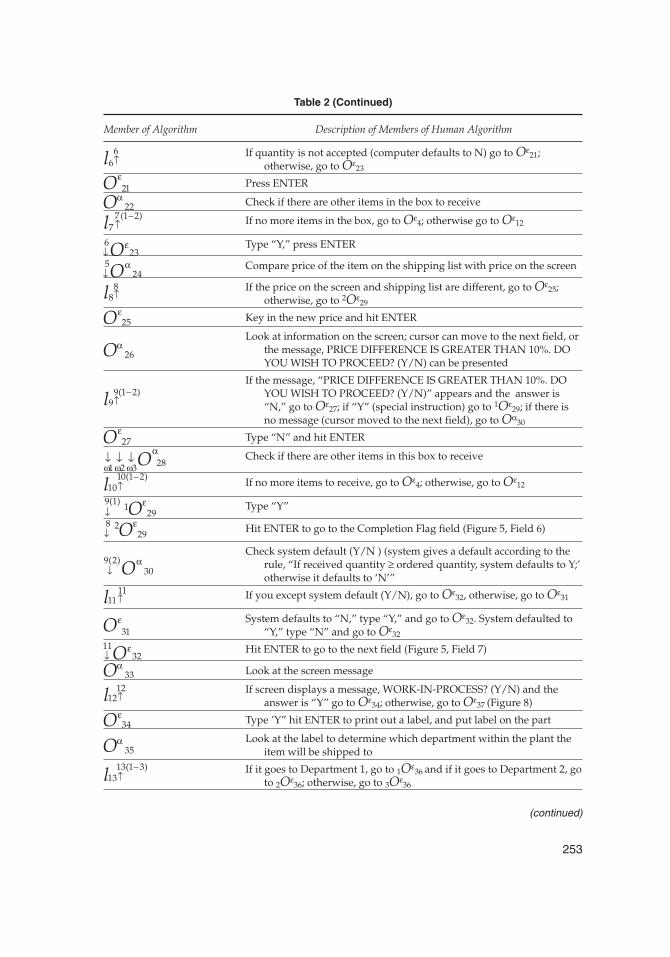
and before Oα35 in Table 1. In Table 2 (algorithmic description of task after improve-ment), members of the algorithm from Oα33 to Oε36 describe components of activityrelated to WIP.
Systemic-Structural Activity Approach 249
FIGURE 5 Add receiving screen with detailed item information. 1 = purchase ordernumber; 2 = received date; 3 = item number; 4 = received quantity; 5 = unit cost; 6 =competition flag; 7 = bin location.
FIGURE 4 Add inventory receiving screen. 1 = purchase order number; 2 = receiveddate; 3 = item number.
The method for developing an algorithm following improvement in this casewas the same as described previously. The difference here was that the researcherhad the opportunity at this stage to compare preliminarily performed qualitativeanalysis and algorithmic description of the task in Table 1. Accordingly, compara-tive analysis follows immediately, bypassing development of a second version ofthe algorithm presented in Table 2.
7. COMPARATIVE ANALYSIS OF ACTIVITY ALGORITHMS BEFORE ANDAFTER IMPROVEMENT OF THE RECEIVING TASK
The comparative analysis began with a study of WIP improvement. Consider Table 2 inwhichWIPispresentedalgorithmically.MembersofthealgorithmfromOα33throughOε36
define the content and logic of actions performed by a receiver if the screen displays“work-in-process” and the answer is “Yes” (Y). If, according to the received message, theanswerisa“No”(N),thereceiverbypassesallpreviouslymentionedmembersofthealgo-rithmandperformsthetasksinaregularorder.Itisclearthatifcomputerprogrammersre-
250 Bedny and Karwowski
FIGURE6 Amodeloftheinventoryprocessforamanufacturingfirmafterimprovement.1=Route1goes from(in)purchase tostockingthentosales (out)orwork-in-process (WIP);2=Route2goesfrom(in)purchasetoWIPthentostockingandsales(out)oragaintoWIP.
FIGURE 7 The sequence of tasks after the improvement. 1 = Route 1 receiving andquestionwork-in-process(WIP;response“N”)thenputtingawayuptoproductionpro-cess; 2 = Route 2 receiving and question WIP (response “Y”) then delivery to workshopup to production process.
ceivedaprecisedescriptionoftheactionsperformedbyusersrelatedtoWIPtheycouldin-troduce more efficient changes in the design of the software, providing for a new way oftaskperformance.Afterobtainingaclearandprecisedescriptionoftheactionsperformedby a user, a programmer could develop programs that require a minimum of correctionsanddebugging. It is,ofcourse,wellknownthatbecauseusers frequentlyareunabletoex-plicate the task requirements to programmers, software design expands into a long se-quence of improvements. Moreover, users often change their opinion after improve-ments. Thus, algorithmic description of human activity during task performance enablesevaluationoftheefficiencyofuseractions.Actionsperformedbyusersaccordingtotheal-gorithmic representation become clearly understandable if the algorithmic description ofthe task and workplace arrangements are compared. According to the algorithmic de-scription in Table 2 and the work arrangement in Figure 2, if a receiver gives an answer onthe screen “work-in-process”—“No,” he or she uses Base Unit 6 (in Figure 2) for the stockprocess and Belt 8. If a user’s answer for “work-in-process” is “Yes,” he or she uses BaseUnit7forWIPandBelt9.BaseUnit7andBelt9wereintroducedafterimprovementasdes-ignated by the dashed lines in Figure 2.
Thus, the fragment of the algorithm introduced as improvement adds to“up-front” work but eliminates subsequent steps of the algorithm altogether,thereby reducing the overall task burden. It is also noteworthy that in the 20% ofcases that route directly to WIP, the unnecessary tasks (putting away, pickup) arecompletely eliminated. The following stages of analysis involving evaluation oftask complexity before and after improvement indicate that there is a negligible in-crease in task complexity for some subtasks. This is attributable to additional affer-ent operator Oα33 and logical condition l12. Finally, some measures of variability oftask performance may be slightly increased, which is offset by the elimination ofunnecessary work and reduction of time constraints.
We consider the following steps involved in comparative analysis of different mem-bers of the algorithms before and after improvement. For discussion purposes only, themore important members of the algorithm that are germane to performance improve-ment against the baseline are selected. We compare a member of algorithm Oε11 beforeand after improvement. Before improvement, it is revealed that the worker must recallthe current date and key it in. After the improvement, the worker must simply hit enterand the system defaults to the current date. Logical condition lth6 includes reasoning ac-
Systemic-Structural Activity Approach 251
FIGURE 8 Screen with the work-in-process option. 1 = yes or no answer is required.
252
Table 2: Algorithmic Description of Activity During Computer Based TaskPerformance (After Improvement).
Member of Algorithm Description of Members of Human Algorithm
Oα1 Check for presence of inventory receiving screen
↓1
2Oε Type 1 and then press ENTER to choose ADD INVENTORYRECEIVING screen
Oα3
Check to see if you are at the ADD INVENTORY RECEIVING screen(cursor in Field 1)
l11↑
If you are at the right screen, go to operator Oε4; if the screen is wrong,
hit F3 for EXIT and go back to Oε2.
↓ ↓ ↓16 1 10 1 7 1
4( ) ( ) ( )Oε Take a packing slip from the box placed on the Base Unit 5 (see Figure 2)
Oα5 Find purchase order (PO) number on the slip
Oε6 Key in PO number and hit enter (Figure 4, Field 1)
Oα7 Look at the screen message
l22↑
If the screen displays an error message, INVALID PO NUMBER, thengo to operator Oα
8; if PO number is correct, (the cursor moves tothe second field RECV-DATE, see Figure 4) go to Oε
11
Oα8 Compare PO number on the screen with the number on the packing slip
l33↑
If PO number does not match go to Oε9. If the PO number is correct and
error message persists (system can not find purchase order), go to Oε10
Oε9 Key in the correct number again
↓3
10Oε Call manager
↓2
11Oε Hit ENTER to get a current date (the cursor moves to Field 2; see Figure4)
↓ ↓ ↓16 2 10 2 7 2
12( ) ( ) ( )Oε Press F8 to look up items on the purchase order (Figure 4, Field 3)
Oε13 Take out item from Box 5
Oα14
Look at item number and compare it with item number (Figure 4, Field3) on page 1 on the screen
l44↑
If item number is on the first page, go to Oε16;if item number is not on
the first page, go to Oε15
Oε15 Hit arrow key (repeat if required)
↓4
16Oε Put cursor on the selected line (Figure 4) and hit ENTER to go to thescreen with detail information (Figure 5)
↓4
17Oα Compare received quantity with PO quantity (Figure 5, Field 4)
l 5α th 5
↑If received quantity and ordered quantity are the same, press ENTER
and go to Oε24; if received quantity is greater or less than ordered
quantity, go to Oε19
Oε19
Type the received quantity and press enter to get a question on thebottom of the screen
Oα th20
Read the statement, THE RECEIVED QUANTITY DOES NOT MATCHORDERED QUANTITY. Do you want to accept? (Yes/No)
(continued)
253
Table 2 (Continued)
Member of Algorithm Description of Members of Human Algorithm
l66↑
If quantity is not accepted (computer defaults to N) go to Oε21;
otherwise, go to Oε23
Oε21 Press ENTER
Oα22 Check if there are other items in the box to receive
l77 1 2↑
−( ) If no more items in the box, go to Oε4; otherwise go to Oε
12
↓6
23Oε Type “Y,” press ENTER
↓5
24Oα Compare price of the item on the shipping list with price on the screen
l88↑
If the price on the screen and shipping list are different, go to Oε25;
otherwise, go to 2Oε29
Oε25 Key in the new price and hit ENTER
Oα26
Look at information on the screen; cursor can move to the next field, orthe message, PRICE DIFFERENCE IS GREATER THAN 10%. DOYOU WISH TO PROCEED? (Y/N) can be presented
l99 1 2↑
−( )If the message, “PRICE DIFFERENCE IS GREATER THAN 10%. DO
YOU WISH TO PROCEED? (Y/N)” appears and the answer is“N,” go to Oε
27; if “Y” (special instruction) go to 1Oε29; if there is
no message (cursor moved to the next field), go to Oα30
Oε27 Type “N” and hit ENTER
↓ ↓ ↓ω ω ω
α
1 2 3 28O Check if there are other items in this box to receive
l1010 1 2↑
−( ) If no more items to receive, go to Oε4; otherwise, go to Oε
12
↓9(1)
129Oε Type “Y”
↓8 2
29Oε Hit ENTER to go to the Completion Flag field (Figure 5, Field 6)
↓9 2
30( )Oα
Check system default (Y/N ) (system gives a default according to therule, “If received quantity ≥ ordered quantity, system defaults to Y;’otherwise it defaults to ‘N’”
l1111↑ If you except system default (Y/N), go to Oε
32, otherwise, go to Oε31
Oε31
System defaults to “N,” type “Y,” and go to Oε32. System defaulted to
“Y,” type “N” and go to Oε32
↓11
32Oε Hit ENTER to go to the next field (Figure 5, Field 7)
Oα33 Look at the screen message
l1212↑
If screen displays a message, WORK-IN-PROCESS? (Y/N) and theanswer is “Y” go to Oε
34; otherwise, go to Oε37 (Figure 8)
Oε34 Type ’Y” hit ENTER to print out a label, and put label on the part
Oα35
Look at the label to determine which department within the plant theitem will be shipped to
l1313 1 3↑
−( ) If it goes to Department 1, go to 1Oε36 and if it goes to Department 2, go
to 2Oε36; otherwise, go to 3Oε
36
(continued)
254
Table 2 (Continued)
Member of Algorithm Description of Members of Human Algorithm
↓13 1
1 36( ) Oε Put the part in Box 1
ω ω1 1↑ Always falls logical condition (see Oα28 )
↓13 2
2 36( ) Oε Put the part in Box 2
ω ω2 2↑ Always falls logical condition (see Oα28 )
↓13 3
2 36( ) Oε Put the part in Box 3
ω ω3 3↑ Always falls logical condition (see Oα28 )
↓12
37Oα Check if there is a bin for this item
l1414↑
If the bin is not assigned for this item, go to Oε38; otherwise the system
will automatically assign the required bin, then go to Oε41
Oα38
Depending on the size, shape, and special features (“HazMat”), choosethe bin type from the list of bin types on the screen
l1515 1 10↑
( ... ) If bin is Type 1, go to 1Oε39 up to “If bin type 10,” go to 10Oε
39
↓15(1) 1
39Oε Choose the bin Type 1 (move cursor to required position and hit ENTER)
ω ω4 4↑ Always falls logical condition
•••
Choose the required bin type
↓15(10) 10
39Oε Choose the bin Type 10
↓ ωε
4 40O Hit ENTER (system will assign the available bin of the chosen type)
↓14
41Oε Hit ENTER to print the label
Oε42 Peel the label off the printer and put it on the part
Oε43 Put part in the tote
Oα44 Check if there are other items in the box to receive
l1616 1 2↑
−( ) If there are no more items to receive, go to Oε4, otherwise go to Oε
12; ifthere are no new boxes to work with, go to Oε
45
↓17 2
45( )Oε Hit F3 and go to the previous screen
Oα46 Check for presence of inventory receiving screen
↓17
47Oε Type 3 and then press ENTER to choose PRINT REPORT
Oα48 Check to see if you are at the PRINT RESEIVING REPORT screen
l1717 1 2↑
−( ) If you are at the right screen and you choose current date, go to Oε49; if
you choose a different date range (From–To) go to Oε50; if you are
at the wrong screen, go to Oε45
Oε49 Hit ENTER twice and go to Oε
51
↓17 1
50( )Oε Type the Start Date and End Date (see pattern—MM/DD/YY), hit
ENTER, and go to Oε51
Oε51
Wait for the report completion message
tions (th = thinking action category) before a decision is made. Performance of actionscomplying with these logical conditions is not altered by the improvements. Analysis ofthese logical conditions demonstrates that special training is required for efficient perfor-mance of the previously described members of the algorithm. In this case, training is notreducible to explanation and demonstration. Rather, a set of scenarios reflecting the di-verse contingencies and outcomes must be developed around lth6 in combination withmembers Oα20, Oε21, and Oε23 of the algorithm. This shows that algorithmic formulationof a task is useful for training development.
Member of algorithm Oα26 is different before and after improvement. Before im-provement, the message “PRICE DOES NOT MATCH INITIAL PRICE. Do YouWish To Proceed? (Y/N)” always emerges when the price is different than the priceon the screen (order price). After improvement, this message appears only when anew price is more than 10% over order price. This reduces the perceptual workloadduring the performance of this member of the algorithm.
Members of the algorithm Oαth27, l9, and Othµ28 (see Table 1) are performed onlybefore improvement. Taking into consideration that these members of the algo-rithm involve thinking and decision-making processes, their elimination is particu-larly potent by virtue of a reduction of task complexity. Logical condition l10 beforethe improvement (Table 1) is carried out through maintenance of information inworking memory until these logical conditions are completed. The function per-formed by a logical condition l10 before improvement (see Table 1) is performed byl9 after improvement (see Table 2). In this last case, decision making is carried outbased on exteroceptive information presented on the screen. This significantly re-duces the load on working memory and complexity of task performance in general.
Comparison of the methods of performance implicated in the evaluation of parts’price before and after improvement generally reveals that before improvement, multi-ple diverse steps including many behavioral and mental actions are required. Afterimprovement, all of these actions were eliminated. There are also differences in theperformance of logical condition l10 (before improvement) and in l9 (after improve-ment). After improvement, l9 is performed not only on the basis of exteroceptive infor-mation but also partially automated by the computer system. The message appears onthe screen only in those cases when price exceeds a threshold of 10% or more. In thiscase, the operator has a choice to answer “Yes” (Y) or “No” (N). In all other cases (priceis less, equal, or less than 10% difference), the decision is made by the computer sys-tem. Only under special cases when a worker receives an instruction from his or hersupervisor can the worker supply the answer “Yes” (Y), even when the price is morethan 10% over order price. The system does not default to “N” if the price variance ismore than 10% positive because under particular circumstances, it is possible for theworker to answer “Yes” (Y) if specific instructions are given by a supervisor. In this sit-uation, a worker can hit “ENTER” prior to conscious decision making. Decision mak-ing connected with logical condition l9 (Table 2) is only partially automated, providingfor flexibility of worker performance and his or her ability to decide what to do in anyparticular case. Moreover, this prevents mindless hitting of “ENTER.”
If a worker’s answer is “No” (N), then he transfers to Oε27, Oα28 and l10 (see Table2). The worker then progresses to a new item or a new box with another item inside.By the same token, if it branches to 1Oε29, the cursor moves to the next field and the
Systemic-Structural Activity Approach 255
worker goes to Oα30. Members of the algorithm from Oα30 to Oε32 describe theworker’s activity when he or she compared received and ordered quantities (seeTable 2). This part of the task was not altered by intervention.
The following part of the algorithm describes WIP. This part of the task was al-ready discussed previously. Consequently, the part of the algorithm that beginswith Oα38 up to Oε40 (see Table 2) will be considered. In Table 1 (before improve-ment), this part of the task is described by members of the algorithm from Oα35
through logical conditions l16. We compare these members of the algorithm withthose mentioned in Table 2.
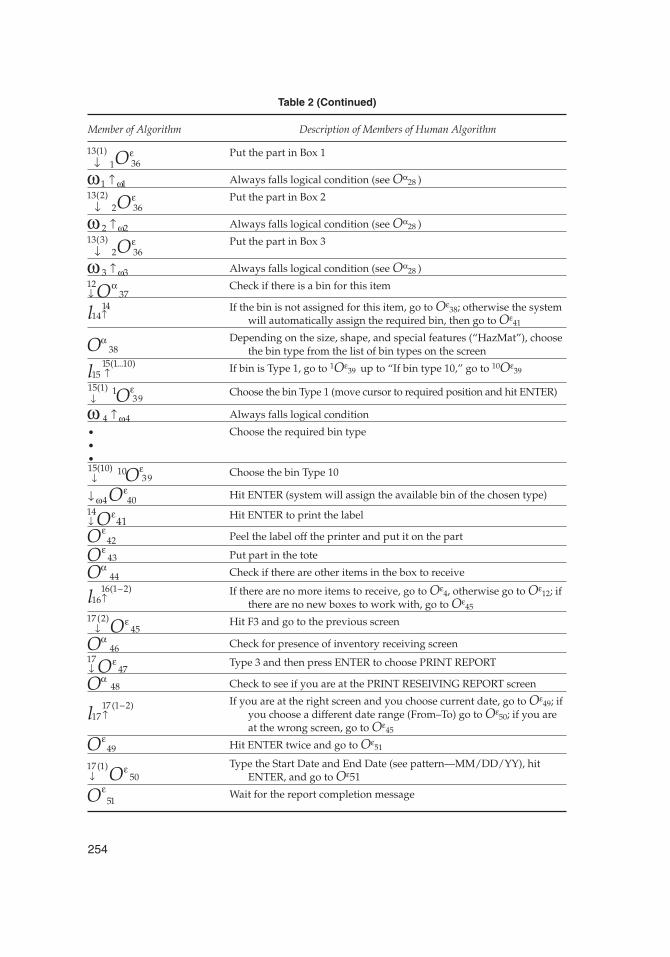
Under conditions in which the bin exists, the tasks performed before improve-ment and after improvement are the same. Before improvement, workers per-formed Oε40 following l13 (see Table 1). Workers performed it the same way afterimprovement—l14 and then Oε41 (see Table 2). However, in approximately 10% ofthe cases, bins are not assigned for particular items. Workers must categorize theitem themselves. This part of the task is treated following. Prior to improvementsand after l13, workers should perform Oµ36 (see Table 1). Symbol µ designated thesituation under which the worker must retrieve required information fromlong-term memory (“recall required bin type”; see Oµ36, Table 1) then follow lµ14.There are different bin types. Based on the information retained in working mem-ory, the worker makes a decision on which bin to select. Analysis of the previouslymentioned members of the algorithm requires workers to continually maintain inmemory required information, causing an overload on working memory. The deci-sion-making process is based not on exteroceptive information but on informationextracted from memory. This is a complicated decision-making process, which in-creases the probability of the computer system presenting a warning on the screen,“Wrong Bin Type.” To avoid the warning, monitoring and control actions Oα38
through l16 were introduced into the task algorithm, and if required, workersshould return to Oµ36 (see Table 1).
After improvement, the list of bin types is presented on the screen (see Oα38, Table2). This eliminates the necessity to retrieve information from long-term memory (in-stead of Oµ38 in Table 1, Oα38 in Table 2). Decision making is executed now on the basisof exteroceptive information presented on the screen rather than from information ex-tracted from memory. In this case, mnemonic actions are transformed into perceptualactions. This facilitates the decision-making process and reduces the probability of anerroneous decision. As a result, members of the algorithm requiring control actions forcorrection can be eliminated. Moreover, if this correction is indicated, it can be per-formed with the assistance of information regarding the bin type from the screen.
The following members of this algorithm, Oε41 through Oα48 were not affected byimprovements (see Table 2). We consider the final step of the algorithm of activity.This part of the algorithm describes those portions of the task that are involved inproducing reports. A worker may print what he or she received during 1—up toseveral—days. In most cases, reports are related to what the worker did during theday. Before improvement, workers in both cases (report during 1 day or report dur-ing several days) must key in “Start Day,” hit “ENTER” and key in “End Date” andhit “ENTER” (see Oε47, Table 1). Moreover, the computer system expects the date tobe entered in a specific way. If the keyed in date pattern does not match the datepattern in the computer system, the report will be empty. Thus, it is important to
256 Bedny and Karwowski
provide the worker the date pattern so that he knows how to present the date to thesystem. This pattern was not presented before improvement.
After improvement, if a report is produced for 1 day, the worker simply hits“ENTER” twice (see Oε49, Table 2). If a report covers several days, the worker carriesout Oε50 in Table 2, which corresponds to Oε47 in Table 1. The difference is that theworker is always presented with the required “MM/DD/YY” date pattern. This re-duces the probability of errors caused by the worker’s preferred pattern of keying indate fields. Consider also that workers produce reports for only 1 day, meaning thathe or she typically only has to hit “ENTER” twice. In general, it may be seen that thesuggested method of morphological description of activity that includes qualitativeandalgorithmicstagesofanalysis isapowerful tool tobeusedforthestudyofHCI.
Finally, we briefly discuss the cost-effectiveness of ergonomic intervention.Bedny, Karwowski, and Seglin (2001) considered this problem in a previous articlepertaining to the analysis of physical labor performed under adverse working con-ditions. Our article here describes the analysis of a computer-based task in whichthe cognitive elements of work activity are of primary importance. To quantify andevaluate the cost-effectiveness of ergonomic intervention in a computer-basedtask, the researcher must evaluate the reduction of time expenditure yielded by thefollowing ergonomic interventions:
1. Improvement in methods of presenting information on the screen.2. Reduction in overall screen number.3. Reduction in physical effort during performance of the computer based task.4. Reduction in errors during task performance and reduction in time needed
for error correction.5. Reduction in mental and physical fatigue (even in the absence of work-time
reductions, this element is important in the long term in that it decreases fre-quency of future illness and attrition in the work force).
6. Reduction in work-time of programmers involved in the design or redesignof the computer-based task (multiple redesign of the computer-based taskcan become extremely costly).
Elements 5 and 6 of a cost-effectiveness evaluation are particularly difficult toobjectively quantify. The evaluation of these elements requires data collection andstatistical comparison based on different aspects of work activity. In the examplediscussed in this study, the effectiveness of ergonomic intervention was evaluatedbased on an expert analysis, as a more detailed consideration of this topic was out-side the scope of this project.
8. DISCUSSION
Activity is a complex, multidimensional system that calls for a systemic-structuralmethod of study. In this discussion, rather than addressing a “human–machine sys-tem,” activity itself is defined as a system. Such understanding of activity does notpreclude the notion of a human–machine system or, as in our example, a hu-man–computer system. To understand activity as a system, the formulation of ba-
Systemic-Structural Activity Approach 257
sic units of activity analysis is necessary. Peculiarities of interrelations among theseelements, what whole properties of the system are provided for, and what is the hi-erarchical organization of activity, and so forth must be comprehended. This workdemonstrated the potential of this approach for HCI design.
In activity theory, a few discrepancies can be observed in some cases betweenthe general principles of systemic-structural analysis and their realization. Accord-ingly, during the past 30 years, activity theory has dedicated substantial resourcesto formulate units of analysis (Bedny, 1987; Bedny et al., 2000; Gordeeva &Zinchenko, 1982; Zarakovsky & Pavlov, 1987). These units of analysis are impor-tant for development of a systemic-structural analysis of activity.
The systemic-structural analysis of activity in HCI can be described in terms of themorphological, functional, and parametric characteristics. Central to the proposed ap-proach is the morphological method of study, with actions, operations, and membersof the algorithm as major units of analysis. Note that this study is limited to only twostages of analysis—qualitative and algorithmic. In most cases, this is sufficient. WhenHCI is considered, the interaction between these two stages is not strictly sequentialbut iterative. Atransition from one stage to another requires additional information re-garding activity as an object of the study. It is possible to revisit preliminary stages ofanalysis with the advantage of additional insights obtained at the earlier stages.
In the description of a computer-based task with multiple approaches to satisfy thestated goals, probabilistic rather than deterministic methods for algorithmic descriptioncan be used. Many logical conditions have more than two outputs with different proba-bilities. Each member of an algorithm emerges as a subsystem of activity for examina-tion. This is particularly important in the study of HCI because HCI typically allowsmultiple approaches and is intangible in much of its actions. Consequently, such activitycannot be not readily observed or described systematically. Computer users are often ata loss to describe their preferences and requirements. In such circumstances, program-mers try to develop programs in the absence of an adequate comprehension of userneeds. Users frequently formulate new needs or requirements on the fly. Moreover, afterevaluating new systems, users often change their opinions. If the data have to bechanged, not only the program at hand but other related programs may have to be up-dated as well. In most cases, testing of the systems must be redone. Software design be-comes a blind trial-and-error process. The original design may have to be redesignedmultiple times. To reduce the unnecessary intermittent steps, anticipation of the userneeds through elaborate description of the computer-based task is vital.
The approach we proposed in this article can be very useful in eliciting from theprospective or actual users a precise description of their own criteria of perfor-mance. It also becomes possible to evaluate the efficiency of a computer-based taskat earlier stages of design performance. The intermittent stages of design canthereby be significantly reduced, and design cycle times may be shortened.
Finally, we briefly compare the GOMS (goals, operators, method, selection)method (Card, Moran, & Newell, 1983) and SSTA. The two approaches are similar inthat they both attempt to describe human activity on a computer-based task in an al-gorithmic or quasi-algorithmic manner. However, GOMS and SSTA differ in theirmethods for creating these descriptions. In SSTA, the algorithmic description of ac-tivity, although important, is not the only step in the analysis of activity. Rather, thealgorithmic description stage is closely interrelated with other stages of the sys-
258 Bedny and Karwowski
temic-structural analysis. According to the GOMS approach, the algorithm of perfor-mance resembles a computer algorithm. In activity theory, one employs the conceptof the human algorithm. The most important distinguishing feature of the human al-gorithm is the fact that the basic units of analysis are the cognitive/motor actions.
Within SSTA, researchers have developed methods for the extraction of different ac-tions from the holistic process of activity. These actions are then classified according toprincipals defined by activity theory. SSTA proposes a hierarchical system of analysisunits: operator, action, operation, and function block. These analysis units form a uni-fied system, which allows for a standardized description of holistic activity. Any actiondirected to achieve a conscious intermediate goal should be distinguished from the fi-nal goal of a task. All actions have a loop structure. The starting point of any action isthe moment when the goal is formulated or accepted. The endpoint of the action is themoment when the results of the action are evaluated. This permits a continuing flow ofactivity divided into individual units. Actions are considered as dynamic units thatcan be integrated into more complex actions or decomposed into smaller ones. Thisprocess depends on the complexity of the task and on the past experience of the per-former. In SSTA, one can differentiate two kinds of units of analysis. One is called “typ-ical elements of tasks” or “technological units,” and the other is called “typical ele-ments of activity” or “psychological units.” The latter ones are standardized units ofactivity. Technological units can be transformed into psychological units at later stagesof analysis. GOMS lacks strictly defined and unified units of analysis.
In SSTA, one can also distinguish deterministic and probabilistic algorithms thatcan be described in a symbolic manner. GOMS method does not consider these as-pects of algorithmic description of activity. In view of SSTA, an activity is a multidi-mensional system that requires multiple approaches to the description of a singleobject and different stages of analysis. The distinctiveness of this analysis is that di-verse descriptions of the same object must be interdependent and supplementary,enabling researchers to obtain a holistic picture of the object of study that capturevarious aspects of activity structure. In turn, the description of the structure of ac-tivity is compared with the physical and symbolic structure of the equipment. TheGOMS method does not have standardized and interdependent stages of analysis.
SSTA, with its units of analysis, systemic-structural principles of human activityconsidered as a multidimensional system, and theoretically elaborated terminol-ogy, may be very useful in the study of HCI. However, although the SSTA wasmainly developed as a psychological theory, it is not limited to the study of HCIonly. This theory can be applied to study of different kinds of human work, includ-ing training and education in general.
REFERENCES
Bannon, L., & Bodker, S. (1991). Beyond the interface: Encountering artifacts in use. In J.Carrol (Ed.), Designing interaction: Psychology of human computer interface (pp. 227–253).Cambridge, England: Cambridge University Press.
Bedny, G. Z. (1987). The psychological foundations of analyzing and design work processes. Kiev,Ukraine: Higher Educational Publishers.
Bedny, G. Z. (2000). Activity theory. In W. Karwowski (Ed.), International encyclopedia of ergo-nomics and human factors (Vol. 1, pp. 358–362). London: Taylor & Francis.
Systemic-Structural Activity Approach 259
Bedny, G. Z., & Karwowski, W. (2000). Theoretical and experimental approaches in ergonomicdesign: Towards a unified theory of ergonomic design. Proceedings of the XIVth Triennial IEACongress, and the 44th Annual Meeting of The Human Factors and Ergonomics Society, 5, 197–200.
Bedny, G., Karwowski, W., & Bedny, M. (2001). The principle of unity of cognition and be-havior: Implications of activity theory for the study of human work. International Journalof Cognitive Ergonomics, 4, 401–420.
Bedny, G. Z., Karwowski, W., & Jeng, O.-J. (2001). Activity theory as a framework to studyhuman–computer interaction. International Conference on Computer-Aided Ergonomics andSafety, Maui, Hawaii, 1–4.
Bedny, G. Z., Karwowski, W., & Kwon, Y.-G. (2001). A methodology for systemic-structuralanalysis and design of manual-based manufacturing operations. Human Factors and Ergo-nomics in Manufacturing, 11, 233–253.
Bedny, G. Z., Karwowski, W., & Seglin, M. (2001). A heart rate evaluation approach to deter-mine cost-effectiveness an ergonomics interventions. International Journal of OccupationalSafety and Ergonomics, 2, 121–133.
Bedny, G. Z., & Meister, D. (1997). The Russian theory of activity: Current applications to design-ing and learning. Mahwah, NJ: Lawrence Erlbaum Associates, Inc.
Bedny, G. Z., & Meister, D. (1999). Theory of activity and situation awareness. InternationalJournal of Cognitive Ergonomics, 1, 63–72.
Bedny, G. Z., & Seglin, M. H. (1999). Individual style of activity and adaptation to standardperformance requirements. Human Performance, 1, 59–78.
Bedny, G. Z., Seglin, M. H., & Meister, D. (2000). Activity theory: History, research and appli-cation. Theoretical Issues in Ergonomics Science, 2, 168–206.
Brushlinsky, A. V. (1979). Thinking and forecasting. Moscow: Science Publishers.Card, S. K., Moran, T. P., & Newell, A. (1983). The psychology of human–computer interaction.
Hillsdale, NJ: Lawrence Erlbaum Associates, Inc.Decortis, F. (2000). Activity theory, cognitive ergonomics and distributed cognition: Three
views of a transport company. International Journal of Human–Computer Studies, 53, 5–33.Engestrom, Y., Miettinen, R., & Punamaki, R.-L. (1999). Perspectives on activity theory. New
York: Cambridge University Press.Gordeeva, N. D., & Zinchenko, V. P. (1982). Functional structure of actions. Moscow: Moscow
University Publishers.Hacker, W. (1985). Activity: Afruitful concept in industrial psychology. In M. Frese & J. Sabini
(Eds.), Goal-directed behavior: The concept of action in psychology (pp. 81–98). Hillsdale, NJ:Lawrence Erlbaum Associates, Inc.
Kuutti, K. (1996). Activity theory as a potential framework for human–computer interac-tions. In B. A. Nardi (Ed.), Context and consciousness: Activity theory and human–computerinteraction (pp. 17–44). Cambridge, MA: MIT Press.
Leont’ev, A. N. (1977). Activity, consciousness and personality. Moscow: Political Publishers.Nardi, B. A. (Ed.). (1997). Context and consciousness: Activity theory and human–computer inter-
action. Cambridge, MA: MIT Press.Rubinshtein, S. L. (1973). Problems of general psychology. Moscow: Academic Science.Volpert, W. (1982). The model of the hierarchical-sequential organization of actions. In W.
Hacker, W. Volpert, & M. Cranach (Eds.), Cognitive and motivational aspects of action. Berlin,Germany: Huthing Velagsgemeinschaft GmbH.
Vygotsky, L. S. (1978). Mind in society. The development of higher psychological processes. Cam-bridge, MA: Harvard University Press.
Zarakovsky, G. M., Korolev, B. A., Medvedev, V. I., & Shlain, P. Y. (1974). Introduction to ergo-nomics. Moscow: Soviet Radio.
Zarakovsky, G. M., & Pavlov, V. V. (1987). Laws of functioning of man–machine systems. Mos-cow: Science Publishers.
260 Bedny and Karwowski